.pdf,.jpg,.eps
High-Throughput Mechanical Characterization of Giant Unilamellar Vesicles by Real-Time Deformability Cytometry
Abstract
Real-time deformability cytometry (RT-DC) enables high-throughput, contact-free mechanical characterization of giant unilamellar vesicles (GUVs). However, the interpretation of vesicle deformation under flow has been hindered by the absence of a suitable theoretical or computational framework. Here, we present a simulation-based model that describes GUV deformation in RT-DC, taking into account the surface dilational elastic modulus as the dominant mechanical parameter. Using phase-field simulations over a wide parameter space, we find GUV deformation to depend linearly on GUV area. Based on these results, we derive two complementary fitting strategies for extracting the surface dilational modulus from RT-DC data: a direct model-based fit for single-vesicle characterization and a noise-resistant collective approach that enables robust population-level estimates. Furthermore, we introduce a combined fitting method that integrates both approaches to filter outliers and improve accuracy in heterogeneous or noisy datasets. All methods scale across varying flow rates, channel geometries and buffer viscosities, and produce predictions of consistent with literature values for different lipid compositions. Compared to traditional techniques such as micropipette aspiration, our approach offers orders of magnitude higher throughput without mechanical contact, making it particularly suitable for GUV population studies. Beyond mechanical phenotyping, this framework opens new avenues for sorting vesicle populations based on membrane mechanics, a capability of growing interest in synthetic biology and soft matter research.
Keywords: RT-DC, membrane mechanics, vesicle elasticity, phase-field simulation
1 Introduction
Giant unilamellar vesicles (GUVs) serve as versatile model membrane systems in biophysical research for studying biological processes such as lipid phase separation [27], membrane fusion [8] and protein-lipid interactions [31, 24]. In addition, GUVs are used in biomedical applications such as targeted drug delivery [4] or synthetic cell design [25]. Their versatility stems from their cell-mimicking size (diameter ), which allows for direct observation of the membrane responses to external factors such as ions, molecules, or hydrodynamic flows under a microscope [7]. In addition, GUVs share many structural similarities with cellular membranes, while providing precise control over factors such as membrane composition, mechanics and functionality [31, 15, 7, 3].
Mechanical parameters, including deformability, elasticity, and membrane tension are fundamental factors influencing the behavior of GUVs and their various applications. These properties govern how the vesicles undergo dynamic shape changes, maintain structural integrity under external forces, and respond to environmental stresses. At the same time, the mechanical parameters are closely linked to the vesicle composition and are particularly influenced by factors such as lipid types, bilayer thickness and the presence of proteins [20, 23]. The mechanical properties of cells, on the other hand, are often attributed to their cytoskeleton rather than the membrane itself. GUVs, in presence and absence of cytoskeletal elements, provide the unique opportunity to decouple these effects [9].
However, determining mechanical parameters of GUVs experimentally remains challenging and time consuming. For example, micropipette aspiration experiments [20], response measurements to compression between parallel plates [22] or indentation with a conical AFM-tip [23] have been used to measure the elastic behaviour of GUVs. A common limitation of these methods is their relatively slow throughput, as they typically allow for the characterization of only one vesicle at a time.
Microfluidic deformability cytometry offers rapid characterization of thousands of GUVs within minutes, potentially enabling ultra-fast screening of large vesicle populations.
One advanced method is real-time deformability cytometry (RT-DC), which provides high-throughput, real-time measurements by subjecting the vesicles to controlled flow forces within a microfluidic channel [18]. As the vesicles traverse the channel, their deformation can be measured and analyzed to quantify the mechanical parameters of GUVs such as elasticity and membrane tension. As an added advantage, the GUVs are not in contact with surfaces during the measurement, which, depending on the type of surface interaction can strongly influence the measurement and make the comparison of different conditions challenging.
Predictions of mechanical properties in RT-DC rely on matching experimentally observed cell deformation with theoretical models. For cells, such theoretical models exist and have been used extensively with RT-DC to study the mechanical properties of cells, allowing rapid phenotyping and mechanical profiling [13, 14, 18, 21, 10, 30, 29].
These models consider elastic and viscoelastic materials and are able to link shape deformation with concrete elastic moduli. However, all models consider either volumetric structures (i.e. solid bodies) or elastic shells. Lipid vesicle membranes are neither and hence cannot be evaluated with the current models.
Here, we provide a theoretical method to describe GUV deformation and to measure lipid elastic properties in an ultrafast manner in RT-DC. To this end, we present first numerical simulation results of fluid vesicles in RT-DC channels. To eliminate the influence of experimental noise we introduce a new fitting algorithm which allows real-time extraction of the dilational modulus of a vesicle sample despite errors in the imaging data. Finally, we illustrate the generality of the approach to deliver accurate estimates when using RT-DC setups of arbitrary flow rates, channel sizes and buffer viscosities.
2 Results
2.1 Deformation of a GUV in a microfluidic channel
Lipid vesicles like GUVs are fluid filled compartments with a bilayer of densely packed lipid molecules at their surface. The lipid molecules (in the liquid disordered state) can freely move in the tangential direction along the surface, which implies a vanishing surface shear modulus. On the other hand, the lipid layer resists bending, areal compression and stretching. It has been shown that the stiffness against bending deformations is negligible in RT-DC measurements due to the large forces exerted [14]. However, the layer’s resistance to compression and stretching contributes significantly. The corresponding surface dilational modulus is hence the dominant mechanical parameter and the only determinant of vesicle shapes.
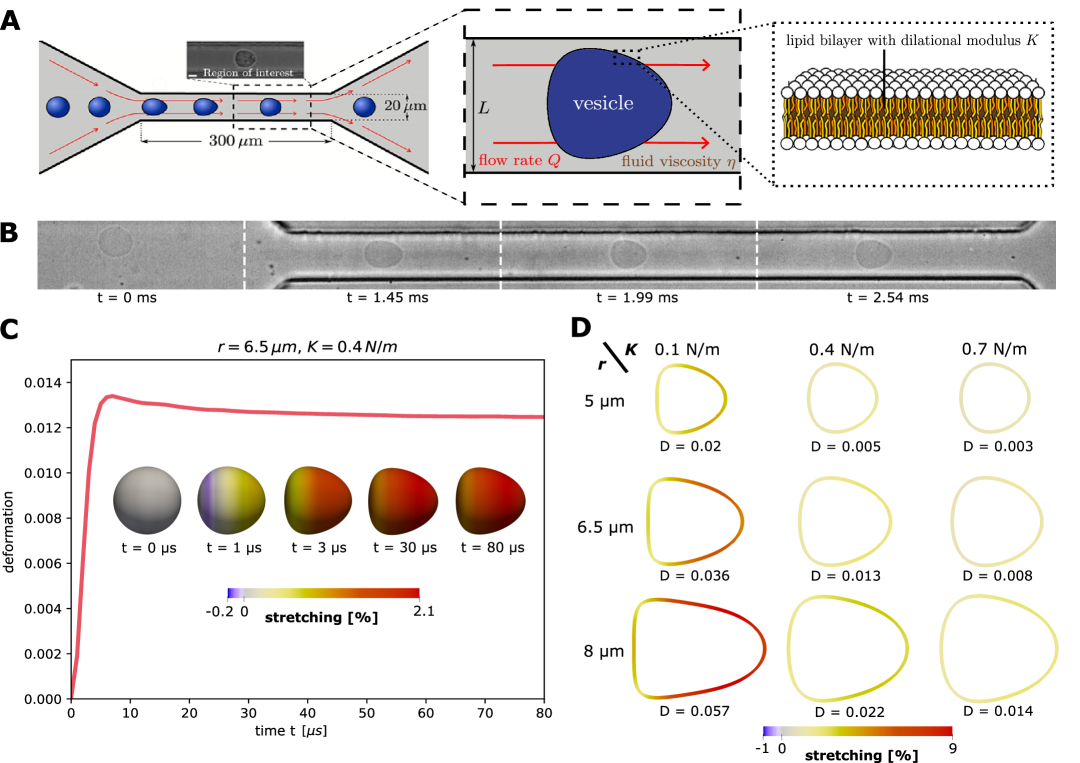
To extract from RT-DC image data, we simulate GUV deformation in dependence of . We therefore model an initially spherical GUV with radius immersed in a buffer liquid of viscosity , within an RT-DC channel with a square-shaped cross-section of side length , see Fig. 1A. A flow rate is imposed to set the GUV in motion, such that it subsequently deforms by pressure and shear forces until it assumes a stationary state. The full numerical method is based on a phase-field method presented in [11], with more details to be found in the methods section 4.1. The used simulations parameters () can be scaled to generalize results to arbitrary (see Sec. 2.2).
Fig. 1C shows an exemplary evolution of GUV deformation. The initially spherical surface is stretched (and transiently compressed) due to pressure and shear forces until the vesicle reaches a stationary bullet-shape, similar to the shapes observed for RT-DC measurements of GUVs (see Fig. 1B) or cells [14]. To quantify deformation we use the measure
| (1) |
where denotes the area and the perimeter of the two-dimensional image of the GUV shape, as it would be seen by a camera. Note that for a circle and for any other shape. Note that the GUV relaxes back to its spherical shape once it leaves the channel. Along with the time evolution of , we illustrate the relative local stretching of the GUV surface, , with being the area of a surface element in the current configuration and the area of this element at the initial time. Hence, stretch values and correspond to stretching and compression of the surface, respectively, see Fig. 1C.
An illustration of the stationary deformation shows that larger and softer GUVs are more stretched, while smaller GUVs with higher remain close to spherical (Fig. 1D). The maximum stretching is observed at the lateral front of the vesicle and reaches up to 9% for , . This is approximately in the range of stretching tolerated by lipid bilayers, which is typically limited to a few percents (on the order of [17, 12]) depending on the lipid type.
2.2 Dependence on elastic modulus
The goal of this work is to describe the GUV deformation according to its mechanical properties, i. e. the elastic modulus , for a given sample of GUVs from RT-DC experiments. The elastic behaviour of lipid bilayers differs strongly depending on the lipid compositions, with values ranging from (for DOPC vesicles) to (for SM/Chol vesicles) [20].
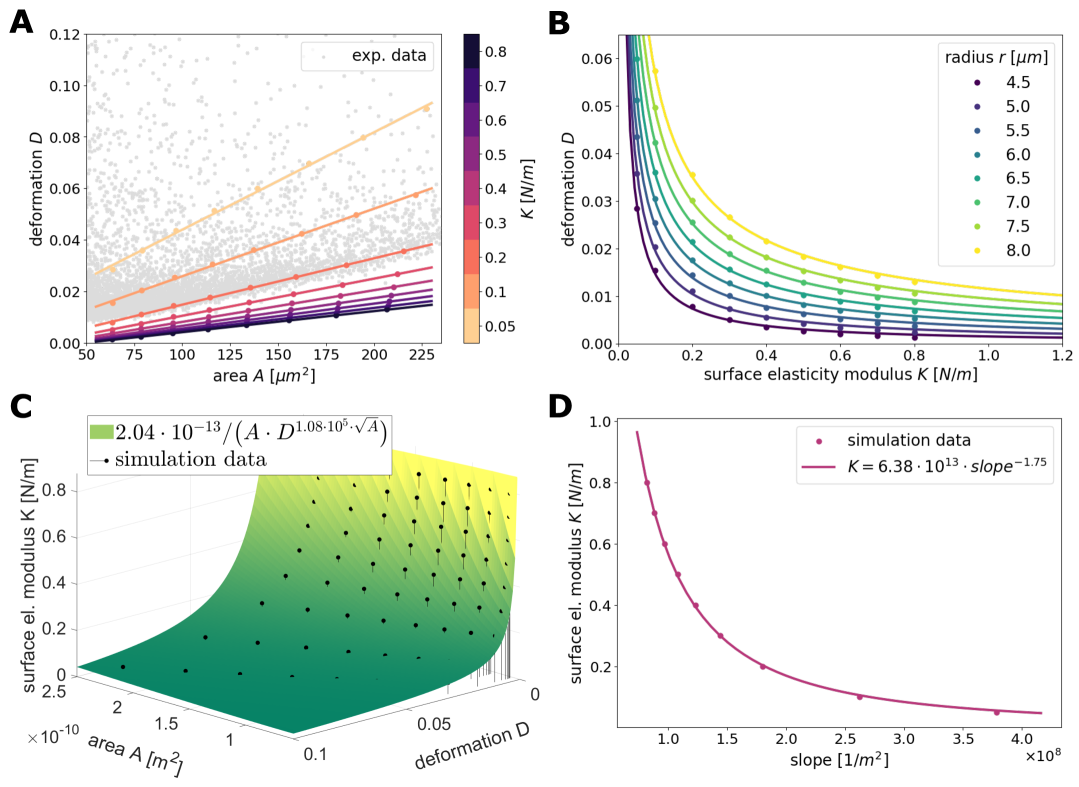
Performing simulations for a wide range of elastic moduli and GUV sizes, we find that the deformation in the stationary state depends almost linearly on the GUV size, see Fig. 2A. Linear fits through the simulation data are included to further confirm this observation. Furthermore, an exemplary set of experimentally gathered RT-DC measurements of GUVs is depicted, showing an almost linear relation between and for the majority of the data as well. We note that the almost linear relation differs significantly from RT-DC results which modeled the deformation of volumetric elastic bodies [14] or elastic shells [14, 11] instead of fluid vesicle surfaces. The dependency between and can be well described by a power law , Fig. 2B. The good agreement of fits and simulation data is confirmed by the coefficient of determination for all curves. Using these fitted functions now allows for extrapolations outside of the used parameter range, s. t. also vesicles with smaller or larger expected values of can be treated.
Moreover, the quasi-stationary state of the GUVs is determined by only one non-dimensional parameter [13]. Hence, analogously to the numerical model presented in [14] our computed results (see Fig. 2A) can be transformed to other flow rates, fluid viscosities and channel sizes. More precisely, a change of the parameters from to the values can be realized by simply rescaling the surface elastic modulus with factor and rescaling the vesicle area with a factor .
2.2.1 Direct fitting
Combining both observed dependencies from Fig. 2(A+B), we postulate the following fitting function to describe an explicit relationship between , and :
| (2) |
The four unknowns are obtained by a least squares fit with the simulation data (i.e. minimizing the squared difference between from Eq. 2 and from the simulation). We obtain an optimal fit for , , , . As mentioned before, the formula can be extended to experimental parameters which differ from the ones used in our simulations (, , ) by scaling the ansatz function with . We obtain the final formula
| (3) |
with dimensionless quantities , .
Eq. 3 now allows to extract the surface elastic modulus directly for each vesicle imaged in RT-DC. The formula is valid for any flow rate, any medium viscosity, and any channel size, as long as the deformation and the relative area are fairly in the range of the here presented simulations ().
Fig. 2C shows that the fitting function describes the data quite well with a coefficient of determination of and a sum of squared residuals of . However, this direct fitting approach to determine is very sensitive to noise in experimental data. Therefore we will introduce a second fitting method which is more robust to noise in the following section.
2.2.2 Noise independent collective fitting
In the following we introduce a noise-robust collective fitting approach which uses the collective data of a whole set of GUVs rather than extracting the elasticity of each single vesicle. Measurements of the deformation in the RT-DC setup are bound to a low resolution of high-speed camera images and their sensitivity to noise. This leads to small imperfections (pixelation) of the vesicle contour. While the influence of these imperfections cancels out for the determined area , they accumulate in the measured perimeter length of the GUV, thereby increasing by a small factor . Consequently the measured can be expected to contain a relative (multiplicative) error, which we will account for with the following collective fitting approach. Making the ansatz
with a pertubation , we can expand Eq. 1 to linear order in and obtain
assuming that the GUV shape is close to spherical (). Hence, we find that RT-DC measurements mostly contain an additive error (here ) in the deformation. This suggests that the experimental curves include the ground truth data plus a randomly distributed deformation offset. To eliminate this random effect we consider another fitting procedure. Knowing that the theoretical deformation depends linearly on (cf. Fig. 2A), but contains an additional offset, motivates a linear fit through the measured experimental data, with two parameters , :
| (4) |
where largely contains these random offsets (averaged over the data set) and hence includes all the stochasticity which stems from noise in . As a result, the fit parameter is robust and independent of this noise. As gives the slope (of with respect to ) of the linear fitting curve, it means that this slope contains all the information about . Consequently we determine the relationship between and the slope of the deformation-area curves displayed in Fig. 2A.
We find that the power law
| (5) |
gives a very good fit () with N , , see Fig. 2D. As before, we can rescale Eq. 5 on the basis of a dimensional analysis. Since the slope rescales as the inverse area with factor we get the formula
| (6) |
with the dimensionless factor .
With Eq. 6 we can directly infer from the entire given experimental data set by simply evaluating the slope of a linear fit through the data. Analogously to Eq. 3, Eq. 6 is universal and can be used for arbitrary flow rates, buffer viscosities and channel sizes as long as the obtained slopes and relative vesicle areas () remain in the range performed in this study.
2.3 Extraction of dilational elasticity from experimental data
Next, we compared our results to experimental data. RT-DC was carried out by flushing electroformed GUVs through a standard RT-DC chip with a 20 µm crossection. GUVs were imaged using high-speed brightfield microscopy and their contour was detected. Considering the imaged area and the perimeter of the contour, the deformation of the GUVs, as a typical output of RT-DC measurements, was calculated using Eq. 1 and plotted against the GUV area.
2.3.1 Combined fitting for noise independent, filtered predictions
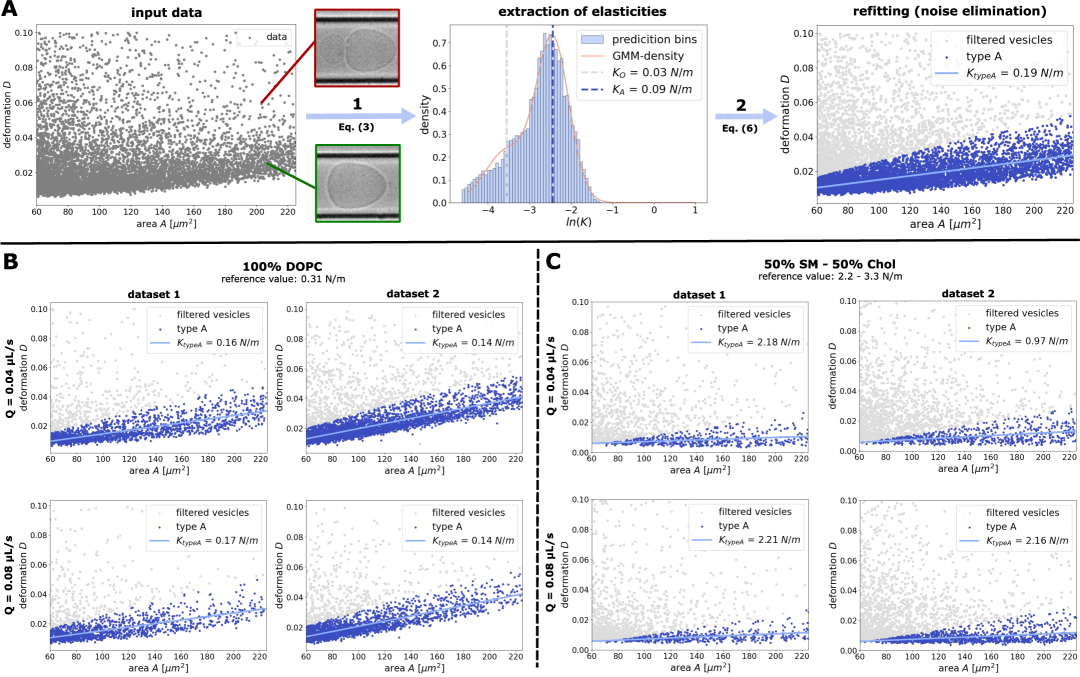
Within the gathered experimental data, outliers are observed and expected (e.g. damaged GUVs, lipid junk, GUVs that interact with the channel surface). Those can exhibit strong deformations outside of the expected data range, see Fig. 3A (left).
A reliable way of filtering the given data for these outliers can be constructed from function (3). Using this direct fitting we can estimate the mechanical properties of each measured vesicle. These estimates can then be used to compute a probability density function (PDF) for the elasticity modulus , showing distinct values of correctly and incorrectly detected data, see Fig. 3A (middle). Assuming that the data set contains two different types of events (usable GUVs and unreliable outliers), we can use the acquired PDF to classify each data point. To describe the distribution of the data around the two classes we use a mixture of two log-normal distributions and assume with mixture weights and . Note that we use a logarithmic scale for the elastic moduli predictions to visualize variations of the mechanical behaviour properly, see Fig. 3A (middle).
The classification of any sample data point is done by computing the posterior probability for each component of the Gaussian mixture in the sample and choosing the most probable component (= maximum a posteriori estimate). Hence, the given data set is divided into two clusters. The cluster with the lower elasticity (inferred from higher deformations) is marked as outliers and eliminated from the further analysis. Finally, applying the collective fitting method to the remaining data points gives a noise independent prediction of the elastic modulus of the vesicles, see Fig. 3A (right). In the exemplary scheme shown in Fig. 3A a data set of pure DOPC vesicles was used. The obtained modulus is roughly comparable to literature values [20], despite being measured at high throughput.
Note that the described clustering process can also be used for analyzing mixed sets of different vesicle types, as we will show in Sec. 2.4. In this case, one simply uses a mixture of Gaussian distributions to take also the outliers into account.
2.3.2 Extraction for different lipid compositions
We illustrate the power of collective fitting with supplementary filtering step for different lipid compositions in the following. It is known that the lipid composition influences , however literature values vary. RT-DC would be the first high-throughput method to measure of vesicle populations.
First we analyzed different data sets of DOPC vesicles for a flow rate of and a corresponding buffer viscosity , which was estimated using the buyukurganci-2022 model [5] for a MC-PBS solution (CellCarrier B) and a mean temperature of C. Following [20], we expected a value of for the elastic modulus. We restricted the experimental data to the range of our simulation data, i. e. we just considered data points for and .
Following the combined fitting procedure from Sec. 2.3.1, we computed a linear fit through the filtered data and computed its slope for two independently measured data sets. Using Eq. (6) we directly computed the elastic moduli ( and ), see Fig. 3B (top row). The two predictions both underestimate the expected reference value () derived from micropipette aspiration [20]. This discrepancy may be attributed to the fact that, in contrast to the controlled membrane tension environment used in aspiration experiments, GUVs in RT-DC are not initially subjected to a defined and consistent prestress. As a result, small fluctuations and excess area, common in GUVs [2], must be smoothed out first, leading to an initial deformation response that does not reflect the true elastic stretching of the lipid bilayer. Consequently, the effective stiffness that is deduced from RT-DC experiments tends to underestimate the intrinsic area expansion modulus of the membrane.
As mentioned before, our equations are universal and can be used for arbitrary flow rates, buffer viscosities and channel sizes as long as the used parameters remain in the range performed in this study. To illustrate the independence of the extracted elastic moduli from the used experimental setting, we performed measurements with doubled flow rate (). The usage of different flow rates also influences the viscosity of the surrounding fluid due to shear thinning. To account for this, we computed the effective viscosity using again the model from [5] and obtained for a flow rate of at a mean temperature of C. .
Fig. 3B (bottom row) shows two data sets of DOPC vesicles measured at the higher flow rate. The extracted values of are and , showing a perfect agreement with the extracted values for the lower flow rate.
In a second set of experiments we studied SM-Chol vesicles (1:1 mixture). These vesicles are known to be much stiffer then DOPC vesicles with an expected value for in the range [20], depending on the temperature. Again we extracted the surface elastic modulus for multiple data sets at the two flow rates and , see Fig. 3C.
The extracted values for are in the range of , which is roughly comparable to the literature values for temperatures of C [20]. Since in our experiments a mean temperature of C was present we would assume slightly higher values of . But as explained before, it is expected to underestimate the values obtained from aspiration experiments when using a high-throughput method as RT-DC. The lower value of for SM-Chol dataset 2 might also stem from inaccuracies in the used channel geometry. All computations were done assuming an exact channel width of . But even small deviations in can influence the results significantly, since , , and the inverse slope, each scale quadratically with . Deviations in the channel width are expected from its manufacturing process ( according to the manufacturer). Assuming a deviation of just , so for example , would roughly double the prediction from to , agreeing much better with the predictions for the other datasets. Note that we estimated the effective viscosities for all our calculations using the experimentally established model from [5] assuming CellCarrier B (Zellmechanik Dresden) as a buffer medium. The slight dilution of CellCarrier B used in our experimental setup (Sec. 4.4) tends to marginally influence fluid viscosity, but has only a negligible effect on the predicted .
2.4 Analyzing mixed sets of differently composed vesicles
The previous examples illustrate that we can extract the surface dilational modulus for a given set of identical GUVs using the collective fitting with a supplementary filtering step. In the following, we will apply the combined fitting method to classify and identify mixed sets of different GUVs.
We consider a data set consisting of randomly selected samples from a given DOPC set as well as samples from a set of binary composed SM-Chol-vesicles measured at the same flow rate with areas in the range and deformations . Fig. 4 (top left) shows the merged data set. As can be seen from the plot, the data is spread across the whole domain, while forming two distinguishable clusters as well as an amount of outliers. This suggests a mixture of (at least) two different types of GUVs within the data.
The composition of the lipid bilayers is assumed to be unknown in this example. Instead we will distinguish the given data by the actual mechanical behaviour. This is again done by applying the direct fitting method using function (3), giving an estimate for the surface dilational modulus for any vesicle in the given data set. Visualizing all estimates in a histogram (see Fig. 4 (top right)) illustrates that the data (indeed) consists of at least two different types of vesicles. Note that the predictions are again plotted on a logarithmic scale to visualize variations properly. Following the ideas from Sec. 2.3.1 while assuming three classes (type A, type B, outliers O) within our data, we use a mixture of three Gaussian distributions to classify the distribution of the data, i. e.
For the computed histogram we get a Gaussian mixture distribution with mean values , and and corresponding standard deviations of , and respectively. Also the mixture weights are , and .
In a second step, we use these results to classify the given data to any of the three classes based on the probability distribution and apply again collective fitting to eliminate noise within the data and to get more precise -predictions for the data set.
Fig. 4 (bottom left) shows the data set after classification and filtering for outliers. Also we applied collective fitting for both vesicle types. For type A we get an estimate of . For the vesicles of type B we get an estimate of .
Finally, since the vesicle compositions of the given data are known, we can compare in a third step the estimates of our fitting methods with the ground truth. Fig. 4 (bottom right) shows the merged data set with DOPC-vesicles (colored in red) and SM-Chol-vesicles (colored in blue) and their respective reference values for [20].
Firstly, we observe that the direct fitting with function (3) in step one gives clearly distinguishable estimates for . This suggests that function (3), despite its sensitivity to noise, can be used to indicate the presence of different types of GUVs in a data set and even help to distinguish them by their estimates of the surface dilational modulus.
Despite possible misclassification of some of the GUVs due to their similar measured behavior, we get reasonable predictions for both DOPC- ( vs. ) and SM-Chol-vesicles ( vs. ).
This example illustrates that the combined fitting approach can also be applied to detect the presence of different types of GUVs within a data sets and extract the corresponding elastic moduli.

3 Conclusion
Here, we introduced a model to describe the deformation of GUVs during contact-free high-throughput microfluidic characterization of GUVs with real-time deformability cytometry. To this end, we provided first numerical simulation results of GUVs in RT-DC. Including the dilational elasticity of the vesicle surface as the dominant mechanical element, we find that vesicles assume a stationary bullet shape, akin to experimentally observed shapes of cells. Interestingly, we find that cell deformation depends linearly on the imaged cell area in the considered regime, with a slope that depends on the dilational modulus . Based on simulation results for a large number of parameter combinations, we developed fitting functions to extract . Combined with experimental measurements of various vesicle types, we showed that our results enable reasonable predictions of for arbitrary flow rates, buffer viscosities and channel sizes, even compensating noise.
The direct fitting approach (Sec. 2.2.1) enables -predictions for single vesicles from imaging their deformation and size. While this approach often underestimates the surface elastic modulus for noisy image data, it can be used to filter for outliers in wide spread data (see Sec. 2.3.2) or classify different types of vesicles in a mixed data set, as shown in Sec. 2.4, as long as the vesicles are distinguishable by their mechanical behaviour.
To obtain more accurate estimates, we introduced the collective fitting method (Sec. 2.2.2) which yields the averaged dilational modulus for the whole data set. It works well for noisy image data as it combines information of a whole collective of vesicle deformations to eliminate noise effects in the measured vesicle contours.
The presence of outliers within the experimental data still influences the results of the collective fitting method. To eliminate the influence of these outliers, we introduced the combined fitting method (see Sec. 2.3.1). It combines the advantages of both fitting methods leading to more reliable predictions, as shown in Sec. 2.3.2. Also, we showed the applicability of this method for mixed sets of differently composed vesicles (see Sec. 2.4).
All fitting approaches are presented here such that they scale for arbitrary experimental settings, i. e. arbitrary flow rates, channel sizes and buffer viscosities.
Compared to micropipette aspiration, RT-DC tends to slightly underestimate the dilational modulus due to the absence of a controlled membrane tension environment. Nevertheless, RT-DC reproduces the mechanical properties of vesicles reasonably well and provides significantly higher throughput in a contact-free manner. Therefore, we believe that it is particularly suited for GUV population analysis. RT-DC provides additional information, like GUV numbers and size distributions which are useful for downstream experiments. For synthetic cell research and beyond, it will become exciting to sort GUVs dependent on their mechanical properties which would lie within the capabilities of the existing RT-DC method.
4 Methods
4.1 Numerical simulations
In the presented simulations a single initially spherical vesicle with radius and surface dilational modulus is placed in the middle of a cylindrical channel with radius . Note that, based on the concept of equivalent channel radii [13] this setting equally describes the flow trough a square channel with width , which is typical for RT-DC settings. It is sufficient to consider only a small part of the channel as the simulation domain and simply move the domain w. r. t. the vesicle movement. The computational domain is prescribed to move with the vesicle barycenter to well resolve the flows and forces around the vesicle at all times. In this case, as shown in [14] a channel length of is enough to not influence the vesicle deformation. Accordingly, the computational domain is chosen .
The mathematical model is based on a phase field description of elastic surfaces in fluid flow developed in [11]. The resulting system is discretized using a semi-implicit Euler scheme in time and a Finite-Element-scheme in space (see [11, Sec. 4]). The timestep size is chosen as . The grid size is approximately in the fluid phases, while we use an adaptive refinement strategy to ensure a sufficient smooth resolution of the used phase-field function (by at least five grid points at any time around the interface) to describe the vesicle membrane.
The laminar flow with magnitude is induced through appropriate Dirichlet boundary conditions for the velocity field v. This ensures the typical flow rate . No slip boundary conditions are imposed on the channel wall as well. In the simulations the densities and viscosities within the vesicles as well as in the surrounding fluid are set equally as and . Note, that stationary results are independent of the viscosity of the vesicles’s interior since there is (almost) no internal flow in the stationary state.
4.2 Fitting procedure
Throughout this work we used multiple function fits to describe different relationships within the simulation and experimental data. Each fitting problem is formulated as an unconstrained Least-Squares optimization problem and solved based on the Levenberg–Marquardt algorithm (LMA, [16]), which is a standard solver in many software packages. In case of the one-dimensional function fits, e. g. the relation between and the slope of the simulation curves, we directly used the computed parameters. For the two-dimensional fit based on Eq. 2 we used a two-stepped fitting procedure to reduce the complexity of the problem while maintaining the accuracy of the solution. It turned out, that fixing the parameters and gives as good results as solving for four unknowns, which led to the more elegant function (3).
4.3 GUV preparation
Giant unilamellar vesicles (GUVs) composed of 100% 18:1 ( 9-Cis) PC (DOPC), or 50% 18:0 SM (d18:1/18:0)(SM) and 50% Chol (Avanti Polar Lipids) were prepared via electroformation as described in [1], using a Vesicle Prep Pro (Nanion Technologies GmbH). In brief, 40 µl of the lipid mixture dissolved at 5 mM in chloroform were spread on the conductive side of an indium tin oxide (ITO) coated glass slide (Visiontek Systems Ltd) and dried under vacuum for 15 min. Using vacuum grease (Carl Roth), a rubber ring was placed on top of the lipid coated slide. The ring was filled with 275 µl of a 320 mM sucrose solution (Sigma-Aldrich) and a second ITO slide was used to create a closed chamber with the conductive side facing downward. Next, the electrodes of the Vesicle Prep Pro were connected to the conductive side of the ITO slides and the Standard program was started, generating an AC field of 3V at 5Hz for 2h. The temperature was set to 70 °C for GUVs containing SM and to 37 °C for GUVs containing DOPC.
4.4 RT-DC measurements
For experimental determination of vesicle deformation, an AcCellerator (Zellmechanik Dresden) combined with a high-speed CMOS camera (MC1362, Microtron) on an inverted microscope (AxioObserver, Carl Zeiss AG) with an xy-stage and a 40 ×/0.65 objective was used. 150 µl of 320mM Glucose solution was added to 90 µl of electroformed vesicles in 320mM Sucrose solution in an Eppendorf tube. After 10 min vesicles were collected from the bottom of the tube and mixed with CellCarrier B (Zellmechanik Dresden) in a 1:9 volumetric ratio. 1 ml glass syringes filled with CellCarrier B or GUVs in CellCarrier B were mounted into neMESYS syringe pumps (Cetoni) and connected to a rectangular 20-µm-wide channel (Flic20, Zellmechanik Dresden) polydimethylsiloxane chip, via PTFE tubing (S181012, BOLA) and a PTFE plunger (SETonic). The chip was mounted onto the microscope stage and measurements were conducted using Shape-In 2 (Zellmechanik Dresden) at total flow rates of 0.04, 0.06, 0.08 or 0.12 µl/s and a sheath flow three times higher than the sample flow.
Vesicles were measured at the end portion of the squared channel in their stationary state with sufficient distance to the channel exit ().
Acknowledgements
SA acknowledges support from DFG (grant numbers 328170591 and 417223351). The authors gratefully acknowledge computing time on the high-performance computer at the NHR Center of TU Dresden. This center is jointly supported by the Federal Ministry of Education and Research and the state governments participating in the NHR (www.nhr-verein.de/unsere-partner). Also the authors acknowledge computing time on the compute cluster of the Faculty of Mathematics and Computer Science of Technische Universität Bergakademie Freiberg, operated by the computing center (URZ) and funded by the Deutsche Forschungsgemeinschaft (DFG) under DFG grant number 397252409. K.G. was funded by the Deutsche Forschungsgemeinschaft (DFG) – SFB-1638/1 – 511488495 - P15 and the ERC starting grant ENSYNC (101076997). K.G. further acknowledges funding from the Deutsche Forschungsgemeinschaft (DFG, German Research Foundation) under Germany’s Excellence Strategy via the Excellence Cluster 3D Matter Made to Order (EXC-2082/1 – 390761711).
References
- [1] Abele, T., Messer, T., Jahnke, K., Hippler, M., Bastmeyer, M., Wegener, M., and Göpfrich, K. Two-photon 3d laser printing inside synthetic cells. Advanced Materials 34, 6 (2022), 2106709.
- [2] Aleksanyan, M., Faizi, H. A., Kirmpaki, M.-A., Vlahovska, P. M., Riske, K. A., and and, R. D. Assessing membrane material properties from the response of giant unilamellar vesicles to electric fields. Advances in Physics: X 8, 1 (2023), 2125342. PMID: 36211231.
- [3] Ali Doosti, B., Fjällborg, D., Kustanovich, K., Jesorka, A., Cans, A.-S., and Lobovkina, T. Generation of interconnected vesicles in a liposomal cell model. Scientific Reports 10, 1 (2020), 14040.
- [4] Allen, T. M., and Cullis, P. R. Liposomal drug delivery systems: From concept to clinical applications. Advanced Drug Delivery Reviews 65, 1 (2013), 36–48. Advanced Drug Delivery: Perspectives and Prospects.
- [5] Büyükurgancı, B., Basu, S. K., Neuner, M., Guck, J., Wierschem, A., and Reichel, F. Shear rheology of methyl cellulose based solutions for cell mechanical measurements at high shear rates. Soft Matter 19 (2023), 1739–1748.
- [6] Davis, T. A. Algorithm 832: Umfpack v4.3—an unsymmetric-pattern multifrontal method. ACM Trans. Math. Softw. 30, 2 (2004), 196–199.
- [7] Dimova, R. Giant vesicles and their use in assays for assessing membrane phase state, curvature, mechanics, and electrical properties. Annual Review of Biophysics 48, Volume 48, 2019 (2019), 93–119.
- [8] Dimova, R., Riske, K. A., and Damijan, M. Electrodeformation, electroporation, and electrofusion of giant unilamellar vesicles. Handbook of electroporation (2016), 235–252.
- [9] Fink, A., Fazliev, S., Abele, T., Spatz, J. P., Göpfrich, K., and Cavalcanti-Adam, E. A. Membrane localization of actin filaments stabilizes giant unilamellar vesicles against external deforming forces. European Journal of Cell Biology 103, 2 (2024), 151428.
- [10] Fregin, B., Czerwinski, F., Biedenweg, D., Girardo, S., Groß, S., Aurich, K., and Otto, O. Dynamic real-time deformability cytometry - time-resolved mechanical single cell analysis at 100 cells/s. Biophysical Journal 118 (2020), 605a.
- [11] Kloppe, M., and Aland, S. A phase-field model of elastic and viscoelastic surfaces in fluids. Computer Methods in Applied Mechanics and Engineering 428 (2024), 117090.
- [12] Lipowsky, R. Remodeling of membrane shape and topology by curvature elasticity and membrane tension. Advanced Biology 6, 1 (2022), 2101020.
- [13] Mietke, A., Otto, O., Girardo, S., Rosendahl, P., Taubenberger, A., Golfier, S., Ulbricht, E., Aland, S., Guck, J., and Fischer-Friedrich, E. Extracting cell stiffness from real-time deformability cytometry: Theory and experiment. Biophysical Journal 109, 10 (2015), 2023–2036.
- [14] Mokbel, M., Mokbel, D., Mietke, A., Träber, N., Girardo, S., Otto, O., Guck, J., and Aland, S. Numerical simulation of real-time deformability cytometry to extract cell mechanical properties. ACS Biomaterials Science & Engineering 3, 11 (2017), 2962–2973. PMID: 33418716.
- [15] Montes, L.-R., Alonso, A., Goni, F. M., and Bagatolli, L. A. Giant unilamellar vesicles electroformed from native membranes and organic lipid mixtures under physiological conditions. Biophysical journal 93, 10 (2007), 3548–3554.
- [16] Moré, J. J. The levenberg-marquardt algorithm: Implementation and theory. In Numerical Analysis (Berlin, Heidelberg, 1978), G. A. Watson, Ed., Springer Berlin Heidelberg, pp. 105–116.
- [17] Ngassam, V. N., Su, W.-C., Gettel, D. L., Deng, Y., Yang, Z., Wang-Tomic, N., Sharma, V. P., Purushothaman, S., and Parikh, A. N. Recurrent dynamics of rupture transitions of giant lipid vesicles at solid surfaces. Biophysical Journal 120, 4 (2021), 586–597.
- [18] Otto, O., Rosendahl, P., Mietke, A., Golfier, S., Herold, C., Klaue, D., Girardo, S., Pagliara, S., Ekpenyong, A., Jacobi, A., Wobus, M., Töpfner, N., Keyser, U. F., Mansfeld, J., Fischer-Friedrich, E., and Guck, J. Real-time deformability cytometry: on-the-fly cell mechanical phenotyping. Nature Methods 12 (2015), 199–202.
- [19] Praetorius, S. The adaptive multi-dimensional simulation toolbox (AMDiS), a discretization module on top of the Dune framework. https://gitlab.com/amdis/amdis.
- [20] Rawicz, W., Smith, B., McIntosh, T., Simon, S., and Evans, E. Elasticity, strength, and water permeability of bilayers that contain raft microdomain-forming lipids. Biophysical Journal 94, 12 (2008), 4725–4736.
- [21] Rosendahl, P., Plak, K., Jacobi, A., Kraeter, M., Toepfner, N., Otto, O., Herold, C., Winzi, M., Herbig, M., Ge, Y., et al. Real-time fluorescence and deformability cytometry. Nature methods 15, 5 (2018), 355–358.
- [22] Schäfer, E., Kliesch, T.-T., and Janshoff, A. Mechanical properties of giant liposomes compressed between two parallel plates: Impact of artificial actin shells. Langmuir 29, 33 (2013), 10463–10474. PMID: 23869855.
- [23] Schäfer, E., Vache, M., Kliesch, T.-T., and Janshoff, A. Mechanical response of adherent giant liposomes to indentation with a conical afm-tip. Soft Matter 11 (2015), 4487–4495.
- [24] Sezgin, E., and Schwille, P. Model membrane platforms to study protein-membrane interactions. Molecular Membrane Biology 29, 5 (2012), 144–154.
- [25] Van de Cauter, L., van Buren, L., Koenderink, G. H., and Ganzinger, K. A. Exploring giant unilamellar vesicle production for artificial cells — current challenges and future directions. Small Methods 7, 12 (2023), 2300416.
- [26] Vey, S., and Voigt, A. AMDiS: adaptive multidimensional simulations. Computing and Visualization in Science 10 (2007), 57–67.
- [27] Wesołowska, O., Michalak, K., Maniewska, J., and Hendrich, A. Giant unilamellar vesicles-a perfect tool to visualize phase separation and lipid rafts in model systems. Acta Biochimica Polonica 56, 1 (2009), 33–39.
- [28] Witkowski, T., Ling, S., Praetorius, S., and Voigt, A. Software concepts and numerical algorithms for a scalable adaptive parallel finite element method. Advances in Computational Mathematics 41 (2015), 1145–1177.
- [29] Wittwer, L. D., Reichel, F., and Aland, S. Chapter 3 - numerical simulation of deformability cytometry: Transport of a biological cell through a microfluidic channel. In Modeling of Mass Transport Processes in Biological Media, S. Becker, A. V. Kuznetsov, F. de Monte, G. Pontrelli, and D. Zhao, Eds. Academic Press, 2022, pp. 33–56.
- [30] Wittwer, L. D., Reichel, F., Müller, P., Guck, J., and Aland, S. A new hyperelastic lookup table for RT-DC. Soft Matter 19 (2023), 2064–2073.
- [31] Wubshet, N. H., and Liu, A. P. Methods to mechanically perturb and characterize guv-based minimal cell models. Computational and Structural Biotechnology Journal 21 (2023), 550–562.