Field-induced electronic correlations and superconductivity in UTe2 beyond 40 T
Abstract
Several superconducting phases have been discovered close to a metamagnetic transition in the heavy-fermion compound UTe2, unveiling a close relation between its superconducting and magnetic properties. Although suspected to be of magnetic nature, the mechanisms stabilizing these superconducting phases remain mysterious. Here, we present electrical-resistivity measurements on UTe2, with a current and under pulsed magnetic fields up to 60 T rotating in the (,) plane. The Fermi-liquid coefficient of the electrical resistivity reaches its maximal values at the metamagnetic transition in fields tilted by from to , and it becomes asymmetric with higher values above the metamagnetic field than below. The enhancement of is interpreted as resulting from enhanced magnetic fluctuations, in a regime which coincides with a domain of stabilization of superconductivity beyond T. These results show that the magnetic fluctuations probed here probably play a key role in stabilizing high-field superconductivity in UTe2 and may provide further insight into the superconducting mechanisms.
In heavy-fermion systems, magnetic fluctuations have often been identified as responsible for the appearance of unconventional superconductivity Pfleiderer (2009). A Fermi-liquid behavior associated with large effective masses of quasi-particles is observed and a relation between the strength of magnetic fluctuations and the amplitude of the effective mass has been emphasized Knafo (2021). One can indirectly characterize the evolution of the magnetic-fluctuations strength, as function of a tuning parameter, as pressure or magnetic field, by studying the Fermi-liquid coefficients extracted from thermodynamic experiments, as the Sommerfeld heat-capacity coefficient , or from transport measurements, as the electrical-resistivity coefficient . In the last two decades, magnetic-field-induced superconductivity in the uranium-based heavy-fermion ferromagnets URhGe, UCoGe, and UGe2 has attracted considerable attention Aoki et al. (2019a). In these systems, a superconducting phase is induced or reinforced in a magnetic field and develops in the vicinity of a metamagnetic transition, at which ferromagnetic fluctuations are suspected to be involved in the superconducting pairing mechanism Hattori et al. (2012); Wu et al. (2017). In URhGe, an enhancement of the Fermi-liquid electrical-resistivity coefficient at the metamagnetic transition, in the vicinity of a field-induced superconducting phase, was proposed to result from ferromagnetic fluctuations Miyake et al. (2008, 2009); Gourgout et al. (2016). The presence of magnetic fluctuations at the metamagnetic transition was supported by nuclear-magnetic-resonance (NMR) relaxation-rate studies Tokunaga et al. (2015, 2016). More recently, several field-induced superconducting phases have been discovered in the paramagnetic heavy-fermion compound UTe2, revealing a new playground to study the relation between magnetism and superconductivity Ran et al. (2019a); Knebel et al. (2019); Aoki et al. (2021); Vališka et al. (2021); Wu et al. (2025); Lewin et al. (2024a); Frank et al. (2024). At zero magnetic field, a superconducting phase SC1 is stabilized below 2 K and was identified as a candidate for a triplet mechanism Ran et al. (2019b); Aoki et al. (2019b); Kinjo et al. (2023); Theuss et al. (2024). Antiferromagnetic fluctuations are developing at low temperature Duan et al. (2020); Knafo et al. (2021a); Butch et al. (2022); Duan et al. (2021); Raymond et al. (2021) and UTe2 is located near an antiferromagnetic instability, as shown by the onset of long-range antiferromagnetic order under pressure Knafo et al. (2023). NMR Knight-shift experiments confirmed the presence of magnetic fluctuations at low temperatures Tokunaga et al. (2019); Fujibayashi et al. (2023); Matsumura et al. (2025).
By applying a magnetic field to UTe2 along its crystallographic direction , SC1 vanishes near 20 T and a field-induced superconducting phase SC2 is stabilized for 20 T , near a metamagnetic transition at T, the transition temperature of SC2 being maximum near Knebel et al. (2019); Ran et al. (2019a); Knafo et al. (2019); Miyake et al. (2019); Rosuel et al. (2023). By tilting the magnetic field from to , a second field-induced superconducting phase SC-PPM is stabilized for in the vicinity of the metamagnetic transition observed then at T Ran et al. (2019a); Knafo et al. (2021b); Helm et al. (2024). The metamagnetic field and the boundaries of SC2 and SC-PPM were mapped out as function of the three components of the magnetic-field direction, showing a complex three-dimensional phase diagram Wu et al. (2025); Lewin et al. (2024a, b). The Fermi-liquid Sommerfeld coefficient in the heat capacity and the quadratic coefficient in the electrical resistivity of UTe2 were shown to exhibit a maximum at the metamagnetic transition for the two field directions and tilted by from to Rosuel et al. (2023); Knafo et al. (2019, 2021b); Imajo et al. (2019); Miyake et al. (2021); Thebault et al. (2022). For , a similar magnetic-field variation of the NMR relaxation rates and (measured with an electrical current ) was found, supporting that the Fermi-liquid regime is controlled by the magnetic fluctuations Tokunaga et al. (2023) and, thus, that their intensity is maximum at the metamagnetic transition. However, the reasons for the different domains of stability of SC2 and SC-PPM remain mysterious. A systematic characterization of the magnetic fluctuations developing near the metamagnetic transition, under high magnetic fields rotating in the (,) plane, is now needed to address this question.
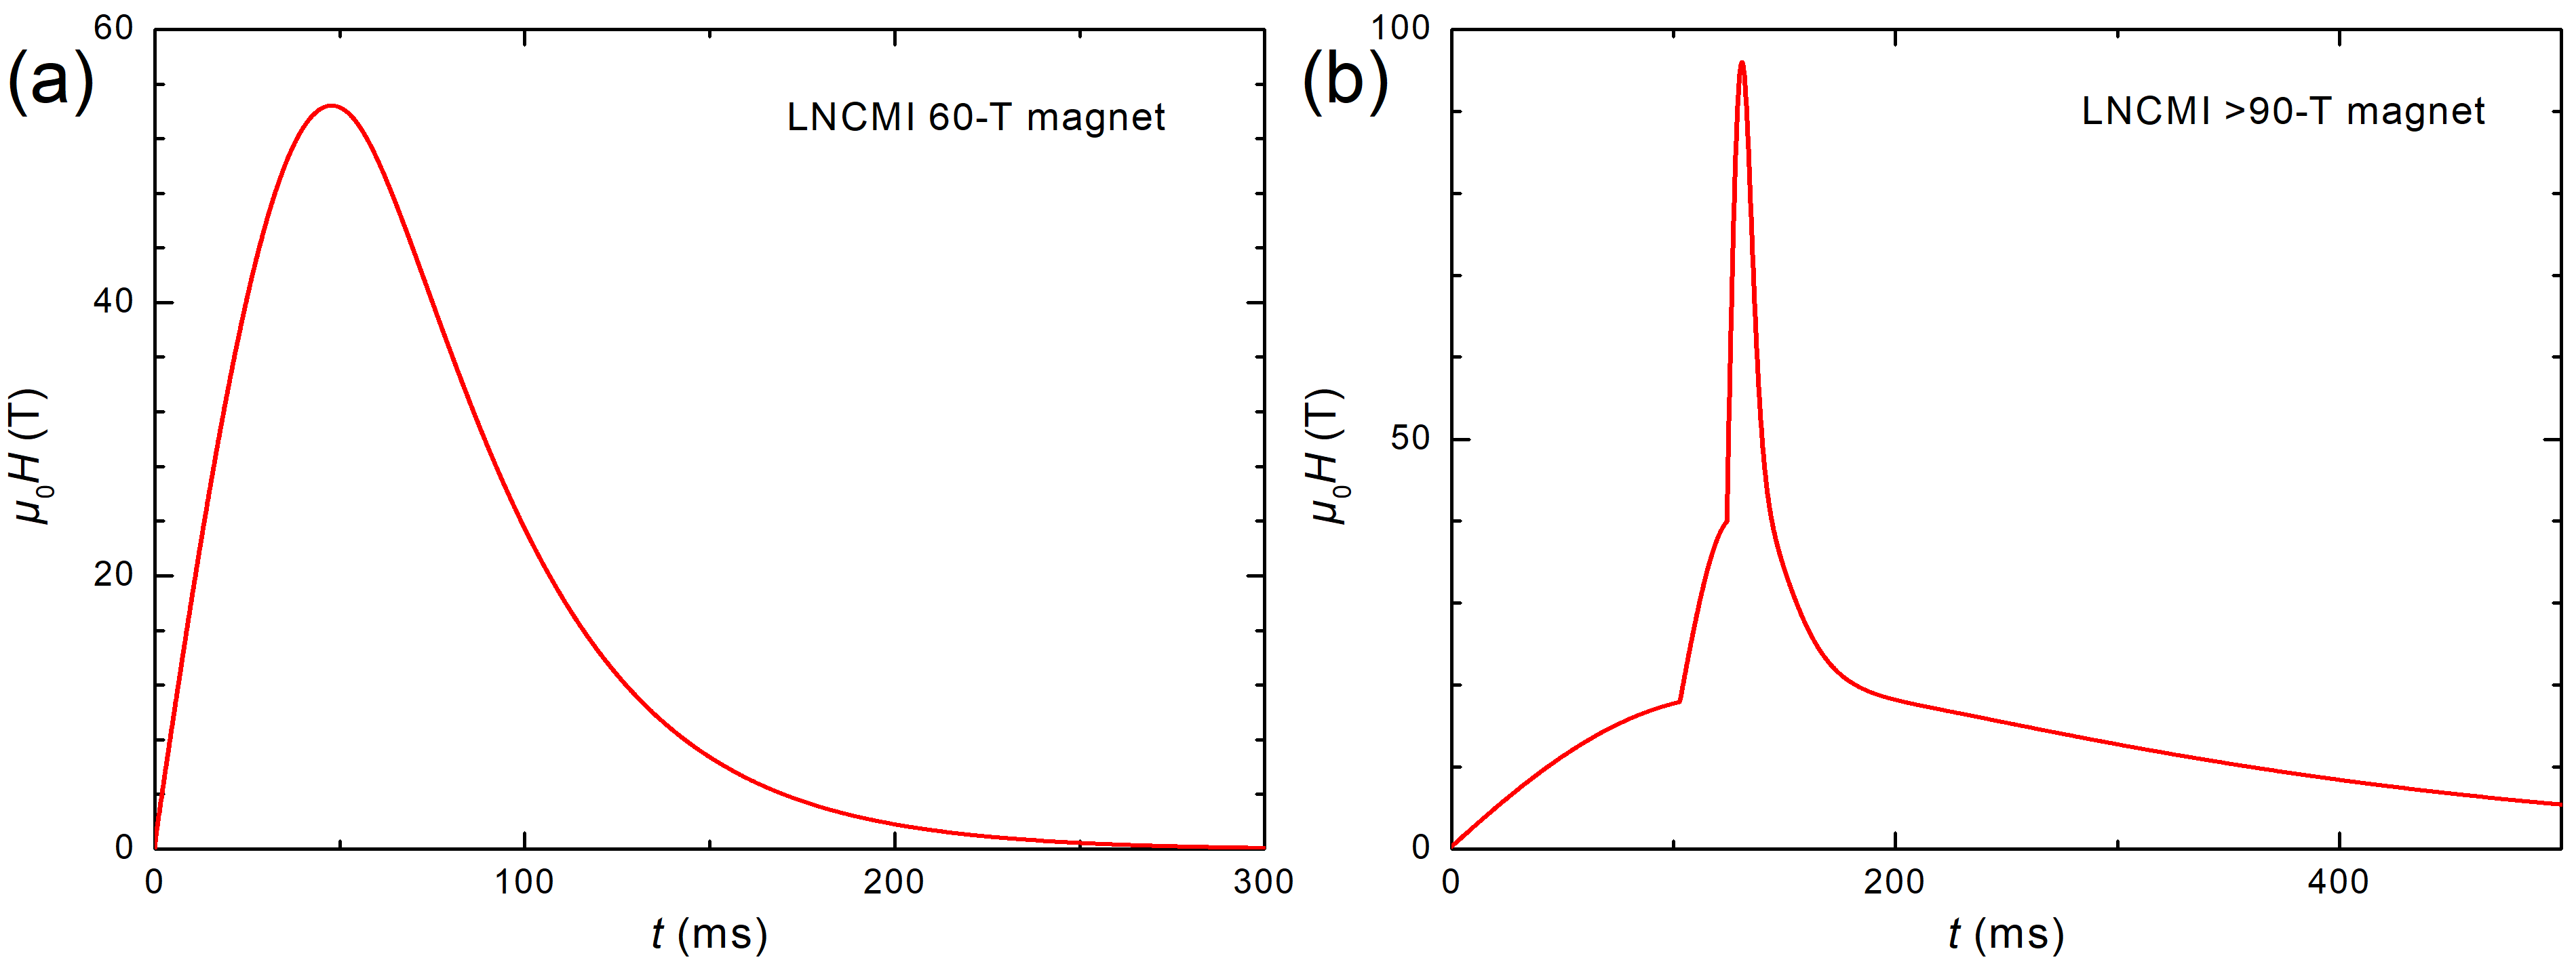
In this letter, we present electrical-resistivity measurements on UTe2 single crystals in magnetic fields applied in the (,) plane. Different samples (labeled , , , and ; see details in the Supplemental Material SM ) grown by the molten-salt-flux (MSF) method Sakai et al. (2022) have been studied. The electrical resistivity has been measured by the four-point method with a current . Magnetic fields have been generated by long-duration pulsed magnets at the Laboratoire National des Champs Magnétiques Intenses in Toulouse. A standard single-coil magnet has been used for most of the measurements presented here, which were done in magnetic fields up to 55 T and temperatures from 500 mK to 10 K delivered by a 10-mm bore 3He insert. A triple-coil prototype was used to generate magnetic fields up to 95 T (see Béard et al. (2018)), at temperatures from 1.4 to 36.5 K delivered by a 4-mm bore 4He cryostat, for complementary measurements. We extract the magnetic-field evolution of the Fermi-liquid coefficient and of the superconducting temperatures and of the phases SC2 and SC-PPM, respectively, for field angles varying from from 4.2 to . Our data show signatures from enhanced magnetic fluctuations in the vicinity of the magnetic-field-induced superconducting phase SC-PPM, which supports that these magnetic fluctuations may play a role in the mechanism driving SC-PPM.
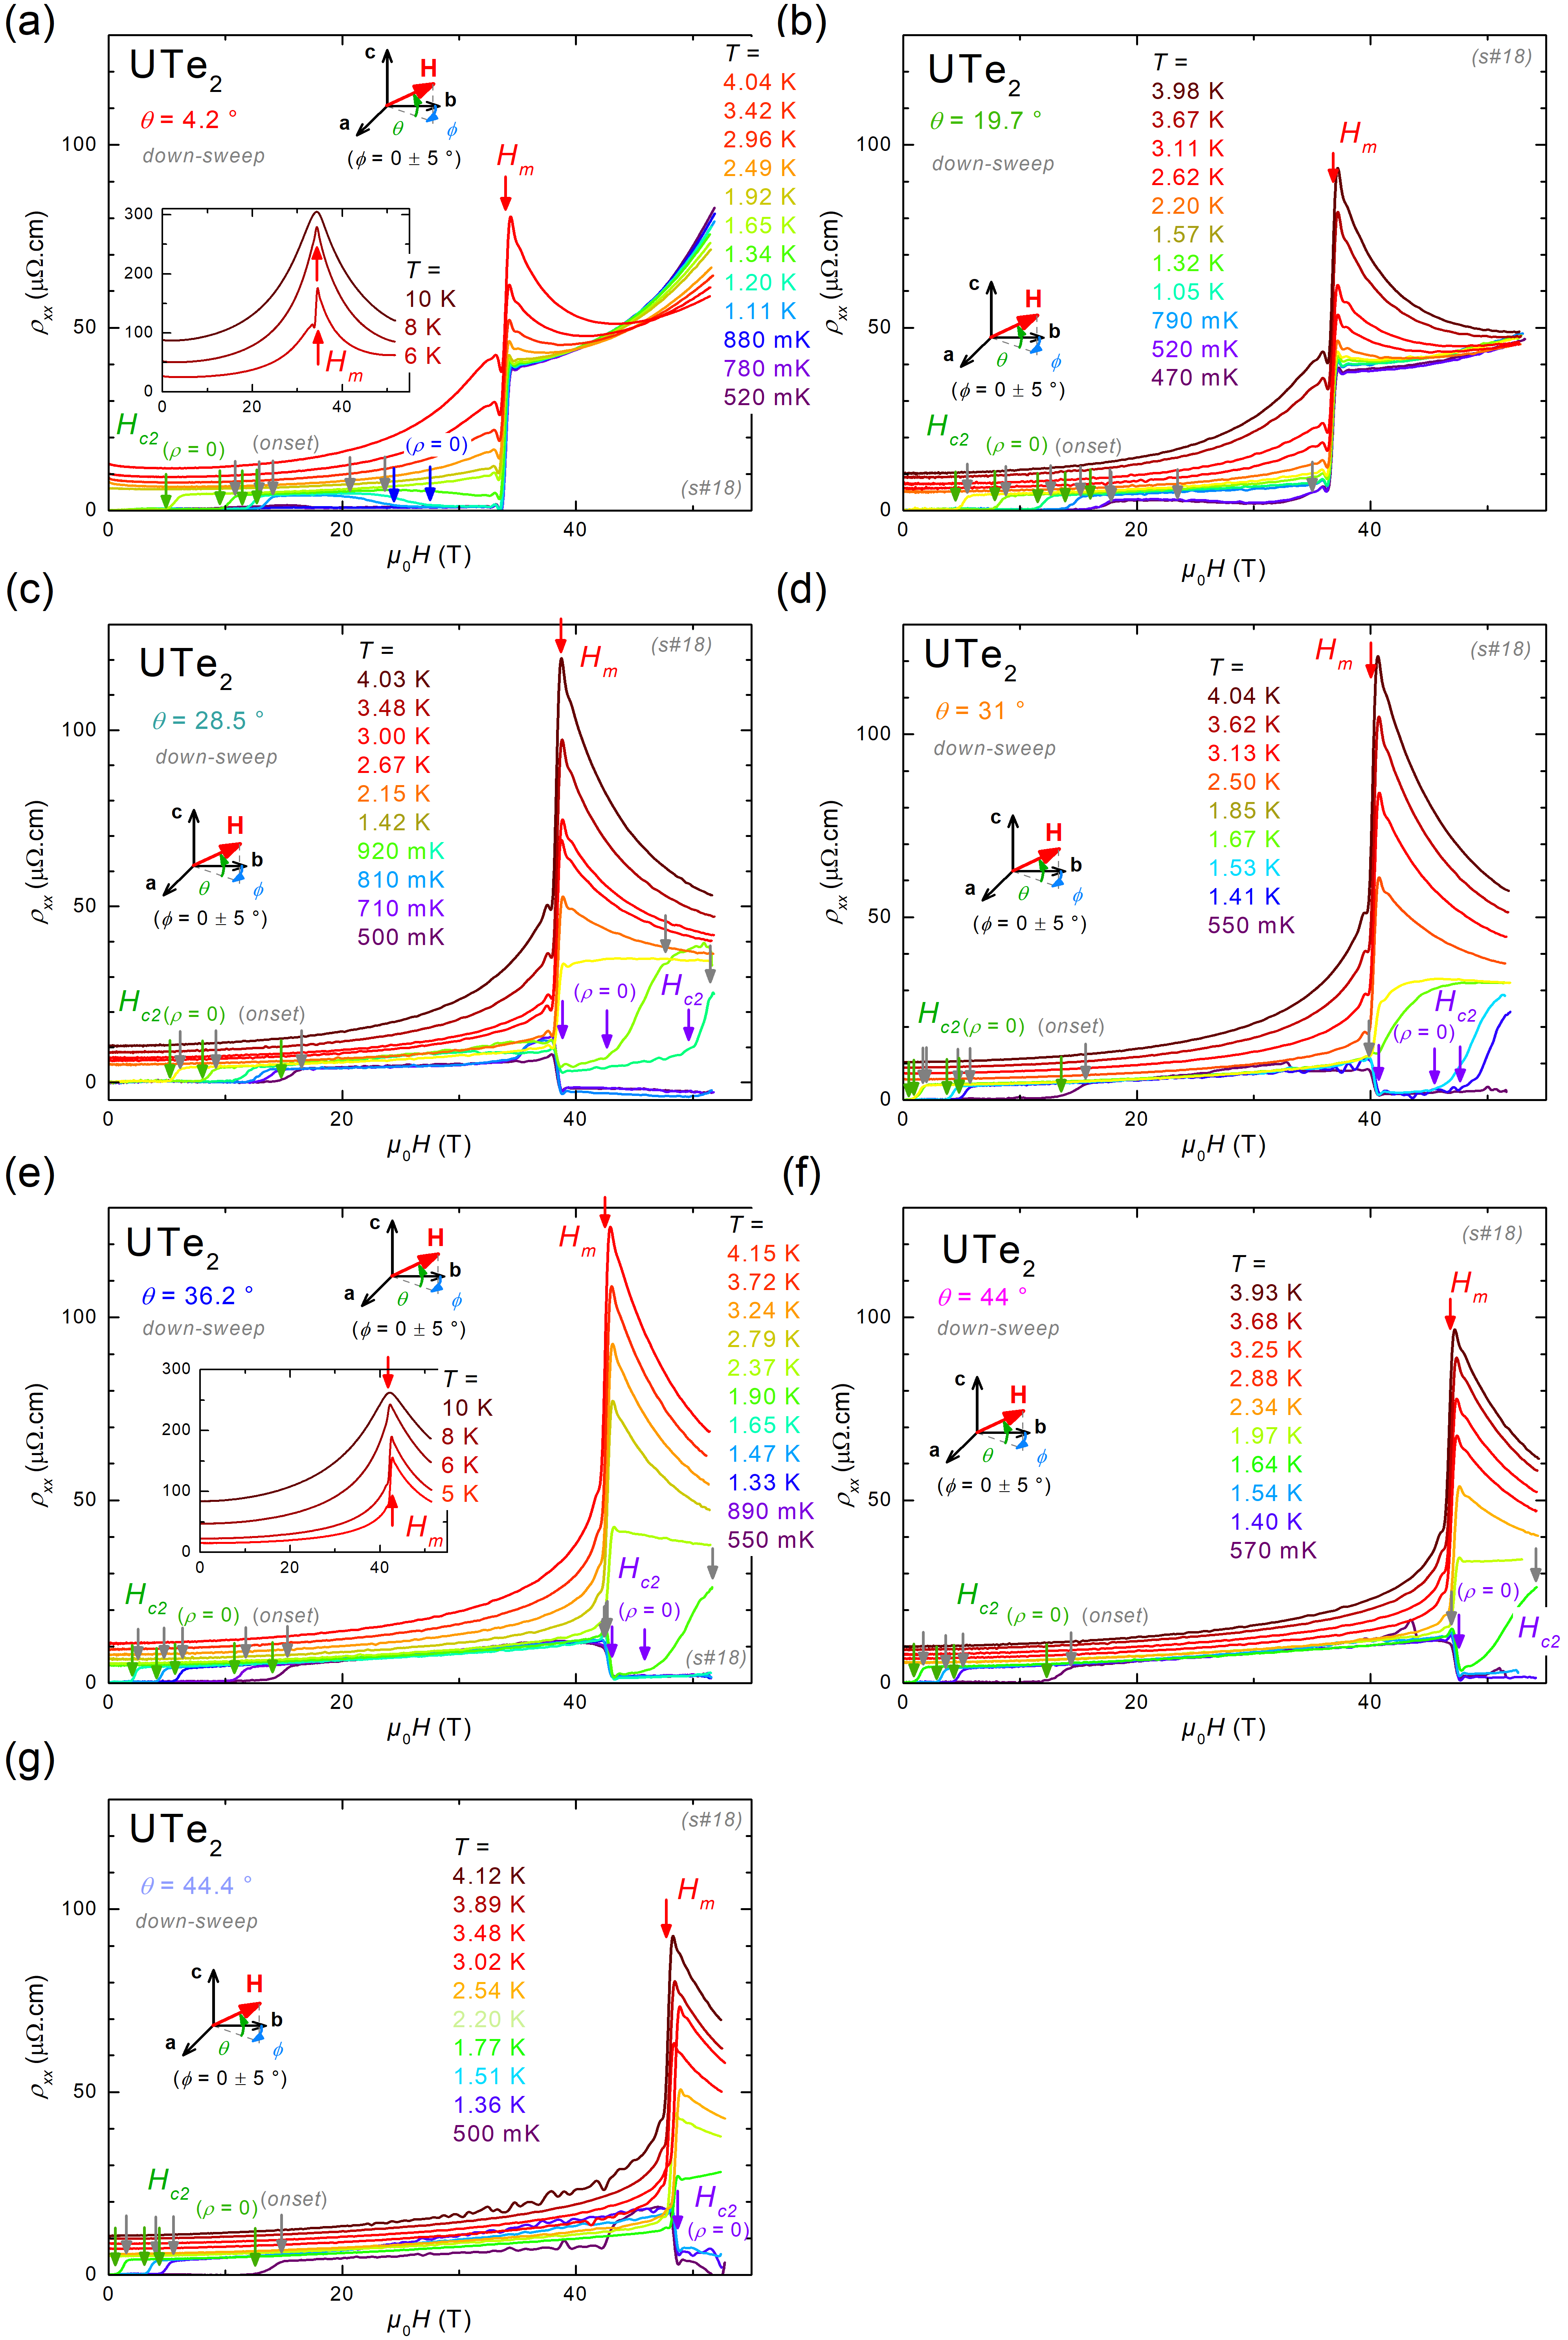
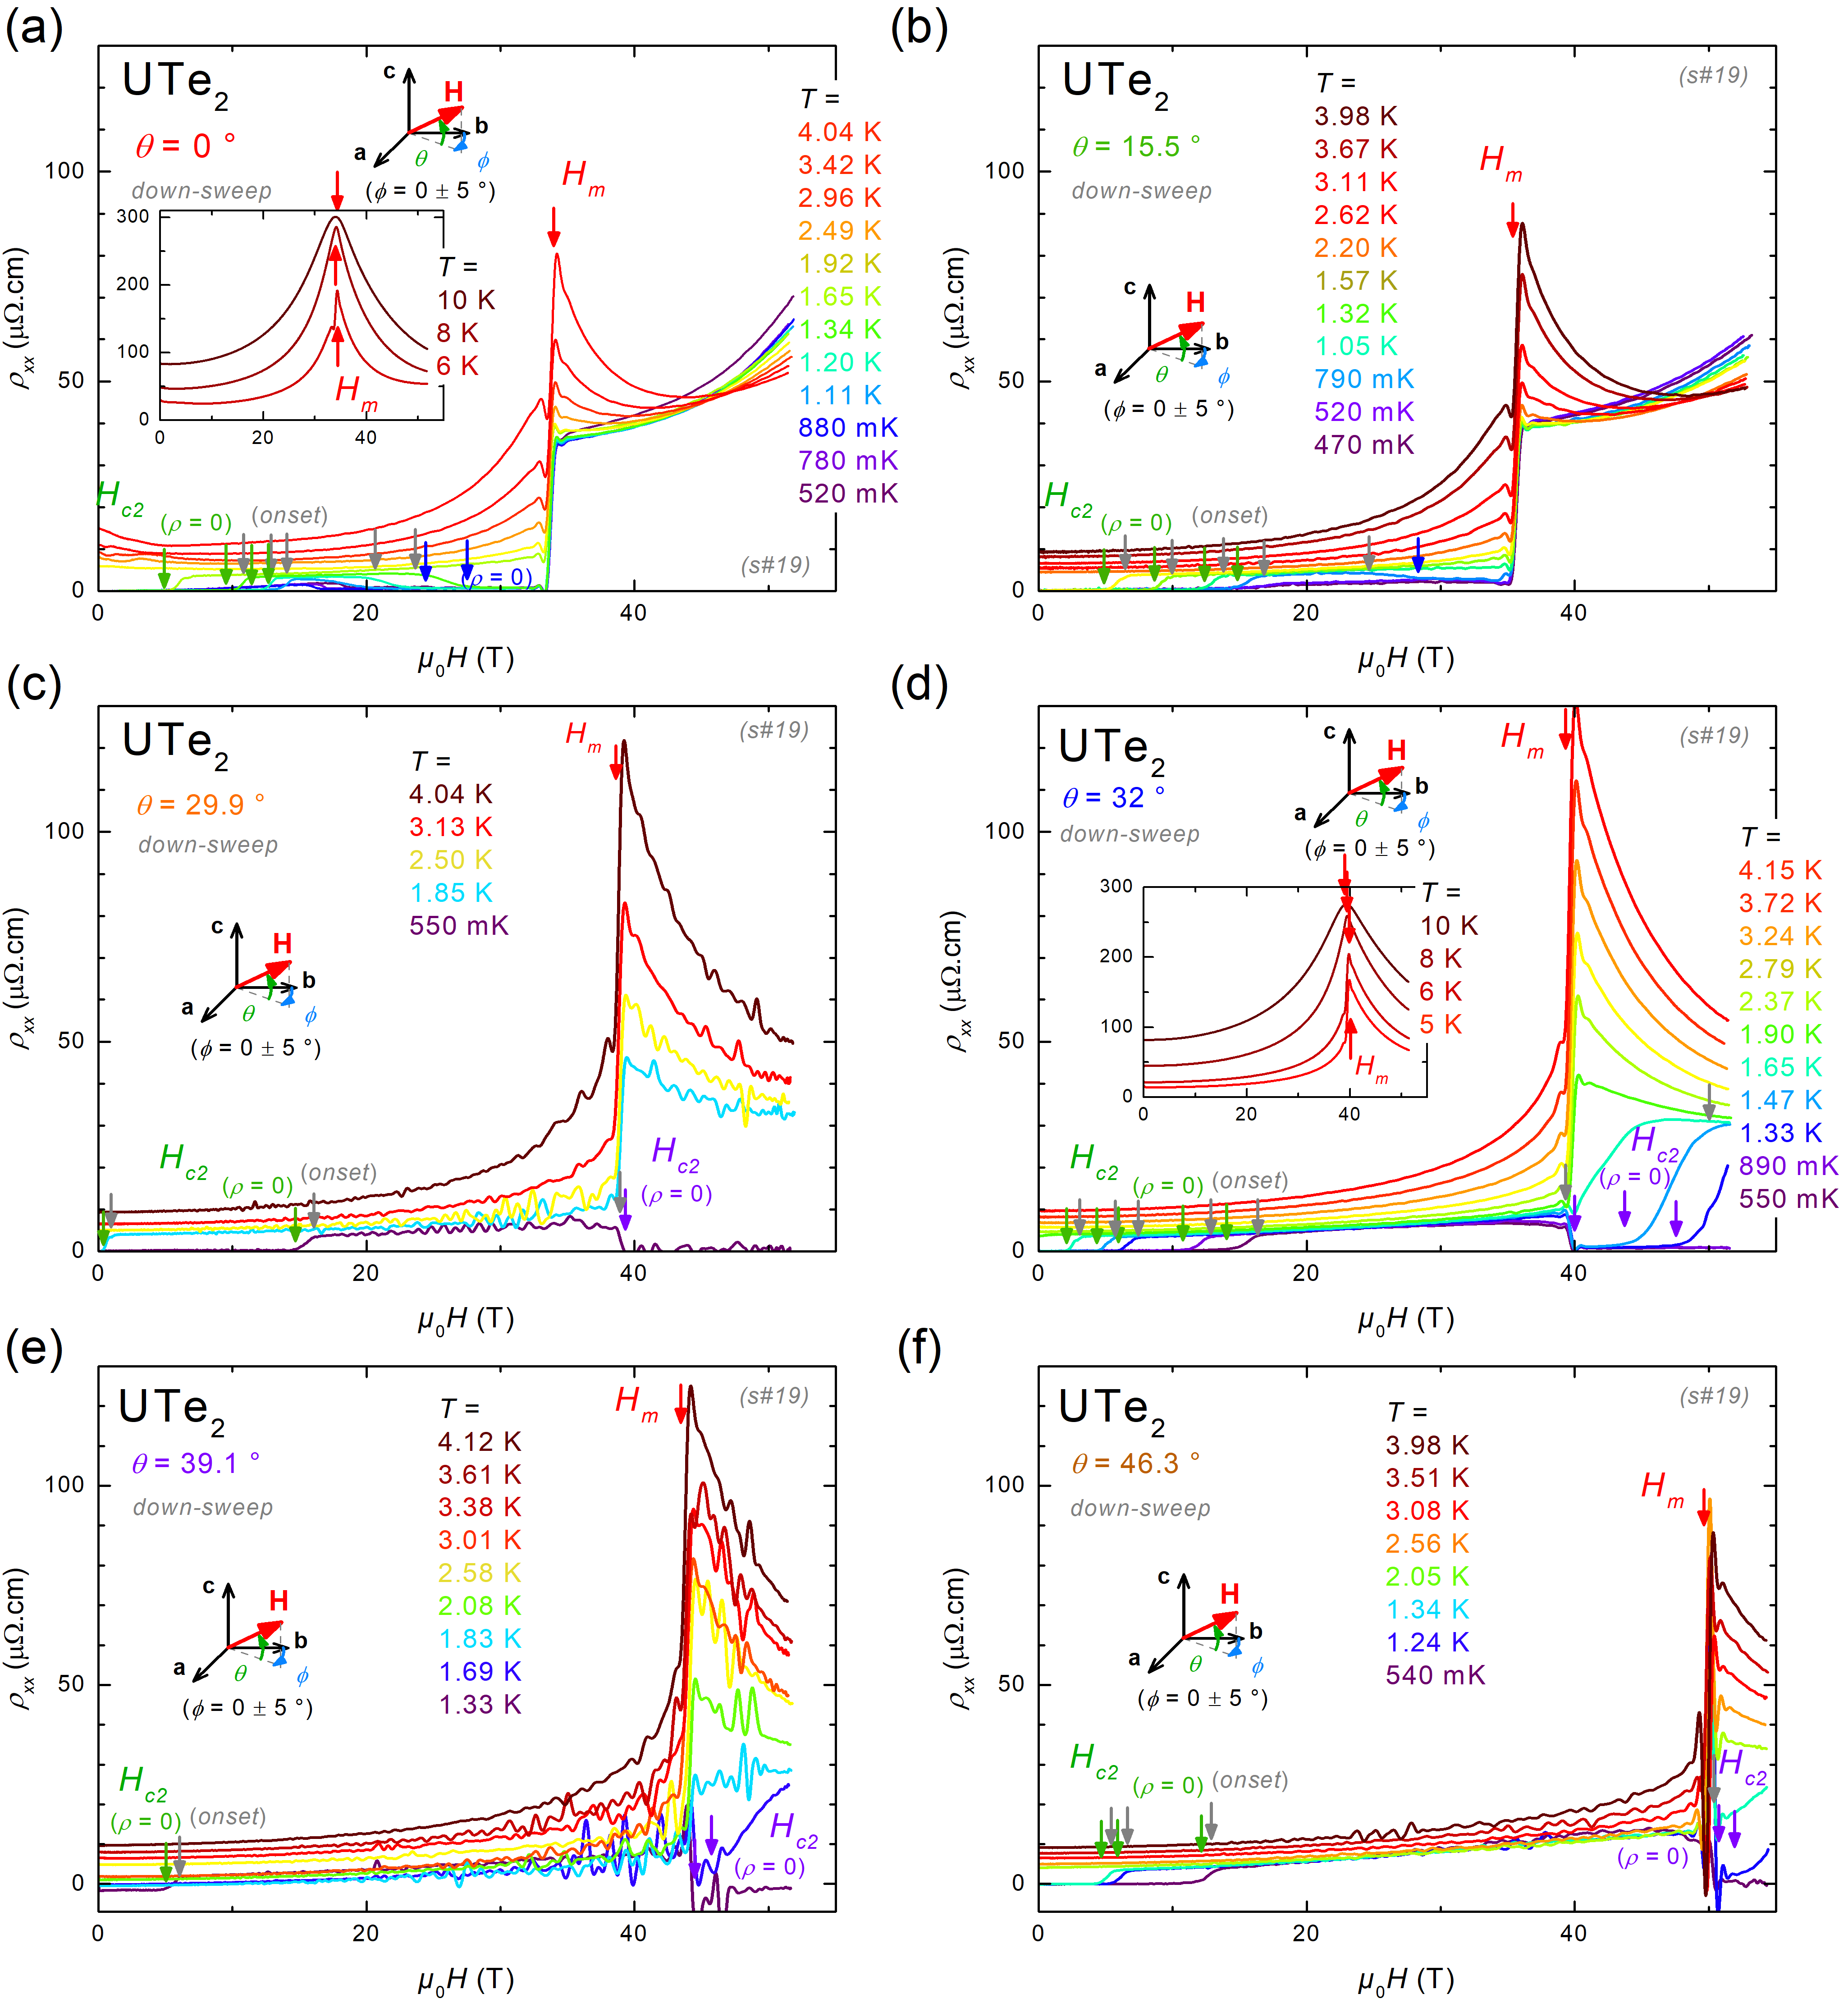
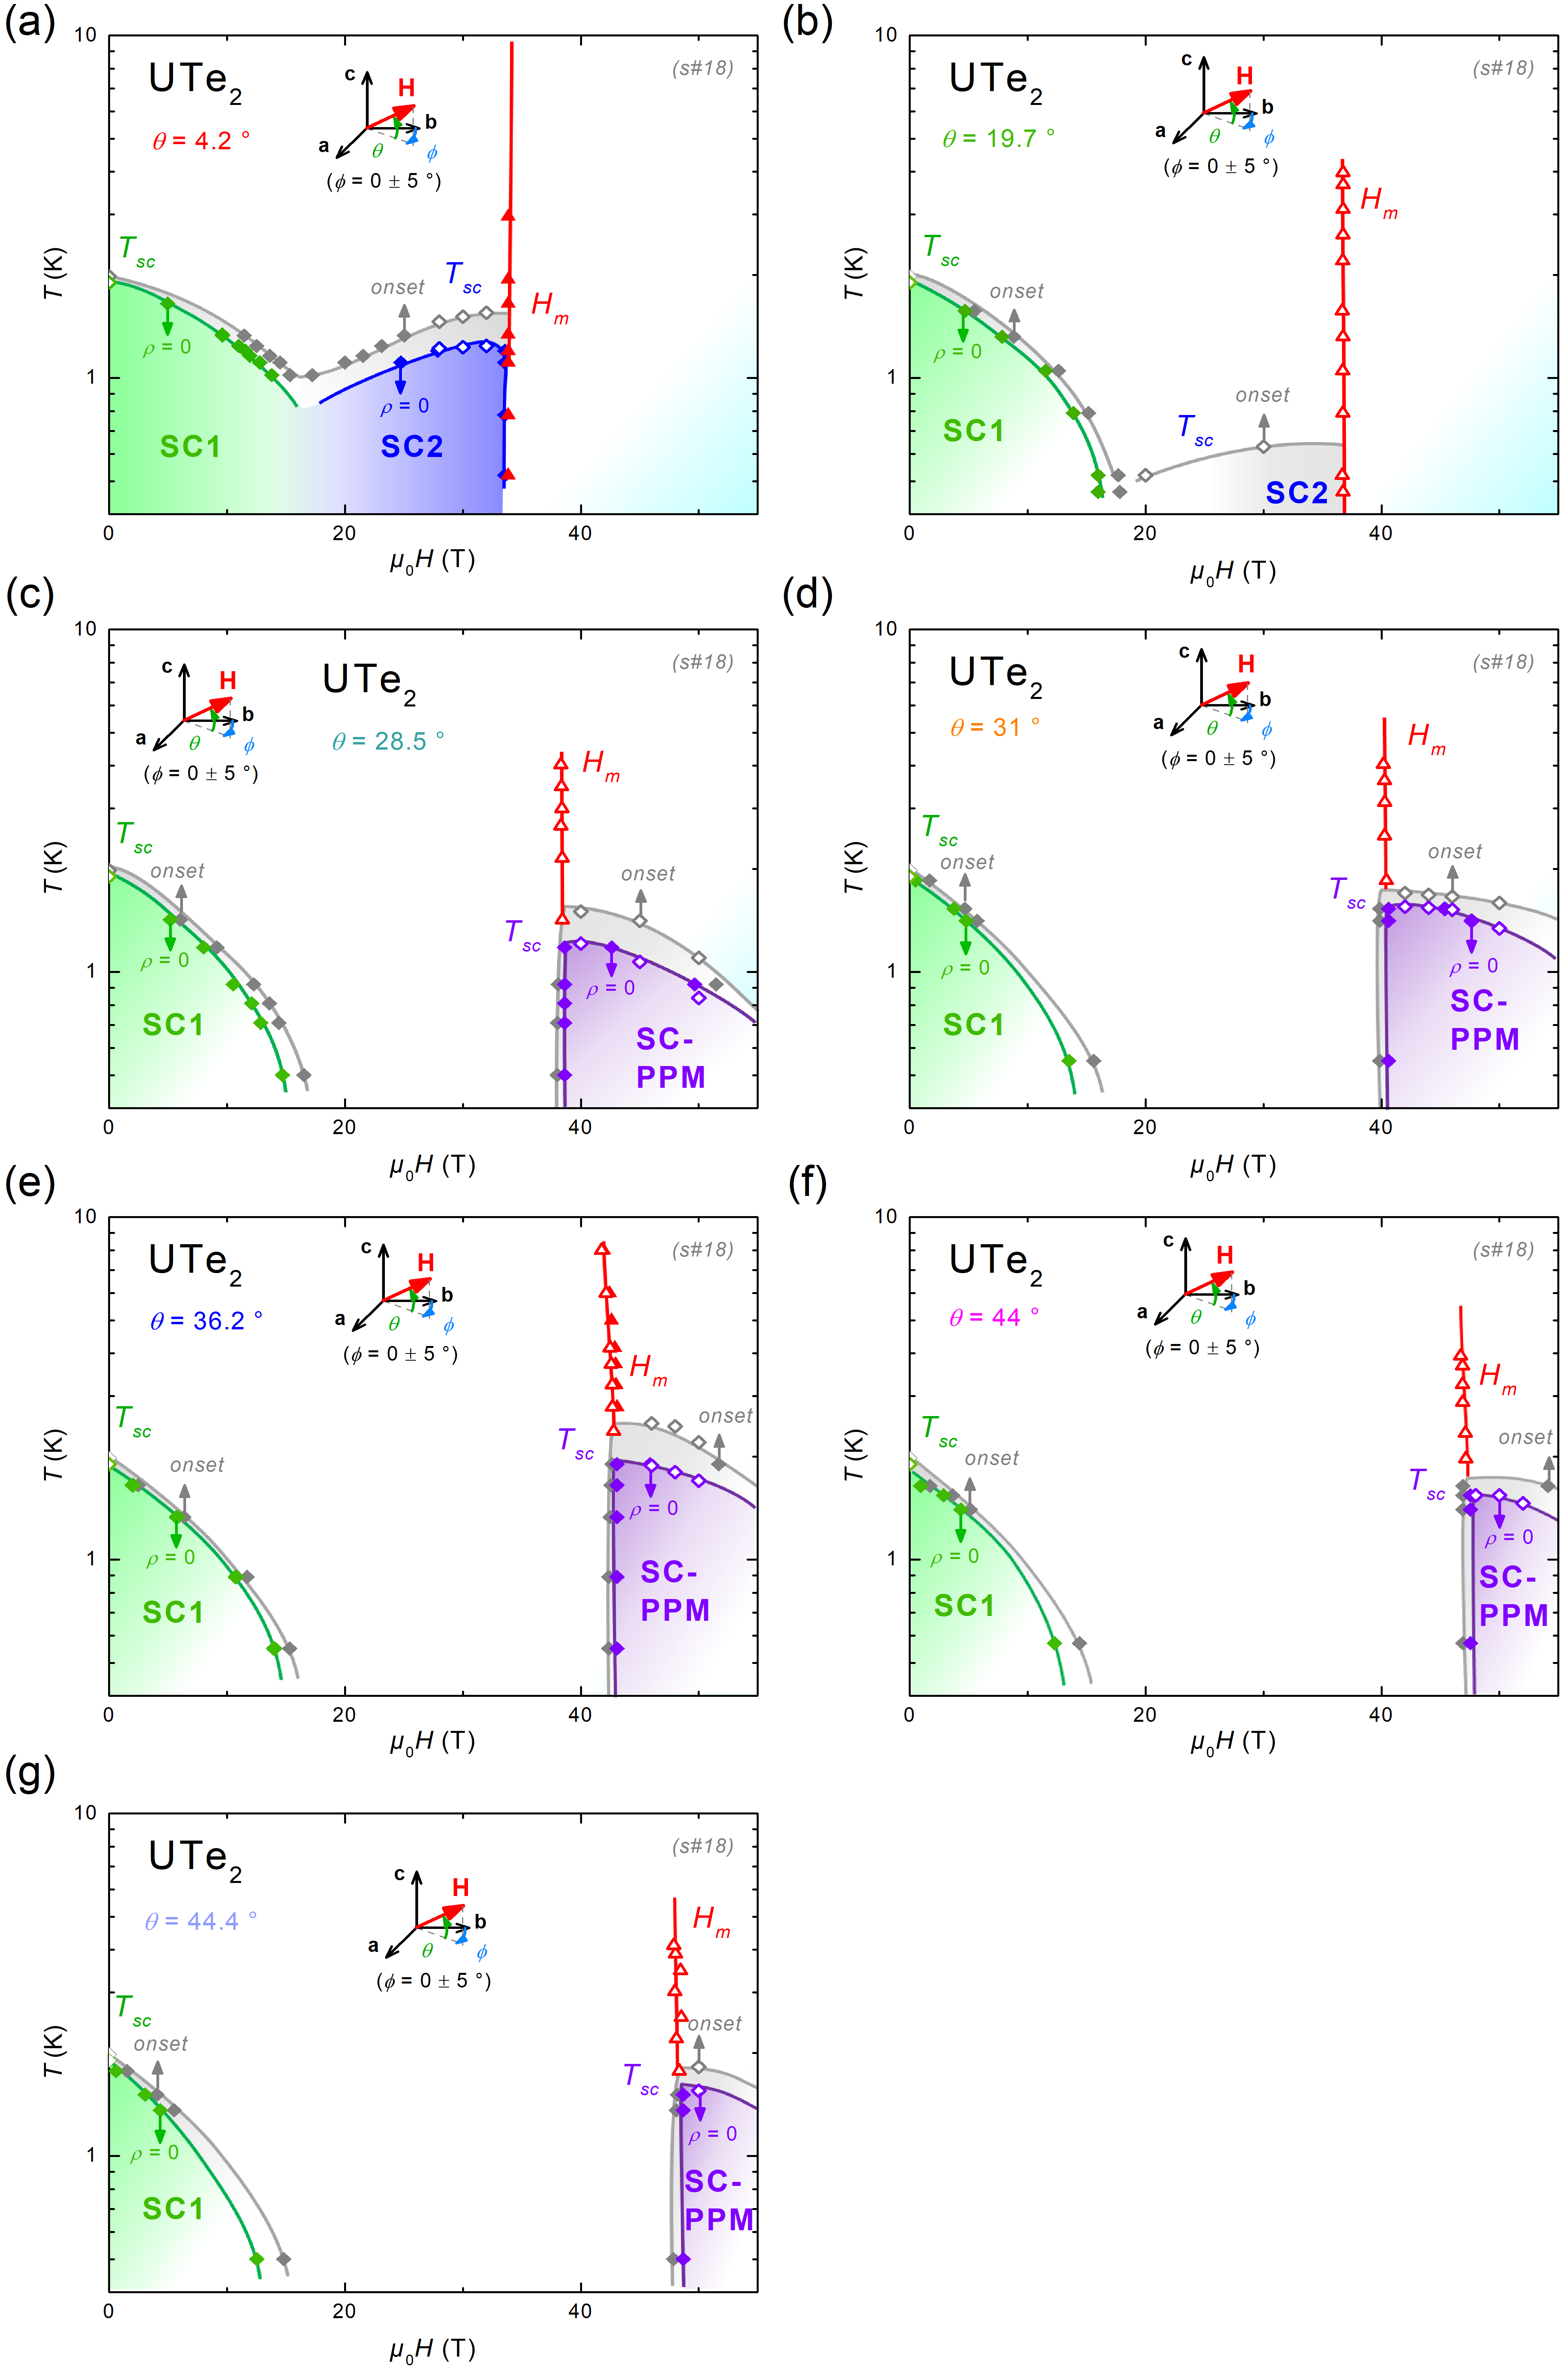
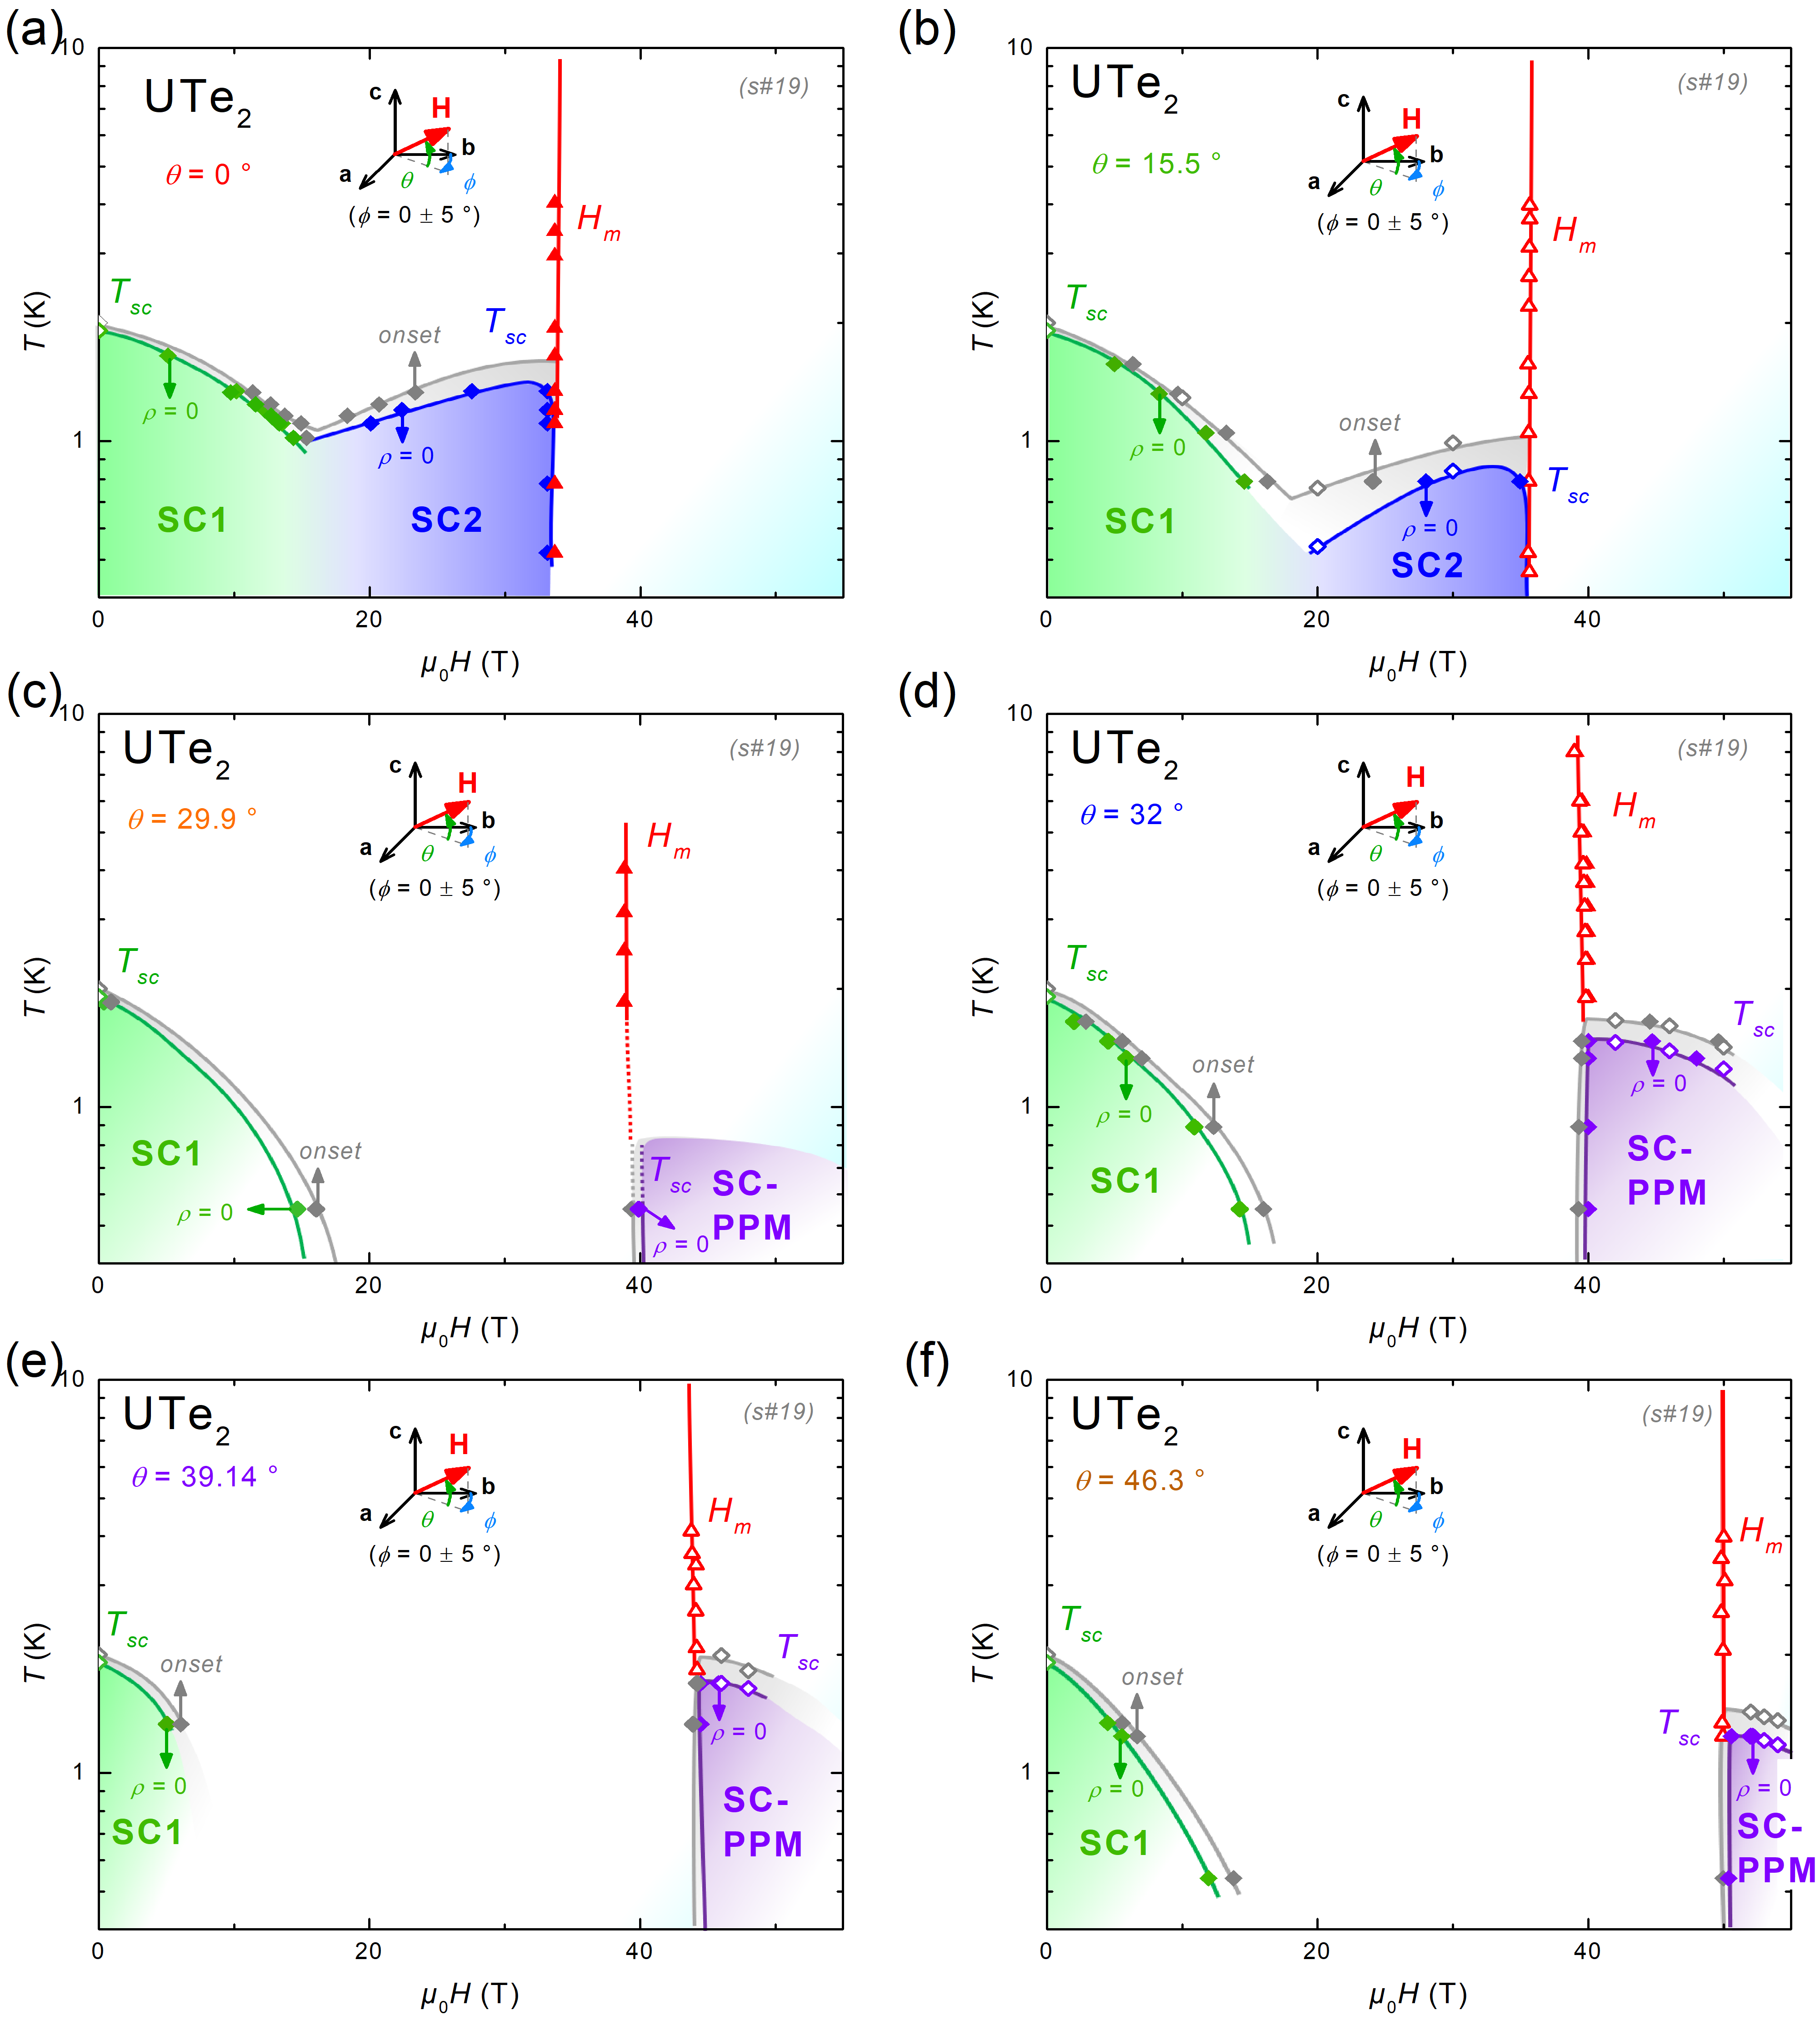
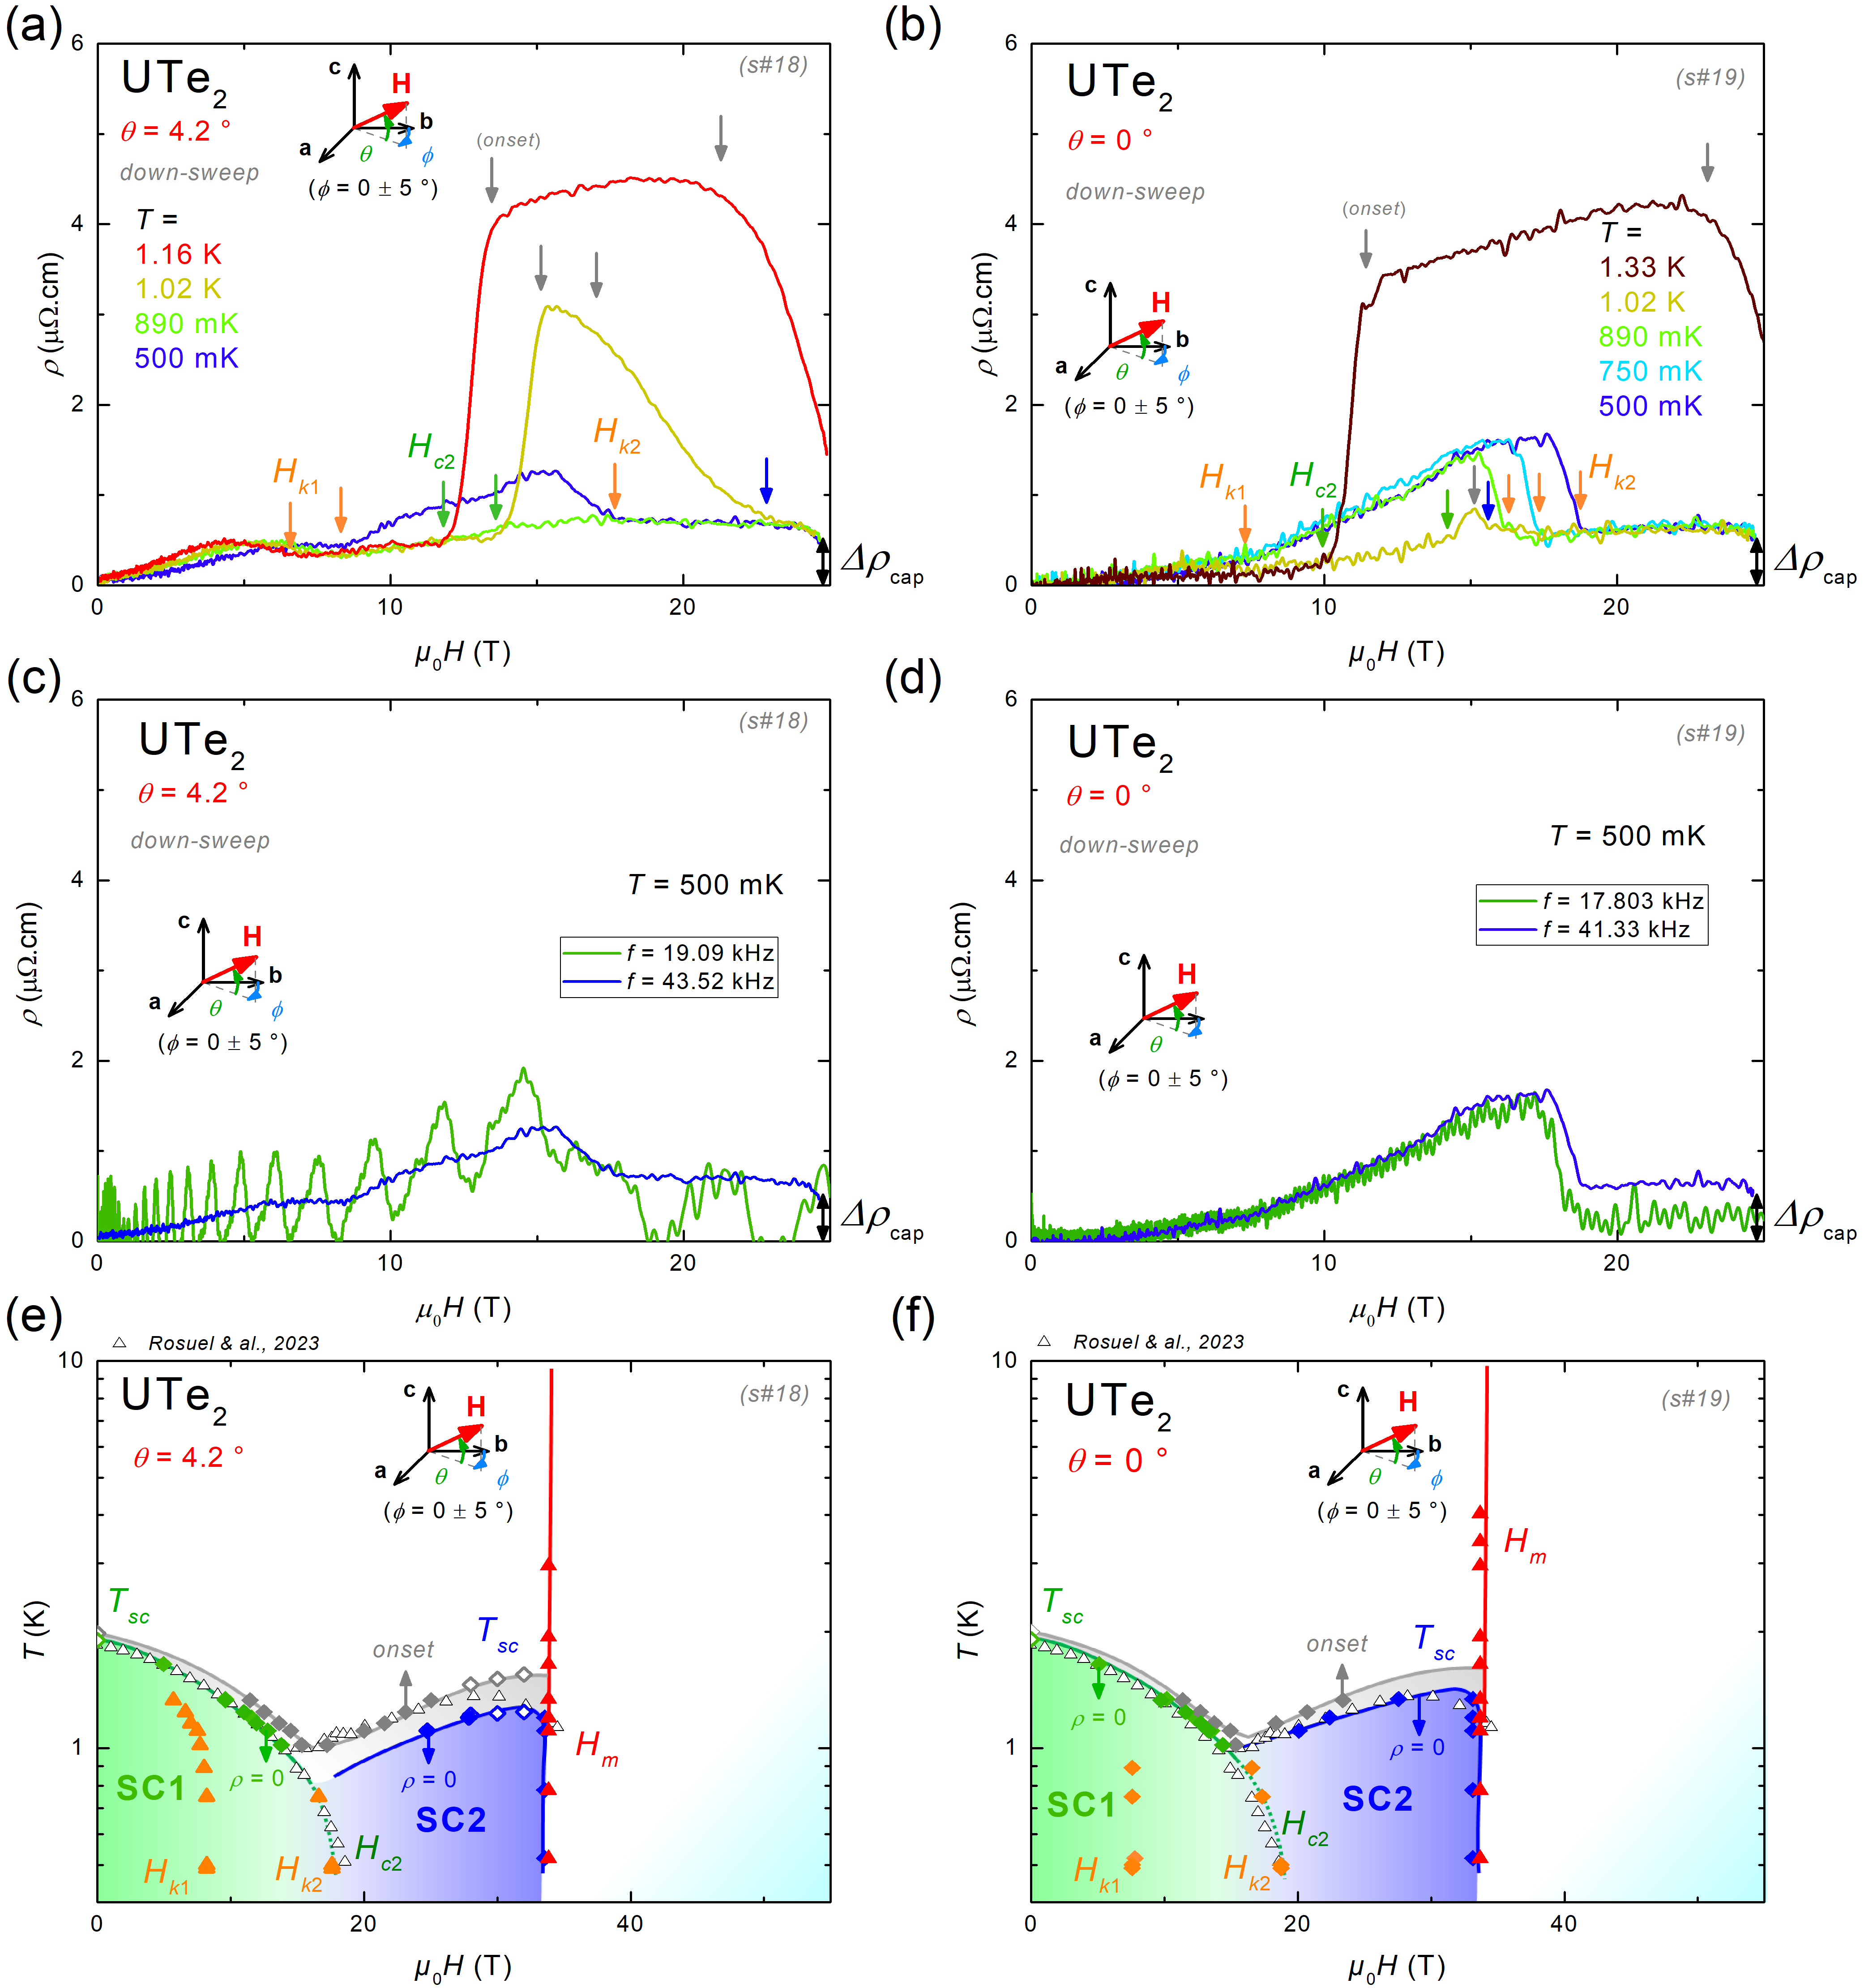
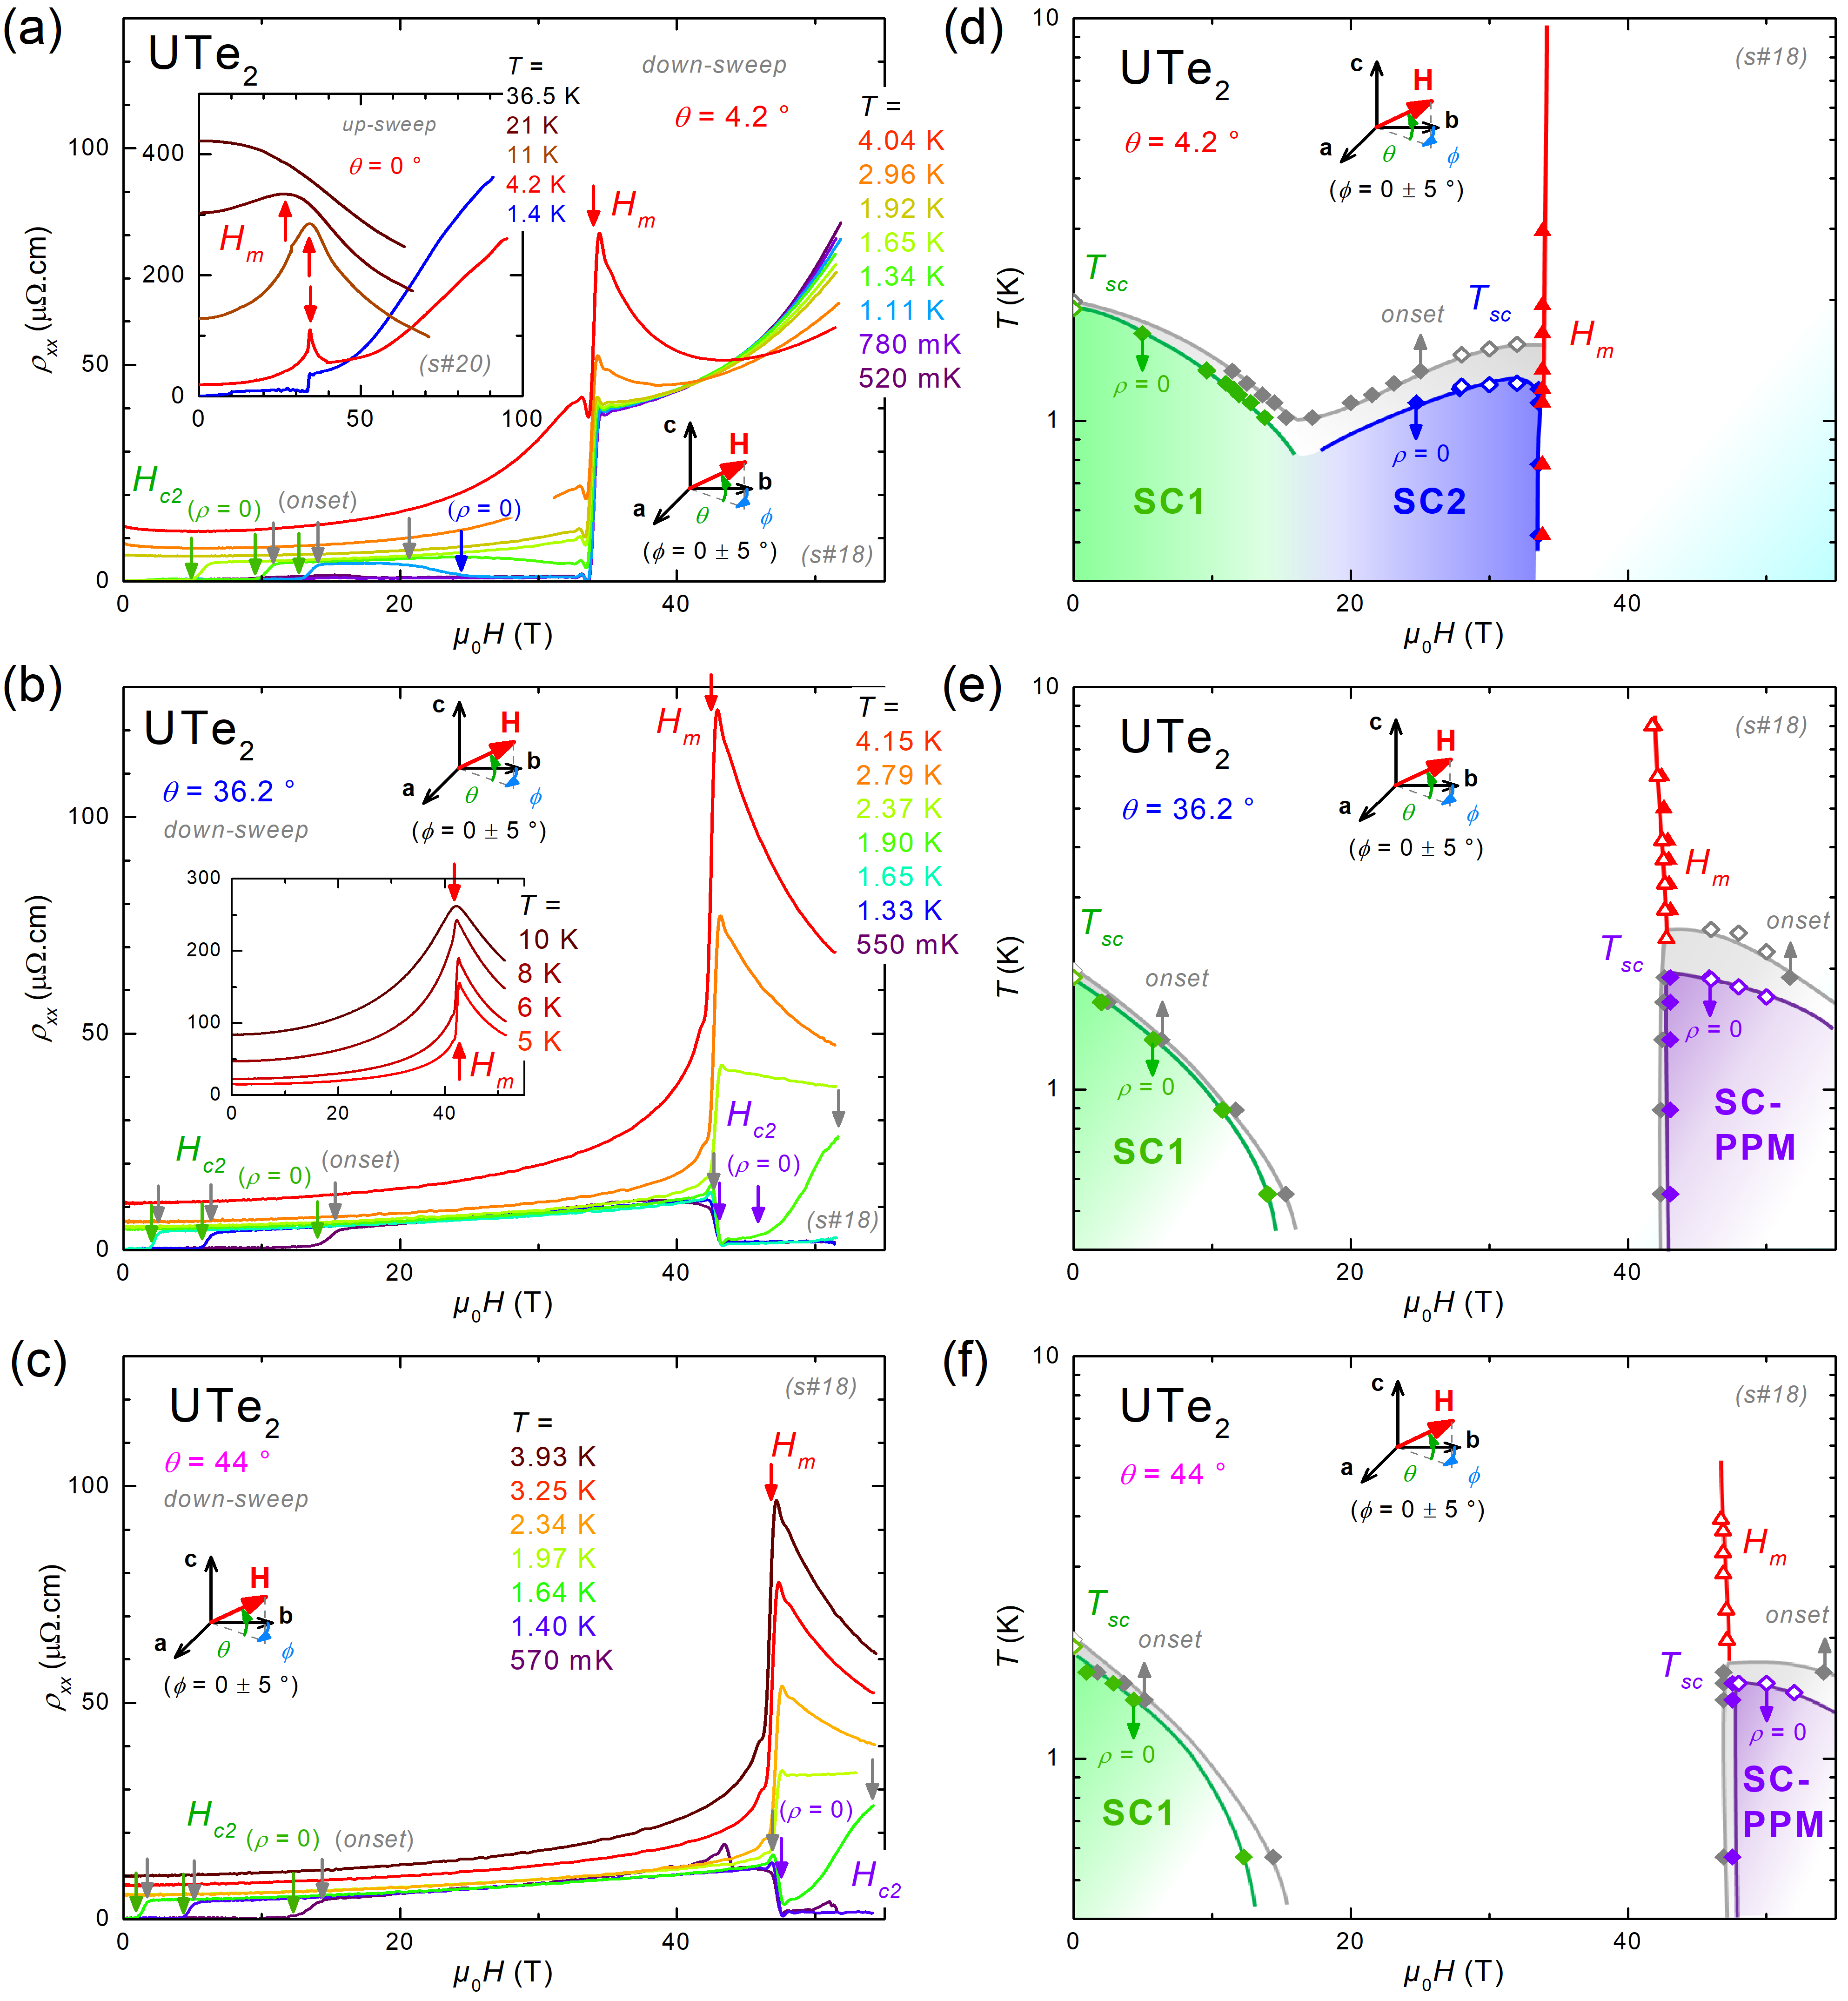
The electrical resistivity measured in magnetic fields with the angles , 36.2 and 44 and temperatures from mK to 10 K is presented in Figs. 1(a-c). At , SC2 is stabilized in the field window T T, at temperatures 1.2 K [Fig. 1(a)]. At temperatures 6 K, a sharp step-like increase of the resistivity occurs at the metamagnetic field . At temperatures K, the metamagnetic transition is transformed into a crossover characterized by a broad maximum in , as observed in previous studies Knafo et al. (2019, 2021b). An increase of the resistivity is observed at high fields and low temperatures, from cm at T to cm at T at the temperature K [see Inset of Fig. 1(a)]. Knowing that UTe2 is a compensated metal Aoki et al. (2022), this increase of is attributed to the cyclotron motion of the conduction electrons in a transverse configuration (current orthogonal to the magnetic field) Onuki (2018). A similar behavior was already observed in the electrical resistivity of UTe2 with electrical currents under a magnetic field Knafo et al. (2019); Thebault et al. (2022). For and , the superconducting phase SC-PPM is stabilized for with T and 47.5 T, respectively [Figs. 1(b-c)]. No cyclotron-motion effect is observed in fields up to 60 T applied along these directions. In the vicinity of , the temperature variation of the electrical resistivity is the largest for . Magnetic-field-temperature phase diagrams obtained from our electrical-resistivity measurements are presented in Figs. 1(d-f). For , the highest critical temperature K of SC2 is found at 32 T, i.e., just below [Fig. 1(d)]. For and 44, the critical temperature of SC-PPM is maximum in fields just above the metamagnetic field, where it reaches K and 1.55 K, respectively [Figs. 1(e-f)].
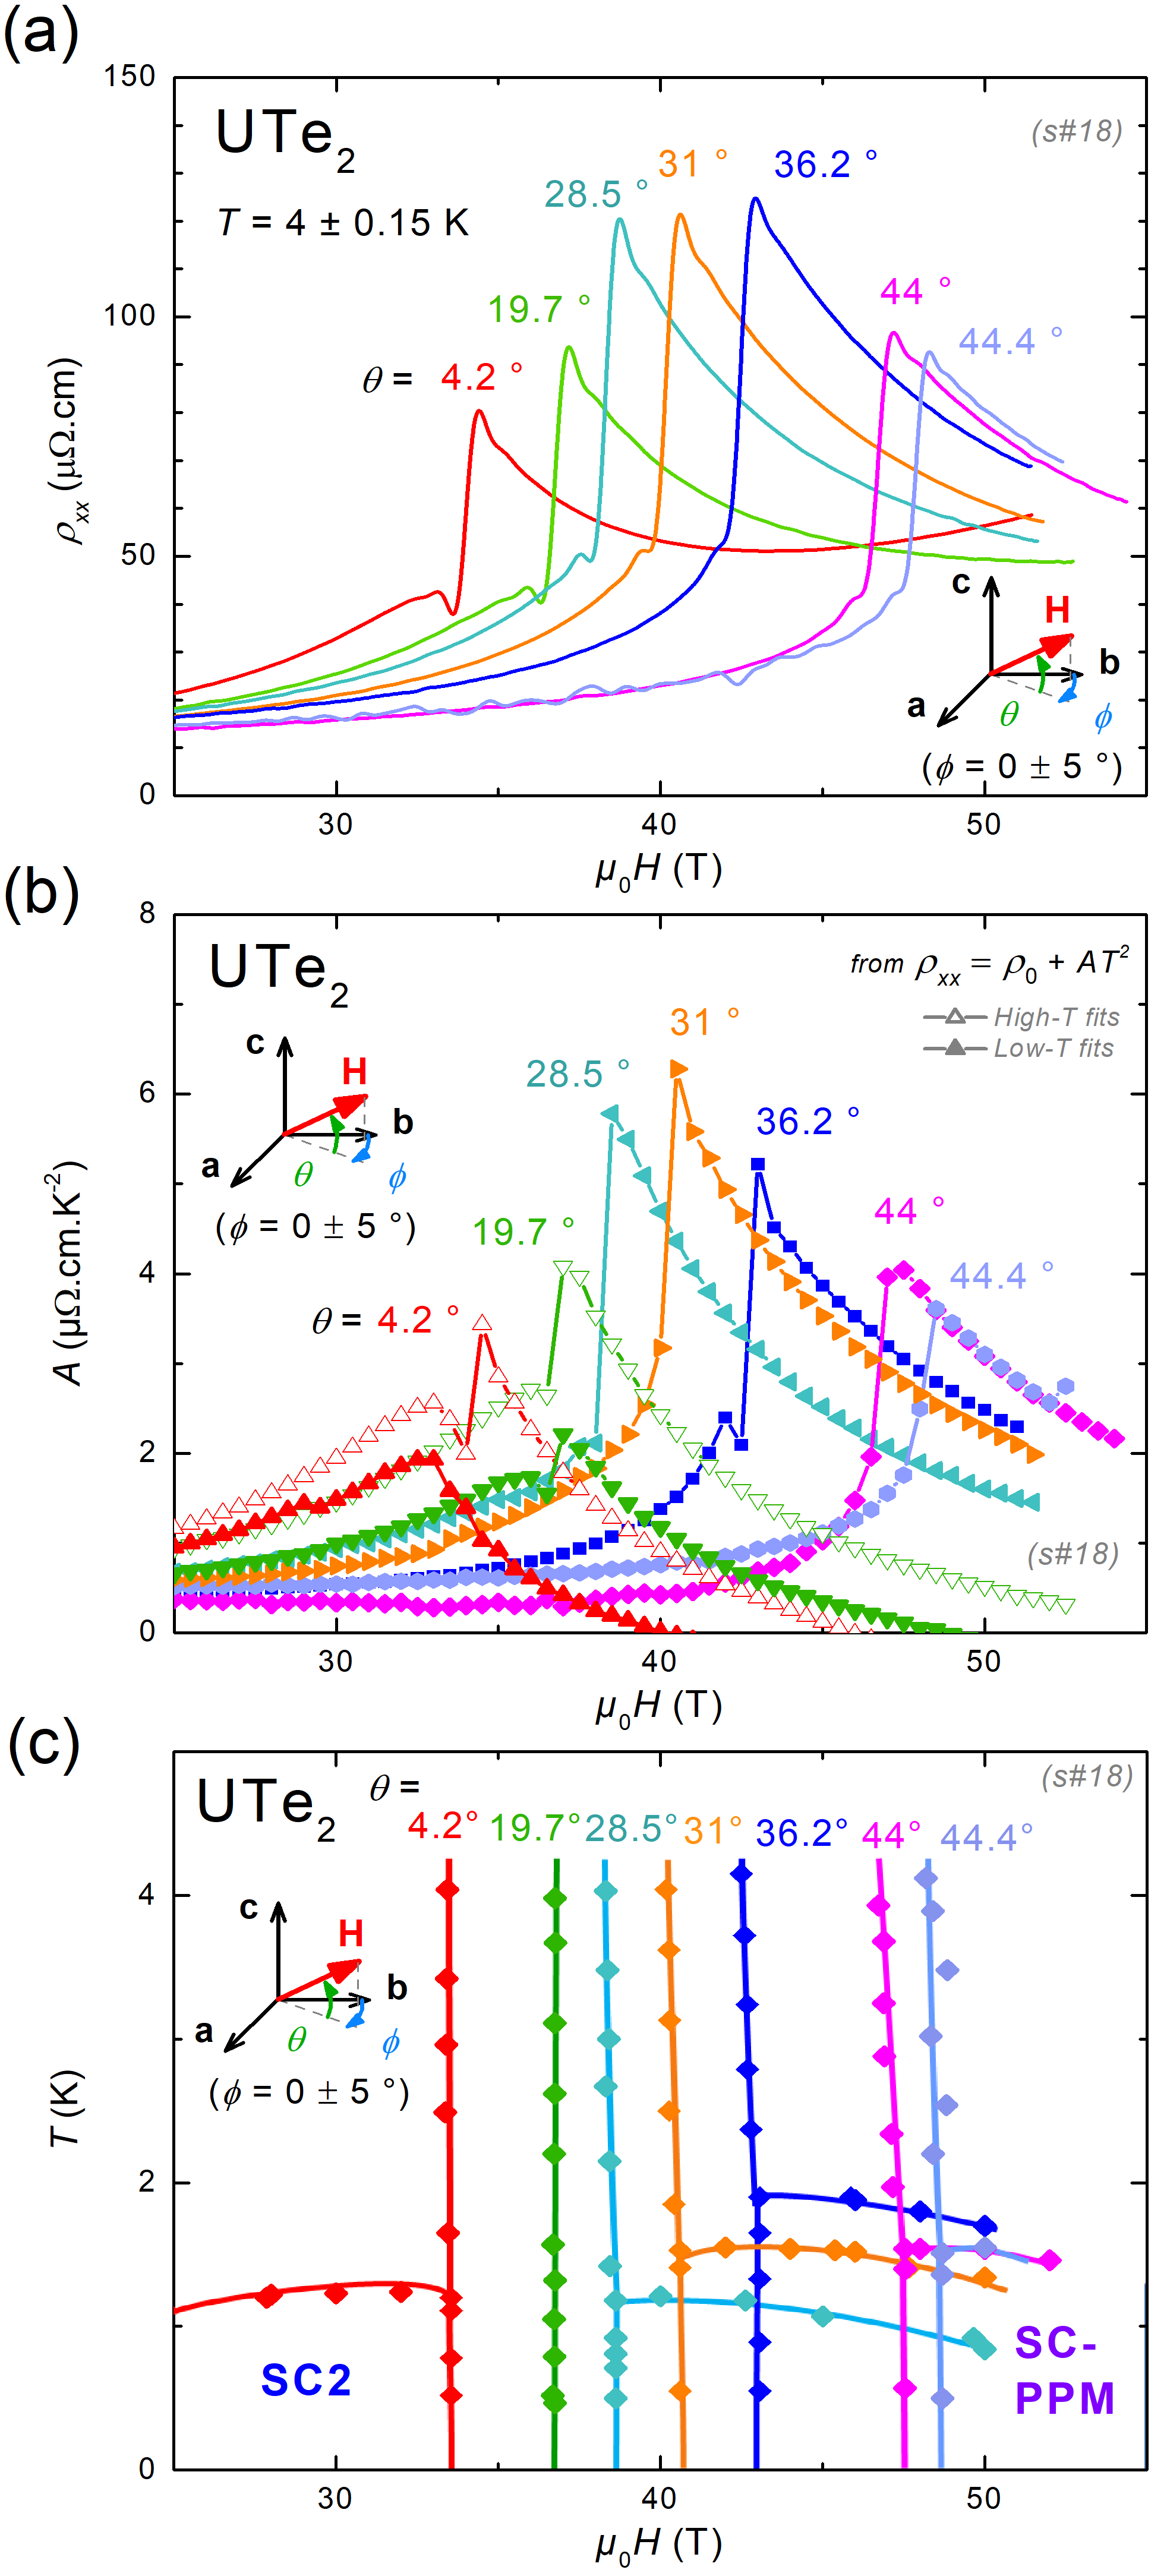
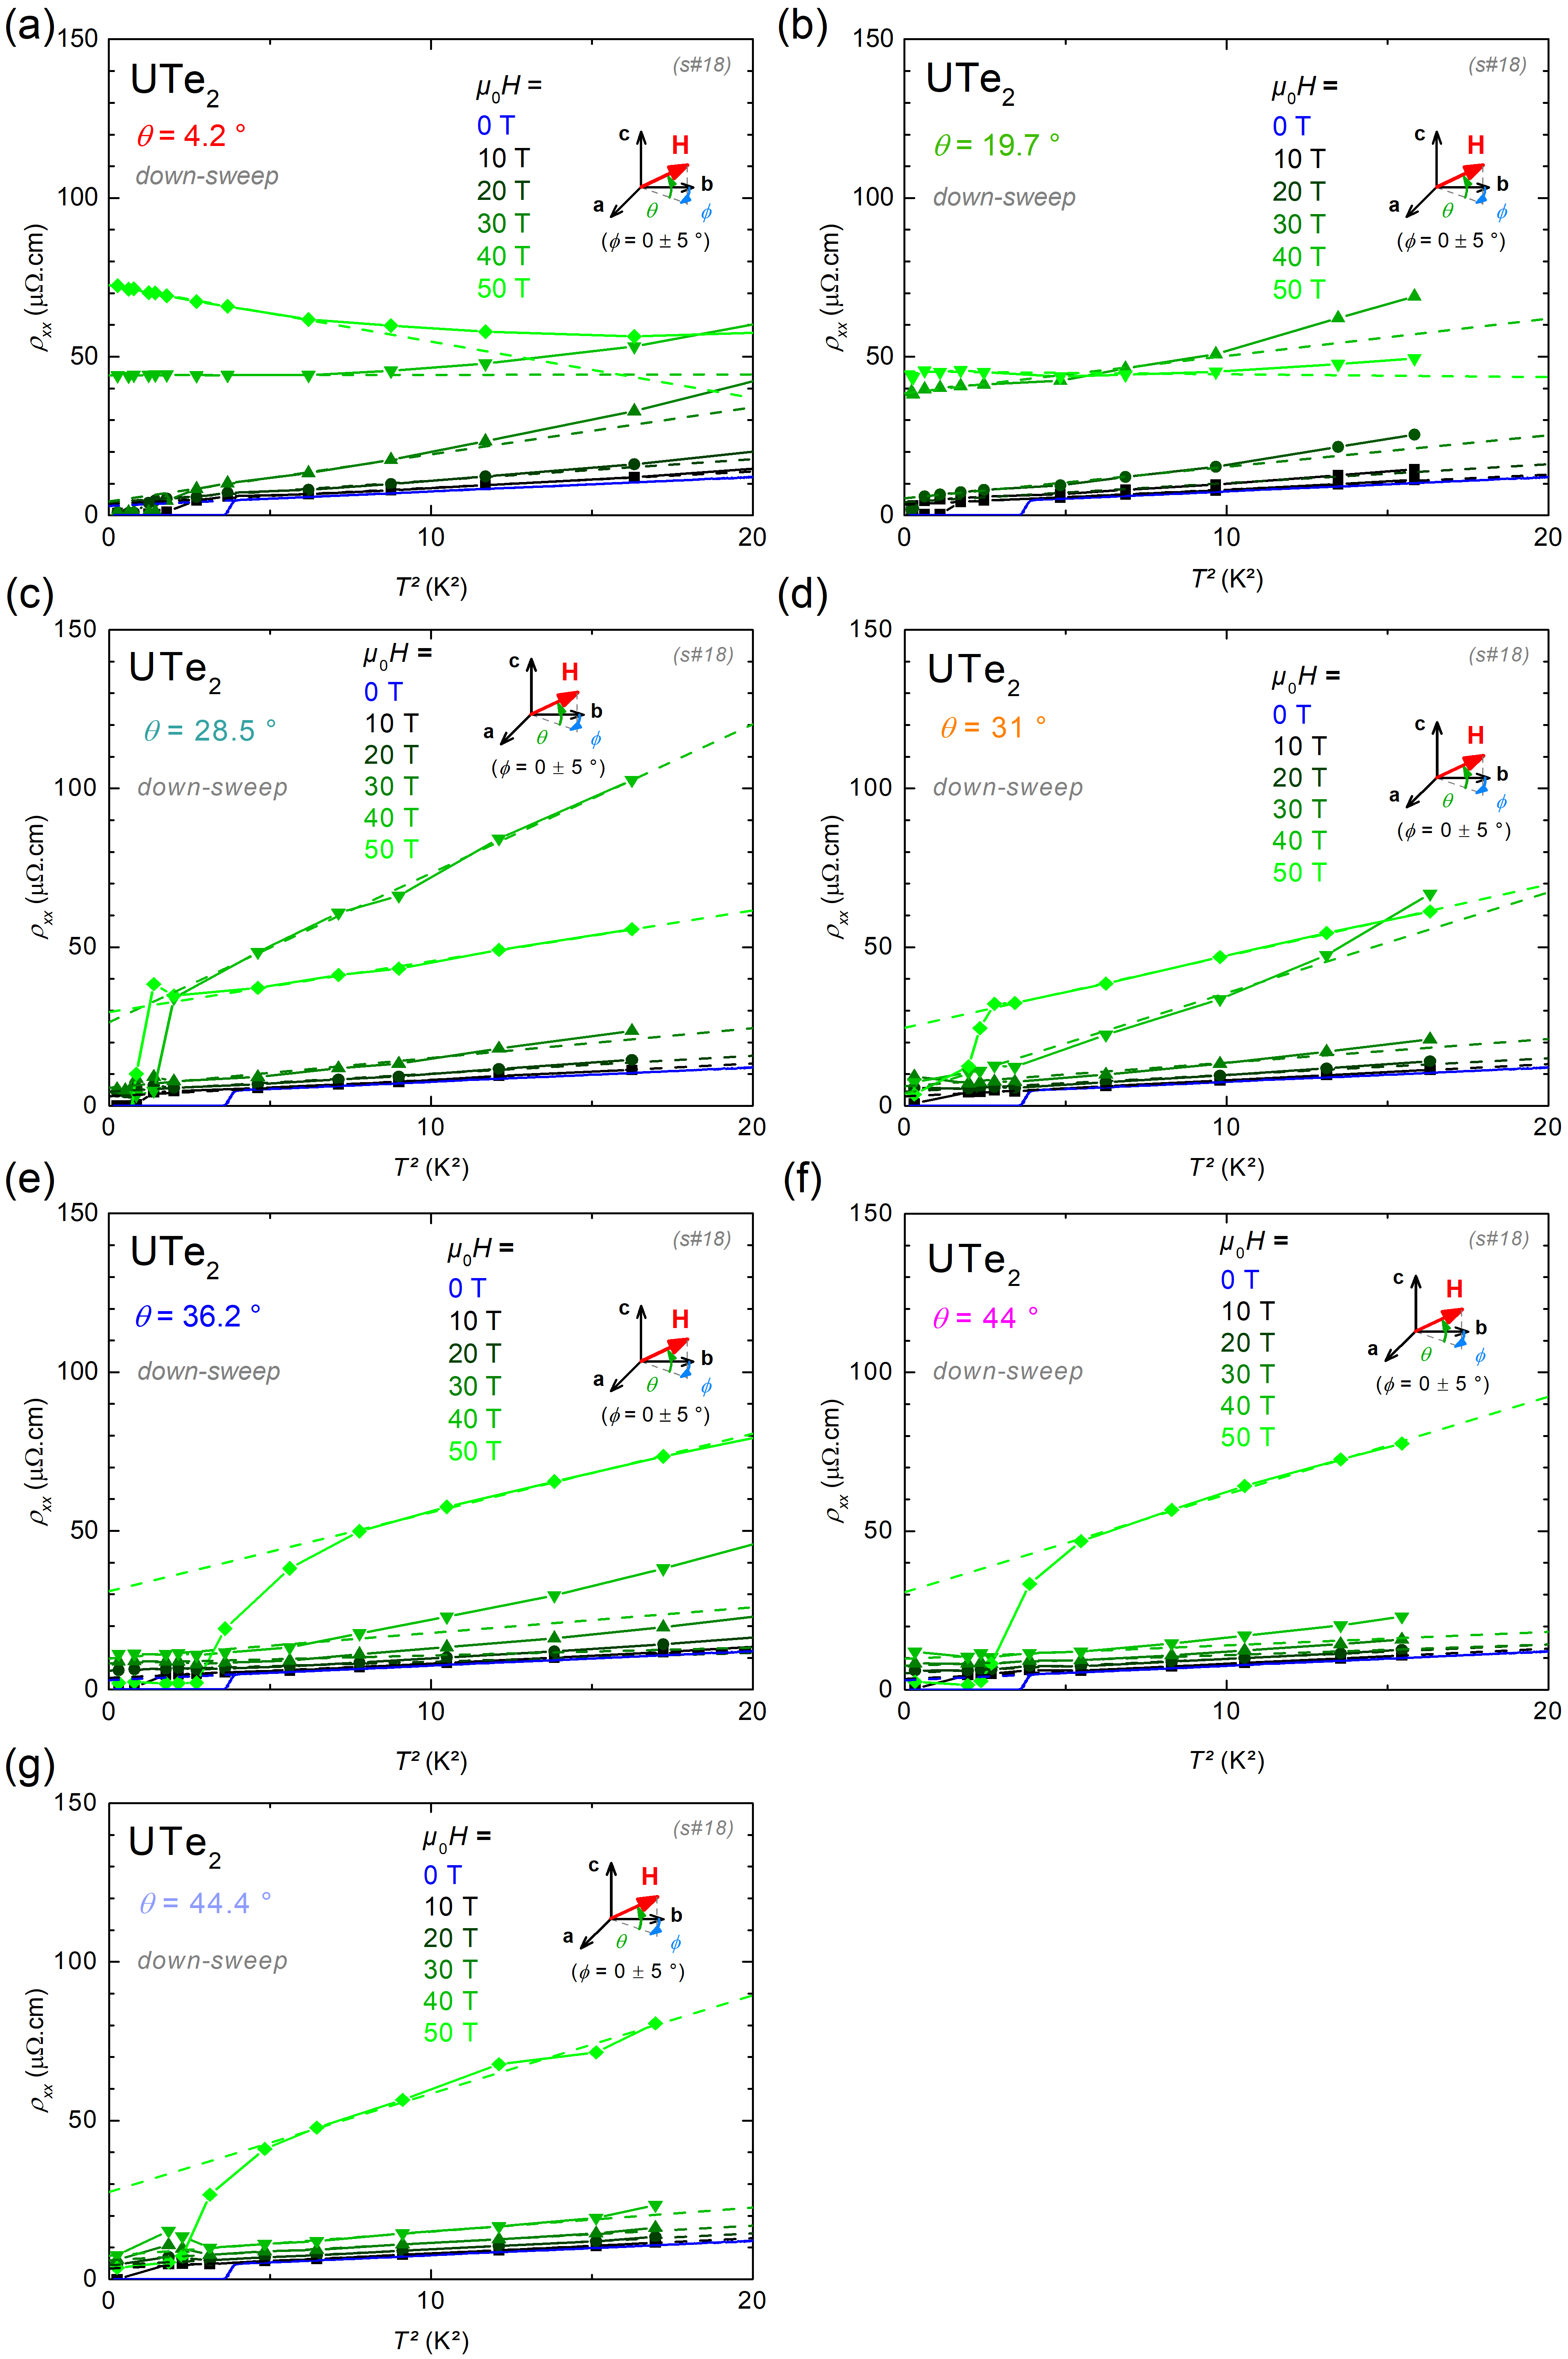
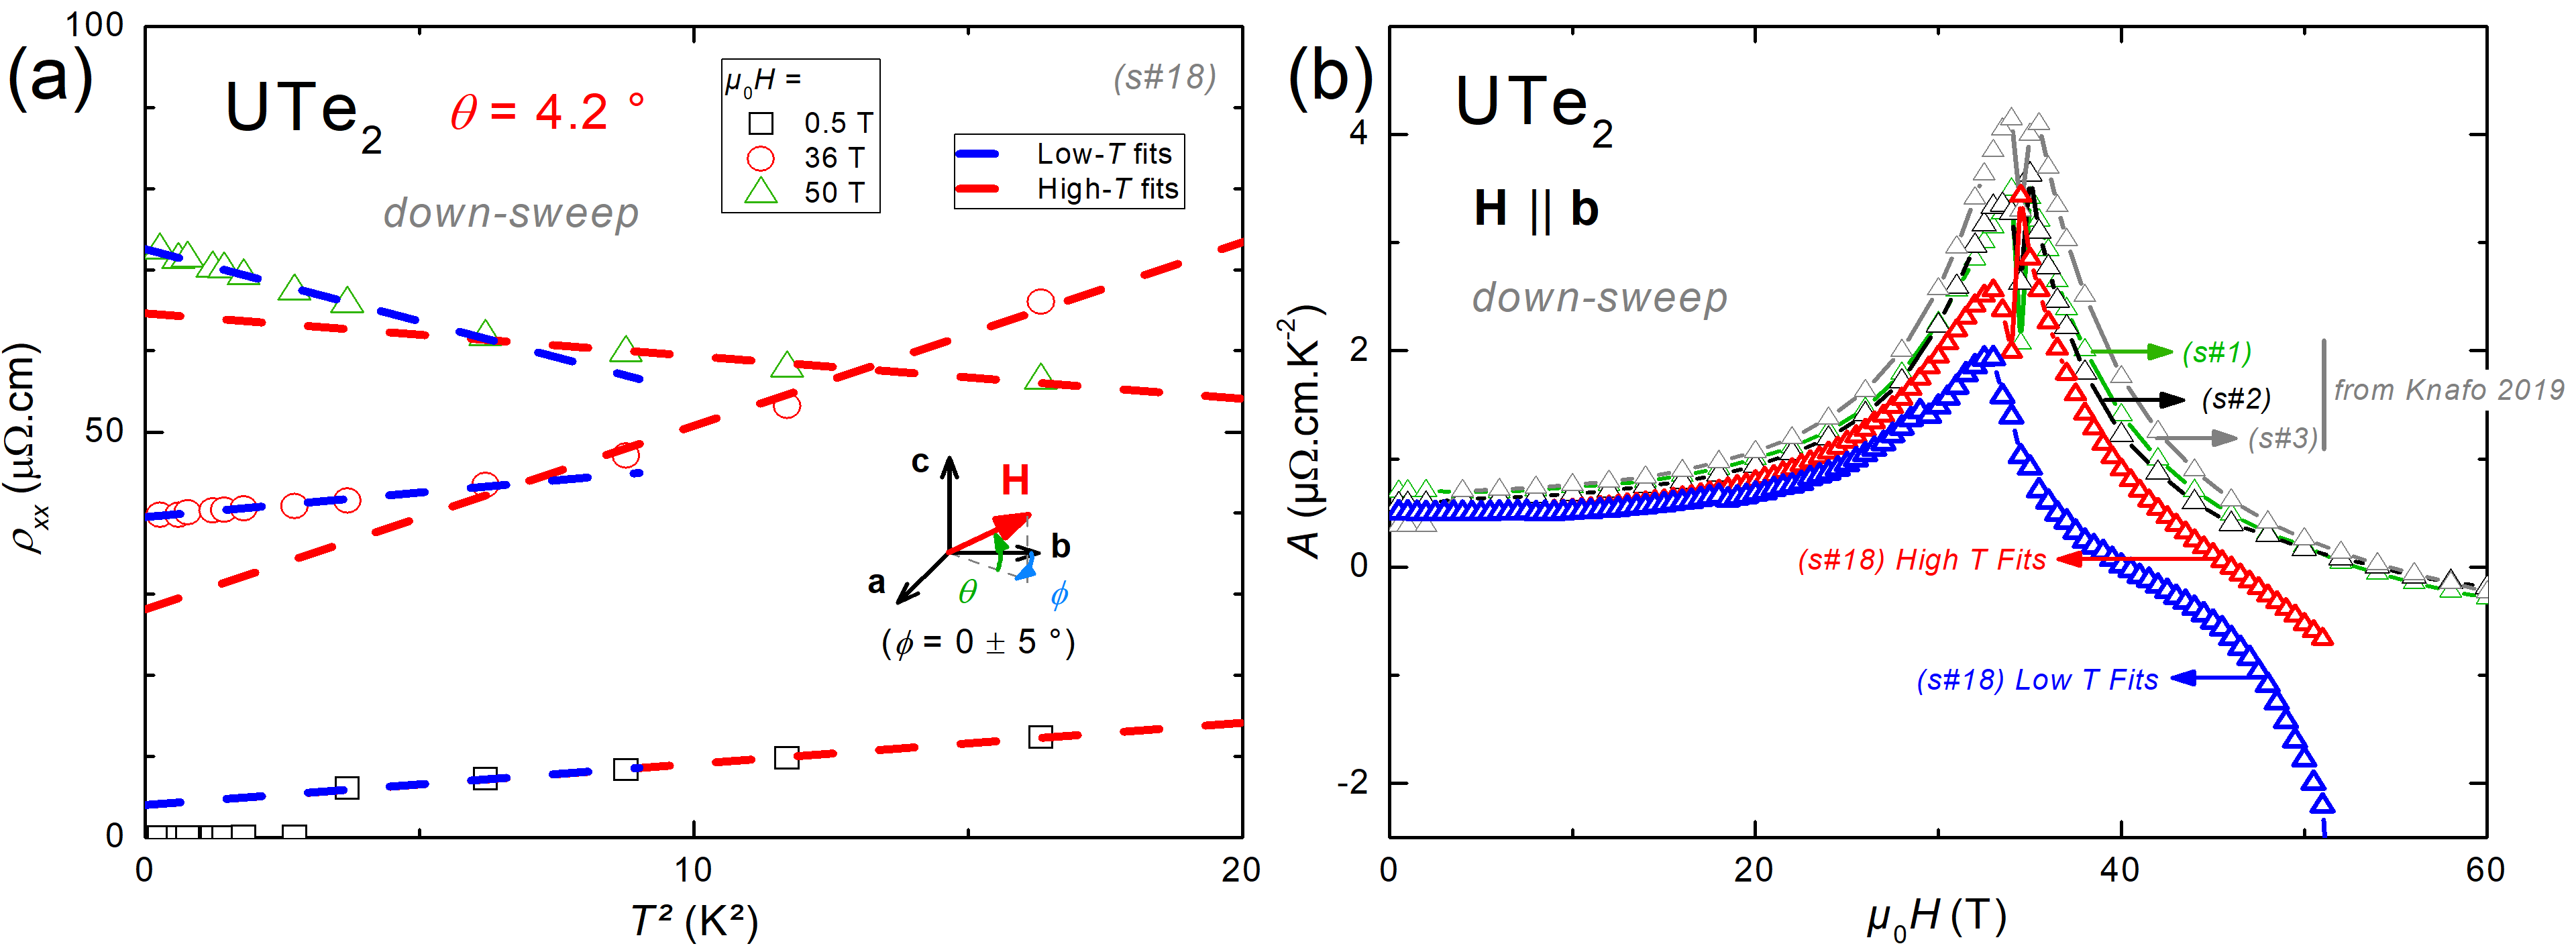
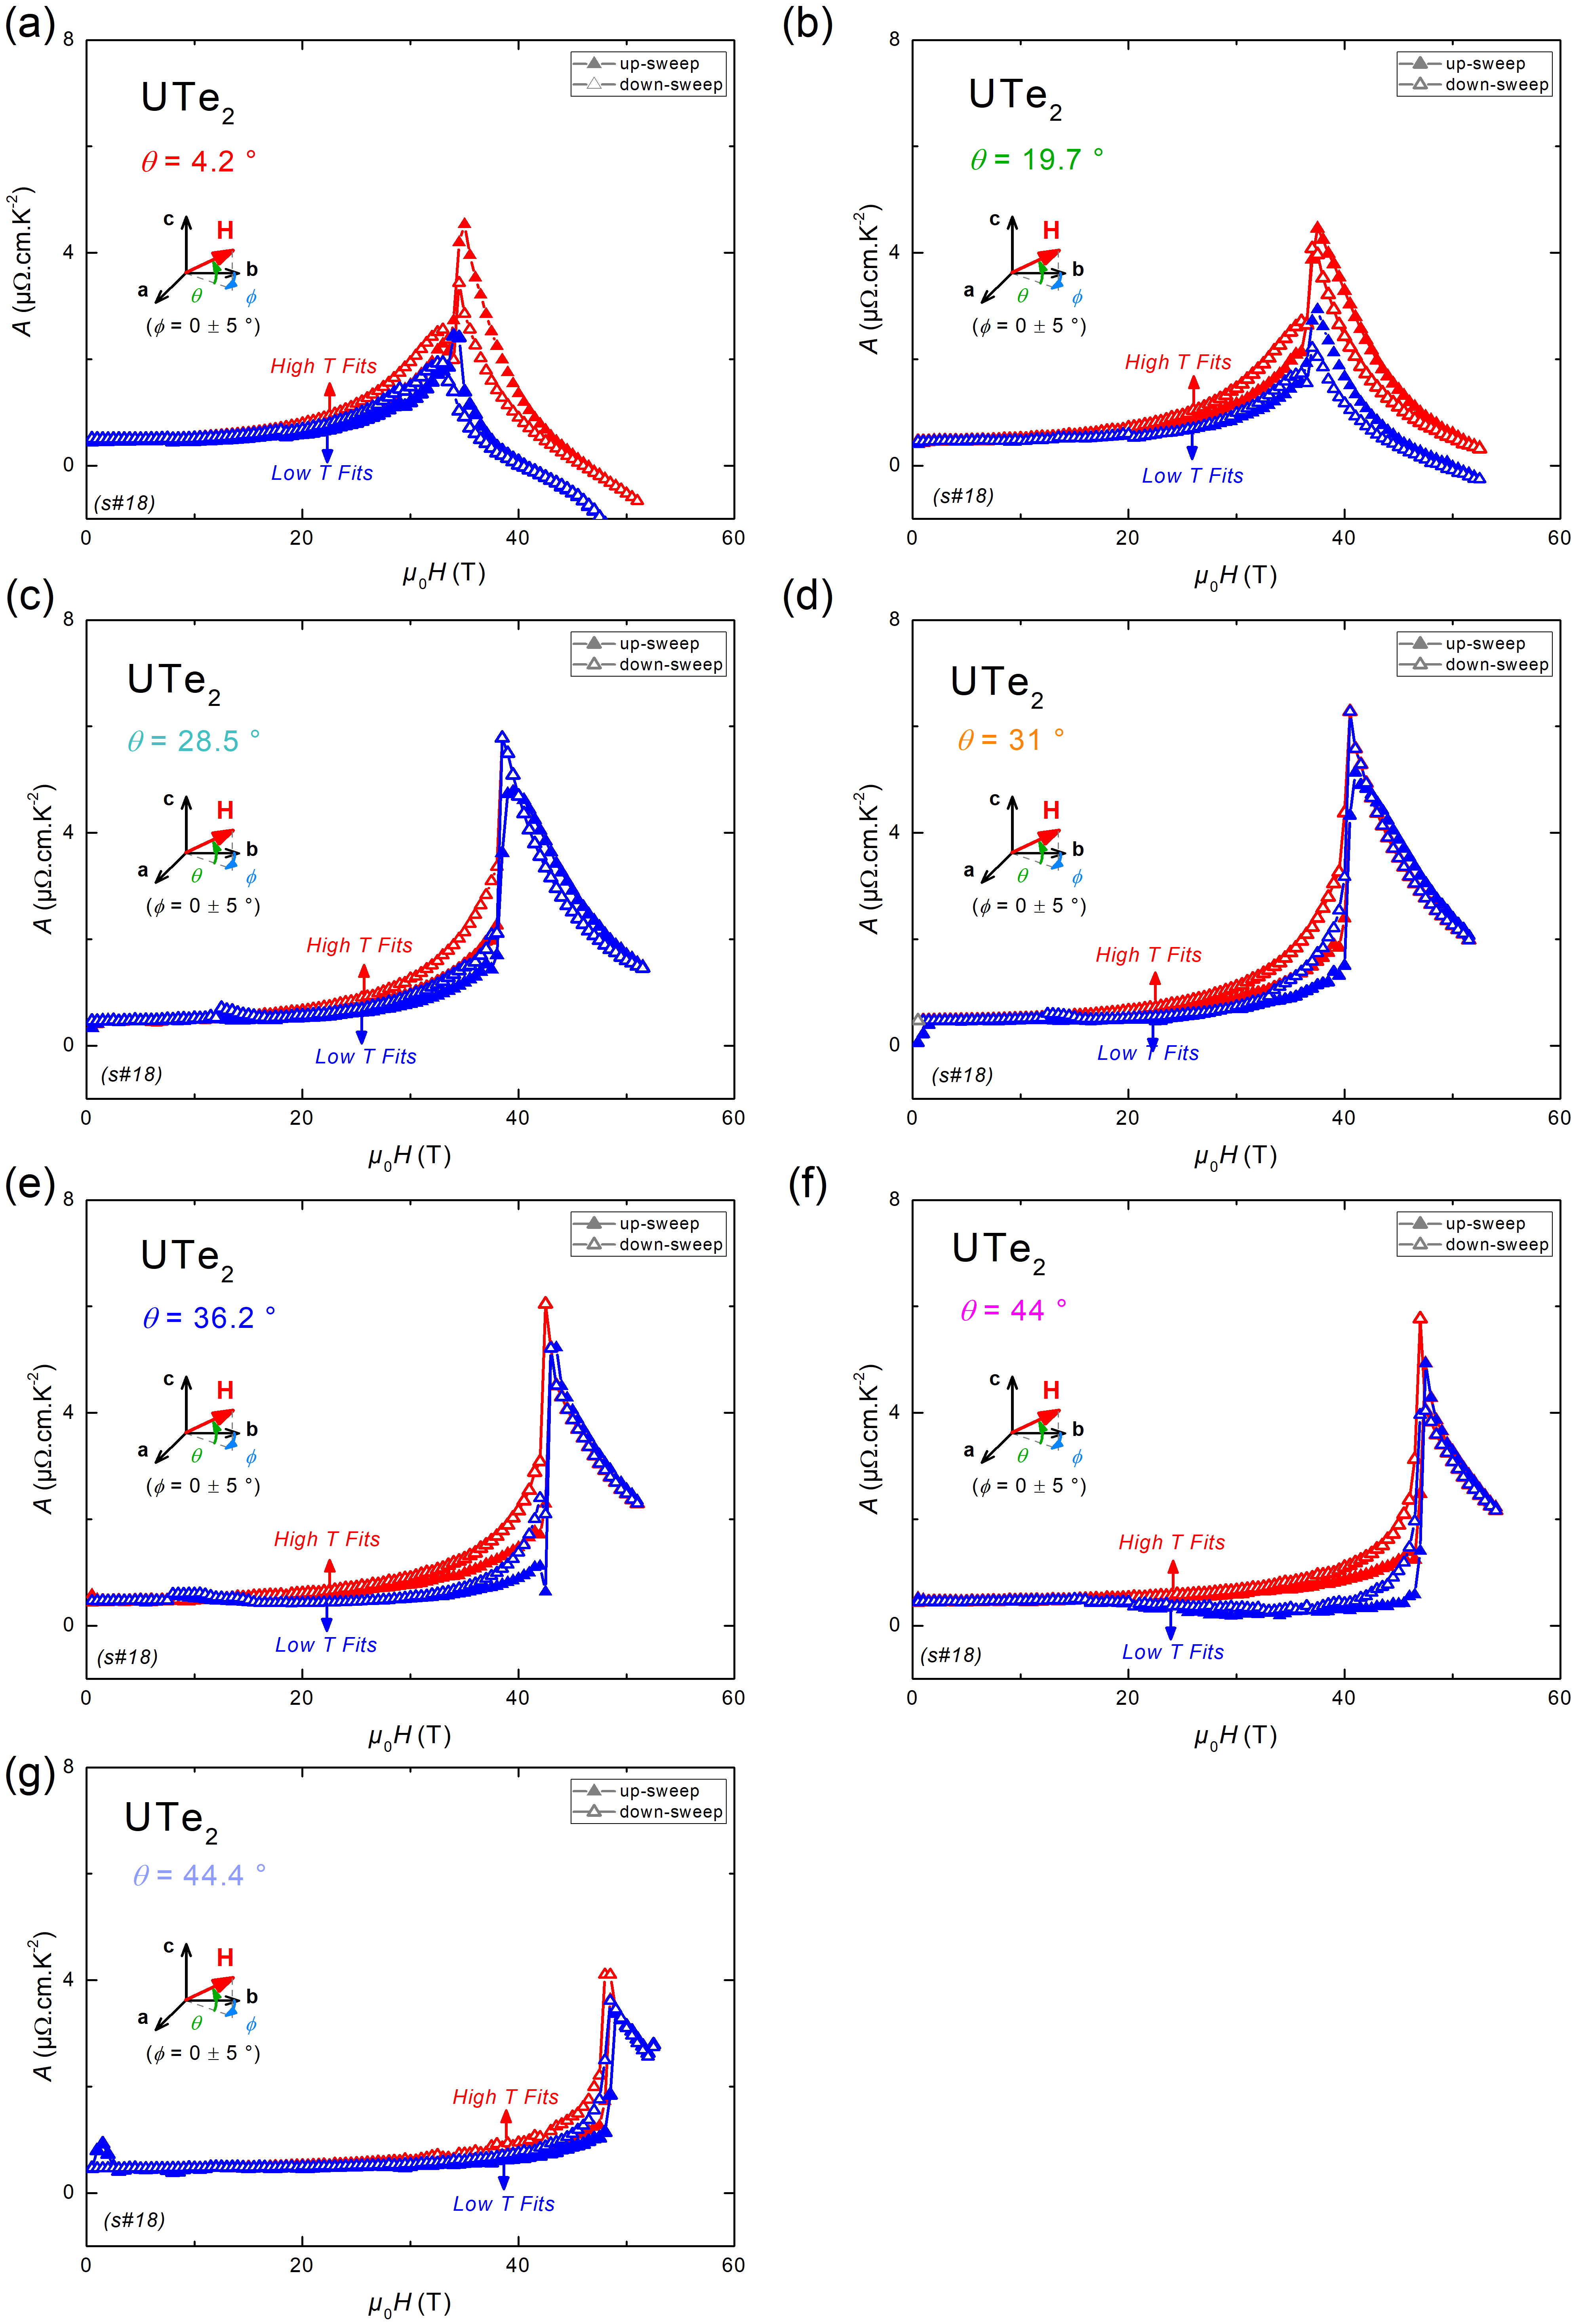
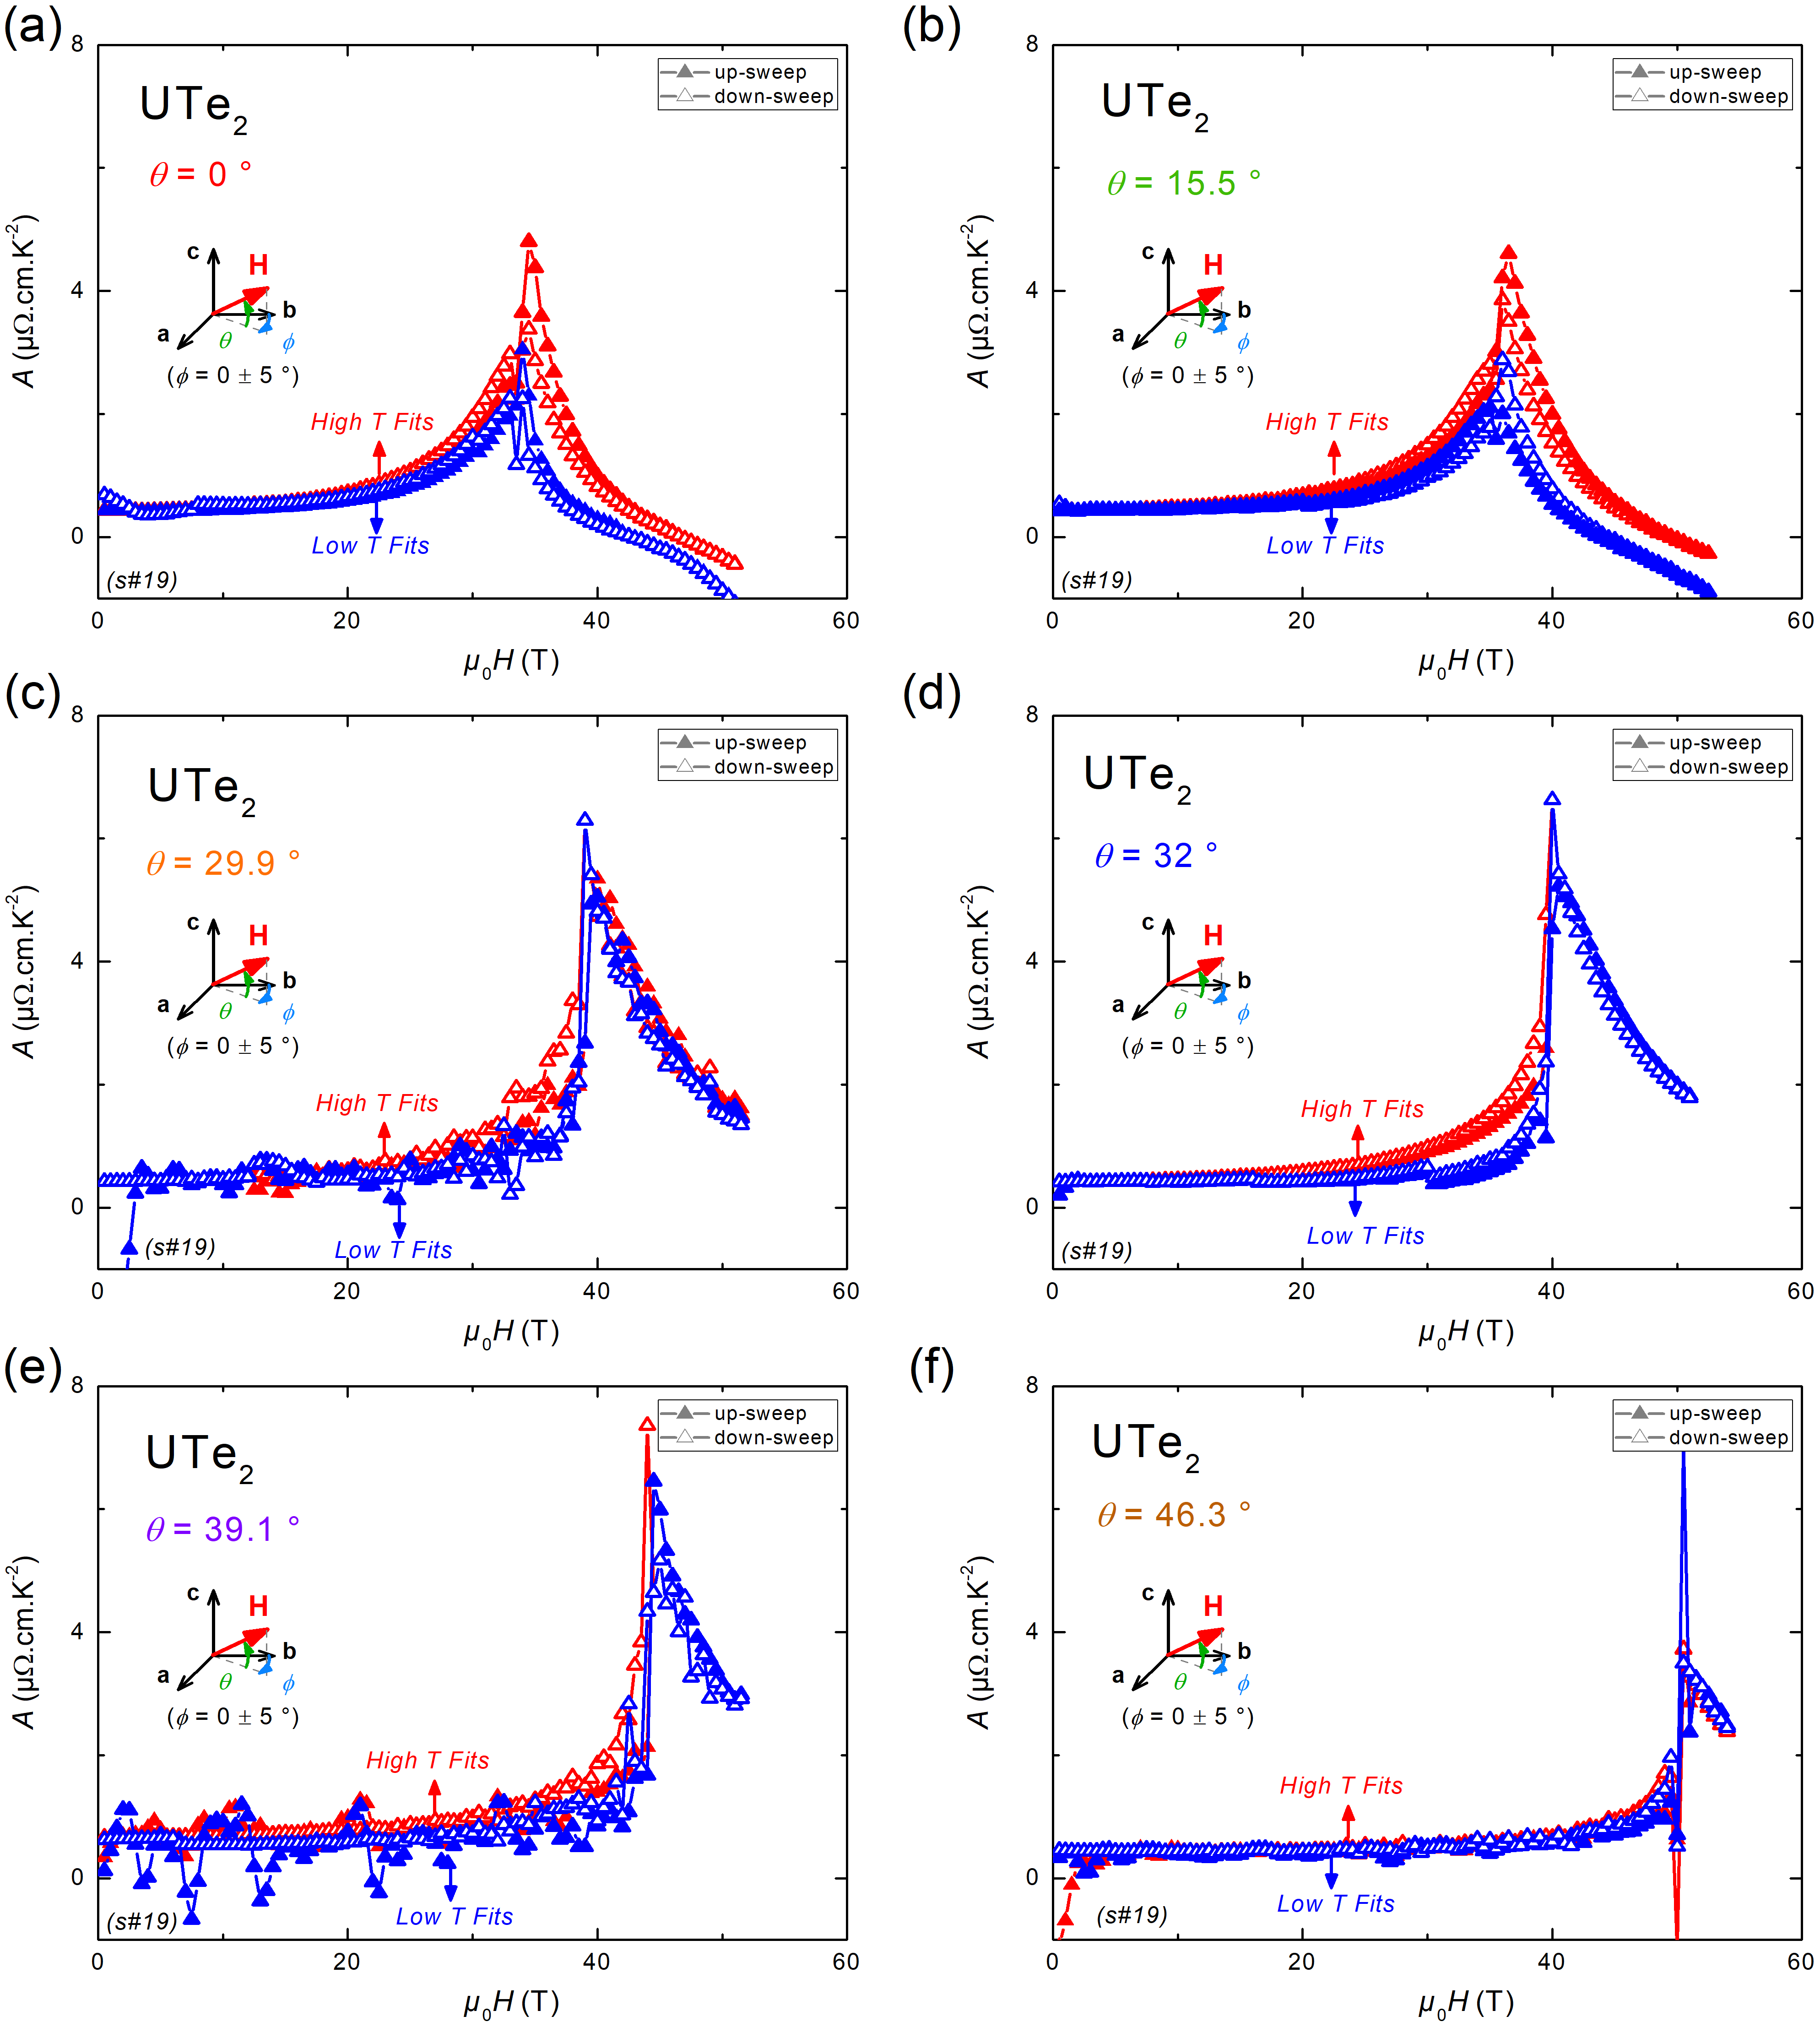
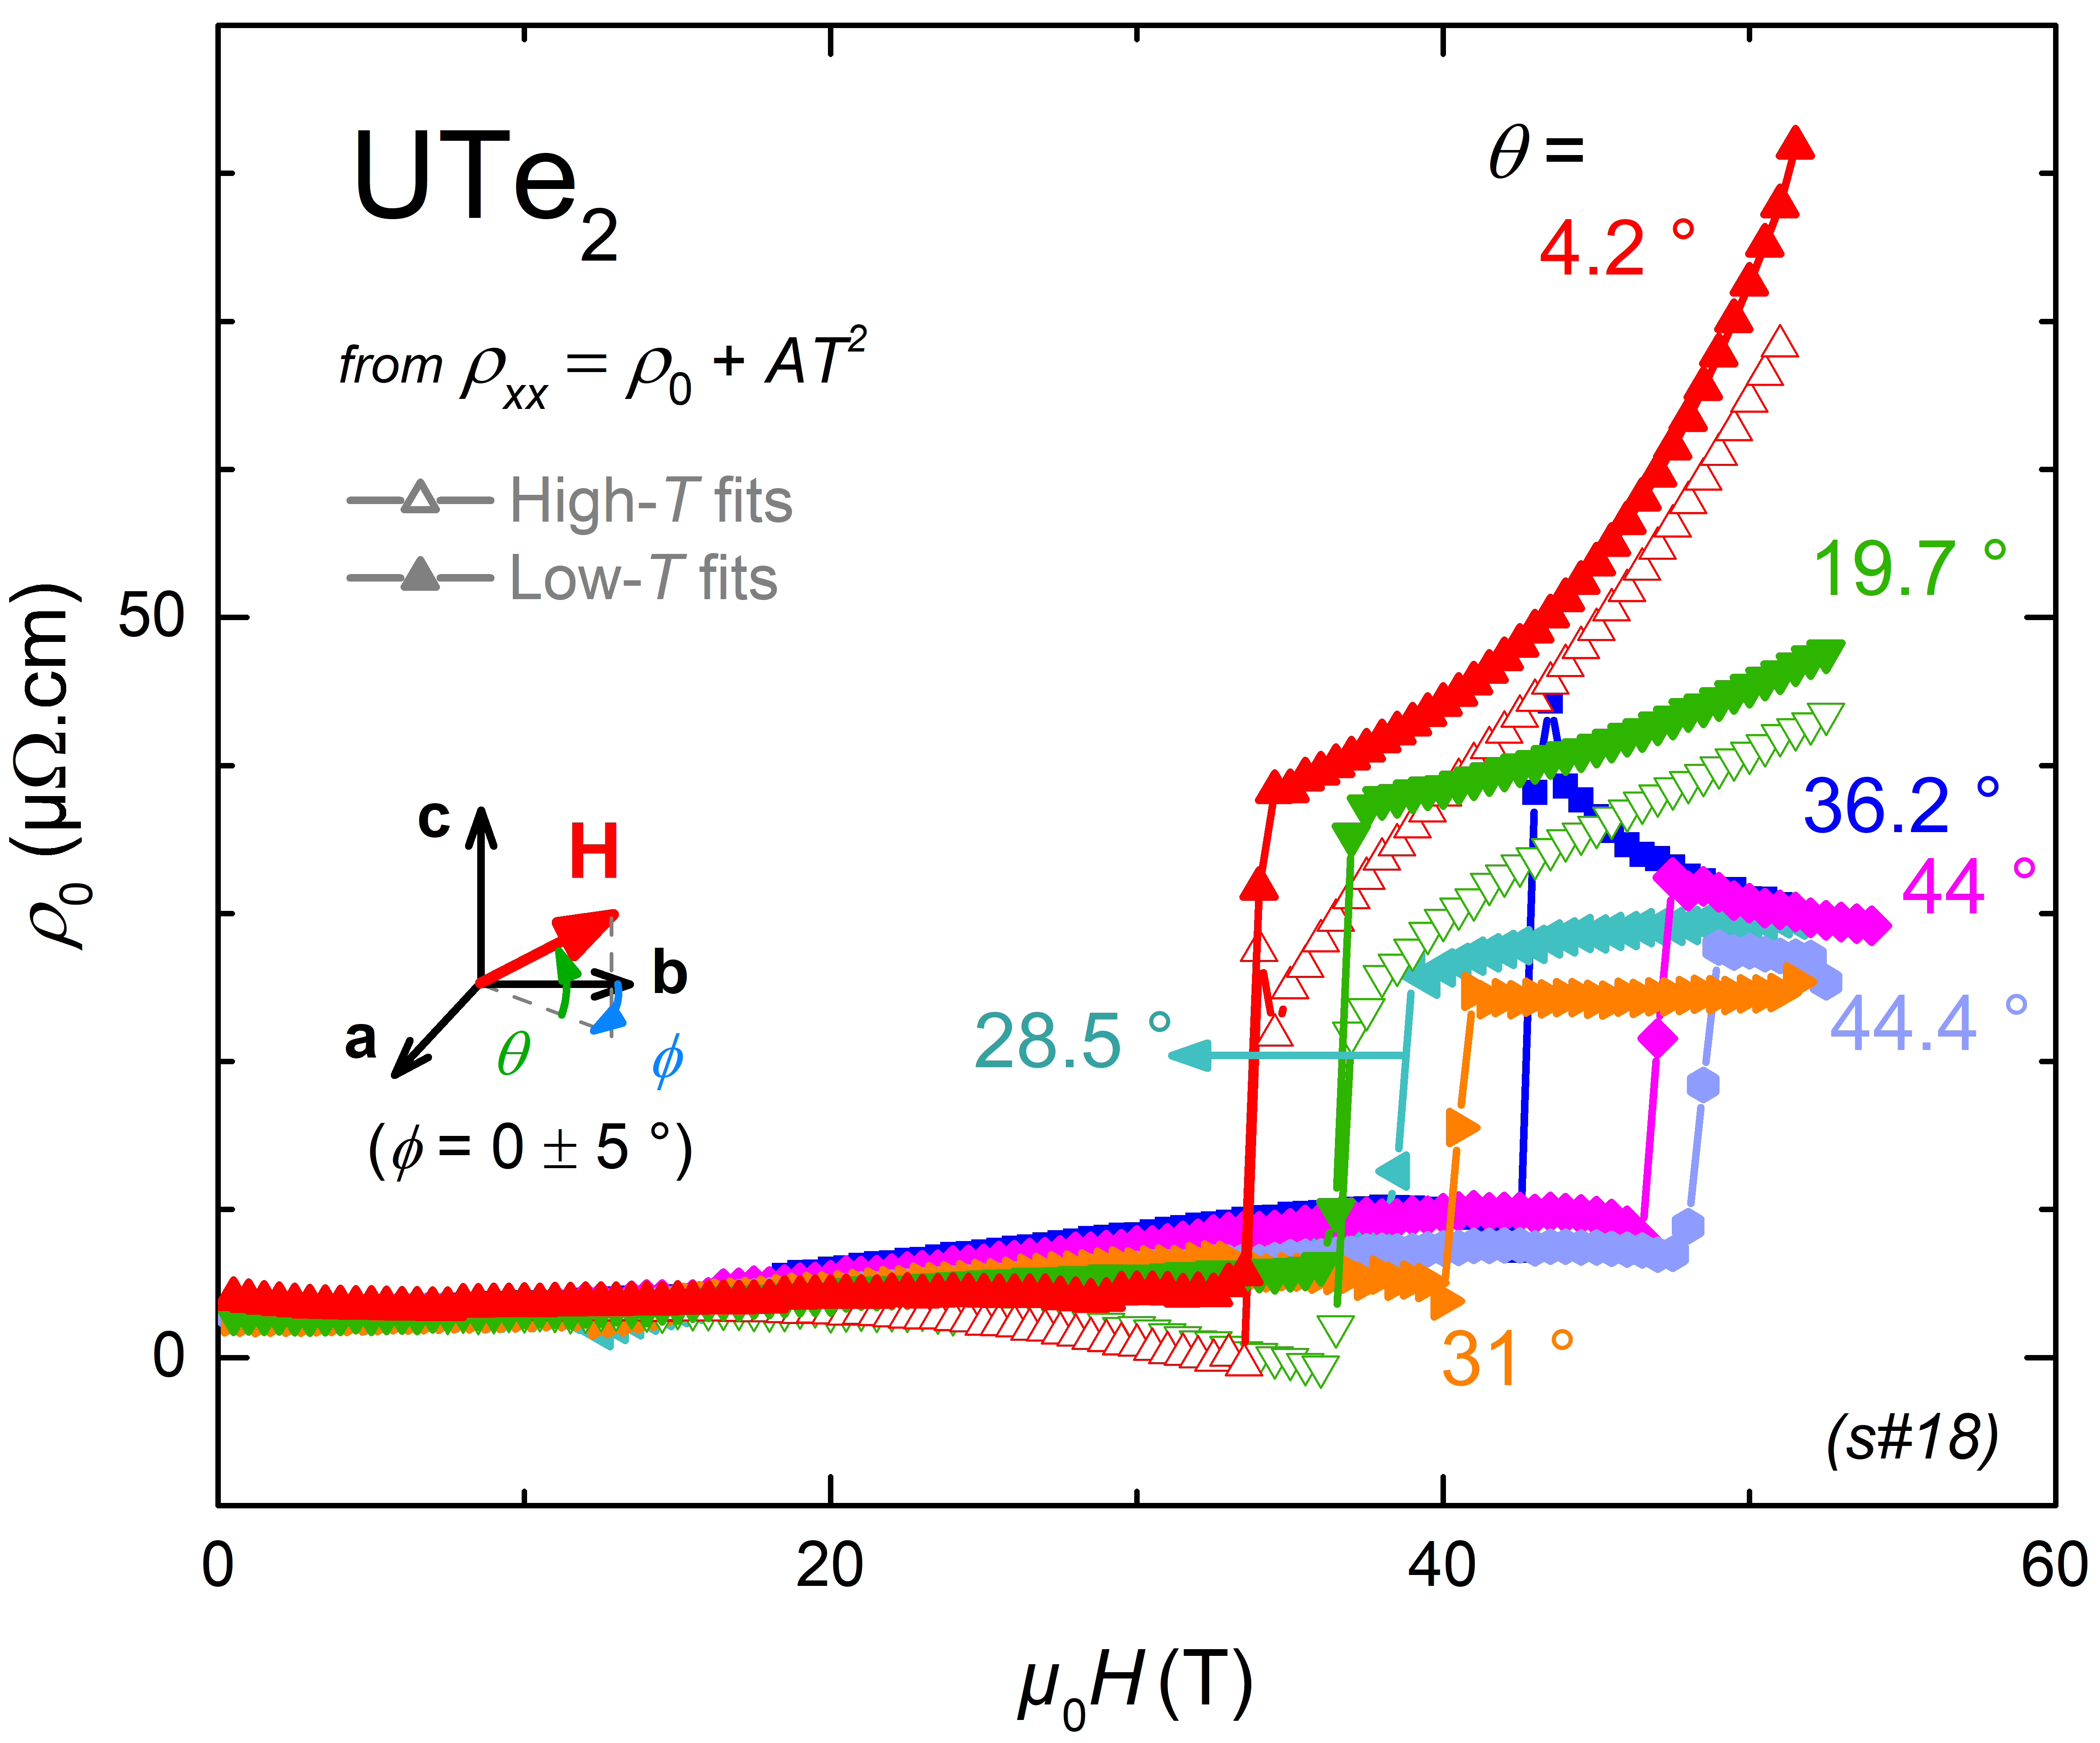
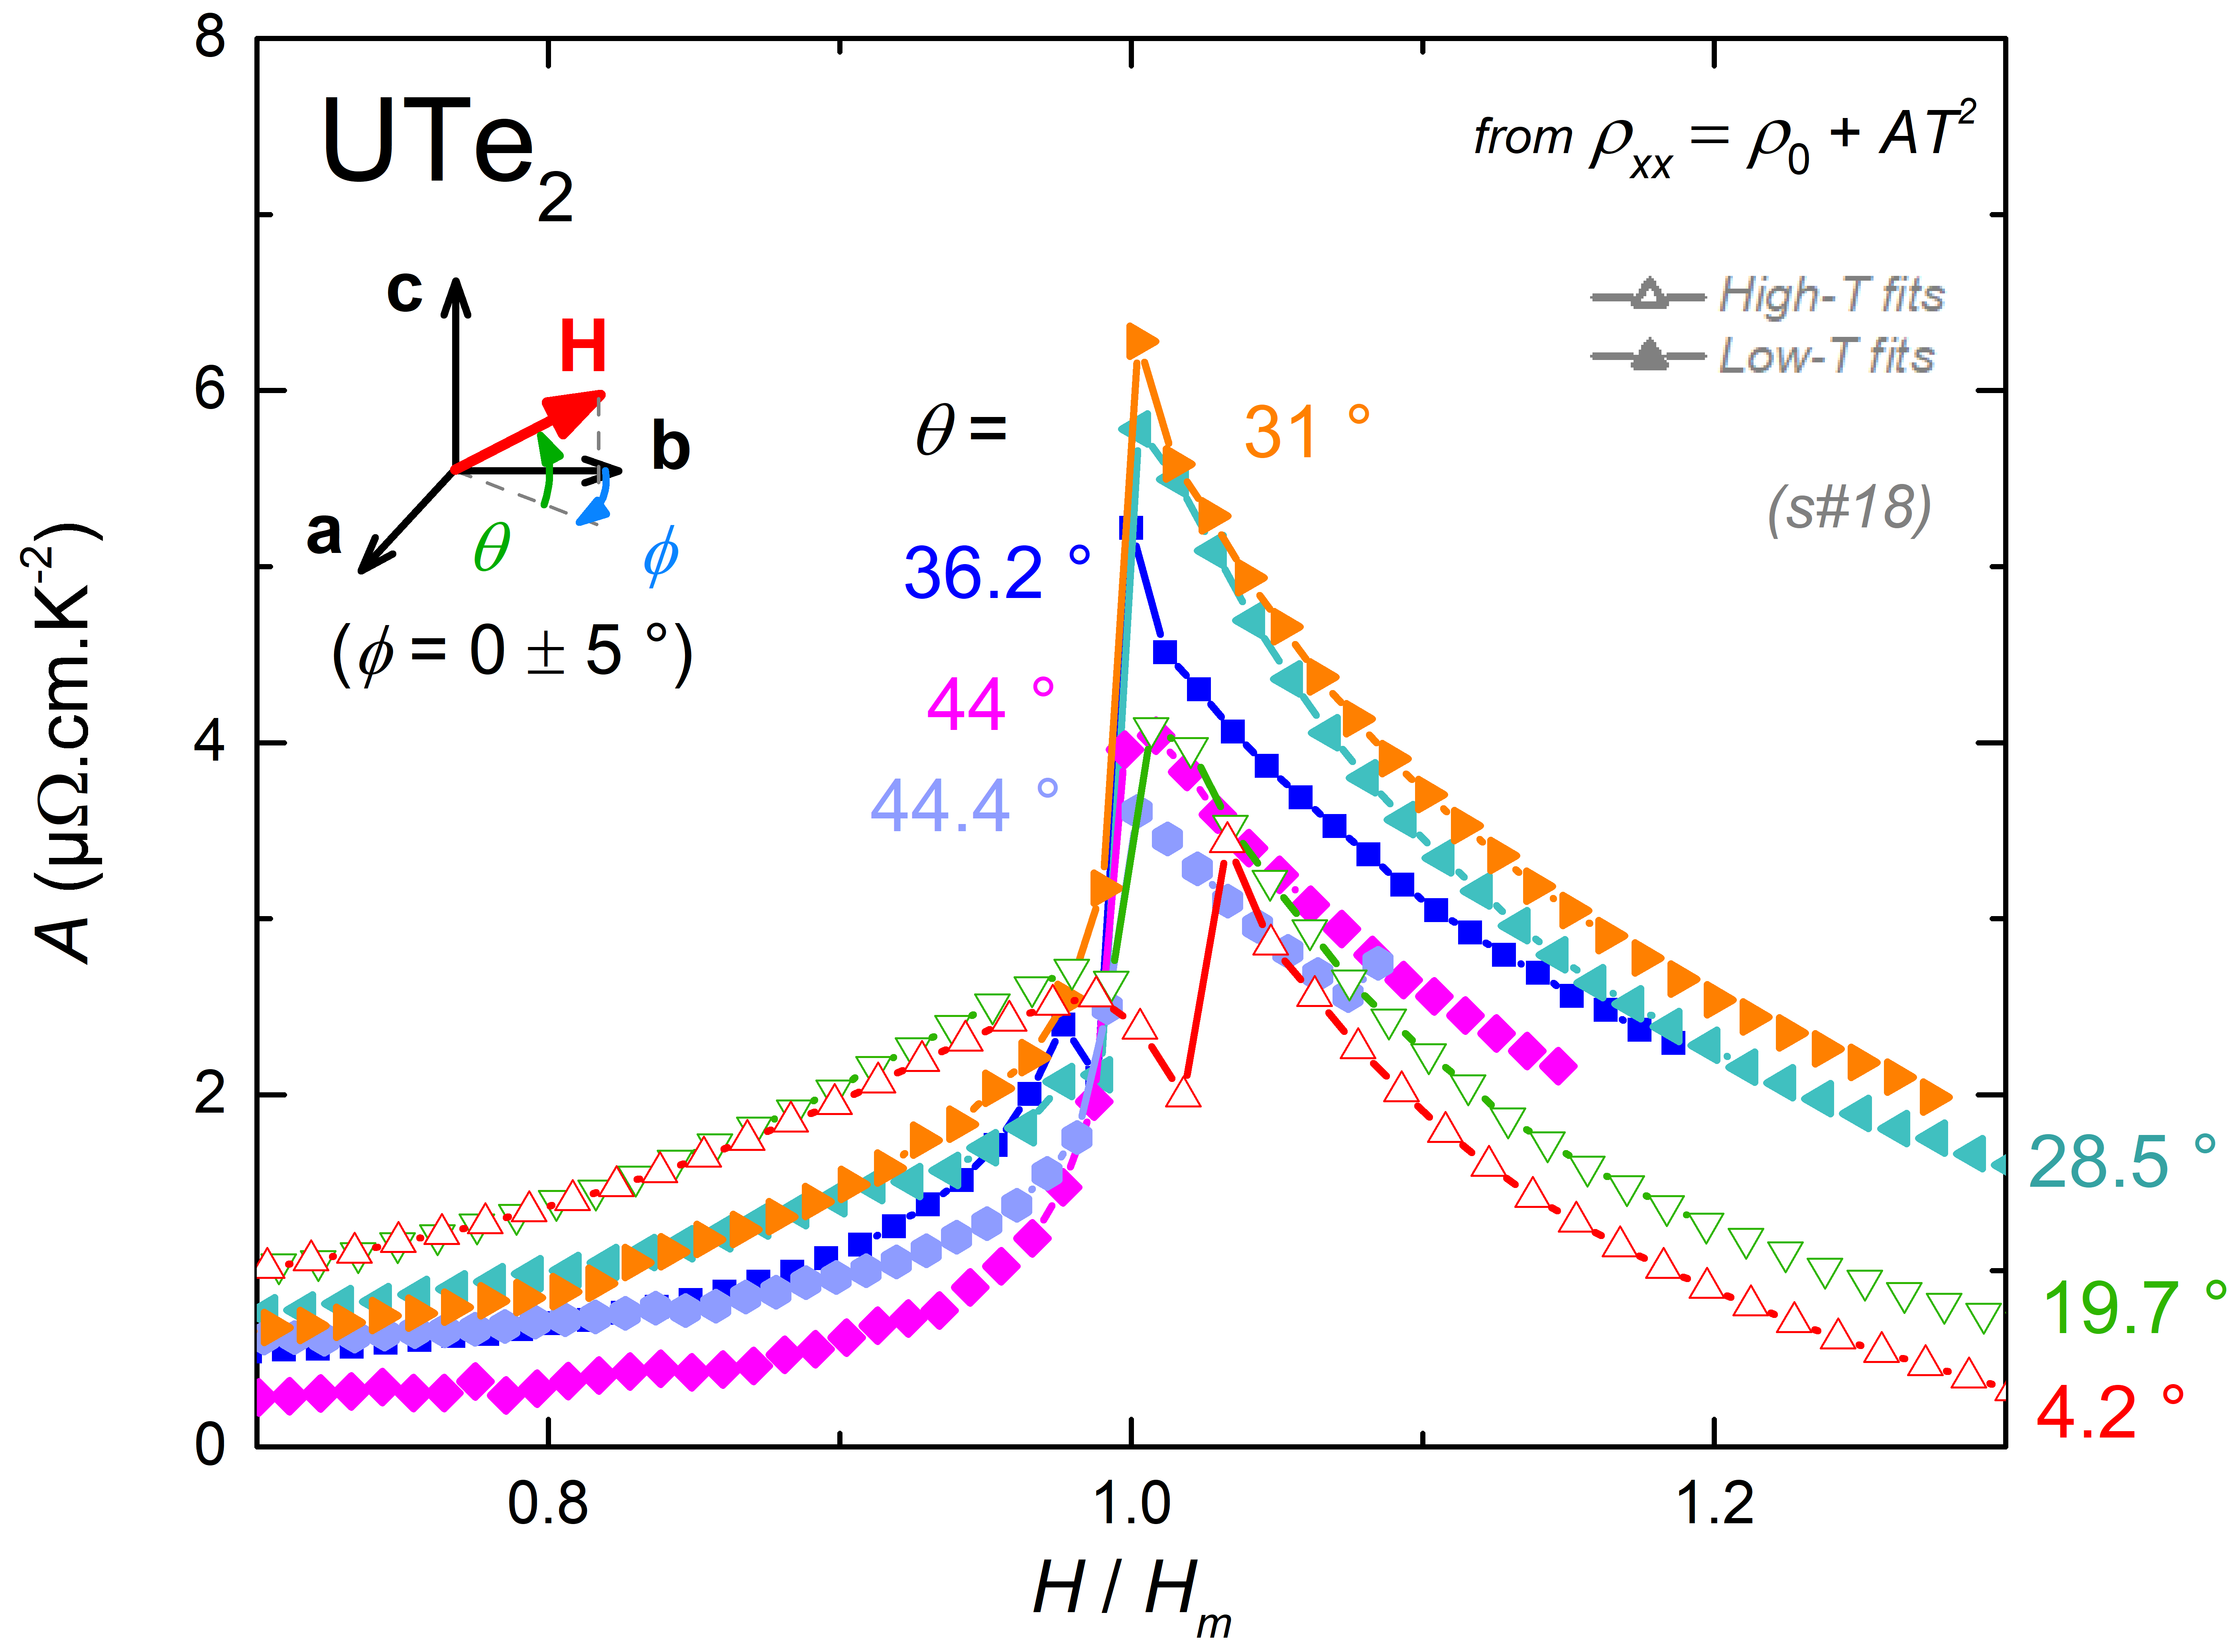
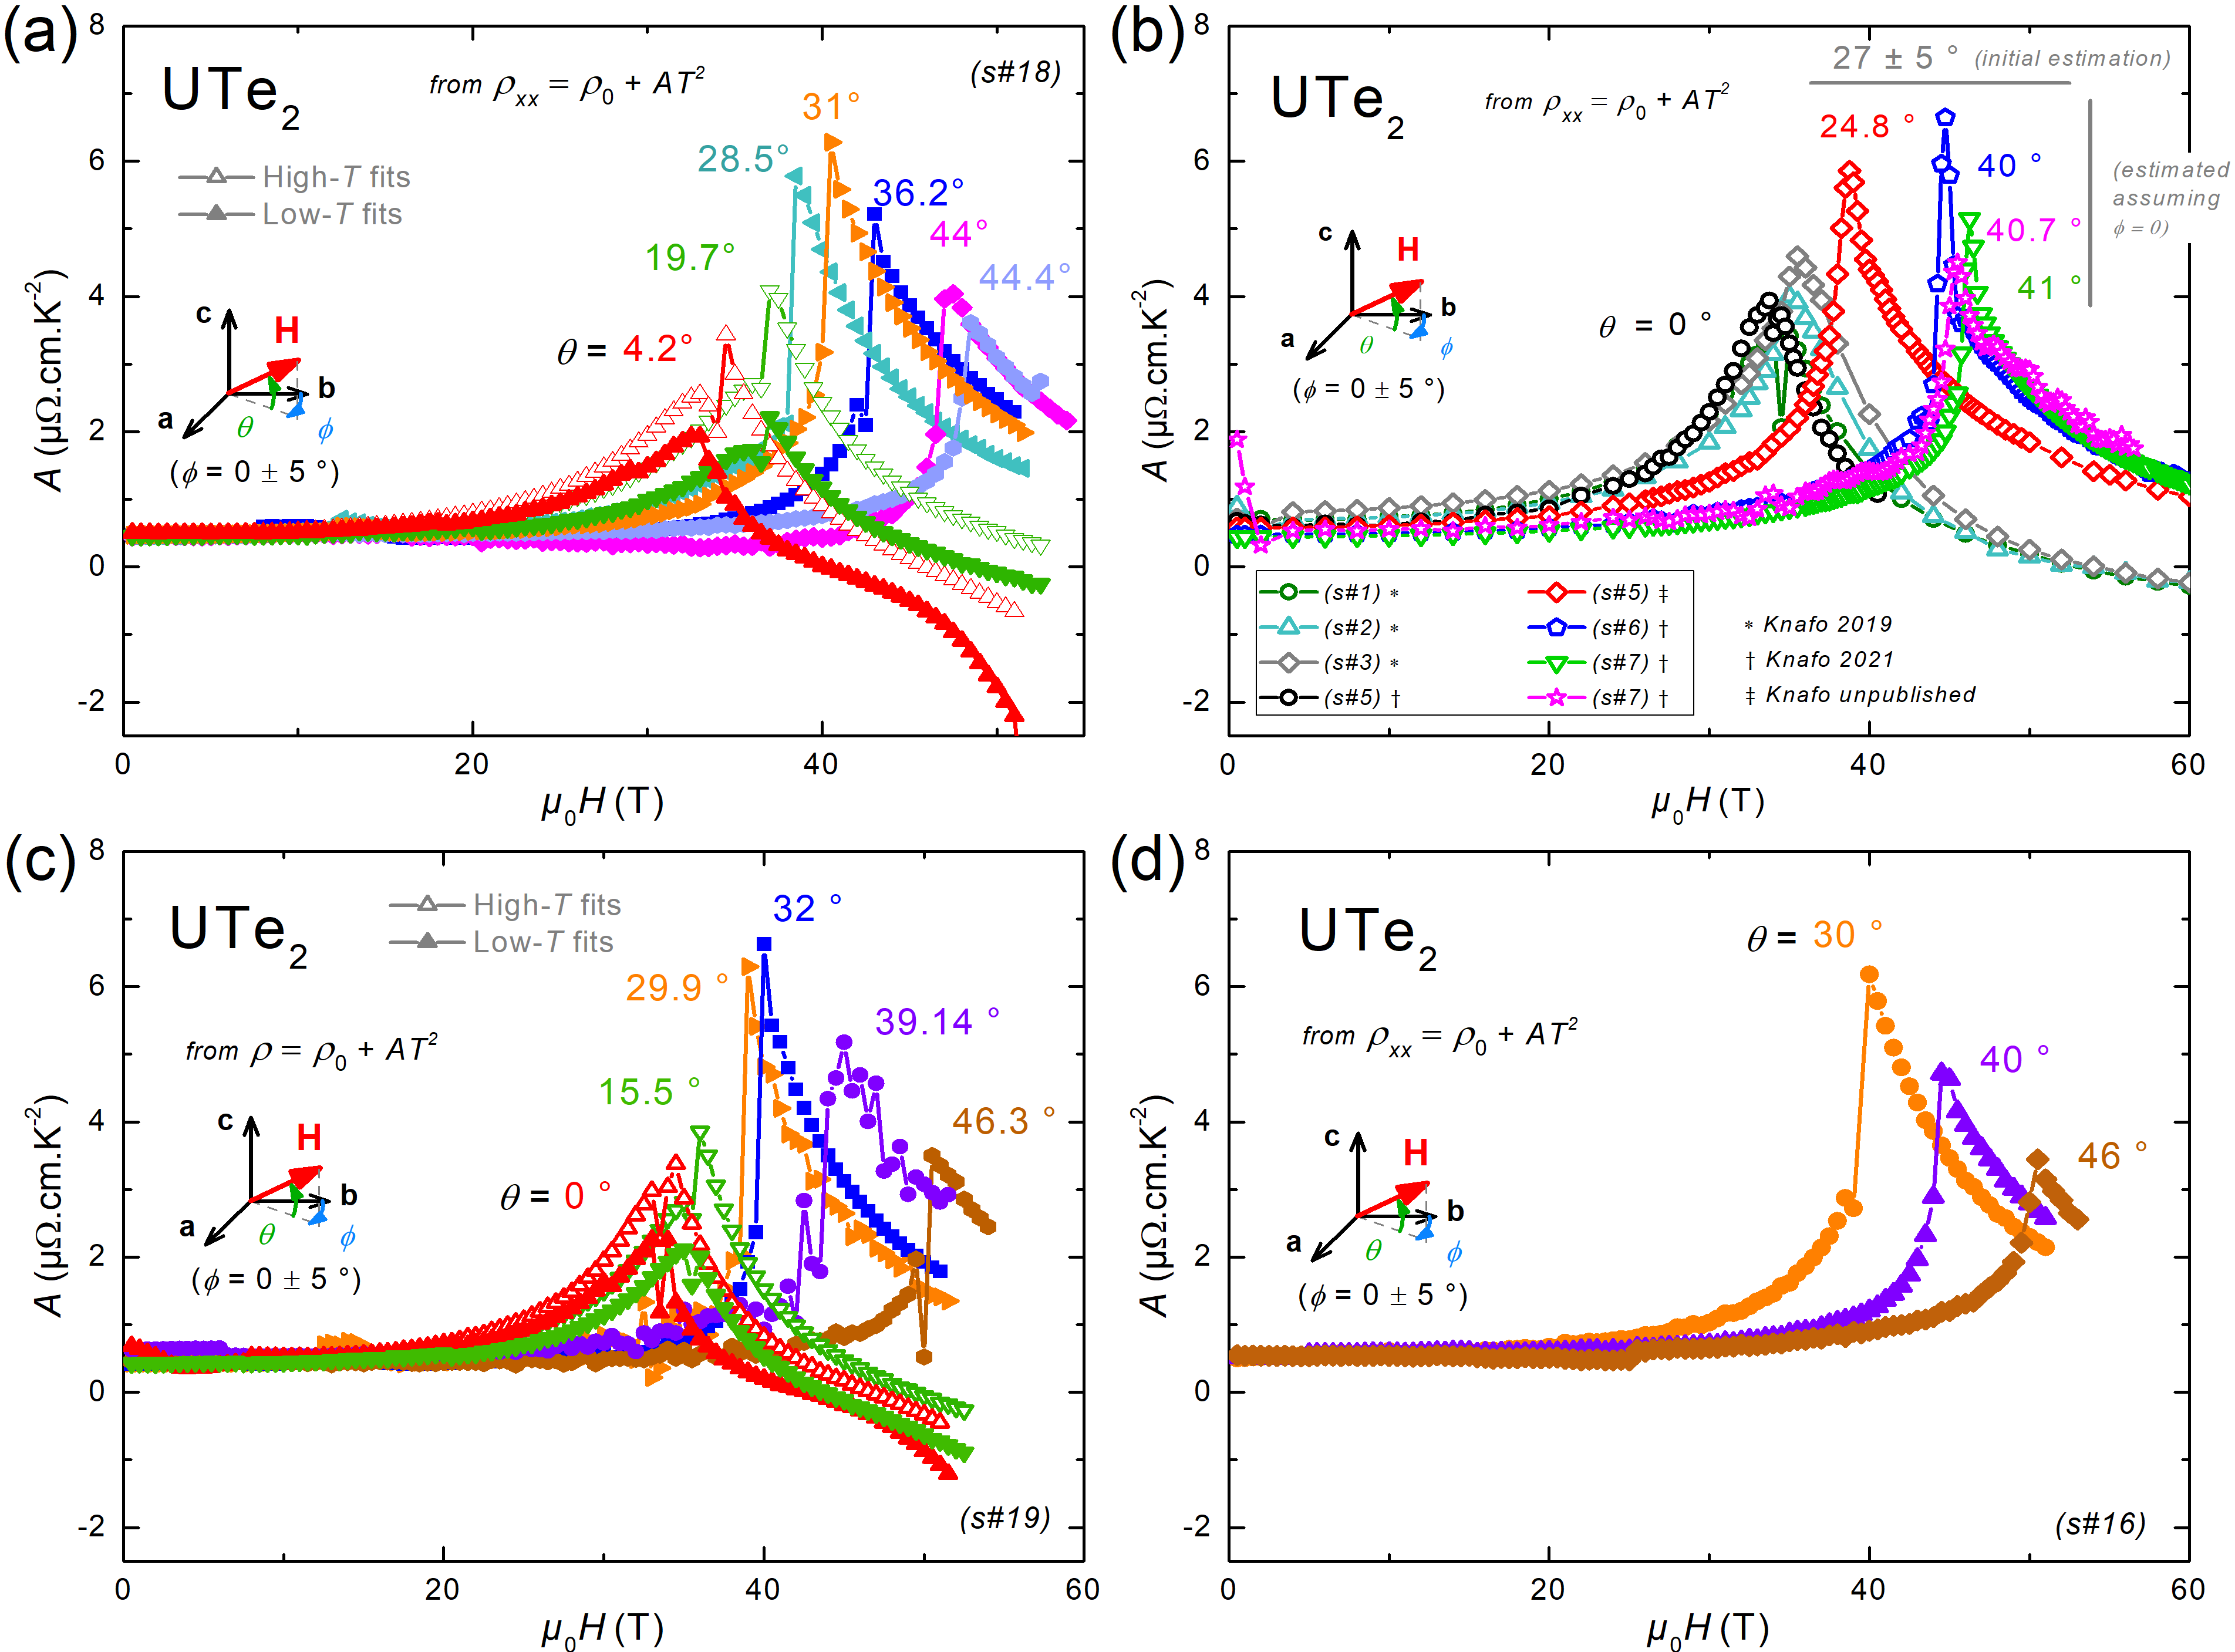
The electrical resistivity measured at K in magnetic fields with angles varying from to is presented in Fig. 2(a). is maximum at the metamagnetic transition and its maximum is enhanced at angles , where it reaches cm and where the largest resistivity jump cm is observed at . Fig. 2(b) shows the magnetic-field dependence of the Fermi-liquid coefficient extracted from our data. Details about the Fermi-liquid fits to the electrical-resistivity data, by , are given in the Supplemental Material SM . Two kinds of fits were done here. At angles 19.7, low- fits performed in the range K are affected by the cyclotron-motion effect, which leads to nonphysical negative values of at high fields. At these angles, high- fits performed in the range 2.1 K 4 K permit extracting a Fermi-liquid coefficient , which is almost unaffected by the cyclotron-motion effect. At larger angles, the cyclotron-motion effect is absent and the two kinds of fits give similar results. For each magnetic-field direction, reaches its maximal value at , and is enhanced at . For angles , the maximum of at is asymmetric, with a step-like increase for and a shoulder for . Fig. 2(c) shows a superposition of the magnetic-field-temperature phase diagrams obtained for the different field directions. For , SC2 is fully stabilized in fields . For , the onset of SC2 is observed in fields but zero resistivity is not reached at low temperature. For , SC-PPM is stabilized in fields . The critical temperature of SC-PPM reaches its maximum value K for .
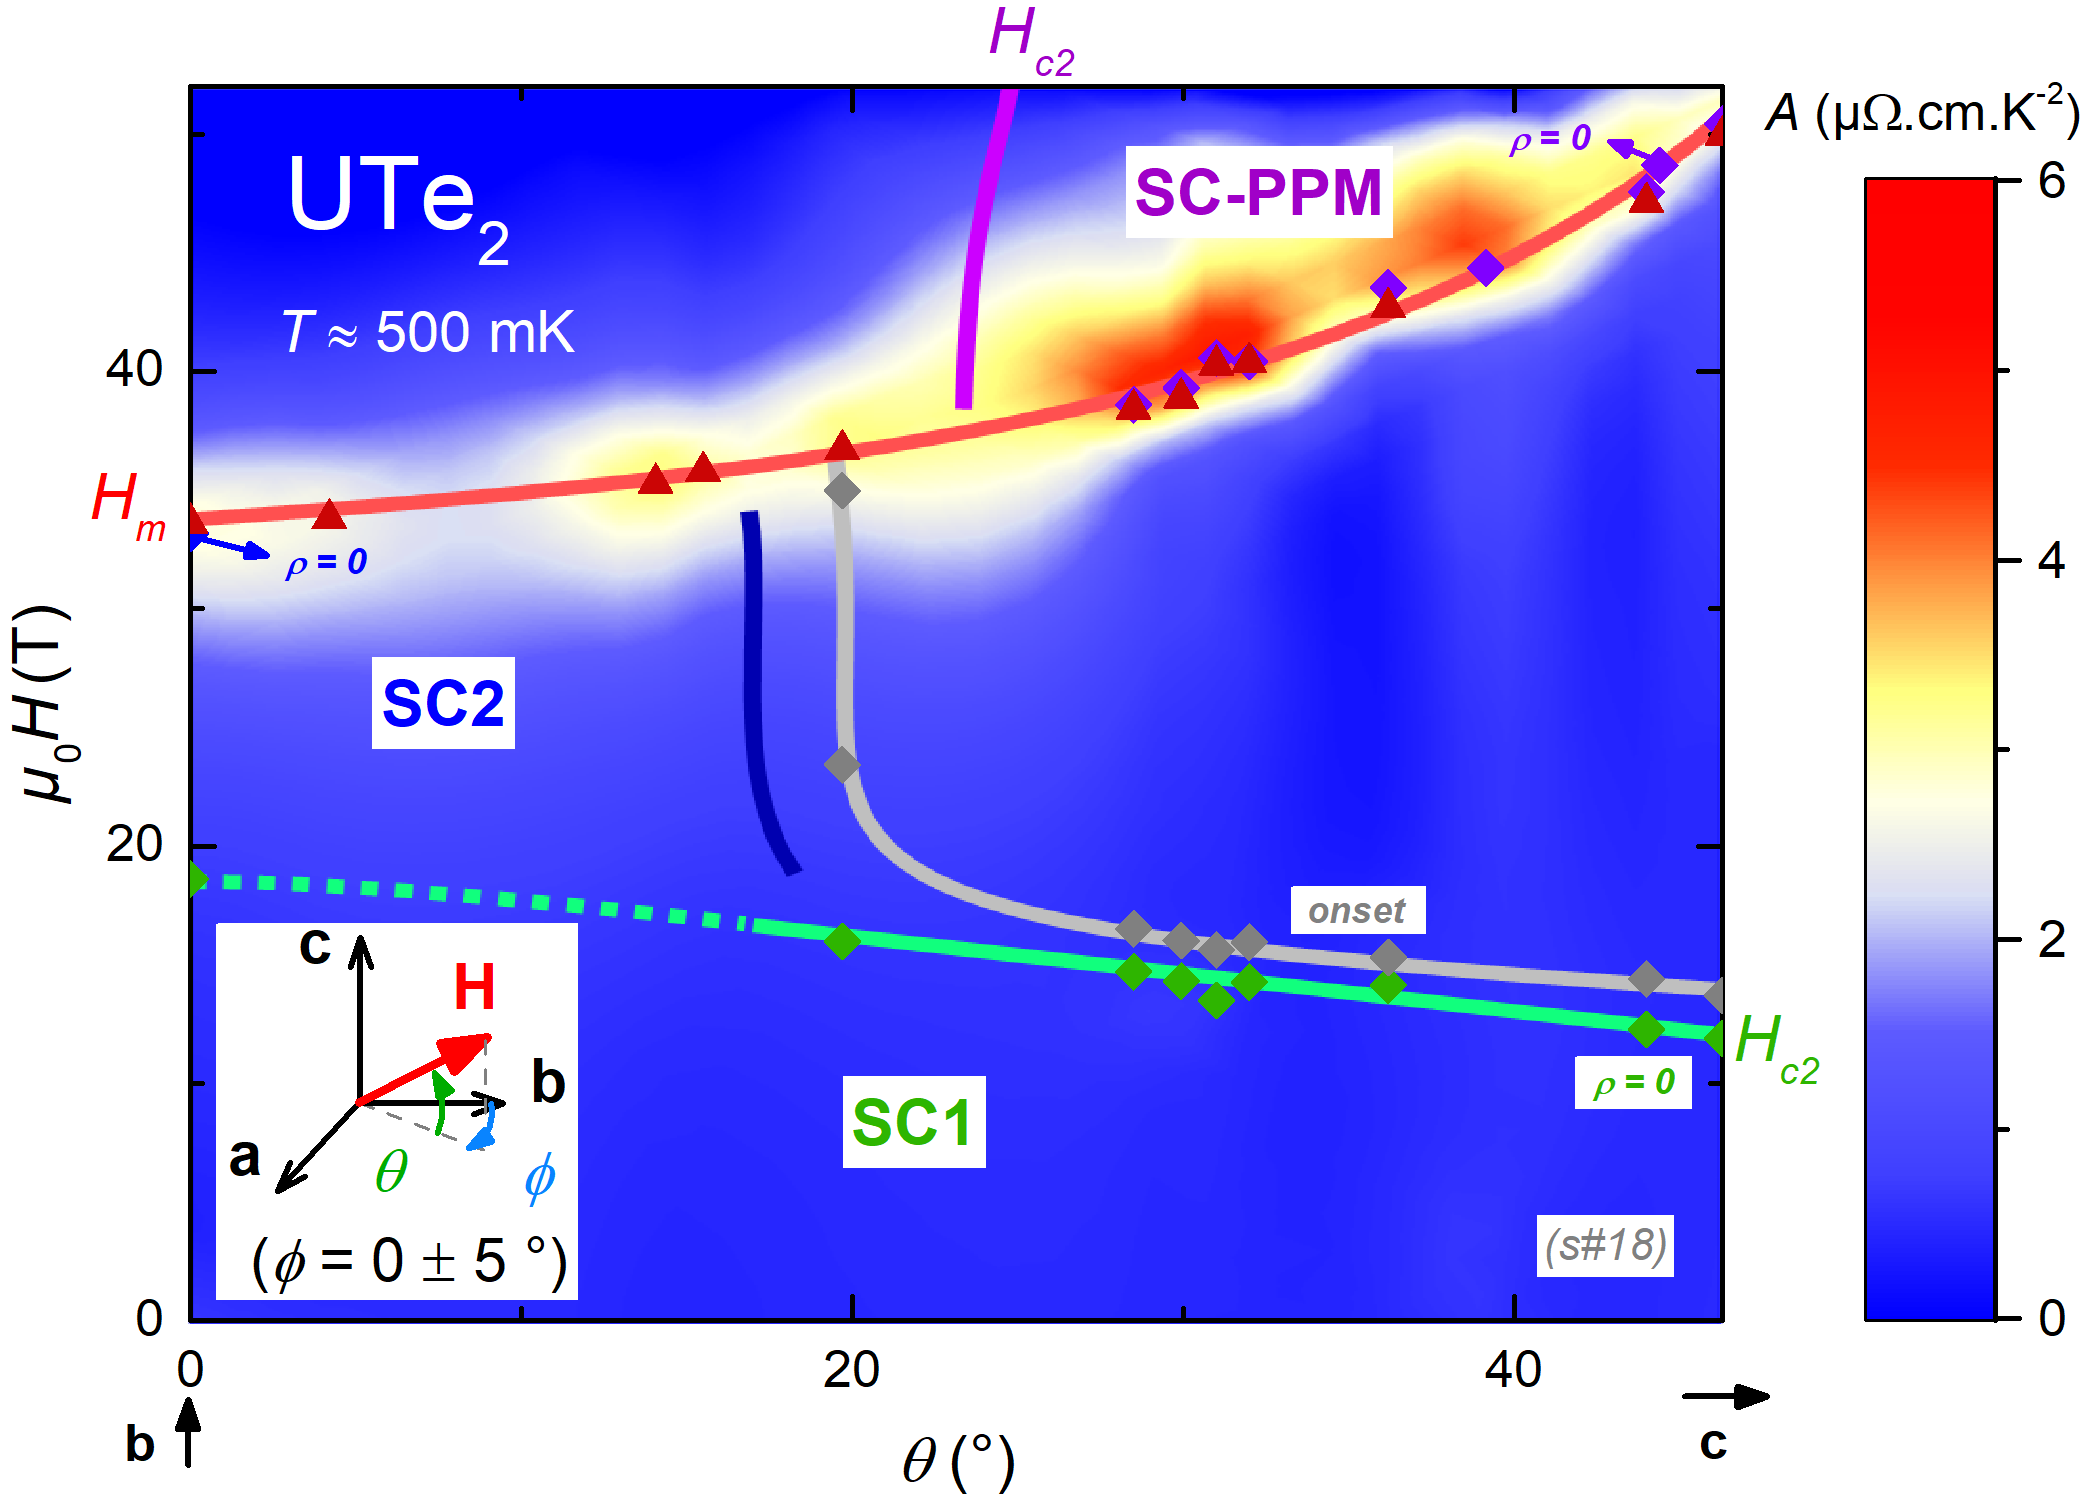
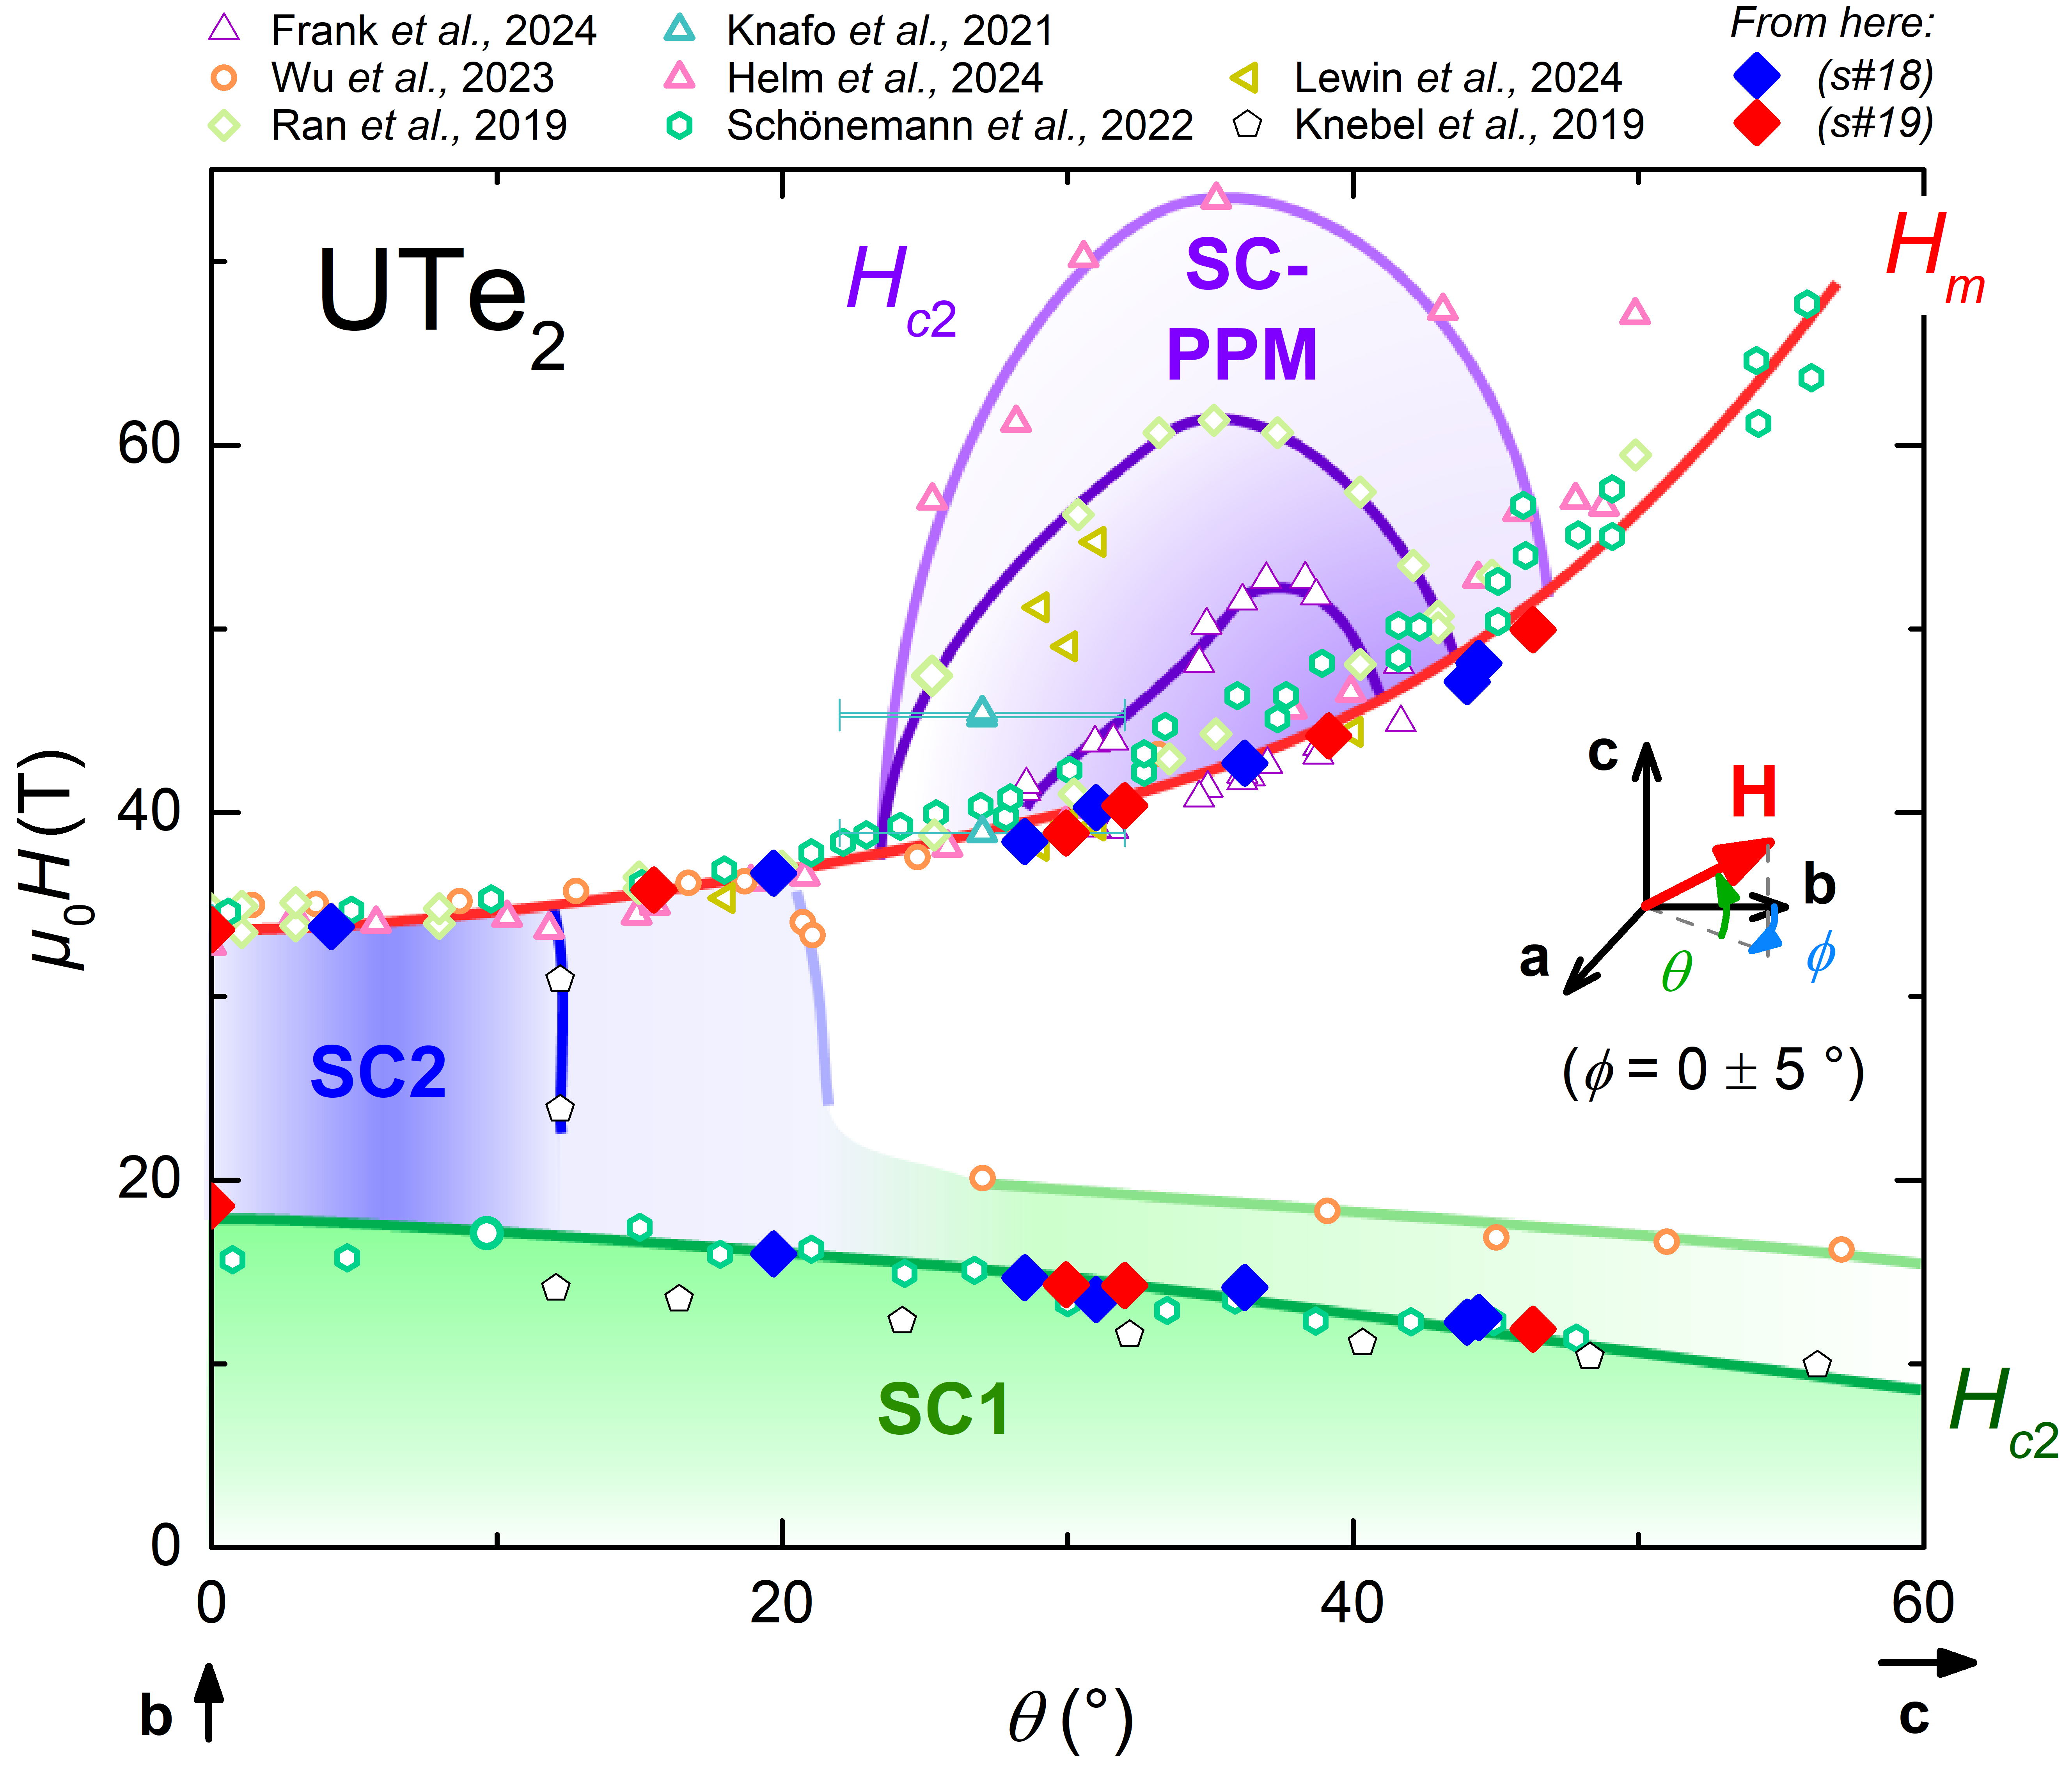
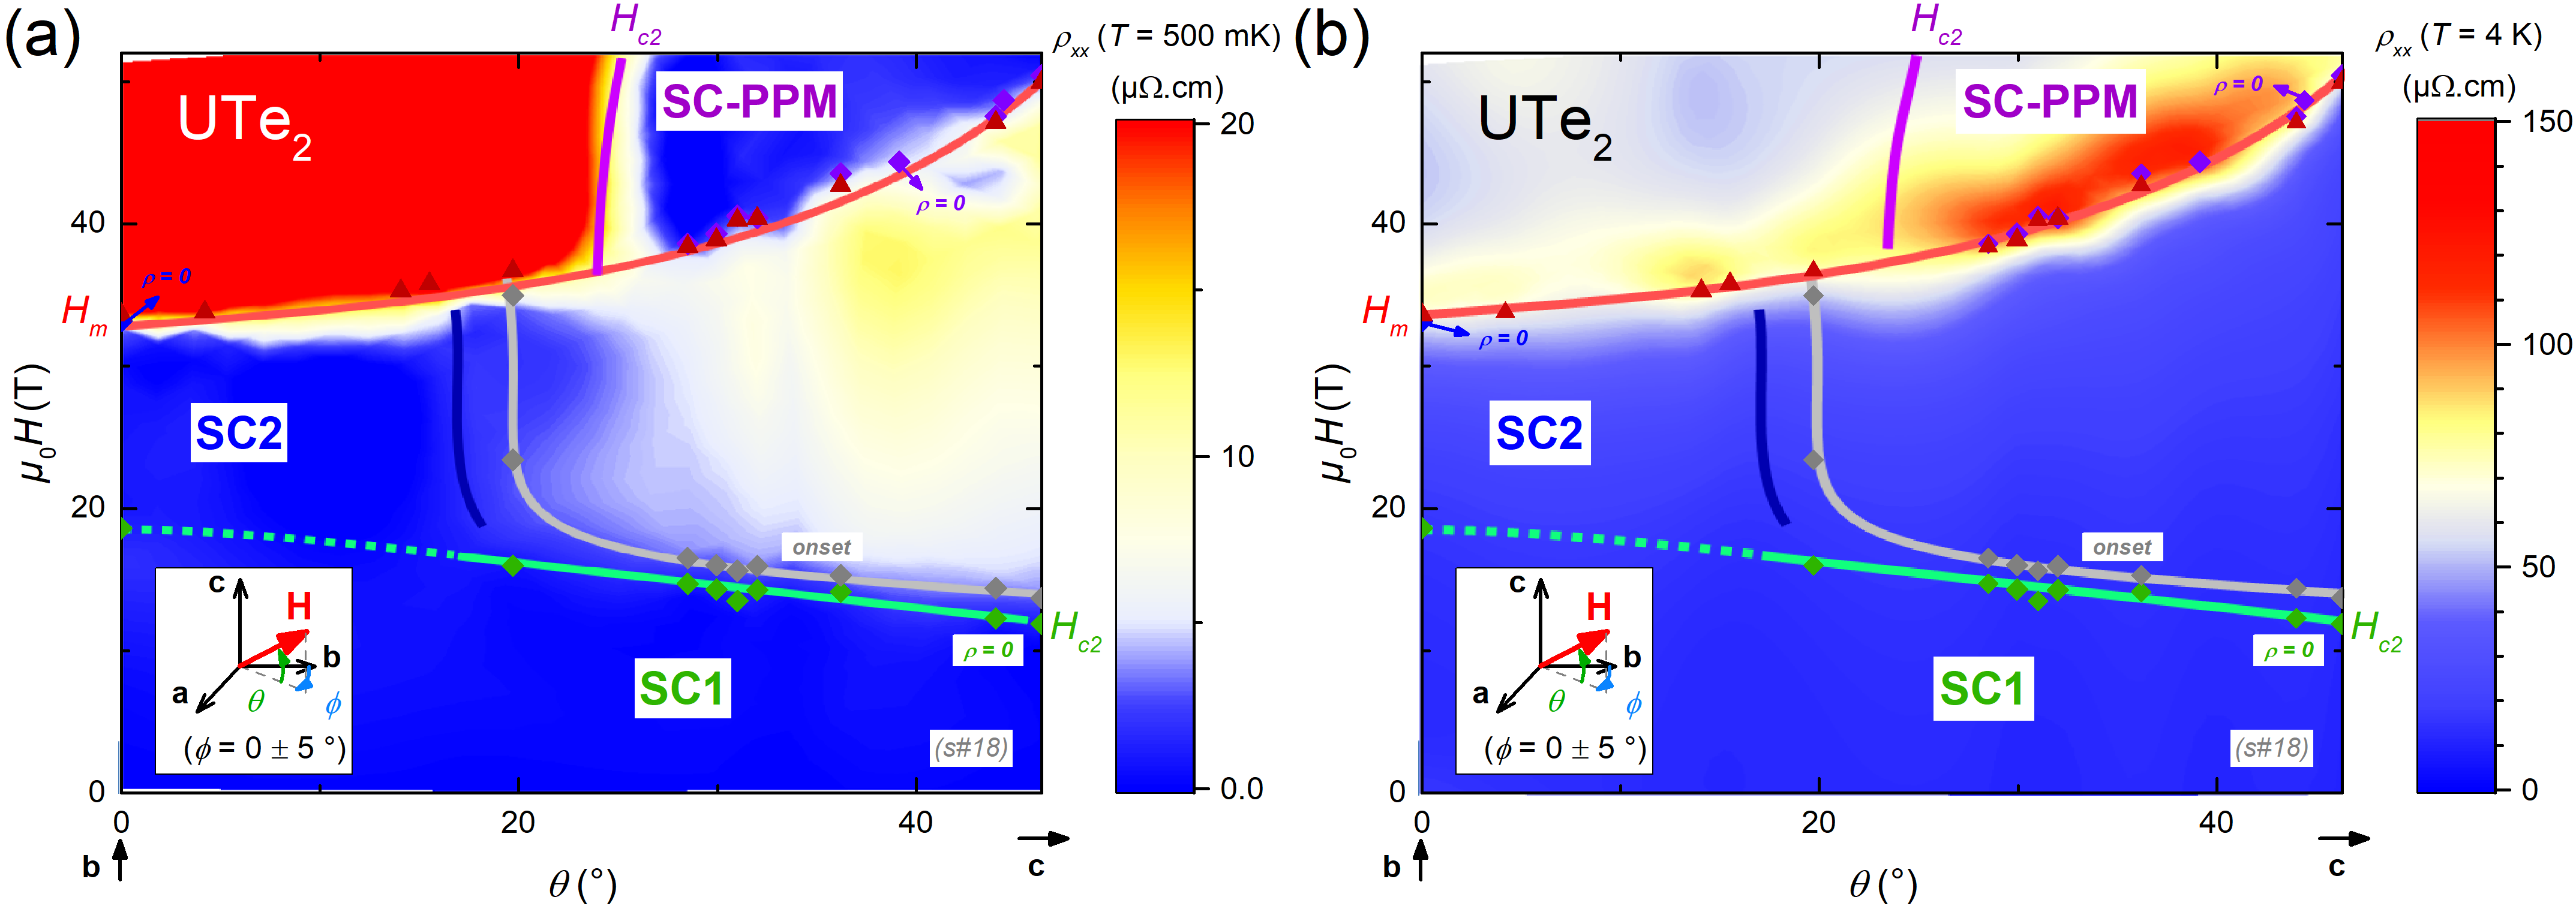
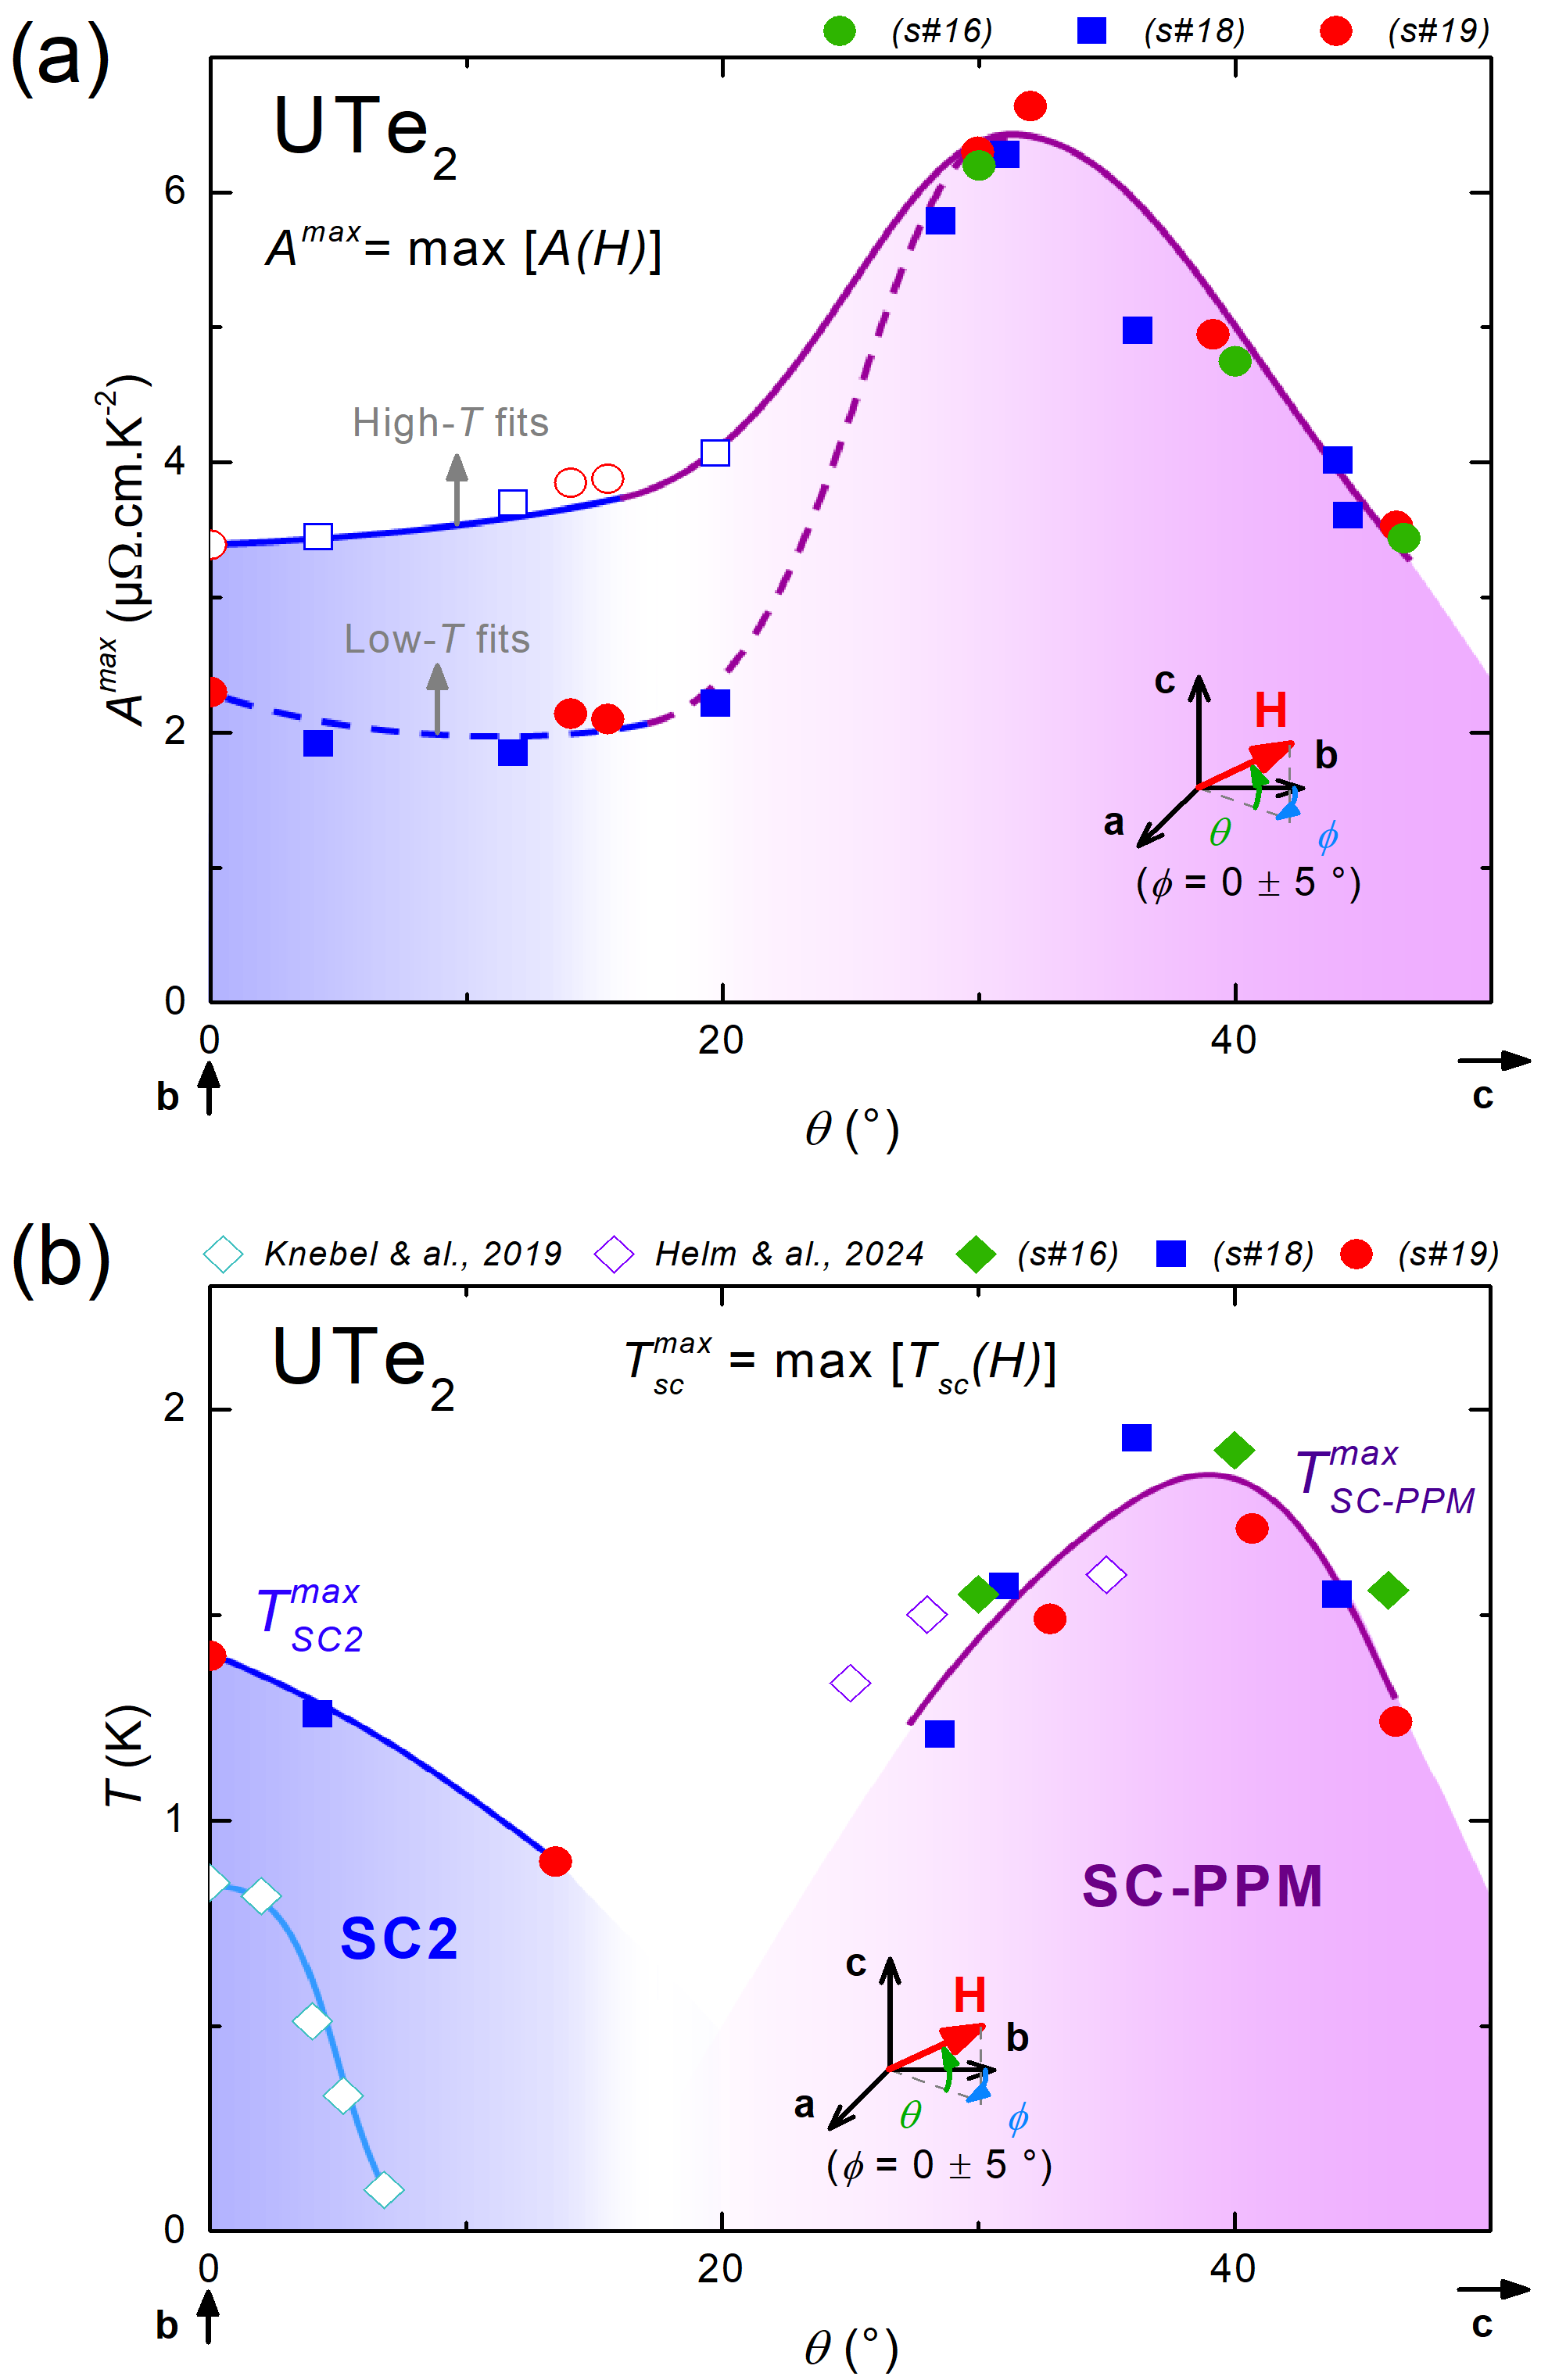
An intensity map of as a function of and is presented in Fig. 3. It was obtained from high- fits for and low- fits for 20, and it combines data from sample (presented here) and sample (see Supplemental Material SM ). The phase diagram of UTe2 shown on top of the contour plot was obtained from data presented here on sample at mK, the line of SC-PPM being taken from Helm et al. (2024); Ran et al. (2019a). The angle dependencies of the maximum in field of the Fermi-liquid coefficient (collected on samples , and , see Supplemental Material SM ) and of the critical temperatures and of SC2 and SC-PPM (collected on samples , and , see Supplemental Material SM , and from Knebel et al. (2019); Helm et al. (2024)) are presented in Figs. 4(a,b), respectively. These plots show that is enhanced at angles while is enhanced at angles .
Signatures of enhanced electronic correlations have been found close to the metamagnetic field . Similar variations of [Fig. 2(a)] and at K [Fig. 2(b)] have been observed, resulting from the contribution of magnetic fluctuations in the electrical resistivity. For , a Fermi-liquid behavior was also identified from earlier studies by electrical resistivity Knafo et al. (2019, 2021b), heat capacity Imajo et al. (2019); Rosuel et al. (2023) and magnetization Miyake et al. (2019, 2021), and enhanced magnetic fluctuations have been evidenced at by NMR-relaxation-rate measurements Tokunaga et al. (2023). The maximal value of the Fermi-liquid coefficient at and the highest superconducting temperature of SC-PPM are found for a similar range of angles . This supports that the magnetic fluctuations which contribute to probably play a key role in the mechanism driving to SC-PPM. On the contrary, at low angles , is almost constant while the highest superconducting temperature of SC2 rapidly decreases with , and their variations in angle seem not to be simply correlated. The increase of seems then too slow to overcome the superconducting-pair breaking induced by the magnetic field. To allow superconductivity at higher fields, larger values of than those found for are even needed to overcome the breaking effect, and larger values of are indeed found here at angles . However, the situation is not so simple, since similar values of are found at angles and 44.4 ∘, but is smaller for than for .
Interestingly, large values of extracted from are found, with an asymmetric shape, only above , never below, at angles [see Fig. 2(a) and Fig. S14 in the Supplemental Material SM ]. This may qualitatively explain the angular range for SC-PPM and the fact that it only occurs above . In Knafo et al. (2021b), an asymmetry in the variation of through was also observed for an angle (initially estimated at , see Supplemental Material SM ). A similar asymmetry was also observed in the Sommerfeld coefficient extracted, using thermodynamic relationships, from magnetization measurements performed with an angle Miyake et al. (2021). On the contrary, a symmetric variation of extracted from through was observed in configurations where SC2 is stabilized for , either for and at small angles , or under pressure close to GPa combined with a magnetic field tilted with an angle Vališka et al. (2021); Thebault et al. (2024).
Beyond our work, further experiments on UTe2 may help accessing new information about the magnetic fluctuations and their relation with the domains of stability of the magnetic-field-induced superconducting phases SC2 and SC-PPM. The magnetic fluctuations in UTe2, as in other U-based heavy-fermion systems, are a property of electrons, which are part of the Fermi surface and contribute to the electrical resistivity. The effect of magnetic fluctuations to the electrical resistivity was modeled, assuming isotropic properties, for actinide metals and compounds in Jullien et al. (1974). However, the electrical resistivity of UTe2 strongly depends on the electrical-current direction Eo et al. (2022); Thebault et al. (2022); Knebel et al. (2024) and one can suspect that its anisotropy may, at least partly, be related with the anisotropy of the magnetic fluctuations. A further investigation of UTe2 by electrical resistivity with currents may permit accessing complementary information to that extracted here with a current . In parallel, a heat-capacity study would allow extracting the field- and angle-variations of the Sommerfeld coefficient, which gives a direct information about the entropy associated with the magnetic fluctuations. Finally, NMR relaxation-rate studies of UTe2 may also be performed to extract microscopic information about the magnetic-fluctuations modes implied in the stabilization of SC2 and SC-PPM. Such projets in rotating and intense magnetic fields request pushing up the experimental state of the art and constitute challenges to overcome for the next years.
Acknowledgements
We acknowledge financial support from the French National Research Agency collaborative research project FRESCO No. ANR-20-CE30-0020 and from the JSPS KAKENHI Grants Nos. JP19H00646, 19K03756, JP20H00130, 20H01864, JP20K20889, JP20KK0061, and 21H04987.
References
- Pfleiderer (2009) C. Pfleiderer, Rev. Mod. Phys. 81, 1551 (2009).
- Knafo (2021) W. Knafo, arXiv:2107.13458 (2021).
- Aoki et al. (2019a) D. Aoki, K. Ishida, and J. Flouquet, J. Phys. Soc. Jpn. 88, 022001 (2019a).
- Hattori et al. (2012) T. Hattori, Y. Ihara, Y. Nakai, K. Ishida, Y. Tada, S. Fujimoto, N. Kawakami, E. Osaki, K. Deguchi, N. Sato, et al., Phys. Rev. Lett. 108, 066403 (2012).
- Wu et al. (2017) B. Wu, G. Bastien, M. Taupin, C. Paulsen, L. Howald, D. Aoki, and J.-P. Brison, Nat. Commun. 8, 14480 (2017).
- Miyake et al. (2008) A. Miyake, D. Aoki, and J. Flouquet, J. Phys. Soc. Jpn. 77, 094709 (2008).
- Miyake et al. (2009) A. Miyake, D. Aoki, and J. Flouquet, J. Phys. Soc. Jpn. 78, 063703 (2009).
- Gourgout et al. (2016) A. Gourgout, A. Pourret, G. Knebel, D. Aoki, G. Seyfarth, and J. Flouquet, Phys. Rev. Lett. 117, 046401 (2016).
- Tokunaga et al. (2015) Y. Tokunaga, D. Aoki, H. Mayaffre, S. Krämer, M.-H. Julien, C. Berthier, M. Horvatić, H. Sakai, S. Kambe, and S. Araki, Phys. Rev. Lett. 114, 216401 (2015).
- Tokunaga et al. (2016) Y. Tokunaga, D. Aoki, H. Mayaffre, S. Krämer, M.-H. Julien, C. Berthier, M. Horvatić, H. Sakai, T. Hattori, S. Kambe, and S. Araki, Phys. Rev. B 93, 201112 (2016).
- Ran et al. (2019a) S. Ran, I.-L. Liu, Y. S. Eo, D. J. Campbell, P. Neves, W. T. Fuhrman, S. R. Saha, C. Eckberg, H. Kim, J. Paglione, D. Graf, J. Singleton, and N. P. Butch, Nat. Phys. 15, 1250 (2019a).
- Knebel et al. (2019) G. Knebel, W. Knafo, A. Pourret, Q. Niu, M. Vališka, D. Braithwaite, G. Lapertot, M. Nardone, A. Zitouni, S. Mishra, I. Sheikin, G. Seyfarth, J.-P. Brison, D. Aoki, and J. Flouquet, J. Phys. Soc. Jpn. 88, 063707 (2019).
- Aoki et al. (2021) D. Aoki, M. Kimata, Y. J. Sato, G. Knebel, F. Honda, A. Nakamura, D. Li, Y. Homma, Y. Shimizu, W. Knafo, D. Braithwaite, M. Vališka, A. Pourret, J.-P. Brison, and J. Flouquet, J. Phys. Soc. Jpn. 90, 074705 (2021).
- Vališka et al. (2021) M. Vališka, W. Knafo, G. Knebel, G. Lapertot, D. Aoki, and D. Braithwaite, Phys. Rev. B 104, 214507 (2021).
- Wu et al. (2025) Z. Wu, T. I. Weinberger, A. J. Hickey, D. V. Chichinadze, D. Shaffer, A. Cabala, H. Chen, M. Long, T. J. Brumm, W. Xie, Y. Ling, Z. Zhu, Y. Skourski, D. E. Graf, V. Sechovský, M. Vališka, G. G. Lonzarich, F. M. Grosche, and A. G. Eaton, Phys. Rev. X 15, 021019 (2025).
- Lewin et al. (2024a) S. K. Lewin, P. Czajka, C. E. Frank, G. S. Salas, H. Yoon, Y. S. Eo, J. Paglione, A. H. Nevidomskyy, J. Singleton, and N. P. Butch, arXiv:2402.18564 (2024a).
- Frank et al. (2024) C. E. Frank, S. K. Lewin, G. Saucedo Salas, P. Czajka, I. M. Hayes, H. Yoon, T. Metz, J. Paglione, J. Singleton, and N. P. Butch, Nat. Commun. 15, 3378 (2024).
- Ran et al. (2019b) S. Ran, C. Eckberg, Q.-P. Ding, Y. Furukawa, T. Metz, S. R. Saha, I.-L. Liu, M. Zic, H. Kim, J. Paglione, and N. P. Butch, Science 365, 684 (2019b).
- Aoki et al. (2019b) D. Aoki, A. Nakamura, F. Honda, D. Li, Y. Homma, Y. Shimizu, Y. J. Sato, G. Knebel, J.-P. Brison, A. Pourret, D. Braithwaite, G. Lapertot, Q. Niu, M. Vališka, H. Harima, and J. Flouquet, J. Phys. Soc. Jpn. 88, 043702 (2019b).
- Kinjo et al. (2023) K. Kinjo, H. Fujibayashi, H. Matsumura, F. Hori, S. Kitagawa, K. Ishida, Y. Tokunaga, H. Sakai, S. Kambe, A. Nakamura, et al., Sci. Adv. 9, eadg2736 (2023).
- Theuss et al. (2024) F. Theuss, A. Shragai, G. Grissonnanche, L. Peralta, G. d. l. F. Simarro, I. M. Hayes, S. R. Saha, Y. S. Eo, A. Suarez, A. C. Salinas, G. Pokharel, S. D. Wilson, N. P. Butch, J. Paglione, and B. J. Ramshaw, Nat. Phys. , 1 (2024).
- Duan et al. (2020) C. Duan, K. Sasmal, M. B. Maple, A. Podlesnyak, J.-X. Zhu, Q. Si, and P. Dai, Phys. Rev. Lett. 125, 237003 (2020).
- Knafo et al. (2021a) W. Knafo, G. Knebel, P. Steffens, K. Kaneko, A. Rosuel, J.-P. Brison, J. Flouquet, D. Aoki, G. Lapertot, and S. Raymond, Phys. Rev. B 104, L100409 (2021a).
- Butch et al. (2022) N. P. Butch, S. Ran, S. R. Saha, P. M. Neves, M. P. Zic, J. Paglione, S. Gladchenko, Q. Ye, and J. A. Rodriguez-Rivera, npj Quantum Mater. 7, 39 (2022).
- Duan et al. (2021) C. Duan, R. Baumbach, A. Podlesnyak, Y. Deng, C. Moir, A. J. Breindel, M. B. Maple, E. Nica, Q. Si, and P. Dai, Nature 600, 636 (2021).
- Raymond et al. (2021) S. Raymond, W. Knafo, G. Knebel, K. Kaneko, J.-P. Brison, J. Flouquet, D. Aoki, and G. Lapertot, J. Phys. Soc. Jpn. 90, 113706 (2021).
- Knafo et al. (2023) W. Knafo, T. Thebault, P. Manuel, D. Khalyavin, F. Orlandi, E. Ressouche, K. Beauvois, G. Lapertot, K. Kaneko, D. Aoki, D. Braithwaite, G. Knebel, and S. Raymond, arXiv:2311.05455 (2023).
- Tokunaga et al. (2019) Y. Tokunaga, H. Sakai, S. Kambe, T. Hattori, N. Higa, G. Nakamine, S. Kitagawa, K. Ishida, A. Nakamura, Y. Shimizu, Y. Homma, D. Li, F. Honda, and D. Aoki, J. Phys. Soc. Jpn. 88, 073701 (2019).
- Fujibayashi et al. (2023) H. Fujibayashi, K. Kinjo, G. Nakamine, S. Kitagawa, K. Ishida, Y. Tokunaga, H. Sakai, S. Kambe, A. Nakamura, Y. Shimizu, Y. Homma, D. Li, F. Honda, and D. Aoki, J. Phys. Soc. Jpn. 92 (2023), 10.7566/JPSJ.92.053702.
- Matsumura et al. (2025) H. Matsumura, S. Kitagawa, S. Ogata, R. Matsubayashi, H. Fujibayashi, K. Kinjo, K. Ishida, Y. Tokunaga, H. Sakai, S. Kambe, A. Nakamura, Y. Shimizu, Y. Homma, D. Li, F. Honda, A. Miyake, and D. Aoki, Phys. Rev. B 111, 094507 (2025).
- Knafo et al. (2019) W. Knafo, M. Vališka, D. Braithwaite, G. Lapertot, G. Knebel, A. Pourret, J.-P. Brison, J. Flouquet, and D. Aoki, J. Phys. Soc. Jpn. 88, 063705 (2019).
- Miyake et al. (2019) A. Miyake, Y. Shimizu, Y. J. Sato, D. Li, A. Nakamura, Y. Homma, F. Honda, J. Flouquet, M. Tokunaga, and D. Aoki, J. Phys. Soc. Jpn. 88, 063706 (2019).
- Rosuel et al. (2023) A. Rosuel, C. Marcenat, G. Knebel, T. Klein, A. Pourret, N. Marquardt, Q. Niu, S. Rousseau, A. Demuer, G. Seyfarth, G. Lapertot, D. Aoki, D. Braithwaite, J. Flouquet, and J.-P. Brison, Phys. Rev. X 13, 011022 (2023).
- Knafo et al. (2021b) W. Knafo, M. Nardone, M. Vališka, A. Zitouni, G. Lapertot, D. Aoki, G. Knebel, and D. Braithwaite, Commun. Phys. 4, 40 (2021b).
- Helm et al. (2024) T. Helm, M. Kimata, K. Sudo, A. Miyata, J. Stirnat, T. Förster, J. Hornung, M. König, I. Sheikin, A. Pourret, G. Lapertot, D. Aoki, G. Knebel, J. Wosnitza, and J.-P. Brison, Nat. Commun. 15, 37 (2024).
- Lewin et al. (2024b) S. K. Lewin, J. J. Yu, C. E. Frank, D. Graf, P. Chen, S. Ran, Y. S. Eo, J. Paglione, S. Raghu, and N. P. Butch, arXiv:2410.05137 (2024b).
- Imajo et al. (2019) S. Imajo, Y. Kohama, A. Miyake, C. Dong, M. Tokunaga, J. Flouquet, K. Kindo, and D. Aoki, J. Phys. Soc. Jpn. 88, 083705 (2019).
- Miyake et al. (2021) A. Miyake, Y. Shimizu, Y. J. Sato, D. Li, A. Nakamura, Y. Homma, F. Honda, J. Flouquet, M. Tokunaga, and D. Aoki, J. Phys. Soc. Jpn. 90, 103702 (2021).
- Thebault et al. (2022) T. Thebault, M. Vališka, G. Lapertot, A. Pourret, D. Aoki, G. Knebel, D. Braithwaite, and W. Knafo, Phys. Rev. B 106, 144406 (2022).
- Tokunaga et al. (2023) Y. Tokunaga, H. Sakai, S. Kambe, P. Opletal, Y. Tokiwa, Y. Haga, S. Kitagawa, K. Ishida, D. Aoki, G. Knebel, G. Lapertot, S. Krämer, and M. Horvatić, Phys. Rev. Lett. 131, 226503 (2023).
- (41) See Supplemental Material for details.
- Sakai et al. (2022) H. Sakai, P. Opletal, Y. Tokiwa, E. Yamamoto, Y. Tokunaga, S. Kambe, and Y. Haga, Phys. Rev. Mater. 6, 073401 (2022).
- Béard et al. (2018) J. Béard, J. Billette, N. Ferreira, P. Frings, J.-M. Lagarrigue, F. Lecouturier, and J.-P. Nicolin, IEEE Trans. Appl. Supercond. 28, 1 (2018).
- Aoki et al. (2022) D. Aoki, H. Sakai, P. Opletal, Y. Tokiwa, J. Ishizuka, Y. Yanase, H. Harima, A. Nakamura, D. Li, Y. Homma, Y. Shimizu, G. Knebel, J. Flouquet, and Y. Haga, J. Phys. Soc. Jpn. 91, 083704 (2022).
- Onuki (2018) Y. Onuki, Physics of Heavy Fermions: Heavy Fermions and Strongly Correlated Electrons Systems (World Scientific, 2018).
- Thebault et al. (2024) T. Thebault, D. Braithwaite, G. Lapertot, D. Aoki, G. Knebel, and W. Knafo, Phys. Rev. B 109, 214420 (2024).
- Jullien et al. (1974) R. Jullien, M. Beal-Monod, and B. Coqblin, Phys. Rev. B 9, 1441 (1974).
- Eo et al. (2022) Y. S. Eo, S. Liu, S. R. Saha, H. Kim, S. Ran, J. A. Horn, H. Hodovanets, J. Collini, T. Metz, W. T. Fuhrman, A. H. Nevidomskyy, J. D. Denlinger, N. P. Butch, M. S. Fuhrer, L. A. Wray, and J. Paglione, Phys. Rev. B 106, L060505 (2022).
- Knebel et al. (2024) G. Knebel, A. Pourret, S. Rousseau, N. Marquardt, D. Braithwaite, F. Honda, D. Aoki, G. Lapertot, W. Knafo, G. Seyfarth, J.-P. Brison, and J. Flouquet, Phys. Rev. B 109, 155103 (2024).
Supplemental Material:
Field-induced electronic correlations and superconductivity in UTe2 beyond 40 T
Experimental details are given and supplemental figures are shown for the different investigated samples. Details about raw data and their analysis to construct magnetic-field-temperature phase diagrams and to extract the Fermi-liquid coefficient are given. We also show that a flux-flow resistive signal persists in the superconducting phase SC1 for in these samples grown by the molten-salt-flux technique.
T. Thebault K. Somesh G. Lapertot M. Nardone A. Zitouni M. Barragan J. Béard J. Billette F. Lecouturier S. Tardieu D. Aoki G. Knebel D. Braithwaite W. Knafo June 5, 2025
S1 Experimental details
Four UTe2 single crystals (samples , , and ) have been investigated here by electrical resistivity. In complement to the paper, which presents data from samples and , this Supplemental Material shows data collected from the three samples , and , supporting the reproducibility of our results. The four samples have been grown by the molten-salt-flux (MSF) method Sakai et al. (2022). Their electrical resistivity was measured with a current under magnetic fields up to 55 T applied in the (b,c) plane for samples , and and under magnetic fields up to 95 T for sample . A single-axis rotator was used to change the field direction defined by the angle (with ). The samples , and were selected with a clean face perpendicular to , with dimensions of approximately 1-2 mm along , 0.3-0.5 mm along , and 0.1-0.2 mm along . The sample was selected with a clean face perpendicular to the plane of Miller indices , with similar dimensions than samples and . The orientation of the crystals was ensured by Laue diffraction. Four electrical contacts with 15-m gold wires were spot-welded on sample surfaces. The electrical resistivity was measured with an excitation current of 10 mA and a frequency 40 kHz. Pulsed magnetic-field experiments were performed using a long-duration 60-T single-coil magnet (pulses rise of 50 ms and fall of 280 ms) and a -T triple-coil magnet (inner coil permitting to reach the maximum magnetic field: pulses rise of 6 ms and fall of 13 ms) at the Laboratoire National des Champs Magnétiques Intenses (LNCMI) in Toulouse (see Figure S1). Samples , and were investigated at temperatures from 470 mK to 10 K delivered by an 3He insert combined with a 4He cryostat, and sample was investigated at temperatures from 1.4 K to 36.5 K using a 4He cryostat.
S2 Electrical resistivity and phase diagrams
Figures S2 and S3 present the field variation of the electrical resistivity of UTe2 samples and , respectively, at temperatures from 500 mK to 10 K, in magnetic fields up to 55 T with angles varying from () to . These data were collected during the fall of the pulsed magnetic fields. The magnetic-field temperature phase diagrams obtained from these resistivity data are presented in Figures S4 (sample ) and S5 (sample ).
Figure S6 shows the angle-magnetic-field phase diagram of UTe2 obtained at low temperatures, combining data collected here on samples and and data published in the literature Knebel et al. (2019); Ran et al. (2019); Knafo et al. (2021); Schönemann et al. (2022); Frank et al. (2024); Wu et al. (2024); Helm et al. (2024); Lewin et al. (2024). Figure S7(a,b) show intensity maps of the electrical resistivity of UTe2 sample measured at mK and K, respectively, as a function of and . The phase diagram shown on top of the intensity maps was obtained from resistivity measurements on samples and at mK. Figure S7(a) illustrates that the domains of stability of SC2 and SC-PPM correspond to zero-resistivity (or nearly-zero resistivity, see Section S4) states. Figure S7(b) shows that an enhancement of is observed in the vicinity of SC-PPM, for and angles . This enhancement of the electronic correlations visible at K is attributed to a magnetic-fluctuation mode, which also drives the enhancement of the Fermi-liquid coefficient in the same field and angle regime (see Figure 3 of the paper). This magnetic-fluctuations mode is suspected to be involved in the mechanism driving the superconducting phase SC-PPM.
S3 Fermi-liquid coefficient
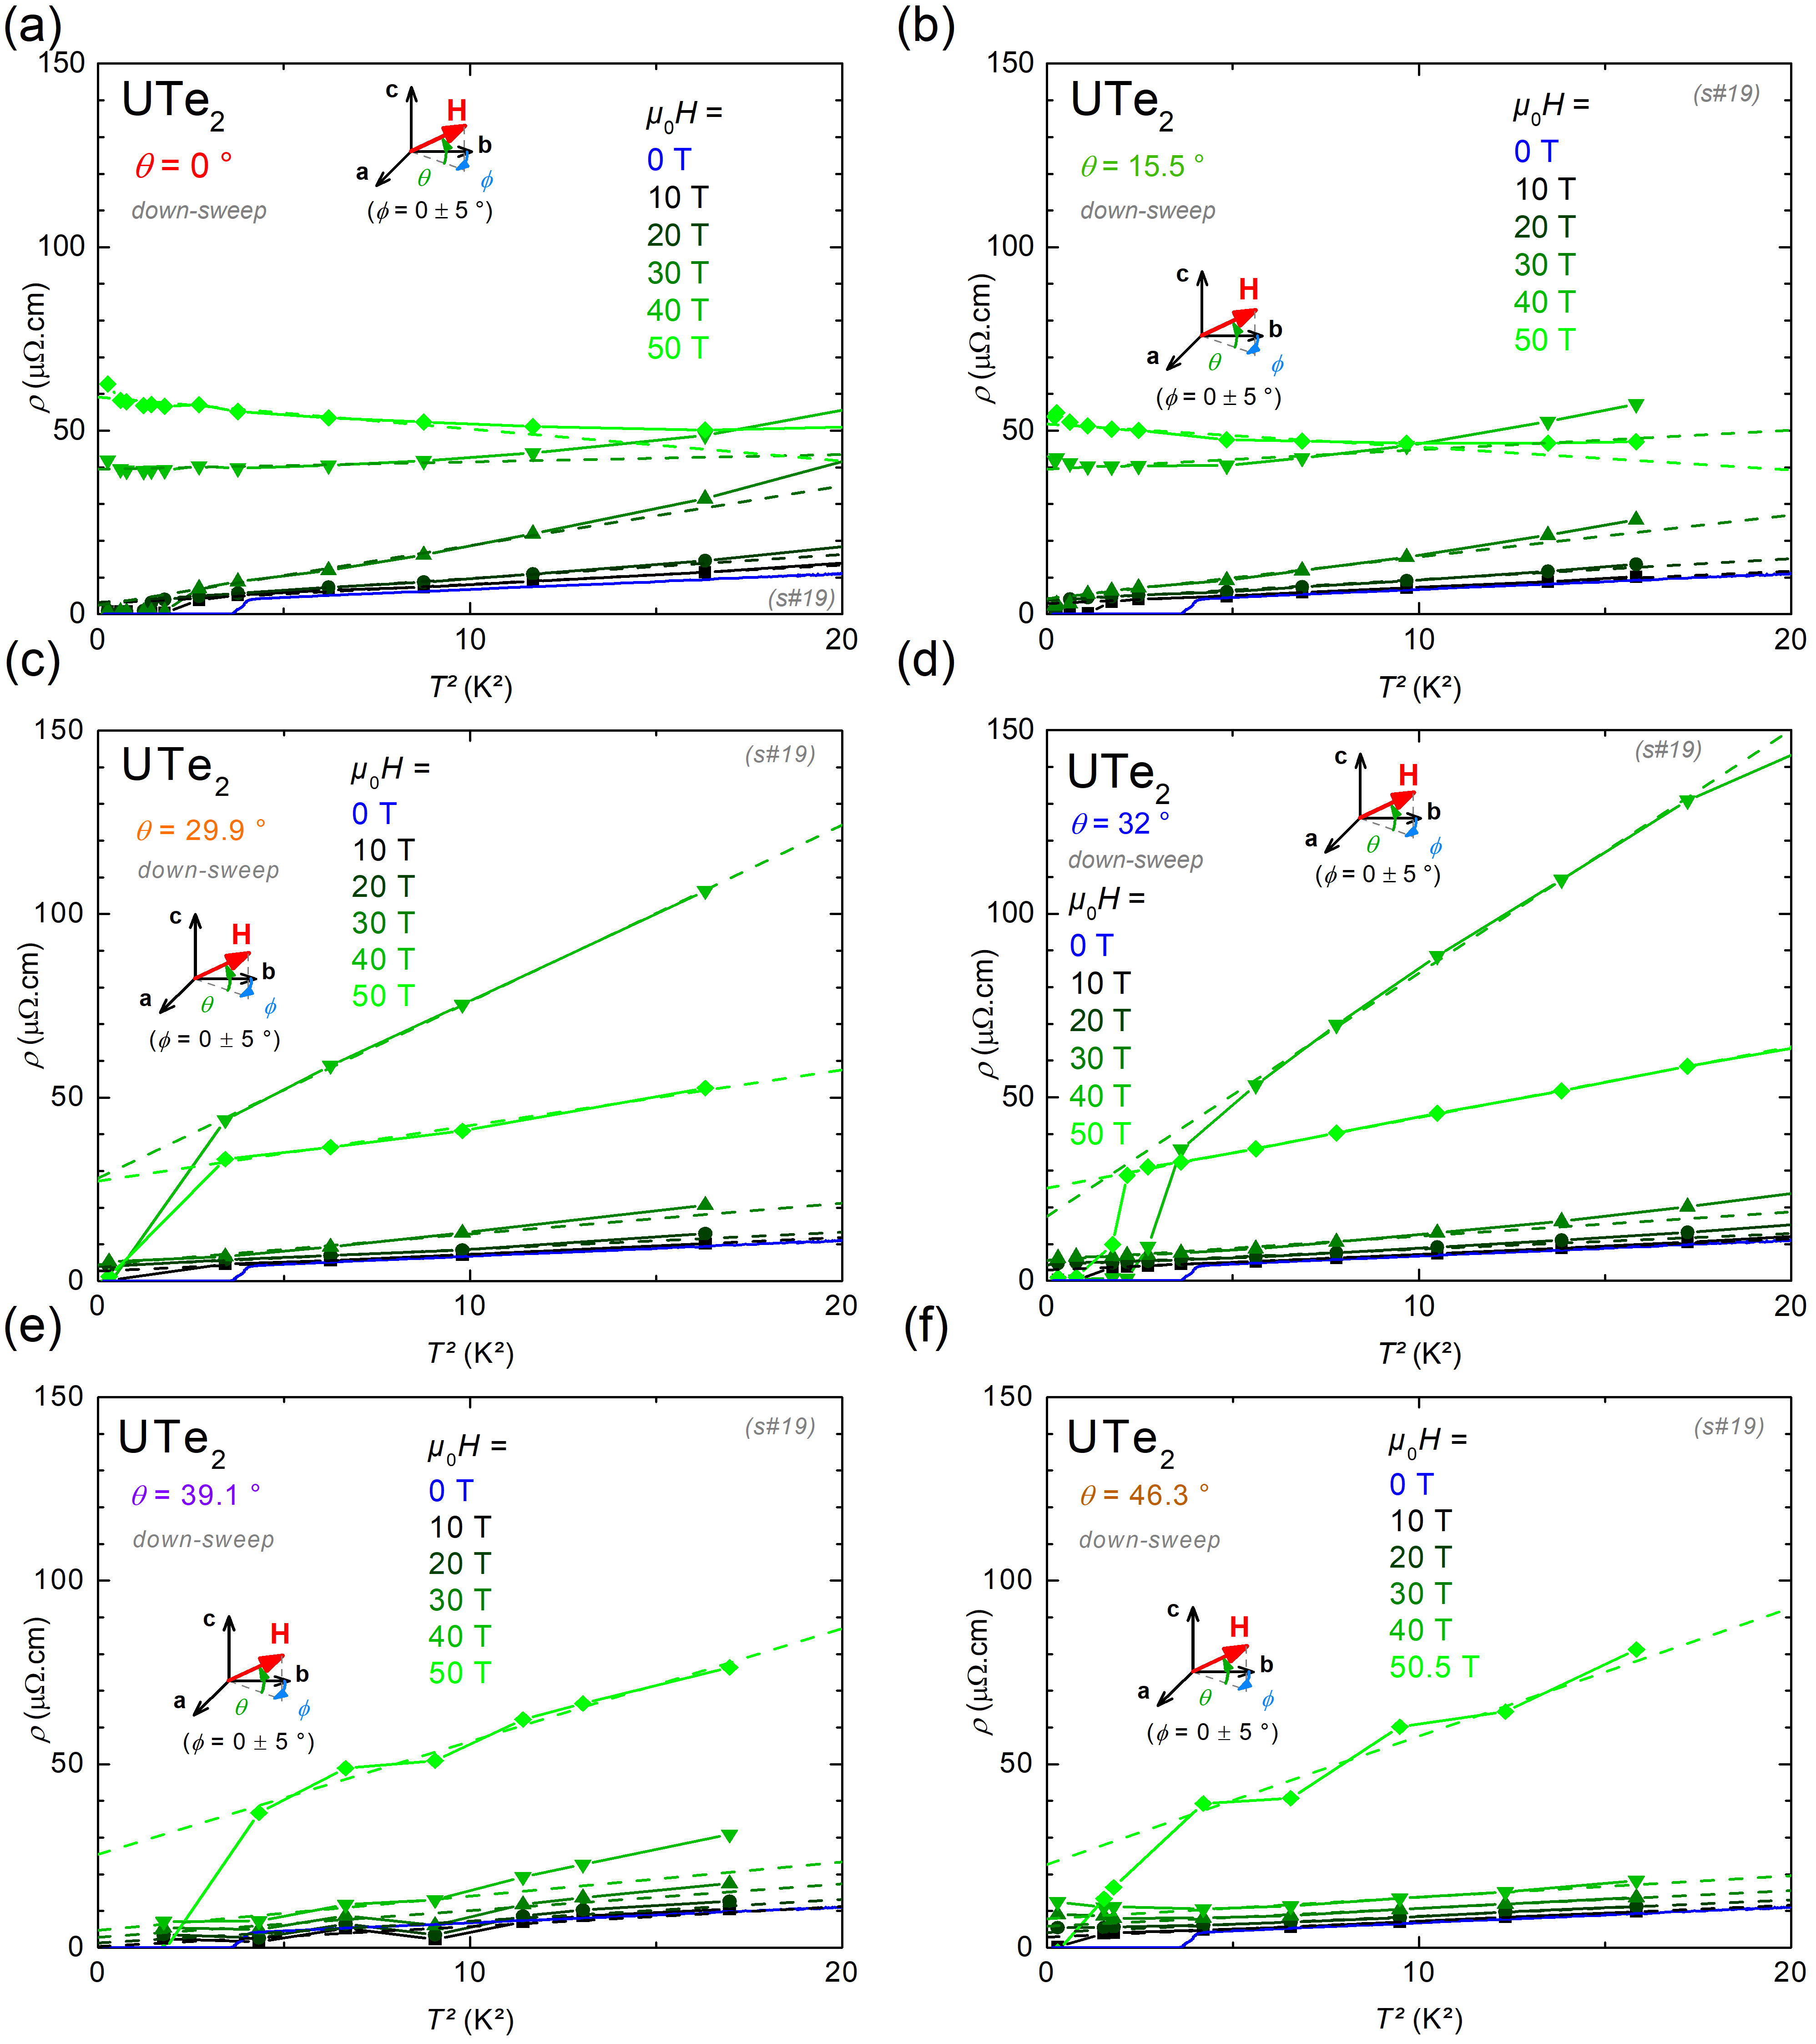
Figures S8 and S9 present details about the low- Fermi-liquid fits to the data by used to extract the coefficient , for samples and , respectively. The variation of in magnetic fields up to 50 T and the fits to the data are presented for all directions of magnetic field investigated, with angles varying from () to .
Figure S10(a) presents a comparison between low- and high- Fermi-liquid fits to the data collected on sample in magnetic fields of 0.5, 36 and 50 T applied with the angle . The low- and high- fits have been performed in temperature ranges K and 2.1 K K, respectively. For field directions close to , i.e., at low angles , an increase of at low temperature and high field is attributed to a carriers cyclotron-motion effect, which is induced in the highest-quality samples. The cyclotron-motion effect leads to reduced fitted values of , which take here non-physical negative values at the highest fields. Figure S10(b) presents the field variation of extracted from electrical-resistivity data collected on samples , and in a magnetic field , which have been grown by the chemical vapor transport (CVT) method (data from Knafo et al. (2019)). In comparison with the MSF samples, the CVT samples have a lower quality, as indicated by a lower residual-resistivity ratio Aoki et al. (2024) and a smaller cyclotron-motion effect. The CVT samples , and do not show a cyclotron-motion contribution to at high fields and low temperatures, and they can be considered as a reference for a coefficient not affected by the cyclotron-motion effect. Figure S10(b) shows that the field variations of extracted from high- fits on sample and extracted from low- fits on samples , and are very similar, supporting that the high- fits permit extracting a coefficient , which is weakly affected by the cyclotron-motion effect on our MSF samples.
Figures S11 and S12 show a comparison of the magnetic-field variations of extracted from low- and high- fits to on samples and , respectively, for each of the angles investigated here. Similar results are obtained for samples and . For angles , no cyclotron motion is detected and the two types of fits give similar results.
Figure S13 shows the magnetic-field variation of the residual resistivity extracted for sample from low- and high- fits to for angles and from low- fits to for angles . A jump in the residual resistivity occurs at the metamagnetic transition as previously reported in Knafo et al. (2019, 2021); Knebel et al. (2024). For , increases in high fields due to the cyclotron-motion effect, whose signatures are not observed for .
Figure S14 shows the variation of extracted from Fermi-liquid fits to the electrical resistivity of UTe2 sample , for 4.2 (from high- fits for and low- fits for ) as a function of . It emphasizes that, while has a rather symmetric variation through at low angles , its variation becomes asymmetric through at angles , with a shoulder indicative of enhanced correlations developing for .
Figure S15 compares the magnetic-field variations of extracted for different angles on the three samples (, , and ) grown by the MSF technique investigated here and on other samples (, , , , , and ) grown by the CVT technique and investigated in Knafo et al. (2019, 2021); Knafo . Samples and have been studied in angles and sample has been studied in angles . Samples , , and have been studied in a magnetic field with . Samples , , and have also been studied in a magnetic field tilted by an angle initially estimated by using a sample holder with a fixed tilted direction. However, different values of the metamagnetic field indicate different angles, which were re-estimated here to for sample , for sample , and and for sample , assuming no tilt of the magnetic field towards the direction , from the now-well-characterized angle- dependence of (see Figure S6 and Ran et al. (2019); Schönemann et al. (2022); Frank et al. (2024); Wu et al. (2024); Helm et al. (2024); Lewin et al. (2024)). The data compiled in Figure S15 show similar variations of as a function of and and demonstrate the reproducibility of the results presented in our paper.
S4 Flux-flow resistivity
Figures S16(a-b) present a zoom on measured on samples and , respectively, at temperatures K and magnetic fields up to 25 T. At the lowest temperatures, we find that, instead of a perfectly zero resistivity, a small contribution to the electrical resistivity is measured in the superconducting state. It results from the combination of two effects. The first one is a capacitive effect due to non-perfect electrical contacts on the sample, inducing a non-intrinsic contribution cm to the electrical resistivity, measured here at a high frequency of kHz. As shown in Figures S16(c-d), this capacitive effect is smaller at smaller frequencies kHz. The second effect results from a flux-flow contribution to the high-field electrical resistivity, which is observed here in the superconducting phase SC1, but not in the superconducting phase SC2. Two kinks observed in the electrical resistivity at mK at the magnetic fields and , which reach 8.2 T and 17.6 T in sample , and 7.5 T and 18.7 T in sample , respectively, are attributed to the flux-flow contribution to . Figures S16(e-f) presents the magnetic-field-temperature phase diagrams obtained on samples and , respectively, in magnetic fields . The temperature dependence of coincides with that of the critical field delimiting the superconducting phase SC1, which was determined by heat-capacity measurements in Rosuel et al. (2023). This indicates that SC1 is associated with a larger flux-flow resistivity than SC2. Flux-flow contributions to the electrical resistivity of UTe2 under a magnetic field have also been observed in Sakai et al. (2023); Tokiwa et al. (2023).
References
- Sakai et al. (2022) H. Sakai, P. Opletal, Y. Tokiwa, E. Yamamoto, Y. Tokunaga, S. Kambe, and Y. Haga, Phys. Rev. Mater. 6, 073401 (2022).
- Knebel et al. (2019) G. Knebel, W. Knafo, A. Pourret, Q. Niu, M. Vališka, D. Braithwaite, G. Lapertot, M. Nardone, A. Zitouni, S. Mishra, I. Sheikin, G. Seyfarth, J.-P. Brison, D. Aoki, and J. Flouquet, J. Phys. Soc. Jpn. 88, 063707 (2019).
- Ran et al. (2019) S. Ran, I.-L. Liu, Y. S. Eo, D. J. Campbell, P. Neves, W. T. Fuhrman, S. R. Saha, C. Eckberg, H. Kim, J. Paglione, D. Graf, J. Singleton, and N. P. Butch, Nat. Phys. 15, 1250 (2019).
- Knafo et al. (2021) W. Knafo, M. Nardone, M. Vališka, A. Zitouni, G. Lapertot, D. Aoki, G. Knebel, and D. Braithwaite, Commun. Phys. 4, 40 (2021).
- Schönemann et al. (2022) R. Schönemann, P. F. Rosa, S. M. Thomas, Y. Lai, D. N. Nguyen, J. Singleton, E. L. Brosha, R. D. McDonald, V. Zapf, B. Maiorov, et al., arXiv:2206.06508 (2022).
- Frank et al. (2024) C. E. Frank, S. K. Lewin, G. Saucedo Salas, P. Czajka, I. M. Hayes, H. Yoon, T. Metz, J. Paglione, J. Singleton, and N. P. Butch, Nat. Commun. 15, 3378 (2024).
- Wu et al. (2024) Z. Wu, T. Weinberger, J. Chen, A. Cabala, D. Chichinadze, D. Shaffer, J. Pospíšil, J. Prokleška, T. Haidamak, G. Bastien, et al., Proc. Natl. Acad. Sci. U.S. A. 121, e2403067121 (2024).
- Helm et al. (2024) T. Helm, M. Kimata, K. Sudo, A. Miyata, J. Stirnat, T. Förster, J. Hornung, M. König, I. Sheikin, A. Pourret, G. Lapertot, D. Aoki, G. Knebel, J. Wosnitza, and J.-P. Brison, Nat. Commun. 15, 37 (2024).
- Lewin et al. (2024) S. K. Lewin, P. Czajka, C. E. Frank, G. S. Salas, H. Yoon, Y. S. Eo, J. Paglione, A. H. Nevidomskyy, J. Singleton, and N. P. Butch, arXiv:2402.18564 (2024).
- Knafo et al. (2019) W. Knafo, M. Vališka, D. Braithwaite, G. Lapertot, G. Knebel, A. Pourret, J.-P. Brison, J. Flouquet, and D. Aoki, J. Phys. Soc. Jpn. 88, 063705 (2019).
- Aoki et al. (2024) D. Aoki, I. Sheikin, N. Marquardt, G. Lapertot, J. Flouquet, and G. Knebel, J. Phys. Soc. Jpn. 93, 123702 (2024).
- Knebel et al. (2024) G. Knebel, A. Pourret, S. Rousseau, N. Marquardt, D. Braithwaite, F. Honda, D. Aoki, G. Lapertot, W. Knafo, G. Seyfarth, J.-P. Brison, and J. Flouquet, Phys. Rev. B 109, 155103 (2024).
- (13) W. Knafo, “unpublished,” .
- Rosuel et al. (2023) A. Rosuel, C. Marcenat, G. Knebel, T. Klein, A. Pourret, N. Marquardt, Q. Niu, S. Rousseau, A. Demuer, G. Seyfarth, G. Lapertot, D. Aoki, D. Braithwaite, J. Flouquet, and J.-P. Brison, Phys. Rev. X 13, 011022 (2023).
- Sakai et al. (2023) H. Sakai, Y. Tokiwa, P. Opletal, M. Kimata, S. Awaji, T. Sasaki, D. Aoki, S. Kambe, Y. Tokunaga, and Y. Haga, Phys. Rev. Lett. 130, 196002 (2023).
- Tokiwa et al. (2023) Y. Tokiwa, H. Sakai, S. Kambe, P. Opletal, E. Yamamoto, M. Kimata, S. Awaji, T. Sasaki, Y. Yanase, Y. Haga, et al., Phys. Rev. B 108, 144502 (2023).