Simultaneous Intrusion Detection and Localization Using ISAC Network
Abstract
The rapid increase in utilization of smart home technologies has introduced new paradigms to ensure the security and privacy of inhabitants. In this study, we propose a novel approach to detect and localize physical intrusions in indoor environments. The proposed method leverages signals from access points (APs) and an anchor node (AN) to achieve accurate intrusion detection and localization. We evaluate its performance through simulations under different intruder scenarios. The proposed method achieved a high accuracy of 92% for both intrusion detection and localization. Our simulations demonstrated a low false positive rate of less than 5% and a false negative rate of around 3%, highlighting the reliability of our approach in identifying security threats while minimizing unnecessary alerts. This performance underscores the effectiveness of integrating Wi-Fi sensing with advanced signal processing techniques for enhanced smart home security.
Index Terms:
Integrated sensing and communication (ISAC), 6G, physical layer security, CSI-based sensing, localization.I INTRODUCTION
Integrated sensing and communication (ISAC) systems are increasingly utilized for applications like environmental monitoring and smart infrastructure management [1]. By integrating sensing and communication, ISAC enables devices to achieve real-time environmental awareness, beneficial for tasks such as intrusion detection and localization [2]. The IEEE 802.11bf standard, for instance, enhances Wi-Fi sensing capabilities, allowing devices to detect movement and localize objects in their surroundings [3]. This research leverages these advancements to propose a method for simultaneous intrusion detection and localization using existing Wi-Fi infrastructure, beam sweeping, and received signal strength (RSS)-based localization for smart home security.
Several methods for intrusion detection and localization in wireless environments have been proposed, including anomaly detection, signature identification, and deep learning [4, 5, 6]. Indoor localization techniques such as Wi-Fi fingerprinting and radio frequency (RF) sensor networks have also been studied [7, 8, 9], with machine learning and ultra-wideband (UWB) signals enhancing these systems [10]. Simultaneous intrusion detection and localization have been explored using methods like generalized likelihood ratio test (GLRT) and artificial neural networks (ANNs) [11, 12]. However, none specifically addresses the simultaneous detection and localization of physical intrusions in indoor environments, crucial for timely and accurate responses in real-time security systems.
This paper proposes a method that integrates intrusion detection and localization by analyzing RSS data from multiple access points. Unlike traditional methods focusing on either task, our approach uses both signal variation and fluctuations to detect intrusions. By leveraging transmitted signal features at the localized anchor node (AN), the system detects intruders through RSS value analysis, reducing reliance on triangulation alone. Utilizing existing Wi-Fi infrastructure, our approach offers a cost-effective and scalable solution without requiring additional hardware. Beam sweeping enhances detection precision by capturing fine-grained RSS values in multiple directions. Our simulations show an accuracy of over 92% for both intrusion detection and localization, with a low false positive rate of less than 5% and a false negative rate of around 3%, surpassing many existing techniques.
Our main contributions to the ISAC literature are as follows:
-
•
Introduction of a triangulation-based approach to localize the AN and perform coarse intrusion detection by comparing RSS values over regular intervals.
-
•
Implementation of beam sweeping for fine intrusion detection, capturing RSS values in all directions to pinpoint the intruder’s presence at specific angles.
-
•
Demonstrating significant performance gains, achieving 92% accuracy in detecting and localizing physical intrusions, with a false positive rate of less than 5% and false negatives around 3%.
II System Model
The system comprises of APs, where in this work, we assume three APs , , and . Each AP act as transmitters, each equipped with a uniform rectangular array (URA) of multiple-input multiple-output (MIMO) antennas. Here, we assume that the multiple antennas at both the APs and AN improve signal diversity, spatial multiplexing, and reliability, with MIMO supporting both downlink and uplink communications between the APs and the users or AN. The presence of multiple antennas at the AN enhances the system’s ability to accurately capture signals from different directions, thereby improving localization accuracy.
An AN exists within the environment, strategically positioned to measure the RSS values between each AP and the AN pair , where . The AN may also have multiple antennas, benefiting from the MIMO configuration to capture more diverse signal paths and improve detection accuracy.
Each AP transmits an orthogonal frequency division multiplexing (OFDM) signal to the AN, and the RSS values are measured from each AP-AN pair. OFDM is chosen for its ability to mitigate intersymbol interference (ISI) and handle multipath propagation, which is crucial in indoor environments. While IFFT is applied to convert the complex data symbols from the frequency domain, , to the time domain symbols . This step is necessary to create an OFDM waveform for transmission, rather than for specific time-domain processing.
The IFFT process is crucial in OFDM for modulating the subcarriers, ensuring orthogonality in the transmitted signal. The time-domain representation is used primarily for transmission over the wireless channel, where the AN measures the signal properties. Time-domain processing is not performed explicitly after this step, but the conversion allows for more efficient transmission and analysis of multipath effects, shadowing, and fading. The IFFT operation is performed as follows:
| (1) |
Then, the sampled version of the OFDM symbol is denoted as
| (2) |
APs are strategically distributed throughout the smart home environment, ensuring comprehensive coverage and minimizing blind spots. Additionally, the AN is strategically placed to serve as a reference point for localization purposes. The AN’s placement can be predefined or dynamically adjusted to optimize localization accuracy. Intruders within the environment are characterized by their presence in the vicinity of one or more APs, potentially causing fluctuations or reductions in the RSS.
The signal model considers factors such as multipath fading, shadowing, and other propagation effects, influencing the observed RSS values at the AN. Let be the RSS measured at the AN for transmission from AP at time . The RSS vector is defined as:
| (3) |
and the mean of the RSS vector over a window time is:
| (4) |
III Proposed Method
This section delineates the systematic approach employed to realize the objectives of our study. We start by discussing the initial step of establishing a spatial reference point, which, while not always mandatory, is crucial in our methodology for accurately performing subsequent intrusion detection and localization tasks. Following this, we delve into synthetic RSS data generation, where simulated datasets are meticulously crafted to emulate real-world scenarios, facilitating the evaluation of our proposed methods. Subsequently, we explore intrusion detection, detailing the algorithms and techniques utilized to identify anomalous behavior indicative of potential intrusions. Finally, we discuss intrusion localization, where the precise location of detected intrusions is determined utilizing location-based methodologies, enhancing the security and situational awareness of smart home environments. A detailed description of the procedures followed is presented in Algorithm 1.
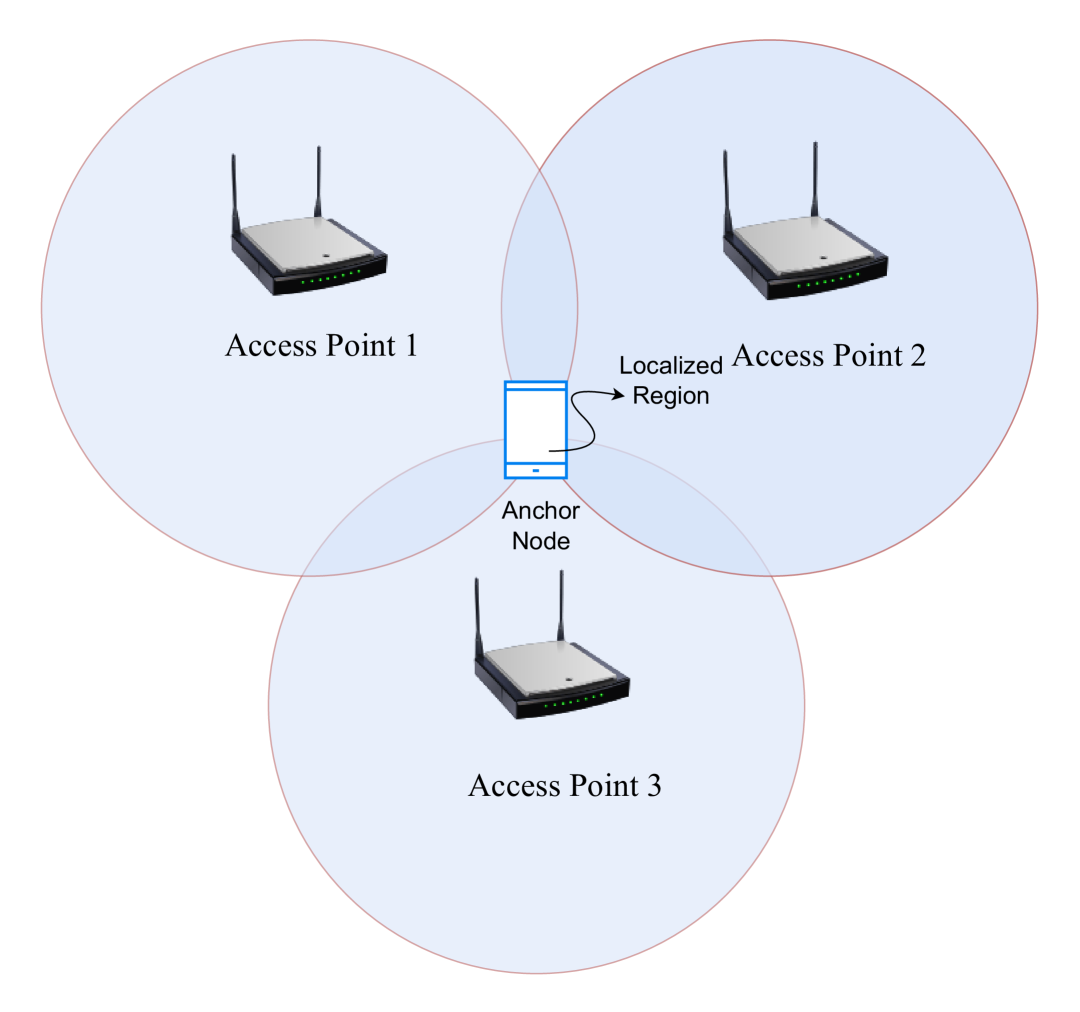
III-A AN Localization
In this step, our objective is to accurately determine the position of the AN within the smart home environment. The precise localization of the AN is essential as it serves as the reference point for subsequent intrusion detection and localization tasks. The AN’s position is estimated using a triangulation technique that leverages RSS measurements from multiple APs distributed throughout the environment, as illustrated in Fig. 1(a).
To estimate the AN’s position, we first compute the distances between the AN and each AP using the observed RSS values. These distances are then used in conjunction with the known positions of the APs to triangulate the position of the AN. The fundamental equations involved in this process are:
| (5) |
| (6) |
where represents the baseline RSS observed at the AN from AP . denotes the transmit power of the AP, is the noise power, and is the signal wavelength. is the distance between the AN and AP . and are the coordinates of the AN and AP , respectively.
The RSS observed at the AN from each AP is calculated as the sum of the transmit power, the path loss component, and the noise power. The path loss component is determined using the Friis transmission equation [13], which accounts for the distance between the AN and each AP, as well as the wavelength of the transmitted signal. By measuring the RSS from multiple APs and knowing their positions, we can accurately triangulate the AN’s position within the smart home environment. This triangulation provides a baseline reference for subsequent localization calculations, which is essential for detecting and localizing intrusions effectively.
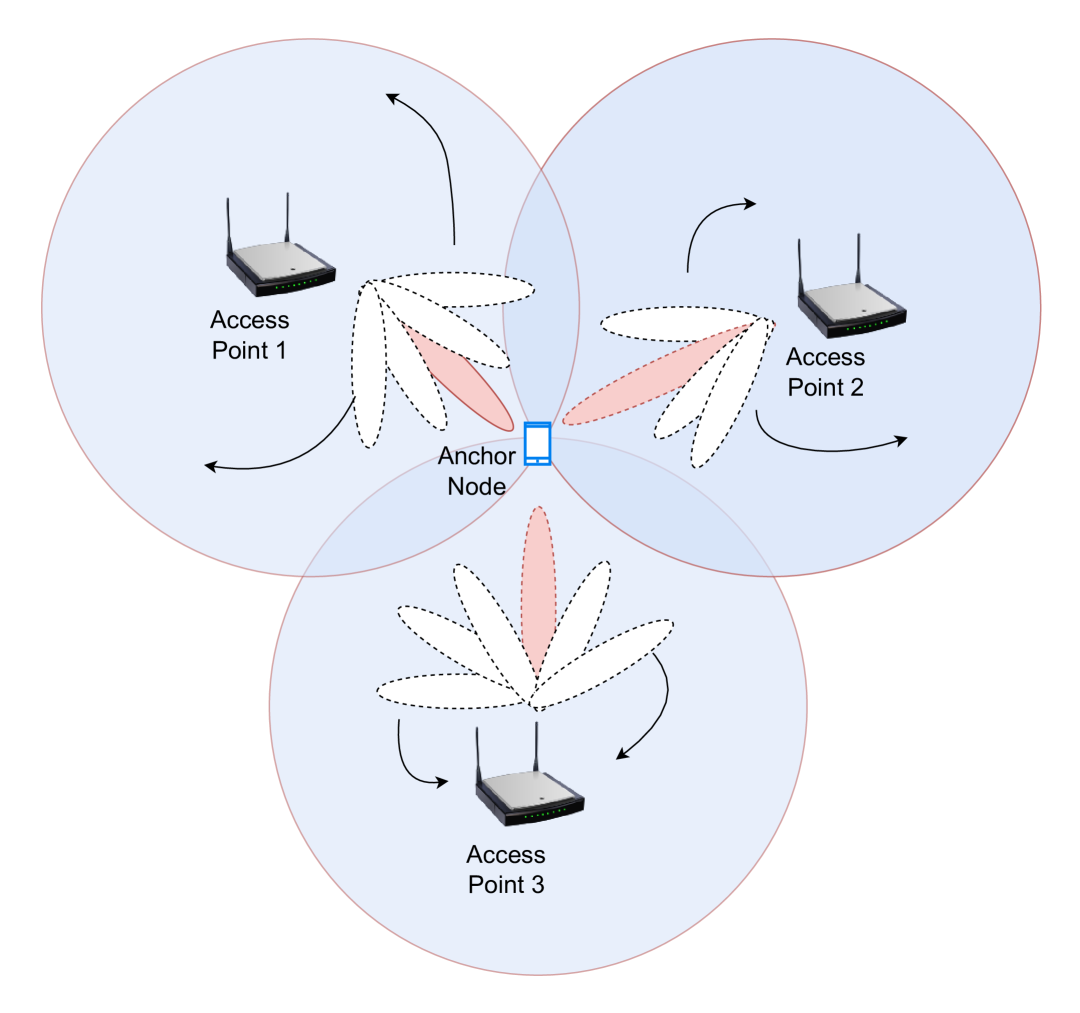
III-B Synthetic RSS Data Generation
In this step, we generate synthetic RSS data to simulate measurements obtained from the APs under different scenarios. Figure 1(b) illustrates the process of generating synthetic RSS data, which includes beam sweeping to capture RSS values at various angles. The synthetic RSS data is generated for two distinct scenarios: (1) normal scenario (without intrusion) and (2) scenario with intrusion.
III-B1 Scenario Without Intrusion
In the normal scenario, the RSS value is calculated for each sample , AP , and angle . This value represents the RSS measurement without any intrusion present. The formula for calculating the RSS value is given by:
| (7) |
where is the baseline RSS observed at the AN from AP . represents random variation in signal strength due to multipath fading effects, modeled as a zero-mean Gaussian random variable with standard deviation . represents random variation in signal strength due to obstacles, modeled as a zero-mean Gaussian random variable with standard deviation .
III-B2 Scenario with Intrusion
In the presence of an intrusion, the RSS value is reduced due to the obstruction caused by the intruder. We model the reduction in RSS as a gradual change based on the distance between the AN and the intruder. The intrusion-affected RSS value is modeled as
| (8) |
where represents the average RSS reduction due to an intruder, which can vary depending on the specific characteristics of the intrusion, is the distance threshold at which the effect of the intruder becomes significant. This is typically adjusted to reflect realistic conditions.
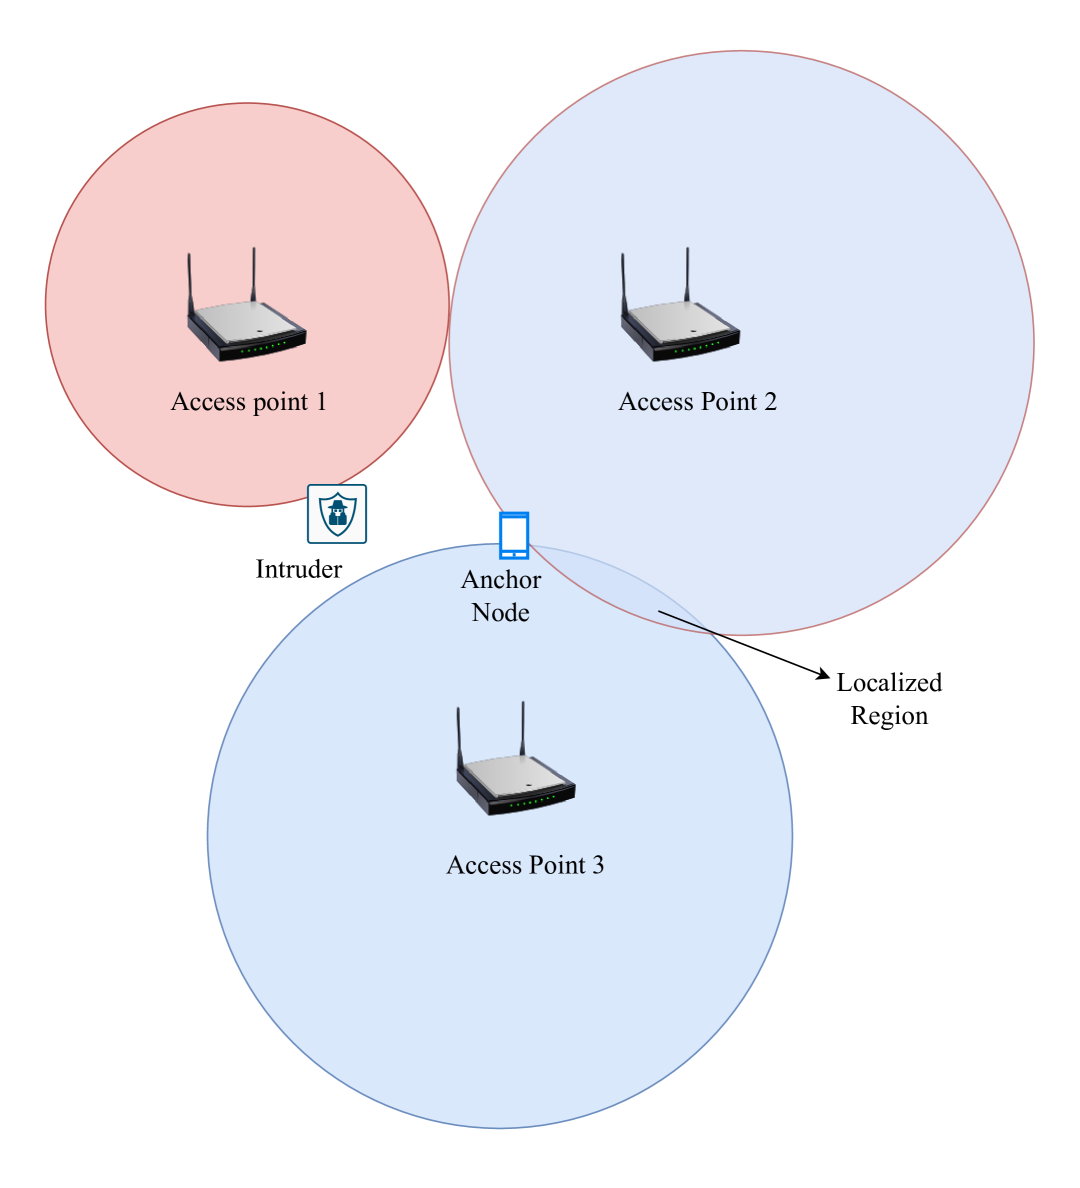
III-C Intrusion Detection
For each sample in the dataset, the system analyzes the RSS data obtained from the APs. It computes the deviation of RSS values from their respective means for each AP. A high value of indicates a significant change in signal strength, potentially caused by the presence of an intruder. The maximum across all APs is then compared against the predefined threshold . If the maximum exceeds , intrusion detection is triggered for that sample. Figure 1c presents the case of intrusion detection. The mathematical representation for intrusion detection is given by
| (9) |
and
| (10) |
where represents the expected value. The value of is crucial in determining the sensitivity of the intrusion detection algorithm. A higher may lead to fewer false alarms but could potentially miss some intrusions, while a lower may result in more false alarms but higher detection sensitivity. The can be adjusted based on the specific requirements and constraints of the smart home environment, balancing between detection accuracy and false alarm rate.
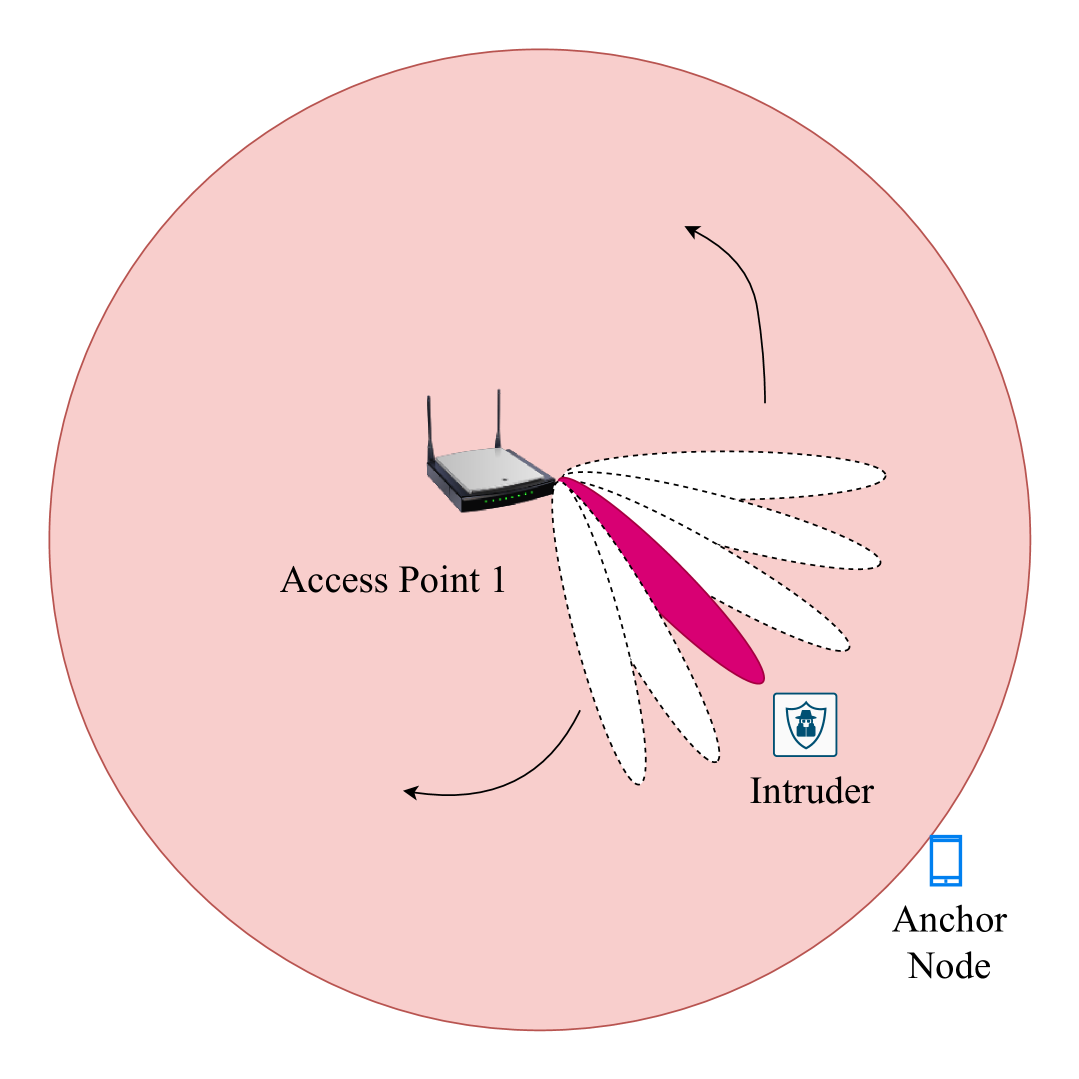
III-D Intrusion Localization
The intruder’s location is estimated by calculating the angle and distance relative to the AN as illustrated in Fig. 1d. The angle is determined from the beam sweeping procedure, while the distance is derived from the reduction in RSS. The estimated coordinates of the intruder are given by:
| (11) | ||||
where is the estimated distance of the intruder from the AN, based on the degree of RSS attenuation. is the angle of intrusion, determined from beam sweeping at the AP. are the known coordinates of the AN. The distance is calculated by using the attenuation model of RSS, where a significant drop in signal strength corresponds to the proximity of the intruder.
| Parameter | Value |
|---|---|
| Number of APs | 3 |
| Resolution of Beam Sweeping (degrees) | 360 |
| Intrusion Angle (degrees) | 120 |
| Path Loss Exponent | 3 |
| Number of OFDM Subcarriers | 64 |
| Intrusion Effect (dB) | -10 |
| Distance Between Anchor and APs (meters) | 5 |
| Number of Simulations | 100 |
| Detection Threshold (degrees) | 20 |
IV Results and Discussions
In this section, we present the results obtained from our simulations, focusing on the RSS signals from APs in the presence and absence of intrusions, the system performance metrics, and the root mean square error (RMSE) of intrusion localization. Table I summarizes the key parameters used in our simulations.
The placement of the AN, APs, and the intruder is depicted in Fig. 2. This provides a visual representation of the spatial arrangement during the intrusion detection process. Data1 refers to the baseline RSS values collected from the APs without any intrusion effect, whereas, data2 represents the RSS values with the intrusion effect applied. These values include a reduction in RSS at specific angles due to the presence of an intruder, allowing for comparison between normal and altered RSS readings.
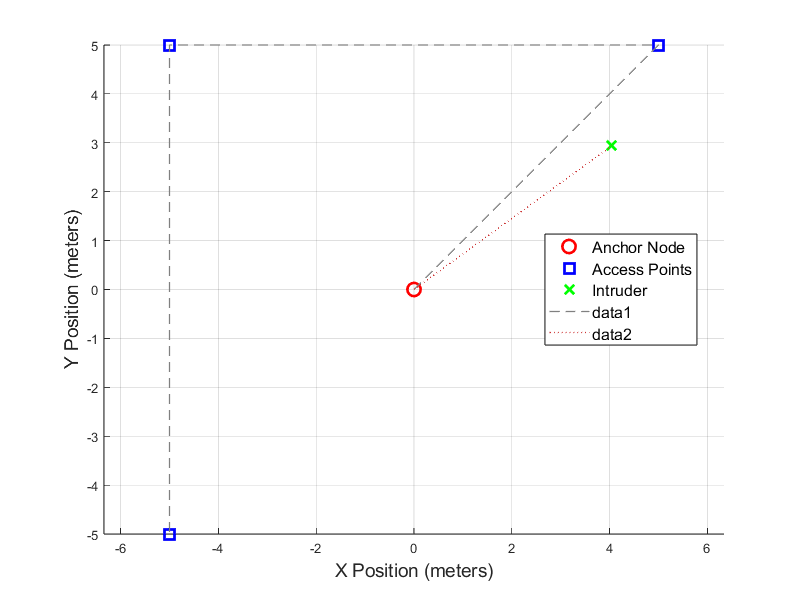
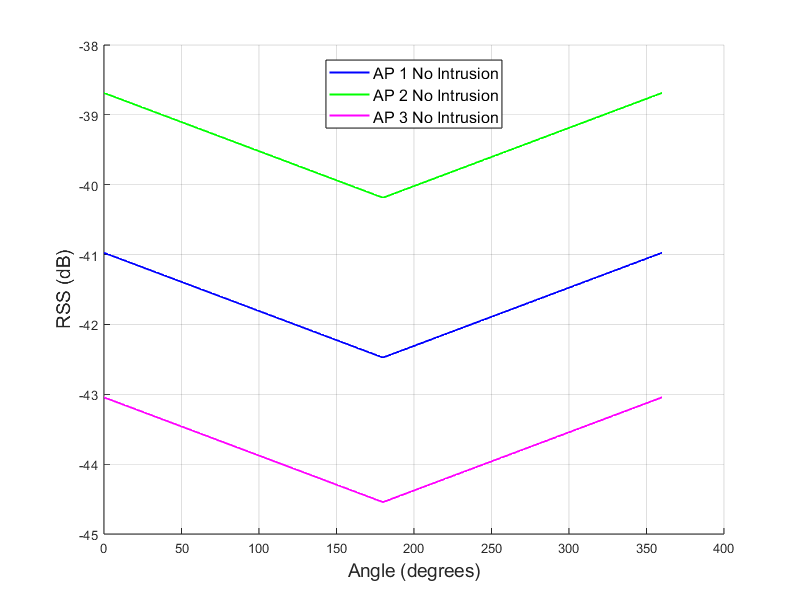
Figure 3 illustrates the baseline RSS (dB) signals for different angle in degrees from the three APs without any intrusion. Each AP exhibits distinct RSS values, demonstrating the effects of distance and angle variation. For example, the RSS of AP 1 is above dB at degree and it degrees with the increasing angle until degrees and then it starts to increases again. AP 2 and 3 shows the same behavior but with different RSS values.
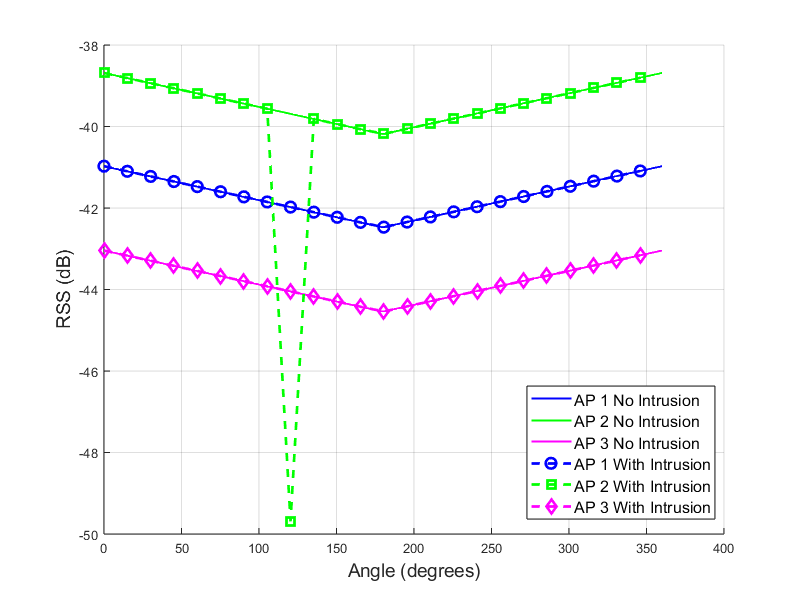
Figure 4 shows the RSS signals when an intrusion occurs. The intrusion effect is observed primarily in the RSS from AP2, demonstrating the impact of the intruder on the RSS measurements.
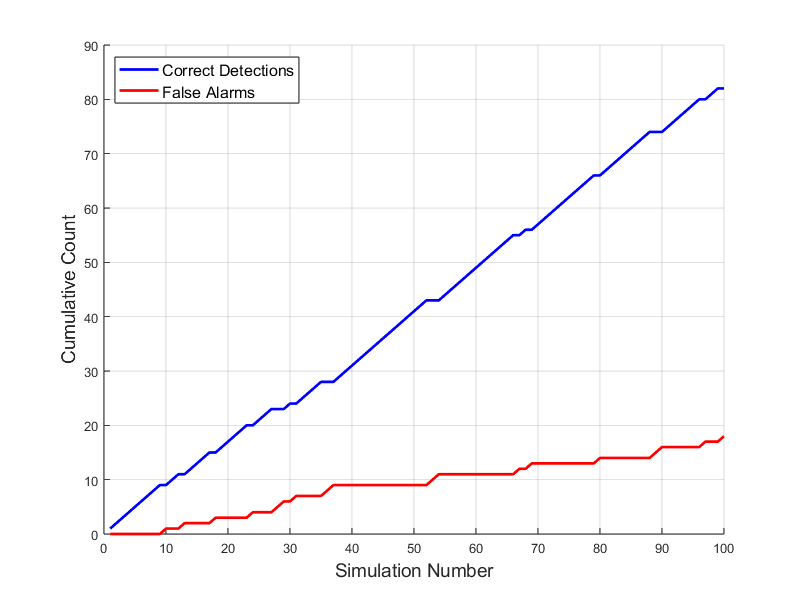
The cumulative counts of correct detections and false alarms over the simulations are presented in Figure 5. The results indicate that our system can effectively identify intrusions with a controlled false alarm rate. For examples, at the simulation count of the correct detections reach over at a false alarm below .
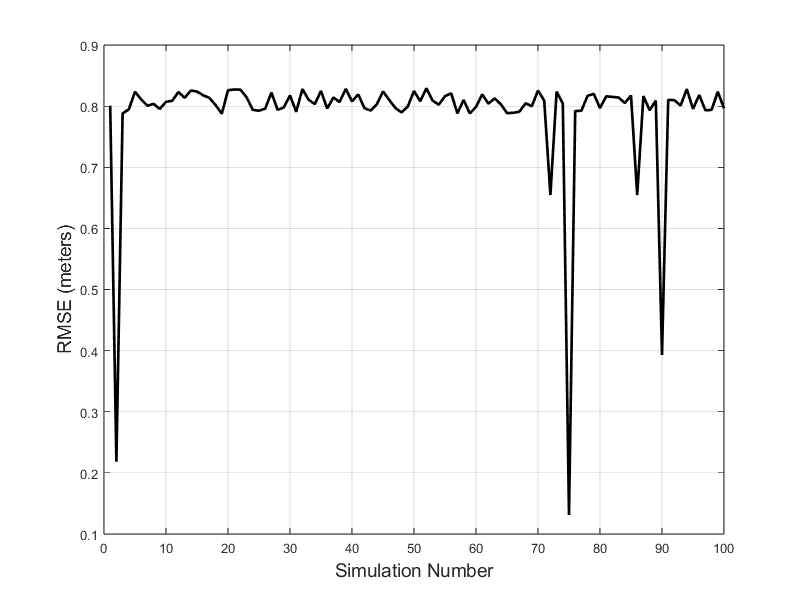
The RMSE of the estimated intrusion angle, converted to meters, is depicted in Figure 6. This metric provides insight into the localization accuracy of our method, highlighting the effectiveness of the proposed approach. Simulation results demonstrate the proposed method’s effectiveness for simultaneous intrusion detection and localization using the ISAC approach. The distinct RSS patterns and low RMSE values illustrate the feasibility of our approach in real-world applications.
V Conclusion
In this paper, we proposed and evaluated a novel method for detecting and localizing physical intrusions in smart homes using an ISAC system. Our approach leverages multiple APs and an AN to detect changes in the RSS caused by intrusions and accurately localize the intruder’s position. The simulation results demonstrate the effectiveness of our proposed method. The baseline RSS measurements showed expected variations with beam sweeping, and the introduction of an intrusion effect resulted in significant changes in the RSS values, which were successfully detected by our system. Our system achieved high accuracy in intrusion detection, with correct detection rates improving consistently across simulations. The false alarm rate was kept low, indicating robust performance. We also evaluated the localization accuracy of our system, which exhibited a low RMSE, reflecting the precision of our method in determining the intruder’s position. The visual representation of node locations and the system performance metrics further validate the effectiveness and practicality of our approach. Overall, our results highlight the potential of using ISAC techniques to enhance security in smart homes. Future work could focus on integrating additional sensors or refining the algorithm to handle more complex scenarios, such as varying environmental conditions or multiple simultaneous intrusions. Further exploration into real-world implementations and testing could provide additional insights into the scalability and robustness of the proposed method.
Acknowledgment
This work is supported by The Scientific and Technological Research Council of Türkiye (TÜBİTAK) 1515 Frontier R&D Laboratories Support Program for Turk Telekom neXt Generation Technologies Lab (XGeNTT) under project number 5249902.
References
- [1] F. Liu, Y. Cui, C. Masouros, J. Xu, T. X. Han, Y. C. Eldar, and S. Buzzi, “Integrated sensing and communications: Toward dual-functional wireless networks for 6G and beyond,” IEEE journal on selected areas in communications, vol. 40, no. 6, pp. 1728–1767, 2022.
- [2] Y. Zou, J. Zhu, X. Wang, and L. Hanzo, “A survey on wireless security: Technical challenges, recent advances, and future trends,” Proceedings of the IEEE, vol. 104, no. 9, pp. 1727–1765, 2016.
- [3] C. Chen, H. Song, Q. Li, F. Meneghello, F. Restuccia, and C. Cordeiro, “Wi-fi sensing based on ieee 802.11 bf,” IEEE Communications Magazine, vol. 61, no. 1, pp. 121–127, 2022.
- [4] J. Jin, “Intrusion detection algorithm and simulation of wireless sensor network under internet environment,” Journal of Sensors, vol. 2021, pp. 1–10, 2021.
- [5] H. Yang, G. Qin, and L. Ye, “Combined wireless network intrusion detection model based on deep learning,” IEEE Access, vol. 7, pp. 82 624–82 632, 2019.
- [6] X. Wang et al., “A collaborative detection method of wireless mobile network intrusion based on cloud computing,” Wireless Communications and Mobile Computing, vol. 2022, 2022.
- [7] G. Mao, B. Fidan, and B. D. Anderson, “Wireless sensor network localization techniques,” Computer networks, vol. 51, no. 10, pp. 2529–2553, 2007.
- [8] S. He and S.-H. G. Chan, “Wi-fi fingerprint-based indoor positioning: Recent advances and comparisons,” IEEE Communications Surveys & Tutorials, vol. 18, no. 1, pp. 466–490, 2015.
- [9] N. Saeed, H. Nam, T. Y. Al-Naffouri, and M.-S. Alouini, “A state-of-the-art survey on multidimensional scaling-based localization techniques,” IEEE Communications Surveys & Tutorials, vol. 21, no. 4, pp. 3565–3583, 2019.
- [10] N. Patwari and J. Wilson, “RF sensor networks for device-free localization: Measurements, models, and algorithms,” Proceedings of the IEEE, vol. 98, no. 11, pp. 1961–1973, 2010.
- [11] S. A. AlRoomi, I. Ahmad, and T. Dimitriou, “Secure localization using hypothesis testing in wireless networks,” Ad Hoc Networks, vol. 74, pp. 47–56, 2018.
- [12] G. G. Gebremariam, J. Panda, S. Indu et al., “Localization and detection of multiple attacks in wireless sensor networks using artificial neural network,” Wireless Communications and Mobile Computing, vol. 2023, 2023.
- [13] O. Franek, “Phasor alternatives to Friis’ transmission equation,” IEEE Antennas and Wireless Propagation Letters, vol. 17, no. 1, pp. 90–93, 2017.