Dust continuum radiation maps from MHD simulations of accretion-ejection systems around single and binary stars
Abstract
We study the launching of magnetized jets from a resistive circumstellar disk within a binary system, employing a unique combination of 3D MHD jet launching simulations (PLUTO code) and post-processed 3D radiative transfer modeling (RADMC-3D code). Our findings reveal a well-defined jet originating from the inner region of the disk, extending to a larger disk area. While the model attains steady states for a single star, a binary system leads to the emergence of tidal effects such as the formation of “spiral arms” in the disk and inside the jet. Here we have consistently implemented a time-dependent Roche potential for the gravity of the binary. As a major step forward, we further present the first 3D radiation maps of the dust continuum for the disk-jet structure. In principle, this allows us to compare MHD simulation results to observed disk-outflow features. We, therefore, present convolved images of the dust continuum emission, employing exemplary point spread functions of the MIRI instrument (5 band) and the ALMA array (320 band). In these bands, we identify distinguishable features of the disk-jet structure, such as ”spiral arms,” which we have also seen in the MHD dynamics. For gas density increased by an order of magnitude, the disk become optically thick at 5 , but remains bright at 320 m. At this wavelength, 320 m, enhanced structural features in the disk and the base of the wind become more pronounced and are well resolved in the convolved image.
Subject headings:
Protostellar disk, radiative transfer, Magnetic fields, Magnetohydrodynamics (MHD), MHD simulation, radiation map, ISM: jets and outflows1. Introduction
It is now well known that one of the important phases of star formation is the formation and launch of stellar jets, which are high-velocity, collimated outflows of material ejected by a circumstellar disk. The stellar jets are spectacular phenomena and play a crucial role in regulating star formation by removing excess angular momentum and facilitating mass accretion onto the protostar.
There is a vast body of literature focusing on the study of jet formation through numerical simulations. Among these, pioneering work has been conducted by researchers such as Shibata & Uchida (1985); Ustyugova et al. (1995); Ouyed & Pudritz (1997), following the earlier seminal analytical approaches by Blandford & Payne (1982); Pudritz & Norman (1983); Uchida & Shibata (1985a, b). These simulations explore the formation of jets from the disk surface, considering the acceleration of jet material and its collimation by the magnetic field (Wardle & Königl, 1993; Li, 1995; Ferreira, 1997; Fendt & Čemeljić, 2002; Porth & Fendt, 2010; Vaidya et al., 2011; Sheikhnezami & Sepahvand, 2024).
However, it is essential to include the disk physics in the numerical treatment to understand the jet launching process from the inner part of the underlying disk. Today, numerical simulations of the accretion-ejection process play an essential role in understanding jet launching. A vast amount of literature exists on magnetohydrodynamics (MHD) simulation on jet launching, with ever-improving physical complexity and also numerical resolution (Uchida & Shibata, 1985b; Kudoh et al., 1998; Casse & Keppens, 2002; Zanni et al., 2007; Murphy et al., 2010; Sheikhnezami et al., 2012; Stepanovs & Fendt, 2014; Sheikhnezami & Fendt, 2018). In general, these works study how the properties of the outflow that is formed from the disk are determined from certain disk properties, namely the disk resistivity, the presence of the mean-field dynamo in the disk, or a 3D circumstellar disk in a Roche potential.
Recently, detailed discussions have taken place regarding the full 3D simulations of the disk-jet structure in both single stars and binary star systems using rectangular coordinates Sheikhnezami & Fendt (2015, 2018, 2022). However, to optimize computational efficiency, it is worthwhile to develop the model from rectangular to spherical coordinates.
It is well known that protostellar disks undergo accretion. However, the exact mechanism responsible for extracting angular momentum and driving accretion in the low-ionization ”dead” zones of the disk is a matter of debate.
In recent years, magnetohydrodynamic (MHD) disk winds have emerged as a leading candidate for this process. The study of accretion and ejection has gained significant attention in the context of protoplanetary disks, with recent research focusing on the role of MHD disk winds during the late stages of protostellar or protoplanetary disk evolution. For instance, Tabone et al. (2022) show that the essential features of disk evolution as probed by the observations are naturally reproduced by MHD wind-driven accretion. They show that MHD disk winds alone can account for both disk dispersal and accretion properties and how MHD winds can explain the correlation between disk masses and accretion rates in Lupus. In addition, de Valon et al. (2022) gave evidences for MHD wind in class I object DG Tauri B. Their results provide the strongest evidence so far for the presence of massive MHD disk winds in Class I sources with residual infall, and they suggest that the initial stages of planet formation take place in a highly dynamic environment.
Interestingly, Nazari et al. (2024) present high angular resolution (30 AU) ALMA observations of the emblematic L1448-mm protostellar system and find suggestive evidence for an MHD disk wind. Various system components (i.e., disk, inner envelope, and rotating outflow) are resolved for the first time in their observation. Further literature examines the role of MHD disk winds in protostellar and protoplanetary disks. For instance, Pascucci et al. (2023) provide a review on disk winds in protoplanetary disks, and Somigliana et al. (2023) discuss methods to disentangle the effects of disk winds and viscosity in disk observations.
In this paper, we first introduce our 3D model setup, which involves a circumstellar disk launching a magnetized jet in the presence of resistivity. Spherical coordinates are used to describe the system accurately with high resolution. We have implemented a companion star into the model setup and follow the full 3D evolution of the disk-jet in the single star and binary star systems. This allows us to investigate the companion star’s influence on the jet and disk dynamics.
The primary goal of our study is to explore the dynamical evolution of the accretion-ejection structure in these different systems. In addition, as a major step forward, we will present the first 3D radiation map of dust continuum for the disk-jet structures, utilizing the radiative transfer code ”RADMC-3D”. In principle, this can allow us to compare MHD simulation results to observed disk-outflow features.
Our paper is organized as follows: In Section 2, we introduce our model setup. In section 3, we present and discuss the dynamics in our 3D simulation of a disk-jet launched from a single star and a binary star system. In section 4, we discuss the radiative transfer model we applied to obtain the radiation map of the disk-jet. In section 5, we present the dust continuum radiation map obtained for the disk-jet structure. In Section 6, we summarize the results.
2. Model setup
In this paper, we study the formation of the magnetized jet from a circumstellar disk staying in a single star and investigate the radiative
signatures of dust particles present in the disk and the jet.
In the following, we describe our dynamical MHD modeling utilizing the PLUTO code (Mignone et al., 2007, 2012),
and the radiative transfer on the simulated MHD data applying the code
RADMC3D (Dullemond et al., 2012)111http://www.ita.uni-heidelberg.de/dullemond/
software/radmc-3d.
| Run | D | |||||
|---|---|---|---|---|---|---|
| rsin | 0 | 0 | - | 0.01 | 600-1000 | 1000 |
| rb1 | 300 | 0.01 | 29803 | 0.01 | 600-1000 | 280 |
| rb2 | 300 | 0.2 | 32486 | 0.01 | 600-1000 | 280 |
2.1. Dynamical modeling
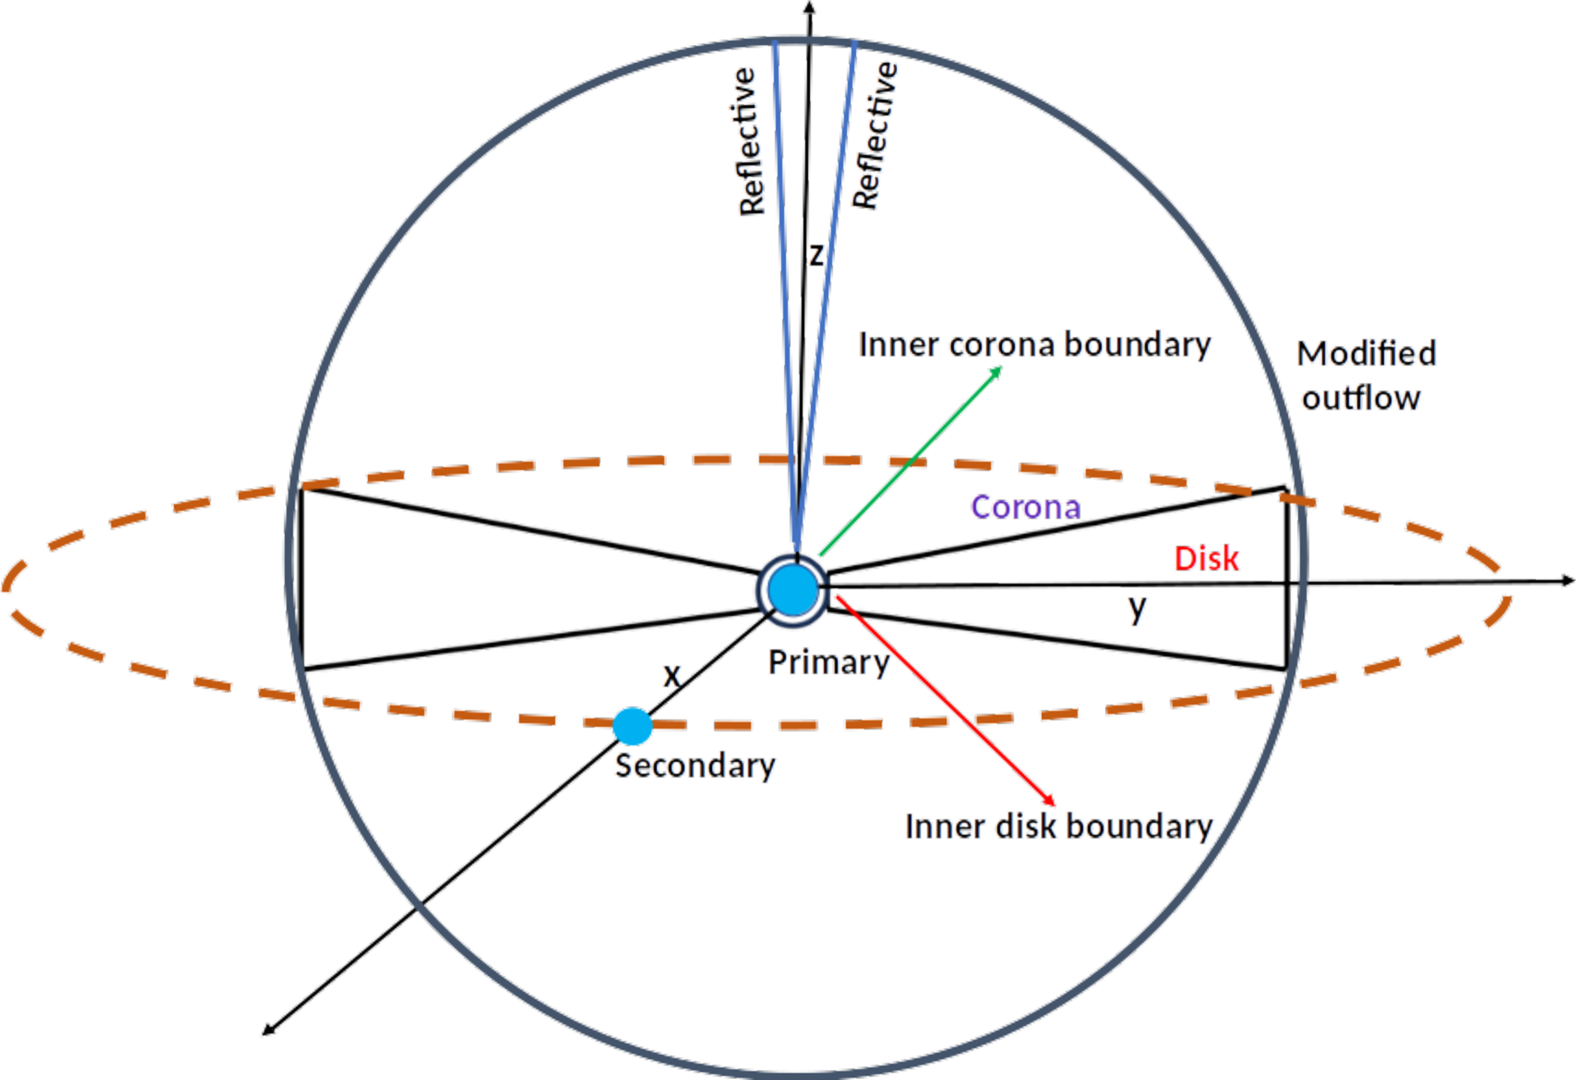
We first need to establish a proper model setup for a jet formed in a single star system. We then implement the Roche potential and consider a binary system with a ”primary” of mass and a ”secondary” of mass , separated by the distance . The origin of the coordinate system stays in the primary, and the location of the secondary is chosen to be outside the computational domain (see Figure 1).
We then derive radiation maps of the dust continuum for both the single star-disk-jet and binary star-disk-jet systems. Finally, we showcase enhanced radiation maps that have been refined by incorporating convolution and noise from a specified telescope (such as ALMA) to provide insights into the expected radiation map characteristics of the aforementioned systems.
2.1.1 Governing equations
In the current paper, we present the results of simulations for which we have applied the MHD code PLUTO (Mignone et al., 2007, 2012), version 4.4.2, to solve the time-dependent, resistive, inviscid MHD equations, accounting namely for the conservation of mass, momentum, and energy,
| (1) |
| (2) |
| (3) |
Here, is the mass density, is the velocity, is the thermal gas pressure, stands for the magnetic field, and denotes the gravitational potential.
In the above equations, denotes the magnetic diffusivity (or resistivity, respectively). We consider an anomalous magnetic diffusivity that is turbulent in nature and, thus, cannot be derived self-consistently in our setup. Since the disk is resistive, ohmic heating will occur (see right hand side of energy equation). For simplicity, here, we neglect ohmic heating by setting the parameter , assuming that ohmic heating energy is radiated away immediately - corresponding to a hypothetical cooling term that equals to the ohmic heating term. This makes indeed sense as we do not consider radiation transport in our MHD approach, which would thus lead to an arbitrarily large heating and thus disk flaring.
We adopt an -prescription (Shakura & Sunyaev, 1973), consistent with the assumption of a turbulent origin, as supported by previous studies (Zanni et al., 2007; Sheikhnezami et al., 2012; Stepanovs & Fendt, 2014). The disk diffusivity profile is defined by , where the Alfvén velocity and the disk thermal scale height are evaluated at the disk mid-plane. Here, is the magnetic diffusivity parameter and its value is 1.6 in our model. The function further confines the diffusivity to the disk region and up to one-two scale height above the disk surface, and it is defined as
So far, we have considered the (turbulent) resistivity as the only diffusion term for the disk. However, additional diffusion, such as ambipolar diffusion, arising from the drift between charged and neutral particles in a partially ionized plasma, also exists in the disk, in particular for large radii. The coupling between gas, dust and the magnetic field could in principle affected by this effect, correspondingly changing accretion and outflow rates. However, to fully understand its impact, the ambipolar timescale must be considered in relation to the disk or jet dynamical timescales (which has been studied e.g. by Frank et al. (1999)). While the effect may play a role for the disk and jet dynamics, the treatment of ambipolar diffusion is beyond the scope of this paper.
The electric current density is given by Ampére’s law , while the total energy density is
| (4) |
with an ideal gas with a polytropic equation of state with the polytropic index of and the internal energy density .
The evolution of the magnetic field is described by the induction equation,
| (5) |
2.2. Gravitational potential
We consider a time-dependent gravitational (Roche) potential . Since the origin of our coordinate system is in the primary, we have to consider the time variation of the gravitational potential in that coordinate system. We prescribe the position of the secondary initially along the -axis. Thus, its position vector varies over time (in Cartesian coordinates) as,
| (6) |
Here, denotes the inclination angle of the binary orbit with respect to the initial circum primary disk. In addition, , and represent the unit vectors in Cartesian coordinates. In this paper, we discuss a co-planar geometry and thus . The effective potential in a binary system at a point with position vector is
| (7) |
The terms in Equation 7 describe the gravitational potential of the primary, followed by terms describing the tidal perturbations caused by the orbiting secondary. The last ”indirect” term accounts for the acceleration of the origin of the coordinate system (see also Larwood et al. 1996; Sheikhnezami & Fendt 2018).
2.3. Units and normalization
Here, we describe the normalization of units applied consistently throughout this paper. The inner radius of the disk boundary is designated as , with a normalized value of . All measurements are expressed in units relative to this inner disk radius.
We want to stress that the astrophysical scaling of the variables in our simulations is predominantly motivated by previous numerical studies. We are not yet in a position to fit certain sources, as many parameters for theses sources still remain unknown. For example, any ”observed” accretion rate depends on an underlying model. That model, however, will be different from our modeling. On the other hand, real accretion rates we expect to be derived at some point from time-dependent simulations including a thorough treatment of radiation.
However, in general, our normalization can be understood as applicable to a relatively evolved young low-mass star, such as a jet-emitting classic T Tauri that is not embedded anymore (class I or II object).
We normalize all variables, namely to their fiducial values at the inner disk radius, . A change in one of the system parameters accordingly changes the scaling of our simulation results which can thus be applied to a variety of jet sources.
The gas pressure and density at the inner disk radius are denoted as and , respectively. Velocities are scaled according to the Keplerian velocity at the inner radius of the disk, denoted as , which is normalized to . Time units are defined in relation to .
An important consideration is the astrophysical scaling of the inner disk radius. Since our simulation results are expressed in code units, the inner disk radius can be specified rather arbitrarily, depending on the choice of the astrophysical system we want to consider. Since our study focuses on the spiral arm structure which is predominantly located in the outer part of the disk, we have adopted AU as our inner disk radius, which we think is an appropriate choice. Moreover, the choice of AU results in a cooler disk temperature at the inner disk. Consequently, dust particles will be found also in the inner disk of our simulation. We note that we cut out the very inner, hotter disk from AU from our treatment.
Furthermore, using a larger disc, we can provide the radiation map for the outer part of the disk where is more suitable to observe by the currently available instruments.
The normalization of density remains a choice. In pure MHD simulations we are treating a Keplerian problem, that in principle can constrain the central mass, but not the mass of the orbiting body. If radiative transfer would be included, the opacity and radiation fluxes derived from the simulation would allow for a comparison with observations, and thus provide a constrain on the disk density. However, obviously further parameters enter the problem, as e.g. the chemistry of the disk.
For the present paper, we decided to stay close to previous simulation work with the density normalization (see discussions in e.g. Sheikhnezami et al. (2012); Stepanovs & Fendt (2014)). We choose as the equatorial disk density at the inner disk radius, generally. However, for comparison we will also offer radiation map results applying higher disk densitiy, . These models may be applicable to younger jet-driving protostars.
The mass accretion rate is, in principle, an observable, however, the derivation of a numerical value from observations is model-dependent. Depending on the disk model utilized, the observed disk luminosity can be correlated to an accretion rate.
The accretion rates are typically expressed in units of and in young stellar object (YSO) models are about for a density of and an inner radius of (Zanni et al., 2007; Sheikhnezami et al., 2012). Clearly, accretion rates may vary significantly between individual sources and also evolve over time.
While the assumed disk density will govern the derived disk accretion rates , the radiation fluxes derived from the treatment of dust particles will depend on another ”free” parameter, that is the dust to gas ratio - and obviously the dust properties. We will discuss this further below in Section 4.
The magnetic field strength we measure in units of the magnetic field at the inner disk radius, represented as Here, represents the plasma beta parameter of the gas.222In PLUTO code the magnetic field is normalized considering .
To our understanding, the disk magnetic field strength is basically un-known. MHD simulations show that a certain field strength is needed to launch powerful outflows (see e.g. Sheikhnezami et al. (2012); Stepanovs & Fendt (2014)). Thus, again, we choose a field strength that is similar to previous numerical studies, as we want to examine binary disks that do launch outflows. With our choice of parameters, a plasma-beta ,
we consider a field strength Gauss. The choice of field strength will not directly affect the radiation pattern. But as it governs the strength of the jet, its mass flux and density (and thus its dust loading), so it impacts the jet radiation pattern indirectly.
The temperature profile of the disk is obtained from the polytropic gas law and will be discussed extensively in section 4.
2.4. Numerical setup
We employ spherical coordinates for our simulations (see Figure 1). The computational domain extends from 0 to code units of length in the radial direction. In the polar direction, the domain covers a range from 0 to radians, with a small opening angle near the polar axis.
Our grid extends 1000 in the radial direction, radians in the polar direction, and radians in the azimuthal direction, including the total of cells. In the radial direction, the cells are stretched, resolving the innermost part with the highest resolution of 0.04, but it increases for larger radii. In both the polar and azimuthal directions, the cells are uniformly spaced, with a resolution of 0.0153 and 0.02454, respectively.
In our simulations considering binary star-disk-jet systems, we apply a smaller computational domain in the radial direction, just to enhance potential tidal effects on the disk and jet. By applying a smaller stellar separation between the primary and secondary stars, we also place the secondary star outside the computational domain. This results in a radial extent of 280, incorporating 256 stretched grid cells.
2.5. Boundary conditions
The boundary condition in the azimuthal direction is set to be periodic. For the polar axis, we apply a reflective boundary condition, incorporating a small opening angle to achieve a better time step. At the outer boundary, we apply modified outflow boundary conditions, meaning that variables (i) are simply copied to the ghost cells (original PLUTO setup), but (ii) enforce in addition that matter is not allowed to enter the domain.
At the inner radius , we define a specific condition, considering both the accretion flow from the inner disk and also the coronal region from the disk surface to the rotational axis.
More specifically, in the disk region () where represents the disk scale height, we apply accretion boundary conditions. Here, pressure and density follow a power-law profile in the radial direction, adopting the approach developed by Stepanovs & Fendt (2014), which is based on a self-similar gas expansion. An accretion condition is applied for the radial velocity, while the polar velocity component is copied. The azimuthal velocity is determined using angular momentum conservation, and the toroidal magnetic field is constrained by electric current conservation. The other two components of the magnetic field are copied to the ghost cells.
For the corona region at the inner boundary, we keep the initial coronal density and pressure. In addition, we impose the condition from ideal MHD, ensuring , to define the radial and polar velocity components. Along the inner coronal boundary, we prescribe a weak inflow into the domain with . The azimuthal components of velocity and magnetic field are set to vanish to achieve a more stable structure.
2.6. Initial conditions
We adopt initial conditions consistent with those employed in previous studies, wherein a magnetically diffusive accretion disk is prescribed in sub-Keplerian rotation.
Above the disk, a hydrostatic corona in pressure equilibrium with the disk is established (Zanni et al., 2007; Murphy et al., 2010; Sheikhnezami et al., 2012). The coronal density is set to be several orders of magnitude lower than the disk density, resulting in a sharp entropy and density discontinuity at the disk-corona interface. We prescribe an initially geometrically thin disk with which is itself in vertical equilibrium between thermal pressure and gravity of the primary star. The initial conditions, including the density and pressure profiles for the disk and corona, are adopted from our previous works(Sheikhnezami et al., 2012; Sheikhnezami & Fendt, 2018).
2.6.1 Magnetic field distribution
Following previous works (Zanni et al., 2007; Sheikhnezami et al., 2012; Stepanovs & Fendt, 2014), our simulations are initialized with a poloidal magnetic field, defined through the vector potential and is given by
| (8) |
Here measures the vertical field strength at the inner disk radius and at mid-plane, and .
3. Dynamics - simulation results
In this section, we present and discuss the results derived from our 3D MHD simulation of jet launching from a diffusive magnetized circumstellar disk for both a single star-disk-jet and binary star-disk-jet system.
The primary objective of our study is to investigate the dynamical evolution of these systems. We will later present the first 3D radiation map of the dust continuum for the disk-jet structures.
3.1. A 3D disk-jet from a single star
We present, for the first time, the results of a 3D MHD simulation of the disk-jet structure using spherical coordinates. Two simulations are presented, as listed in Table 1. The first simulation corresponds to a jet launched from a circumstellar disk in a single star system. The simulation was run for approximately, 10000 time units , corresponding to 1600 revolutions of the inner disk at .
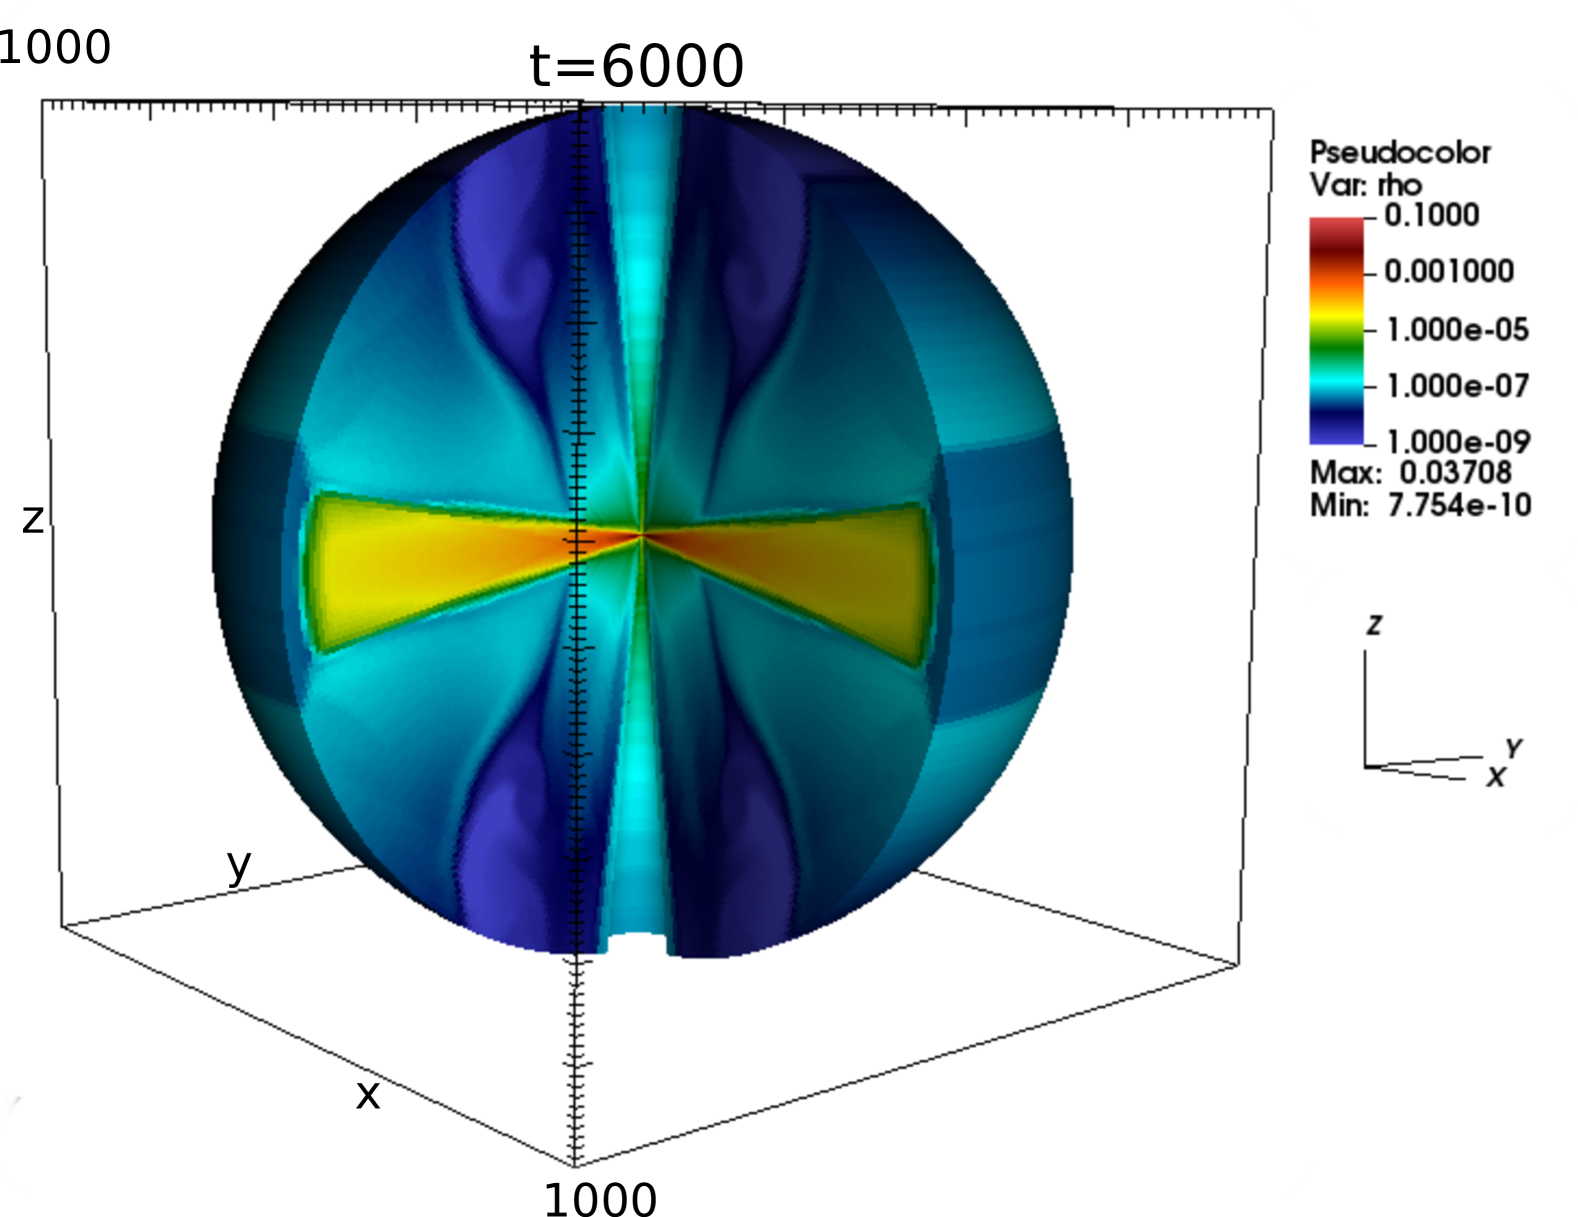
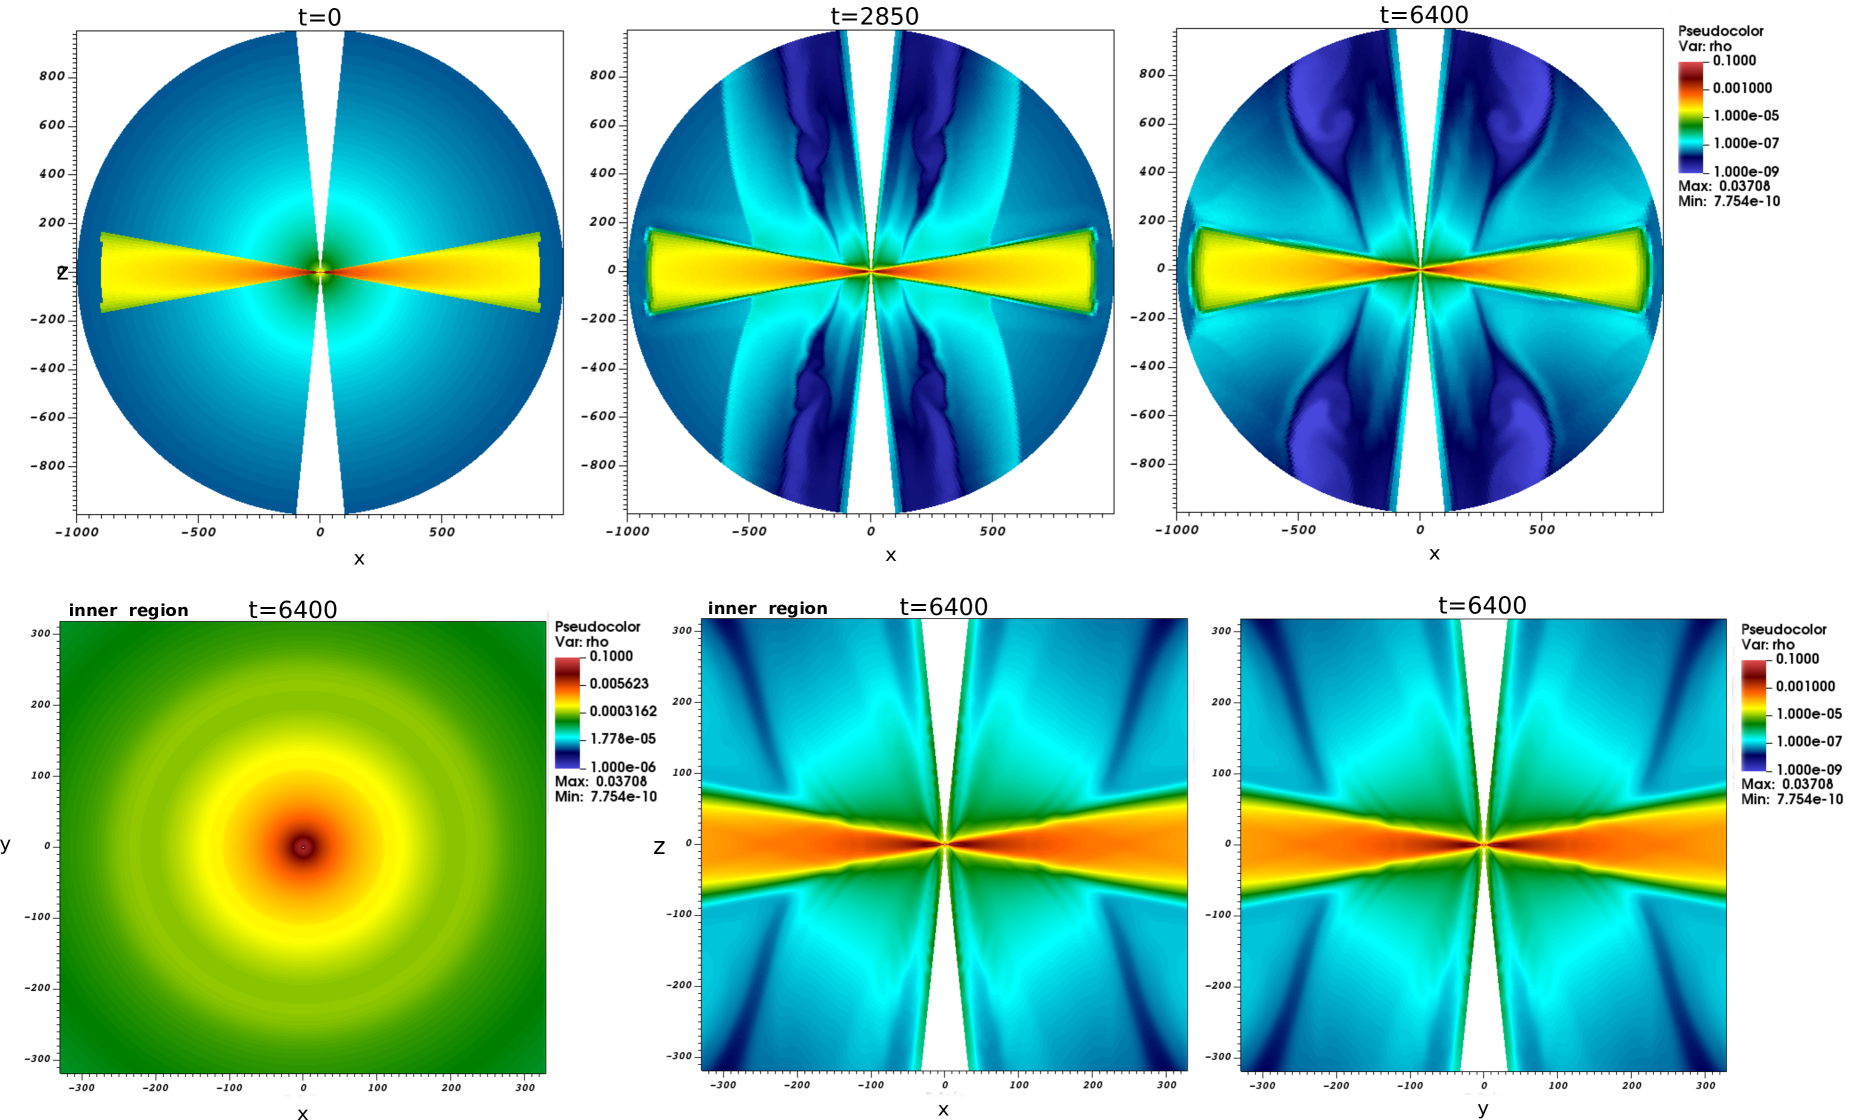
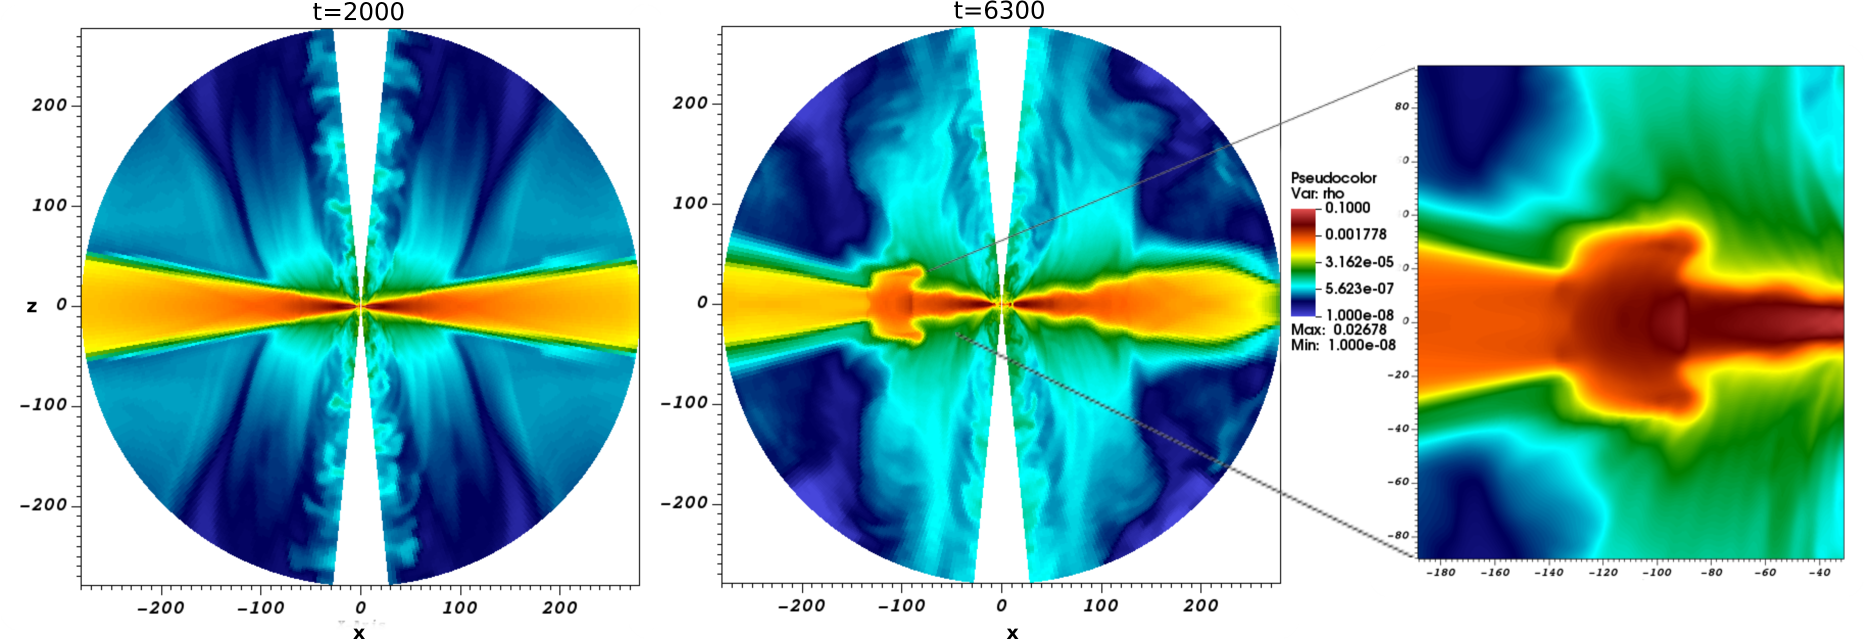
Figure 2 illustrates the 3D rendering of the gas mass density for the jet formed in a single star system, from a circumstellar disk. Furthermore, Figure 3 showcases snapshots of the mass density in the - plane. The jet material is initially launched from the inner disk and, over time, expands to larger radii, thereby accelerating and collimating.
The simulation domain is large, extending to , which allows us to observe two distinct outflow components: the faster outflow or jet, originating from the inner disk area, and the extended disk wind that is launched from larger disk radii. The whole 3D structure shows perfect symmetry in all variables exhibited, both horizontally (azimuthally) and between the two hemispheres.
This simulation serves as a quality test for both the code and our model setup. In particular, the definition of a proper axial boundary condition is crucial for ensuring a symmetric structure, or, respectively, confirming that non-axisymmetric features are physical and not numerical. In addition, without a small opening cone along the axial boundary, the time step may become arbitrarily small. Since this paper primarily focuses on the disk evolution influenced by tidal effects, incorporating a small opening angle does not significantly impact disk evolution, but it allows for simulating over a sufficiently long period.
The simulations presented in this paper confirm our previous findings (Sheikhnezami & Fendt, 2015, 2018, 2022), with the advantage of achieving a higher resolution and improved computational efficiency.
Also, these new simulations extend the 3D simulation work by Ouyed et al. (2003) by now including the disk evolution. There have been other studies on accretion disks using 3D simulations (Stone et al., 1996; Long et al., 2008; Flock et al., 2011; Romanova et al., 2013), however, our work is the first simulation of the jet launching from a circumstellar disk applying 3D spherical coordinates with respective high resolution.
3.2. A 3D disk-jet from a binary system
In this section, we present and discuss the results of another simulation in which we have implemented a companion star orbiting outside the computational domain. As a result, when the jet reaches larger distances from the launching site, its structure and evolution are more affected by the (time-variable) 3D Roche potential.
In this work, we achieved higher resolution in our simulations while making them more efficient and resource-saving. Additionally, when studying the disk, spherical coordinates with a curved azimuthal component are significantly more effective and consistent with the disk’s shape than a rectangular coordinate system.
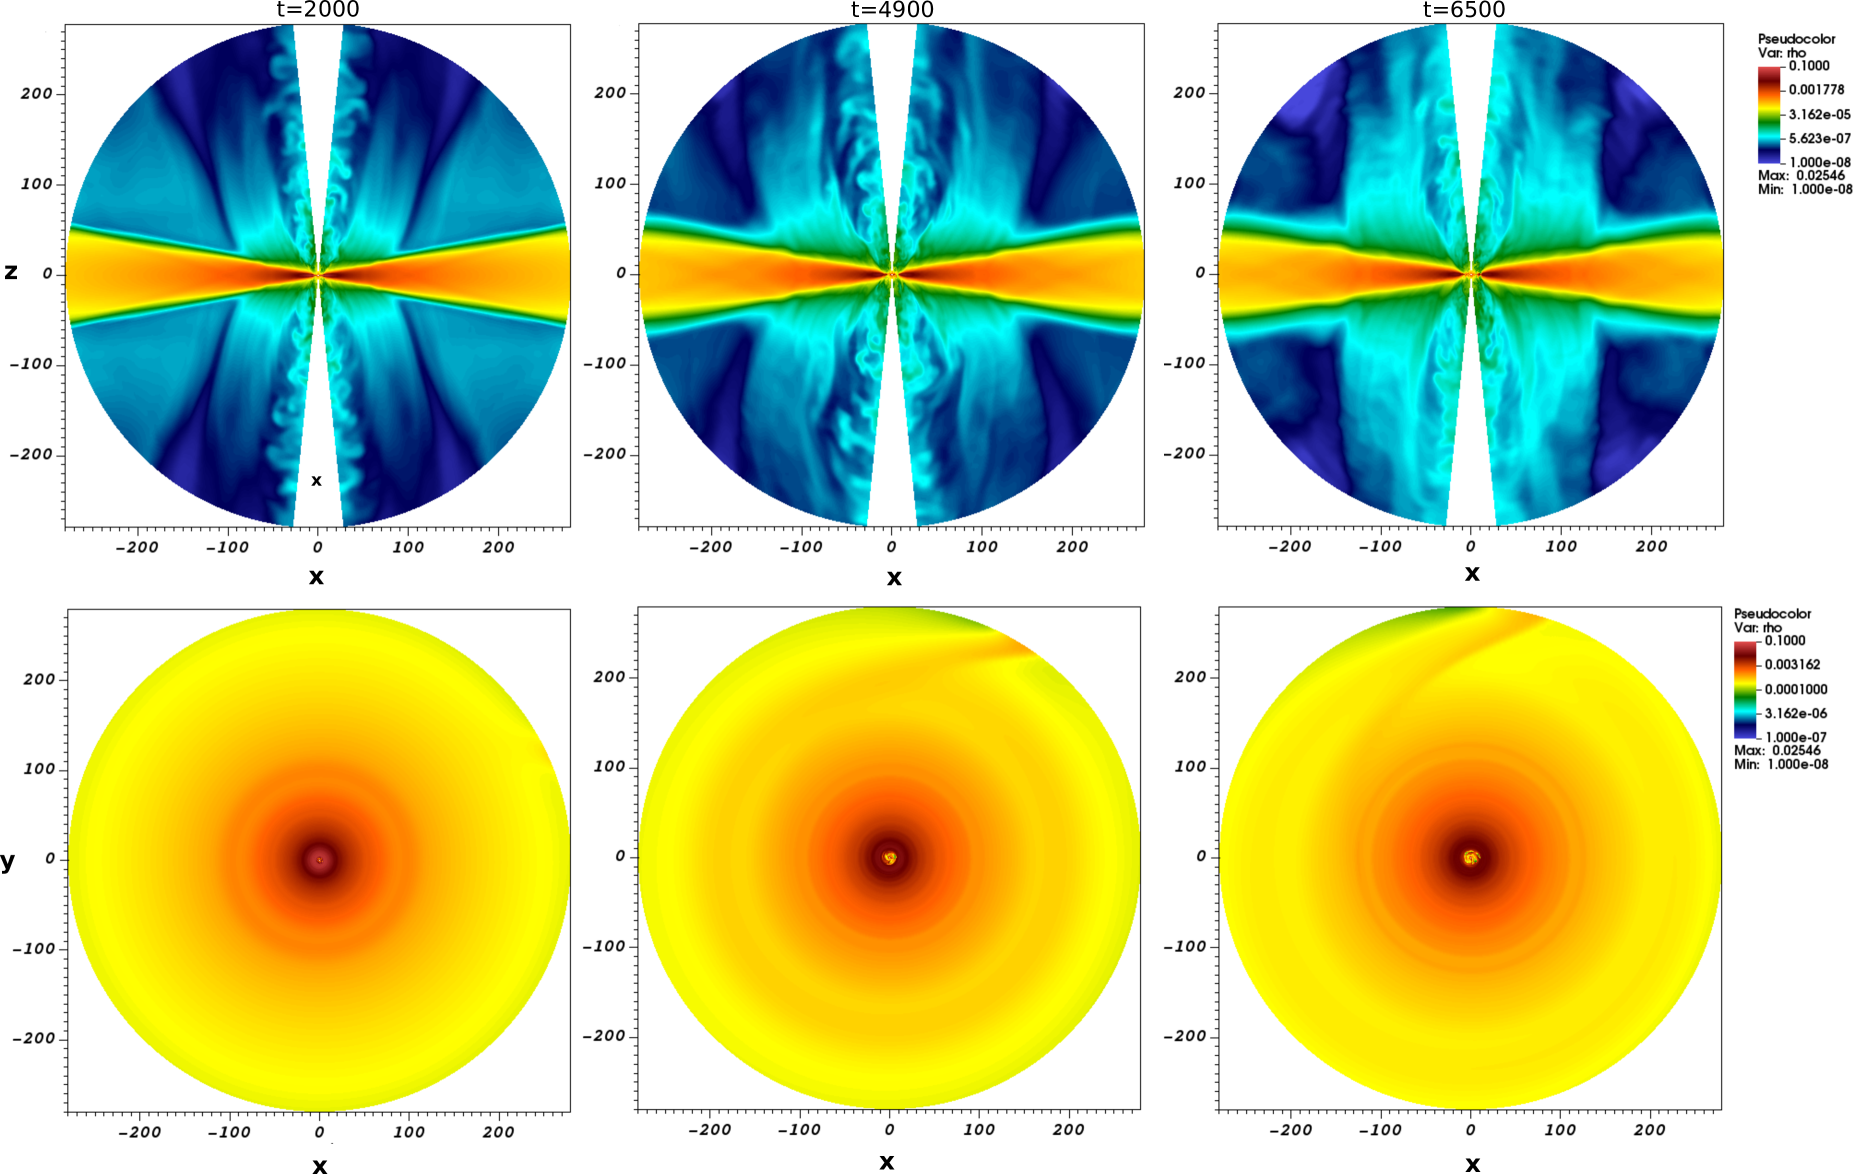
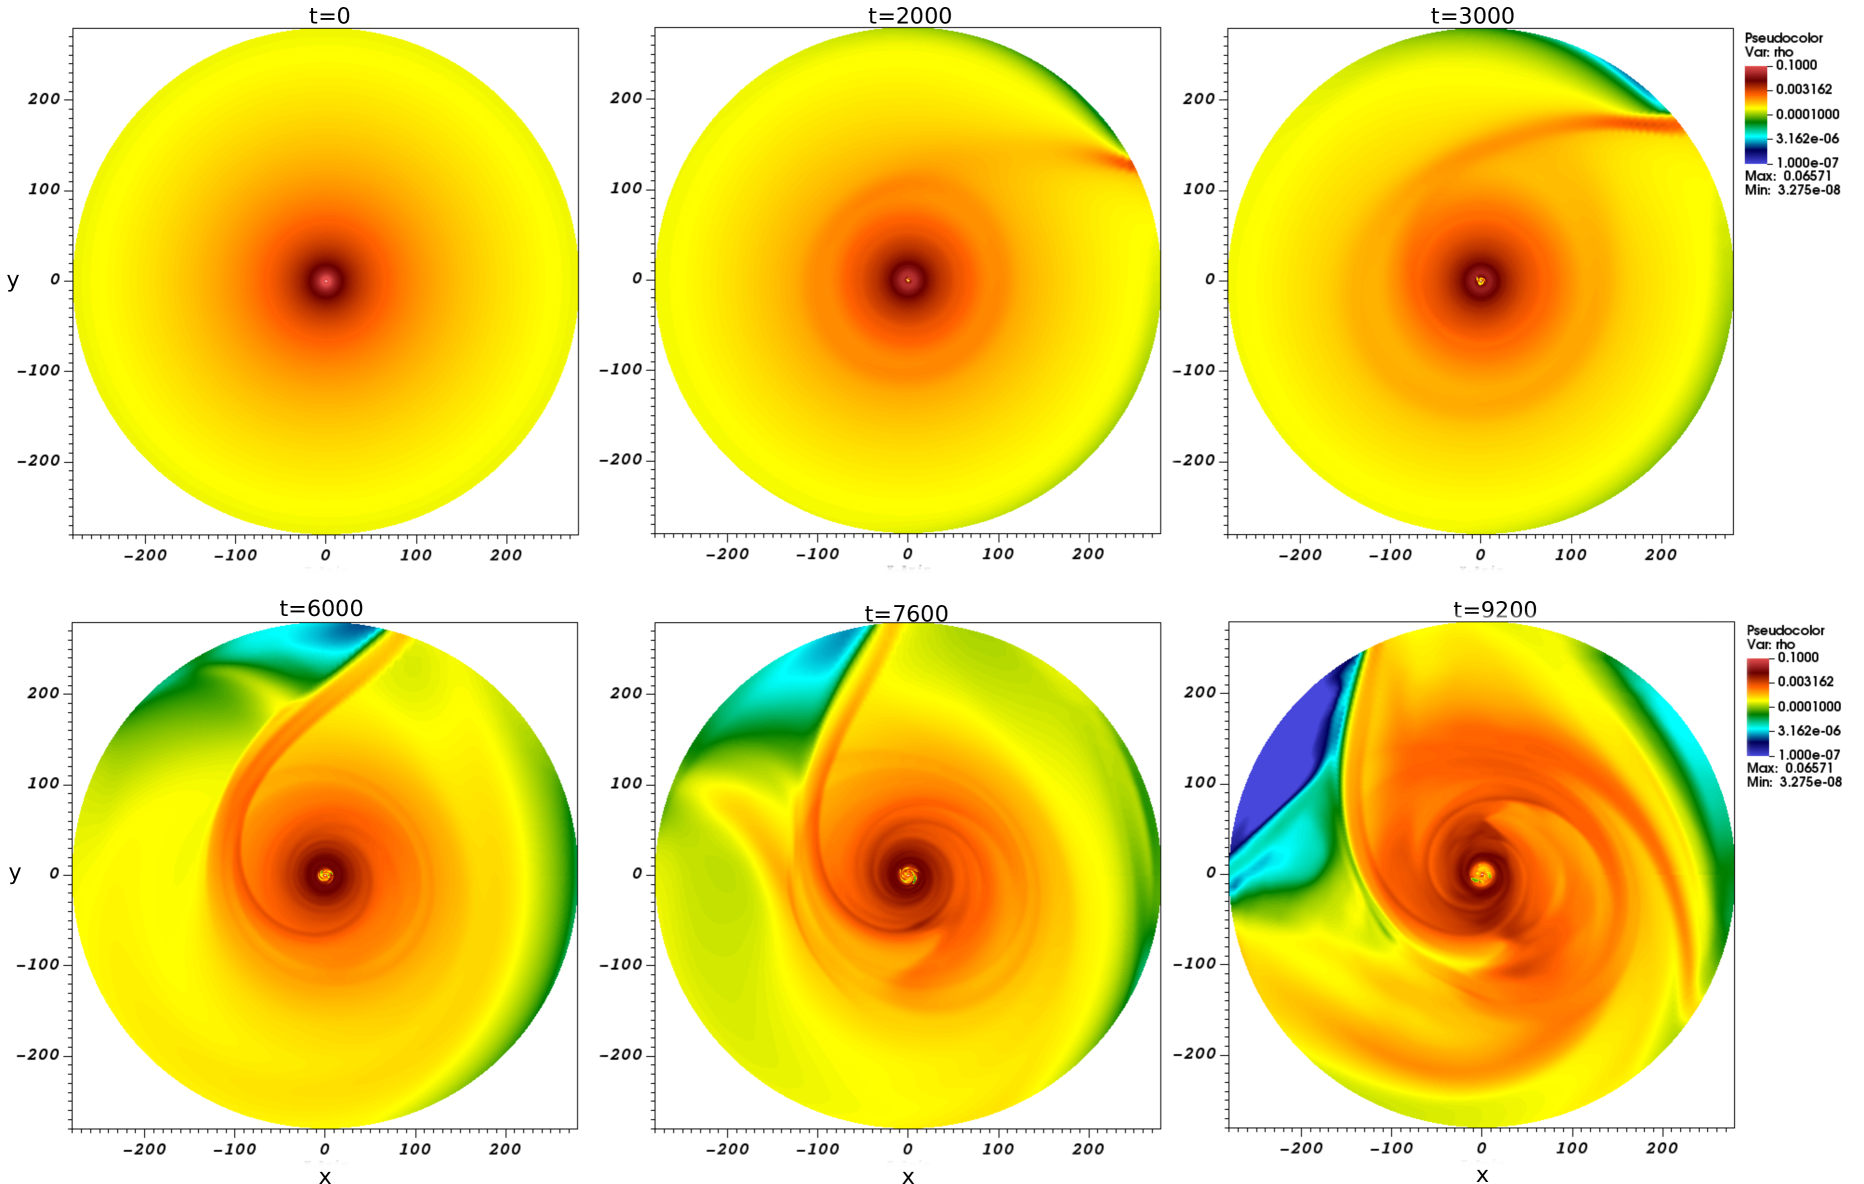
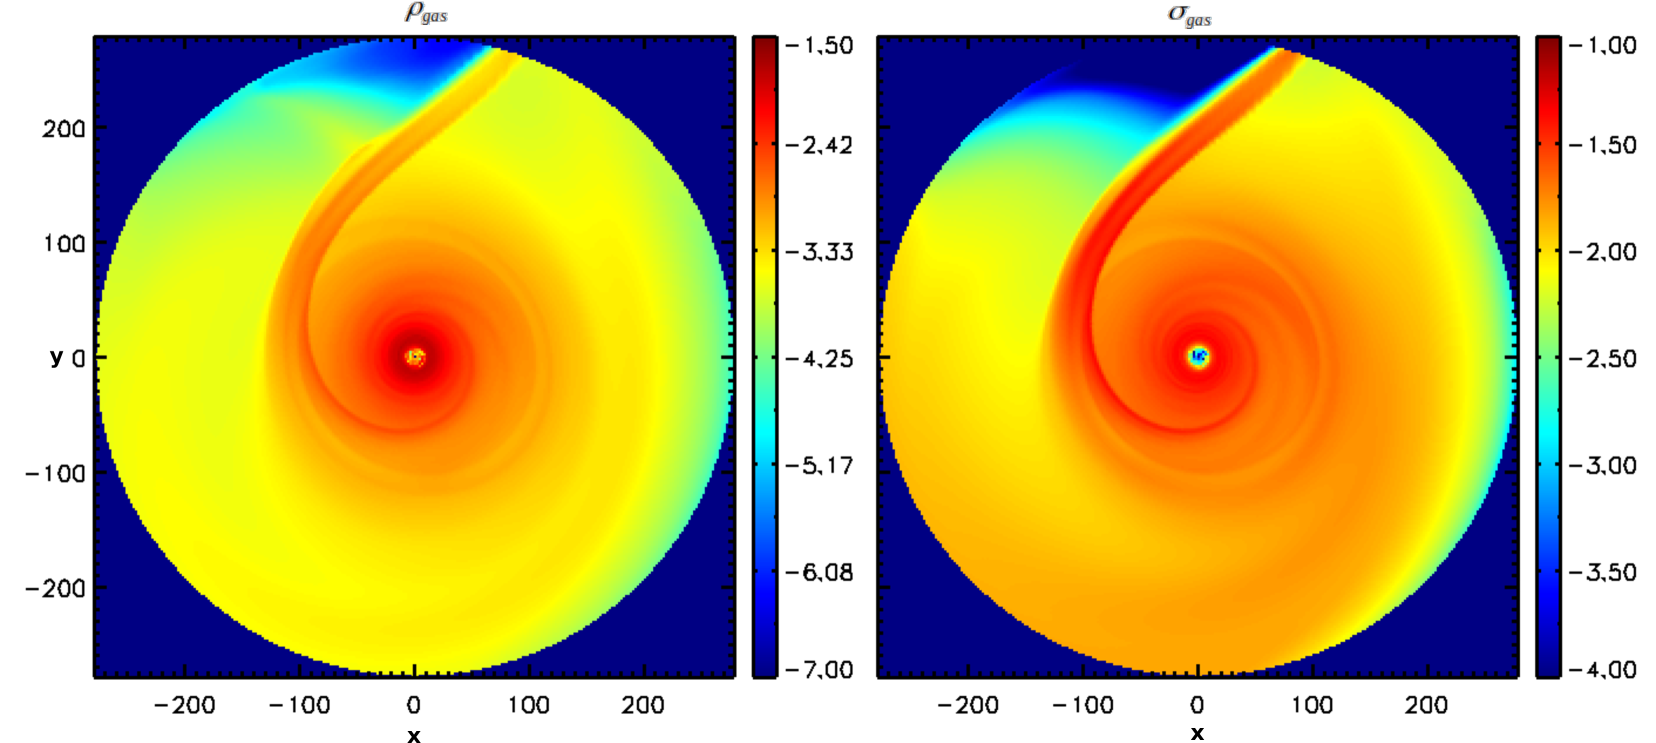
In Figure 5 we display the 2D snapshots of the gas density at plane as obtained from our simulation rb2 that considers a jet formed in a binary star system with the mass ratio of and a binary separation . In Figure 5 we present snapshots of 2D slices of the mass density at the disk midplane.
Both figures demonstrate that as the disk evolves, axial symmetry is broken, and spiral arms are formed.
The density map clearly illustrates the growth and expansion of the spiral arms. In the absence of disk evolution, the direct tidal effect appears as an arc-like feature within the jet, as demonstrated by Sheikhnezami & Sepahvand (2024).
Our previous studies (Sheikhnezami & Fendt, 2018, 2022) have shown that the spiral arms exhibit rotational motion synchronized with the orbital motion of the secondary. This behavior is also observed in the current simulations. Another intriguing finding that supports our previous work is that the spiral formation is also evident in the outflow, which has been influenced by disk evolution and delivered into the jet.
Moreover, it is important to note that since the secondary star is positioned outside the computational domain, the influence of the disk (or back-reaction) on the companion star is not considered.
Additionally, some snapshots of the gas density from another binary run (rb1) with a mass ratio of are shown in Figure 18(in the appendix). It is observed that while all similar tidal effects are present in this run, they are less pronounced due to the smaller mass ratio.
3.3. Mass fluxes in accretion and ejection
One useful observable is the mass flux of the accreting mass and the outflow launched from the disk, which helps to determine the fraction of accreting material delivered into the outflow. It also provides insights into the evolution of the disk and the significance of the processes involved in driving the accretion and ejection processes.
Essentially, all the features and physical behavior observed in the outflow originate from the physical evolution of the underlying disk. In other words, the physical evolution of the ejected material is induced by the accreted material evolution. This correlation can be analyzed by examining the fluxes of accreting and outflowing mass.
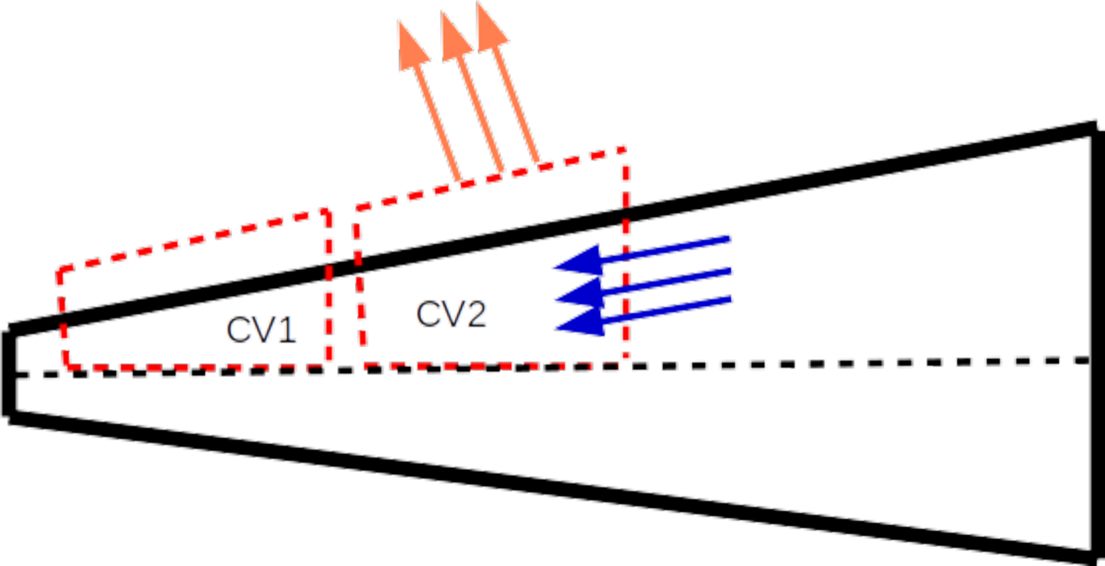
We measure the mass fluxes integrating two arbitrary defined control volumes (see Figure 6). The first control volume CV1, spans a radial range from to , with a poloidal extension from 0 to 0.5 radians, and an azimuthal extension from 0 to 2 radians. The second control volume, CV2, covers a radial range from to , with the same poloidal and azimuthal extension. These control volumes are designed to facilitate the analysis of mass fluxes across different regions in the disk.
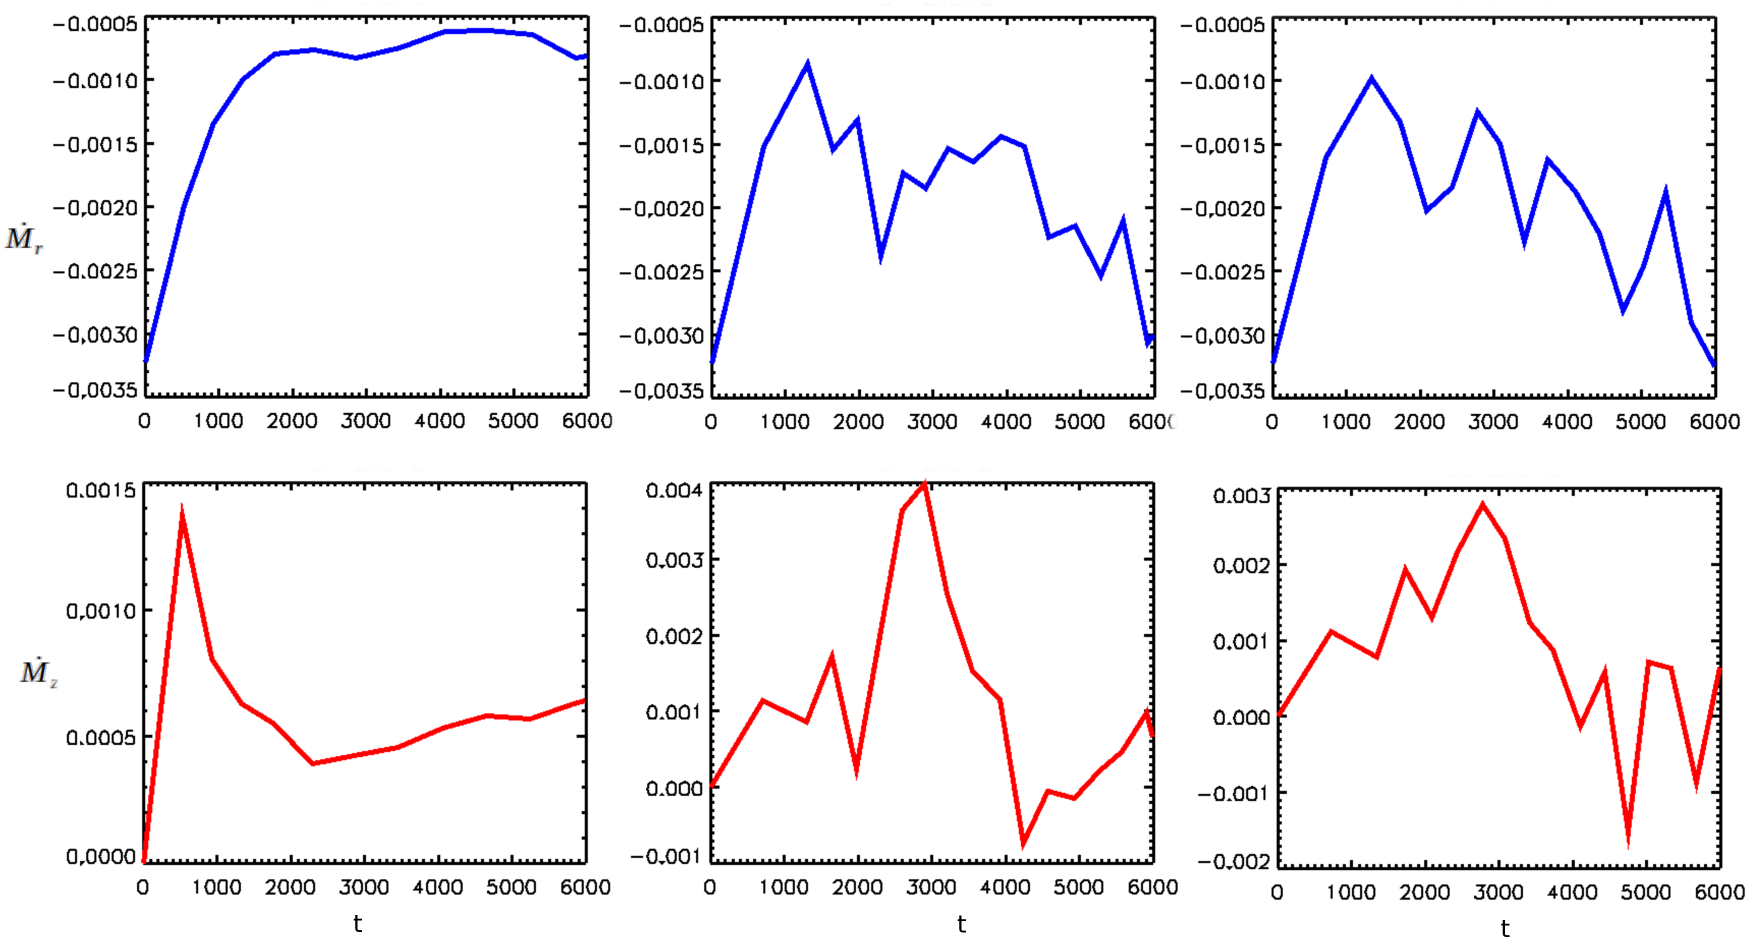
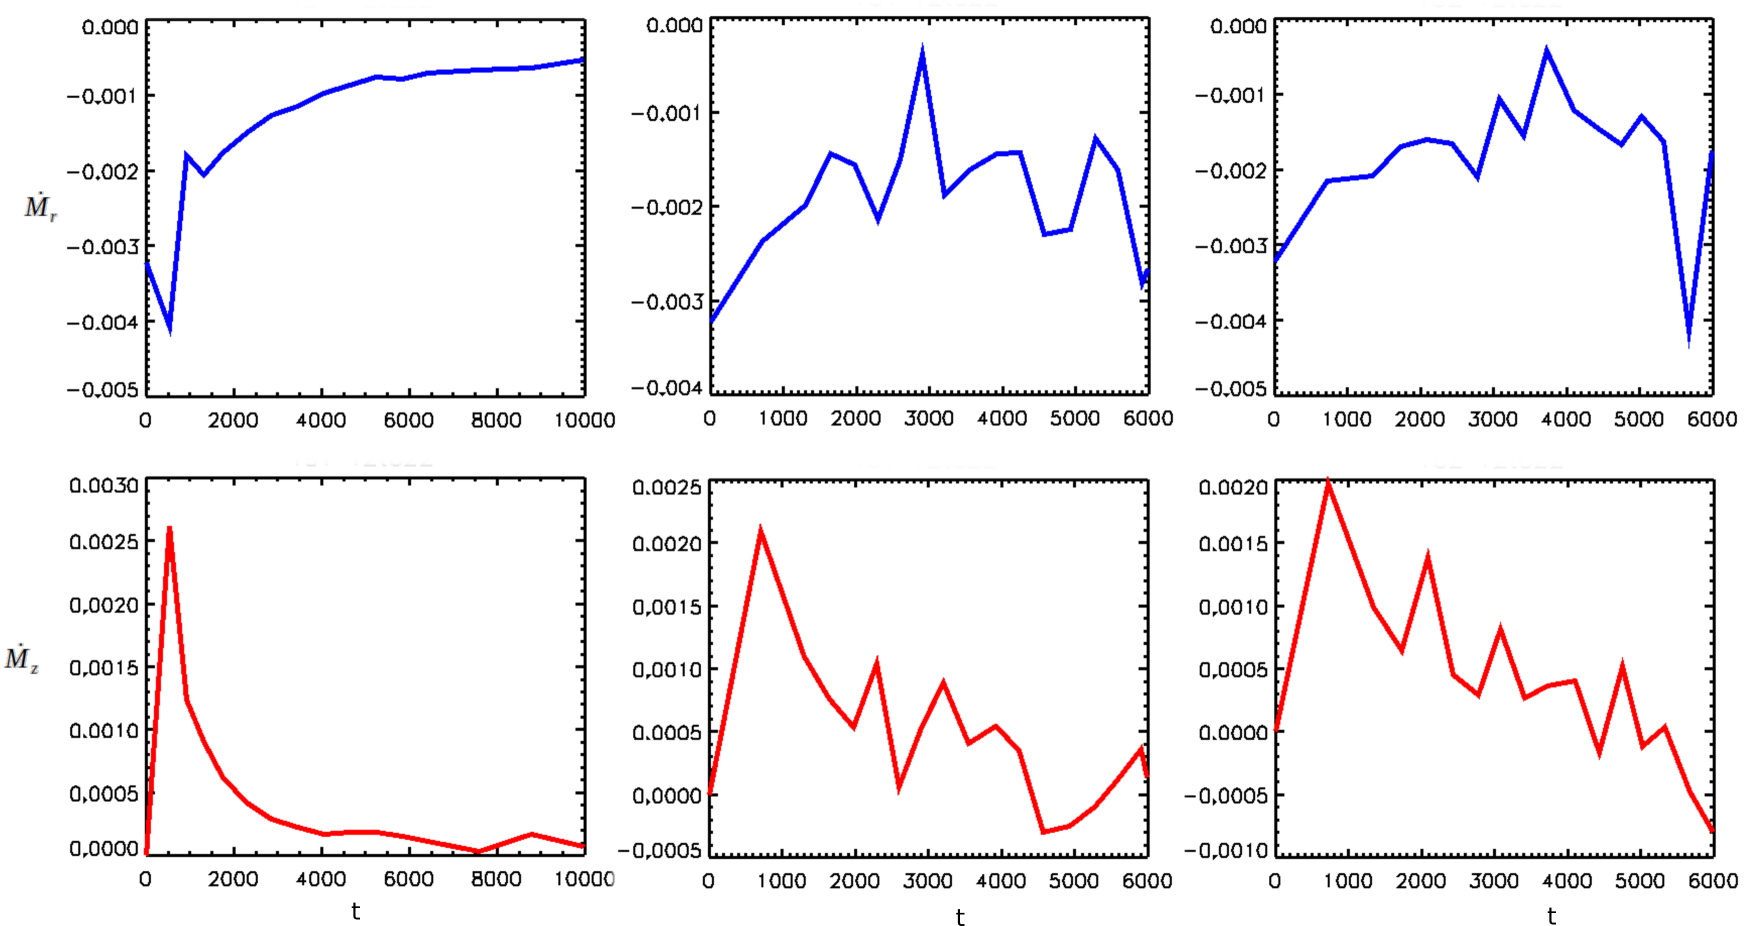
In Figure 8 we display the evolution of accretion and outflow mass fluxes measured from a similar control volume in simulations involving both a single star and a binary system with a mass ratio of 0.2. In addition, Figure 8 shows similar mass fluxes, however derived from the second control volume CV2.
In summary, we obtain the following results (see Figures 8 and 8). The accretion and outflow mass fluxes evolve smoothly in the simulation for the single star setup. For the binary star setup, these variables considerably fluctuate. These fluctuations are caused by the tidal forces arising in the time-dependent Roche potential. While these tidal effects generate features such as spiral arms in the disk, they also significantly disrupt the typical accretion pattern in the disk. Moreover, regions in the outflow and near the disk exhibit asymmetric structures like enhanced density (see Figure 5) that arise from the time-dependent Roche potential.
Additionally, we observe that the accretion and ejection mass fluxes in some regions show some peaks, indicating that the accretion and outflow mass fluxes are enhanced for short time intervals. This confirms the discussions in our recent paper (Sheikhnezami & Fendt, 2022) that the angular removal from the disk and thus the tidal effects on the disk-jet are more efficient when a secondary star is present. Again we see (as discussed in (Sheikhnezami & Fendt, 2022)) that the asymmetric features present in the disk are transferred to the outflow by the launching process.
Thus, essentially, the jet carries signatures of the disk evolution, and the primary effects, such as the spiral structures we observe in the outflow, are imprinted by the structural evolution of the disk. However, we see also other features in the outflow near the launching site, which can be directly attributed to the asymmetric (and time-dependent) Roche potential, such as the formation of an arc-like structure in the outflow, and a perturbation in the velocity pattern (Sheikhnezami & Sepahvand, 2024).
3.4. Outflow dynamical properties
We now briefly discuss the essential properties of the disk wind concerning dust entrainment. It is commonly accepted that protostellar disks are cool and therefore able to host dust grains out to a certain radius.
Compared to jets, disk winds are less extended and can thus be infrequently resolved. While jets can be detected by imaging, disk winds are merely detected by spectral lines. For instance, Fang et al. (2023) detected emission from disk winds, particularly in the low-velocity component of the [OI] 6300 line. Spectral mapping indicated enhanced emission which allowed to fit extended wind emission applying toy modeling assuming an inner radius of 0.08 au and a possible outer radius beyond 40 au.
For the same line, Flores-Rivera et al. (2023) provided MUSE observations for a number of sources, giving evidence for line emission originating in the inner parts of a protoplanetary disk or inner disk winds. Evidence for MHD disk winds was further provided by spectroastrometry of optical forbideen emission lines by Whelan et al. (2021). Bajaj et al. (2024) reported the first spatially resolved [Ne II] disk wind emission from T Cha, revealing an extended structure beyond the disk continuum.
Extended jets from young stars also produce forbidden emission lines, excited in internal or external shocks. While this radiation can be mapped by imaging, this approach is, so far, not easily possible for the launching site for either disk winds or jets on scales below say several tens of AU.
However, observations of jets at larger distances allow for the estimation of essential jet parameters. For example, the jet densities can be determined from shock-excited forbidden emission lines in DG Tau (Solf & Boehm, 1993) as well as temperatures in combination with dynamical modeling (Pesenti et al., 2003).
From the theoretical side, MHD jets and winds are considered as ”cold” flows. Theoretical studies (Blandford & Payne, 1982; Pudritz & Norman, 1983) and numerical simulations of jet formation typically neglect the thermal pressure for the wind motion (Uchida & Shibata, 1985a; Ustyugova et al., 1995; Ouyed & Pudritz, 1997; Krasnopolsky et al., 1999; Fendt, 2006). In agreement with the jet formation studies, theory, and simulations of jet launching - investigating the disk-jet transition - confirm these results. The cool disk material is lifted out of the disk, becomes accelerated, and, while further expanding, does further cool down333Typically a polytropic gas law is considered. (Casse & Keppens, 2002; Zanni et al., 2007; Sheikhnezami et al., 2012).
The initial (disk surface) gas temperature, (respective pressure) is an important parameter for the wind motion, as it determines the mass flux of the wind or jet. This is already a consequence of steady-state MHD theory (Pudritz et al., 2007). MHD simulations of jet formation including radiation pressure have shown that the disk material can become heated when rising from the disk - resulting in a larger mass flux, which moves with a lower speed (Vaidya et al., 2011). Still, the outflow remains ”cool” (Ferreira, 2003).
Only when gas is shocked downstream and heated to approximately 3000-4000 K, it becomes visible as jet knots. Hydrodynamic Simulations by Lee et al. (2001) find shock temperatures up to K while applying jet temperatures of 270K (following Gueth & Guilloteau (1999); see also Rabenanahary et al. (2022) for an overview over typical jet parameters).
Various studies explore dust continuum observations within the disk wind and different regions of the disk. For example, Nazari et al. (2024) presented high angular resolution () ALMA observations of the emblematic L1448-mm protostellar system and found suggestive evidence for an MHD disk wind. The disk seen in the dust continuum (0.9 mm) has a radius of AU, and they measure the maximum brightness temperature of the continuum about 110 K at this region.
In addition, Valegård et al. (2022) studied the accreting intermediate-mass T-Tauri star RY Tau, which exhibits an active jet and a known disk wind. They discussed how archival optical data and recent near-infrared observations of the RY Tau system reveal two horn-like components extending as a cone from RY Tau. While scattered light from the disk surrounding RY Tau is observable in the near-infrared spectrum, it remains unseen in optical wavelengths, suggesting the potential presence of scattered light originating from a disk wind. By applying radiative transfer modeling, they found that small grains that are elevated above the disk surface can reproduce the observed effects.
Labdon et al. (2023) studied the circumstellar material around SU Aur, focusing on disk geometry, composition, and inner dust rim structure and confirmed the presence of a dusty disk wind, strengthened by a recent infall event, which also causes significant misalignment between the inner and outer disks.
Other studies demonstrated that the dust grains carried away by the gas component of the wind survive in contact with the hot gas (Tambovtseva & Grinin, 2008).
Rodenkirch & Dullemond (2022) have further discussed and approved the idea that despite heating of the dust grains that are entrained in the high-temperature gas flow these dust particles do not reach the dust sublimation threshold and would thus remain solid along their trajectories.
4. Radiation transfer modeling
One of the aims of this paper is to generate a dust continuum radiation map of the accretion-ejection structure using a radiative transfer code. Given that we have a comprehensive three-dimensional simulation of the jet formation from a circumstellar disk in both single and binary star systems, the RADMC3D code (Dullemond et al., 2012) provides the tools to derive the desired dust continuum radiation map corresponding to our results from the dynamical simulation. In this section, we describe different steps that we perform to have a proper and reasonable radiation map.
It is important to note that our objective is not to directly compare our findings with a specific observational object, but rather provide insight into how the structures identified in our simulation may manifest in observations. Additionally, we aim to suggest potential instruments that could be utilized to figure out the presented features such as the disk wind or spiral arms.
As a first step, we examined the gas temperature in our simulation to determine if dust particles could potentially exist. To estimate the gas temperature, we apply again a polytropic gas law,
| (9) |
where . Here, is the average mass per particle and is the mass of a hydrogen atom and is the Boltzmann constant. With this, we can now define the fiducial gas temperature in code units and then further convert it to astrophysical units, e.g. for a young stellar object (Tzeferacos et al., 2013),
| (10) |
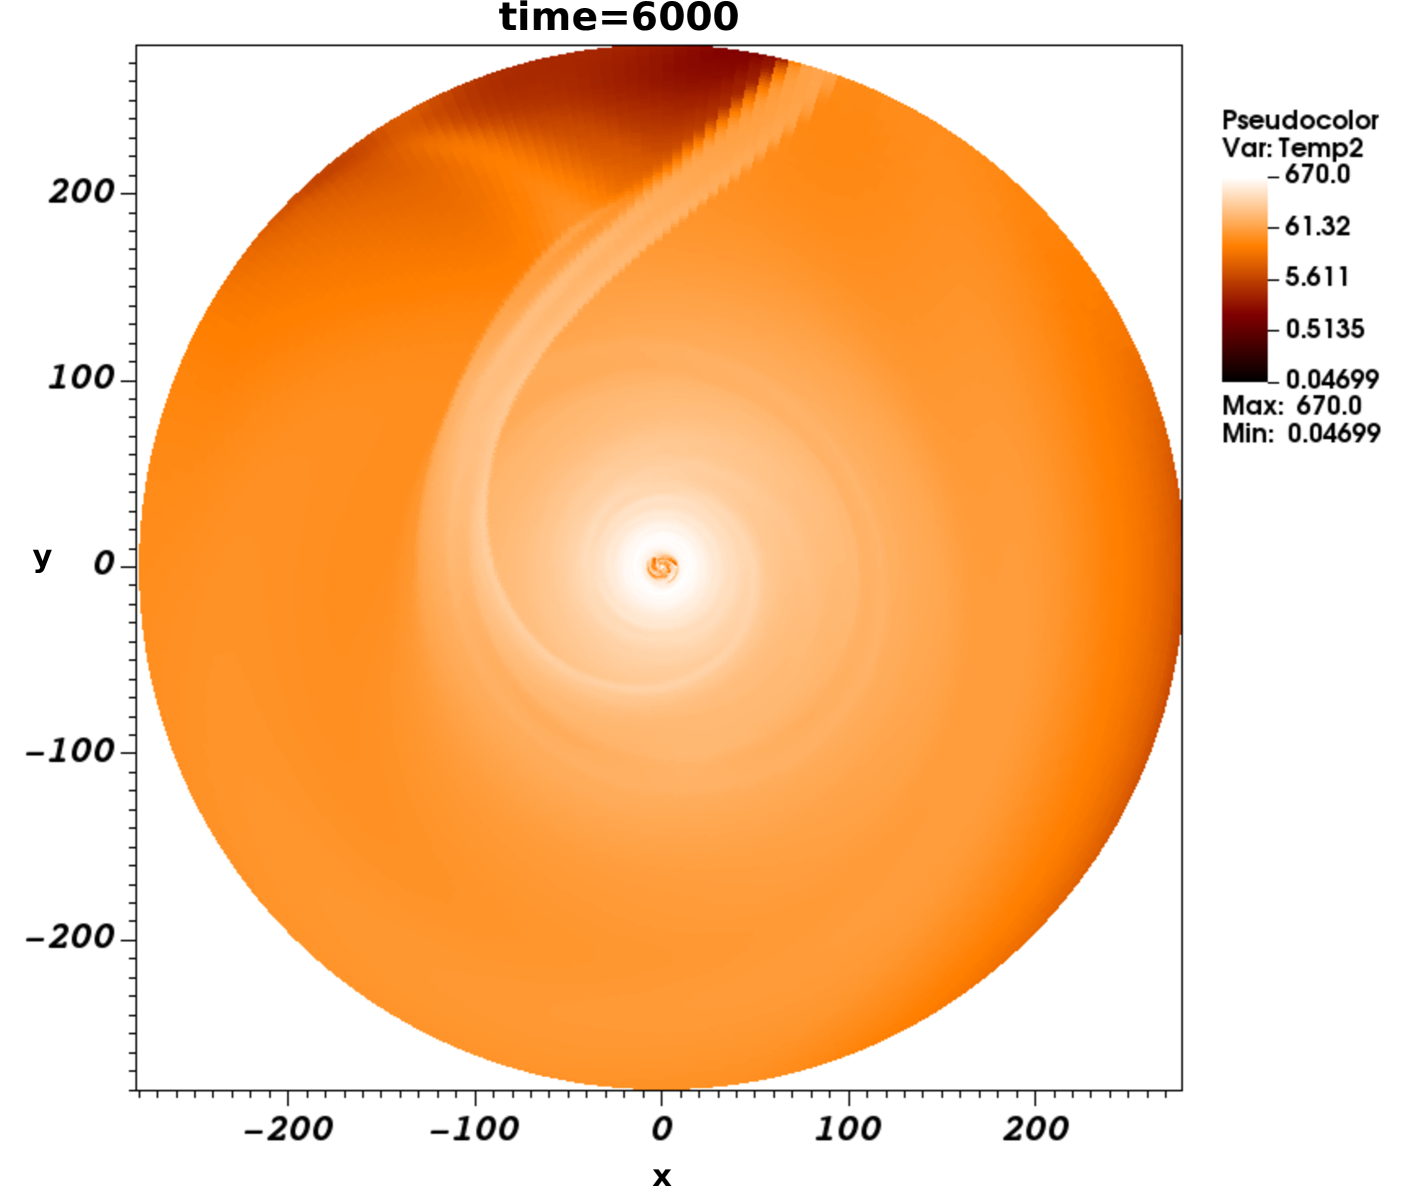
where the parameter denotes the initial thermal height scale. In Figure 9, we present a snapshot of the gas temperature in the disk midplane for the simulation of a binary star system (with a mass ratio of ) at time . The map indicates that the disk temperature remains below the sublimation temperature of silicates, which is approximately 1200 K. This is supported by Heese et al. (2017) who investigated the effect of the grain radius distribution on dust temperature in circumstellar disks, finding values within a range similar to those obtained in our study. Therefore, we conclude that the conditions are suitable for the survival of silicate dust particles.
It is important to note that we do not incorporate the energy equation in our simulation setup. Instead, we derive the temperature simply using a power law relation in the polytropic equation of state. On the other hand, it is well known that jet material originates from the cold, low-entropy accretion material in the disk (Casse & Keppens, 2002; Zanni et al., 2007; Sheikhnezami et al., 2012).
Consequently, the resulting outflow exhibits low temperature, enabling the survival of small dust particles in certain regions of the wind.
Some of the recent studies have investigated the circumstances under which dust particles can persist in the wind (Tambovtseva & Grinin, 2008; Booth & Clarke, 2021; Rodenkirch & Dullemond, 2022). For example, Tambovtseva & Grinin (2008) examined the survival of dust grains in the disk wind of T Tauri stars (TTSs) and the conditions under which dust can survive even in the hot wind component. Furthermore,Rodenkirch & Dullemond (2022) analyzed the behavior of dust grains in cold magnetic winds and photo-evaporated warm ionized winds, discovering that dust grains in the cold magnetic wind tend to follow a shallower trajectory compared to the warm, ionized winds.
In the following, we explain our approach for generating radiation maps of a series of disk-jet structures, specifically focusing on the radiation pattern that is emitted by the dust in the outer part of the disk.
We incorporated the radiative transfer code RADMC3D (Dullemond et al., 2012)444 See https://github.com/dullemond/radmc3d-2.0. RADMC3D code performs a thermal Monte Carlo simulation to compute the dust temperature under the assumption that the dust is in radiative equilibrium with its radiation field. To create a radiation map of the dust continuum, we need information on the distribution of dust particles in both disk and jet. Because our MHD simulation does not account for dust, we require to model dust using the gas density.
Therefore, we employ two different dust density approaches. In the first approach, we consider only small dust particles of size 0.1 m, which are well-coupled to the gas and follow a dust-to-gas density ratio of 0.01 (hereafter referred to as Smooth Dust Density - SDD approach). To calculate the dust density, we simply divide the gas density by 100. In the second approach, we assume the dust has had sufficient time to settle and grow. We consider two dust sizes with 0.1 m and 1 m, distributing them based on their Stokes number (hereafter referred to as Stokes Number for Dust Density - SND approach). The Stokes number characterizes the tendency of the dust to flow with the fluid. Inspired by the results of Rodenkirch & Dullemond (2022), we distribute the dust only where the particle Stokes number is up to 0.1. Figure 9 of that study shows that the normalized dust density drops by one order of magnitude for Stokes number below 0.1. To take into account the settling of larger dust grains, we multiply the gas density by 0.015 for the larger dust grains.
To clarify our recipe for the second approach, we first calculate the Stokes number for each cell as
| (11) |
where is the Keplerian angular velocity with being the stellar mass. The is the stopping time of the dust particle (the time for the exponential decay of the particle relative velocity due to the gas drag) with size . In Eq. 11, is the gas thermal velocity. We use , and Eq. 10 for calculating the gas temperature. Then, we distribute the dust as
| (12) |
where we set to 0.01 for m and 0.015 for m.
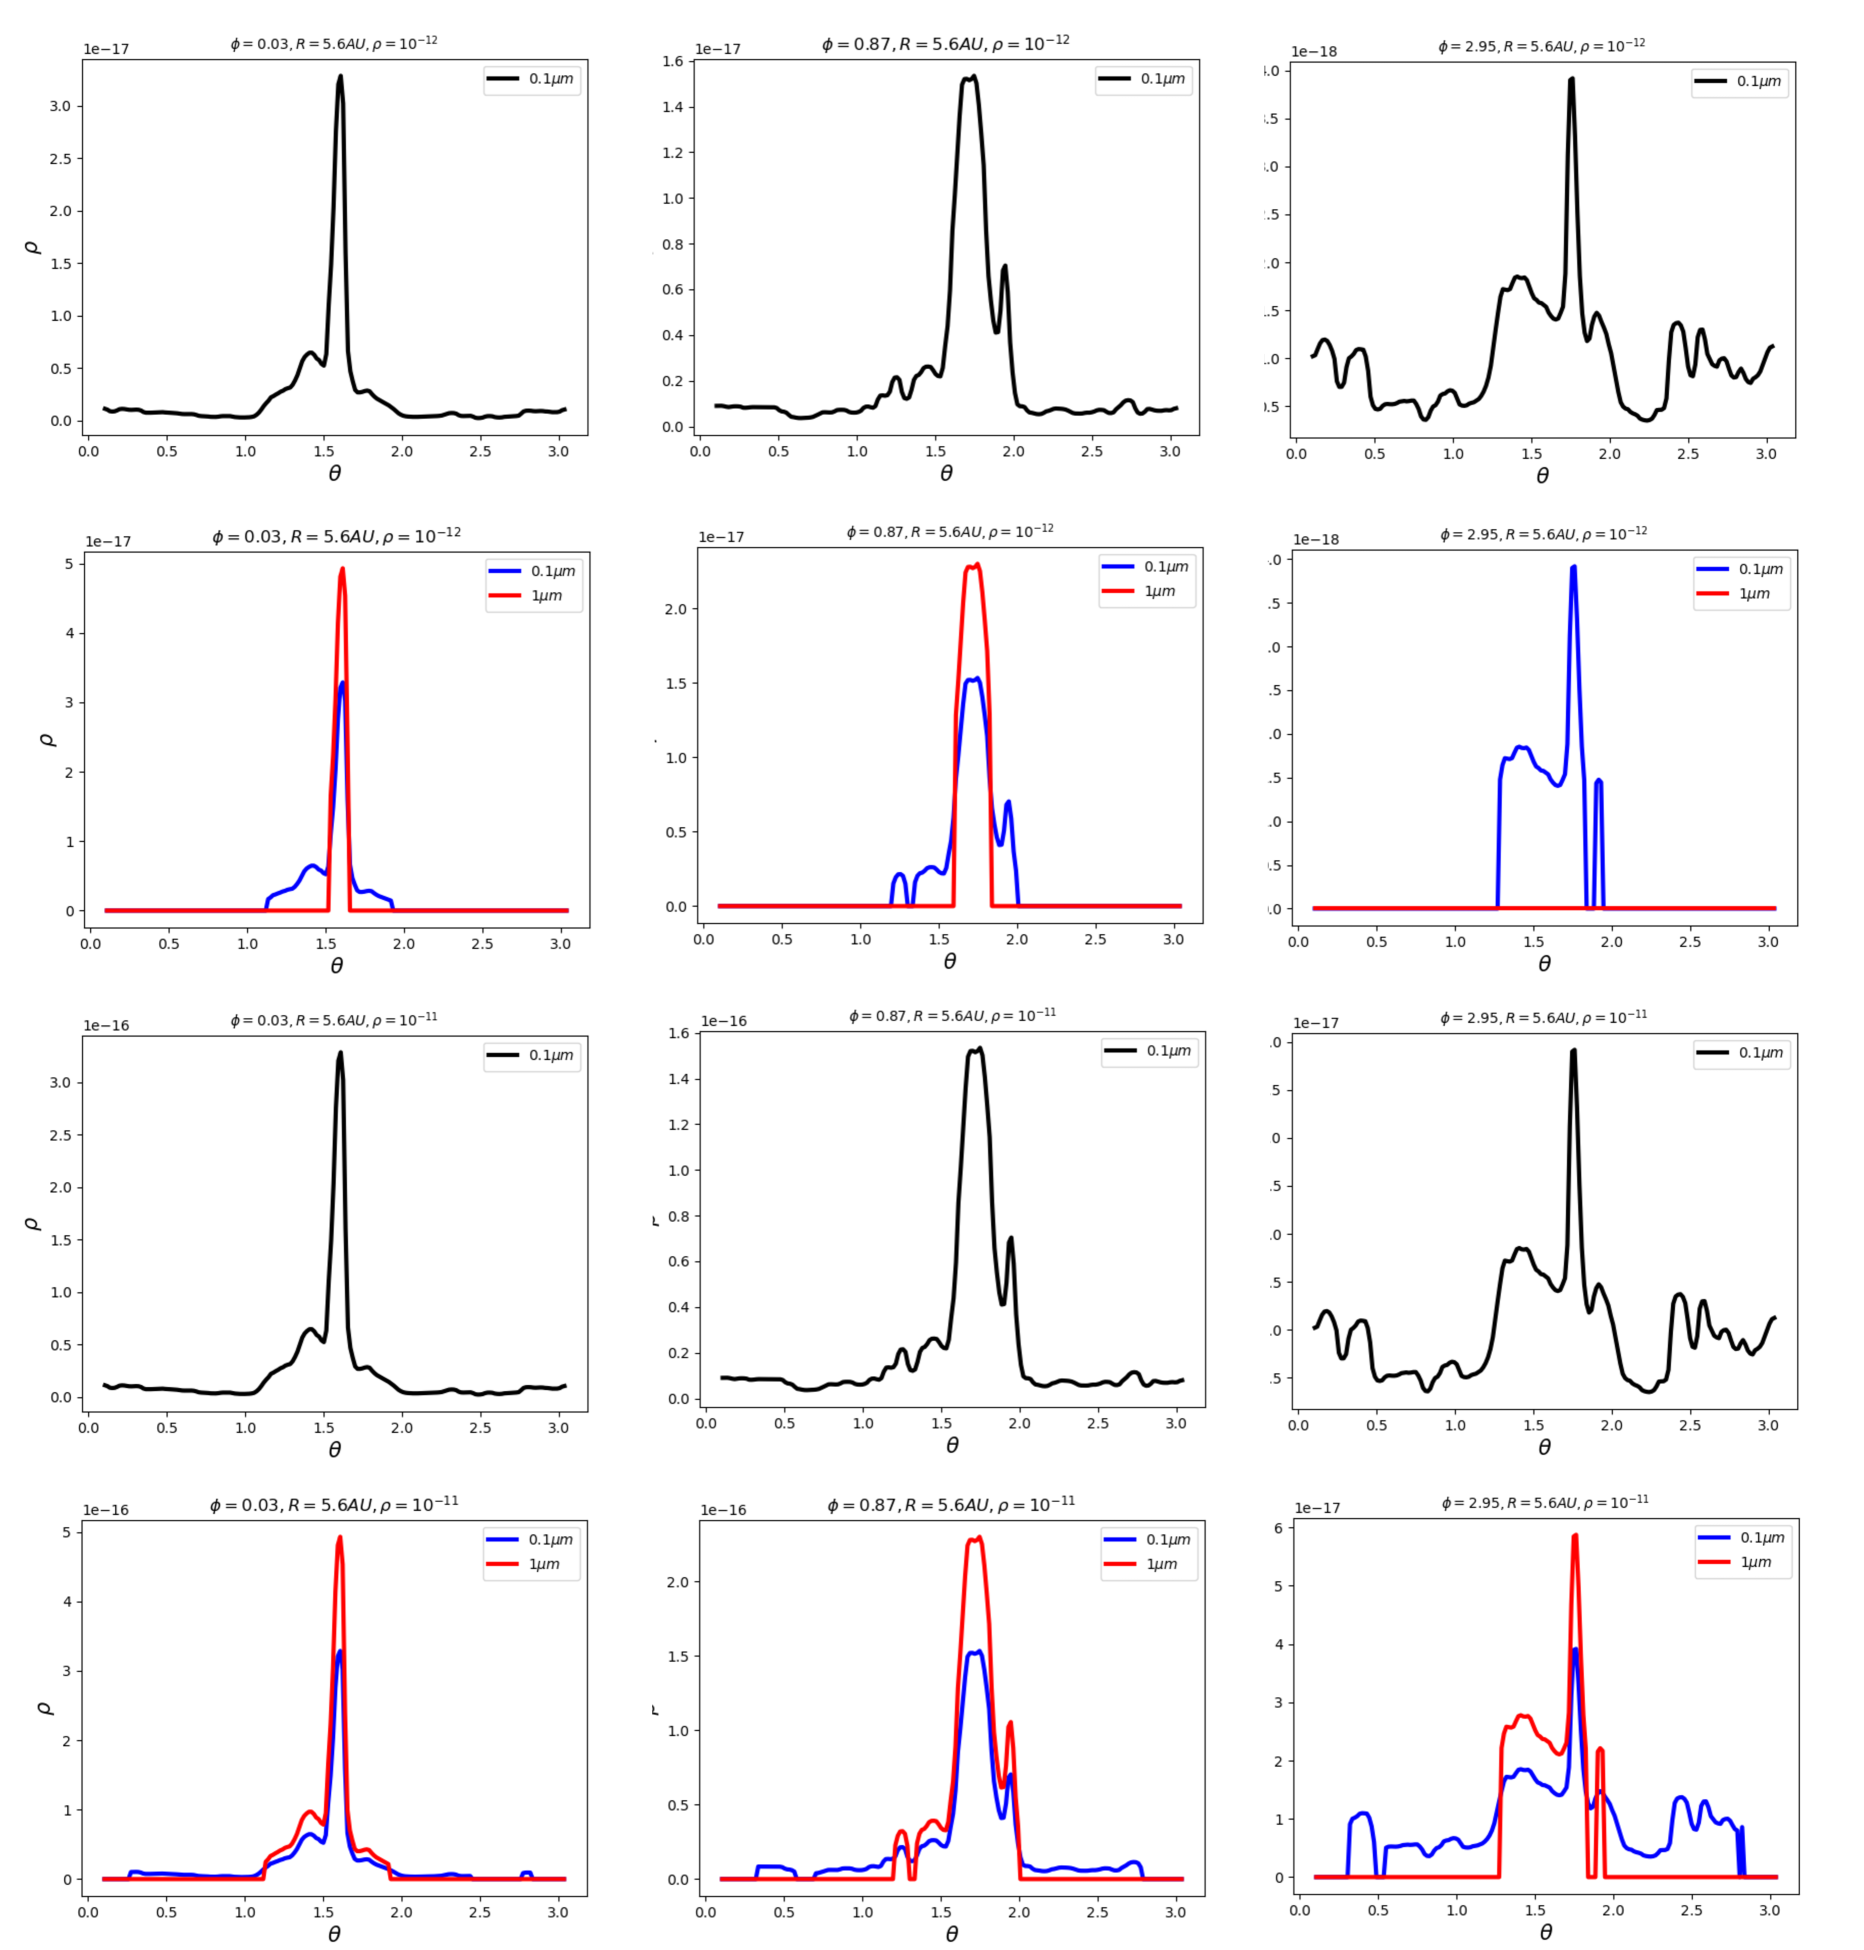
Figure 10 presents the dust density profile along the polar angle for the distribution of silicate dust particles at AU and two different values for the reference gas density.
The top row presents the SDD approach, considering only 0.1 m particles, well-coupled to the gas with a dust-to-gas ratio of 0.01. The second row shows the SND approach, incorporating both 0.1 m and 1 m particles, distributed according to their Stokes number in the disk-jet system for the gas density of . The third and the last rows present the SDD and SND approach, respectively, for a higher gas density of . Each column belongs to a different azimuth.
The plot indicates that the larger dust (1 ) tends to settle closer to the disk area, whereas the smaller dust reaches higher altitudes and are also locates inside the disk wind. For a larger gas density (bottom row), the 0.1 m dust particles reach even higher altitudes and become more widely distributed throughout the disk wind. We decided to ignore the millimeter dust particles because in our SND approach, they are well located in the midplane. Besides, in the case of , their Stokes number is above our threshold. Therefore, we expect that these large grain contribute only in the thermal radiation in long wavelengths that would be similar to the gas in the midplane. On the other hand, they have lower (and gray) opacity compared to smaller grains in smaller wavelengths that results in negligible absorption by these large particles. Although considering a distribution of all possible sizes that are suggested by observation or a dust settling model would be more realistic, it is beyond the main scope of this study.
Beside the dust spatial distribution, the opacity of the dust should be provided for the code. The opacity profile across the entire system plays a vital role in computing the radiation emitted by the dust particles. The opacity is directly related to the intensity, which is defined by
| (13) |
where is the optical depth, is the opacity or the absorption coefficient, is the incident intensity, is the density and is the distance that a photon travels in the gas. The opacity of a medium containing dust particles is determined by factors such as the size and composition of the dust particles, as well as the wavelength of the photon.
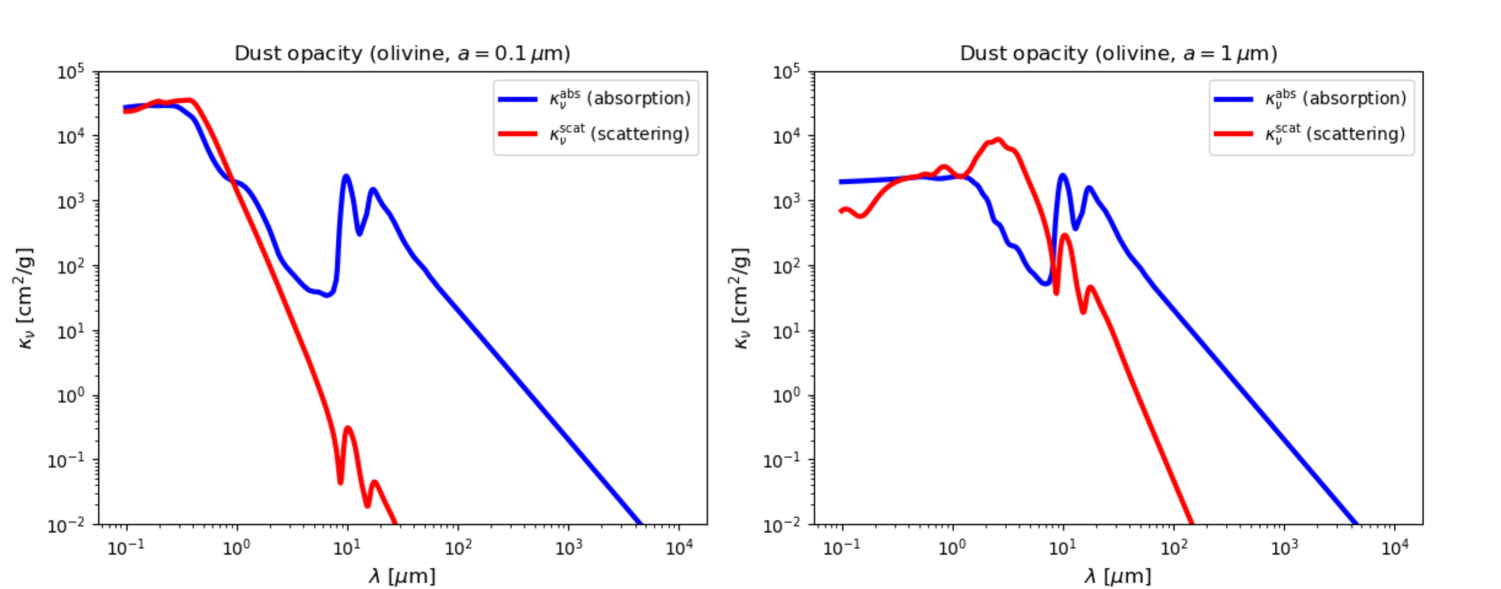
To provide the opacity for the code, we consider the dust as Olivine grains with . The dust opacities for each size are calculated using the data from Jena database 555https://www.astro.uni-jena.de/Laboratory/OCDB (Jaeger et al., 1994; Dorschner et al., 1995) and are specified in a separate file for each size.
In Figure 11, we illustrate the opacity profiles across different wavelengths , derived for an Olivine dust particle with a size of 0.1 m (left) and 1 m (right). As shown in Figure 11, the absorption decreases with increasing wavelength, except for a peak at 10 m. Therefore, at 10 microns, we expect a weaker emissivity, as significant absorption occurs at this wavelength for silicate dust particles.
We used incident photons and about scattered photons, depending on the wavelenght, for the models with . However, we increased the number of scattered photons to , and even to at the wavelength of 5 m for in order to obtain smooth and less spiky radiation maps.
We note that in the present simulations, we do not include the dust evolution in the model setup. Instead, a predefined distribution for dust particles is assumed and considered to be in thermal equilibrium with the gas. Indeed, a promising direction for future work is to incorporate dust evolution into the modeling, potentially enabling a more realistic and self-consistent approach when simultaneously evolving dust and gas.
5. Radiation maps
Dust continuum radiation maps of disk-jet systems may provide insights into their structural composition. These maps capture the emission from dust grains present within the disk wind and the underlying disk, offering essential information on the dust distribution, temperature profile, and overall system outflow structure. Additional information on gas dynamics and velocity may be obtained, although gas line radiation is required for that type of analysis.
5.1. Circumstellar disk-jet in a single star system
In this section, we present the radiation map of the disk-jet structure in a single star system that has achieved a steady state. To generate the images, we employed the SDD approach, considering small dust particles of sizes of 0.1 m which are well-coupled to the gas and follow the dust-to-gas density ratio of 0.01.
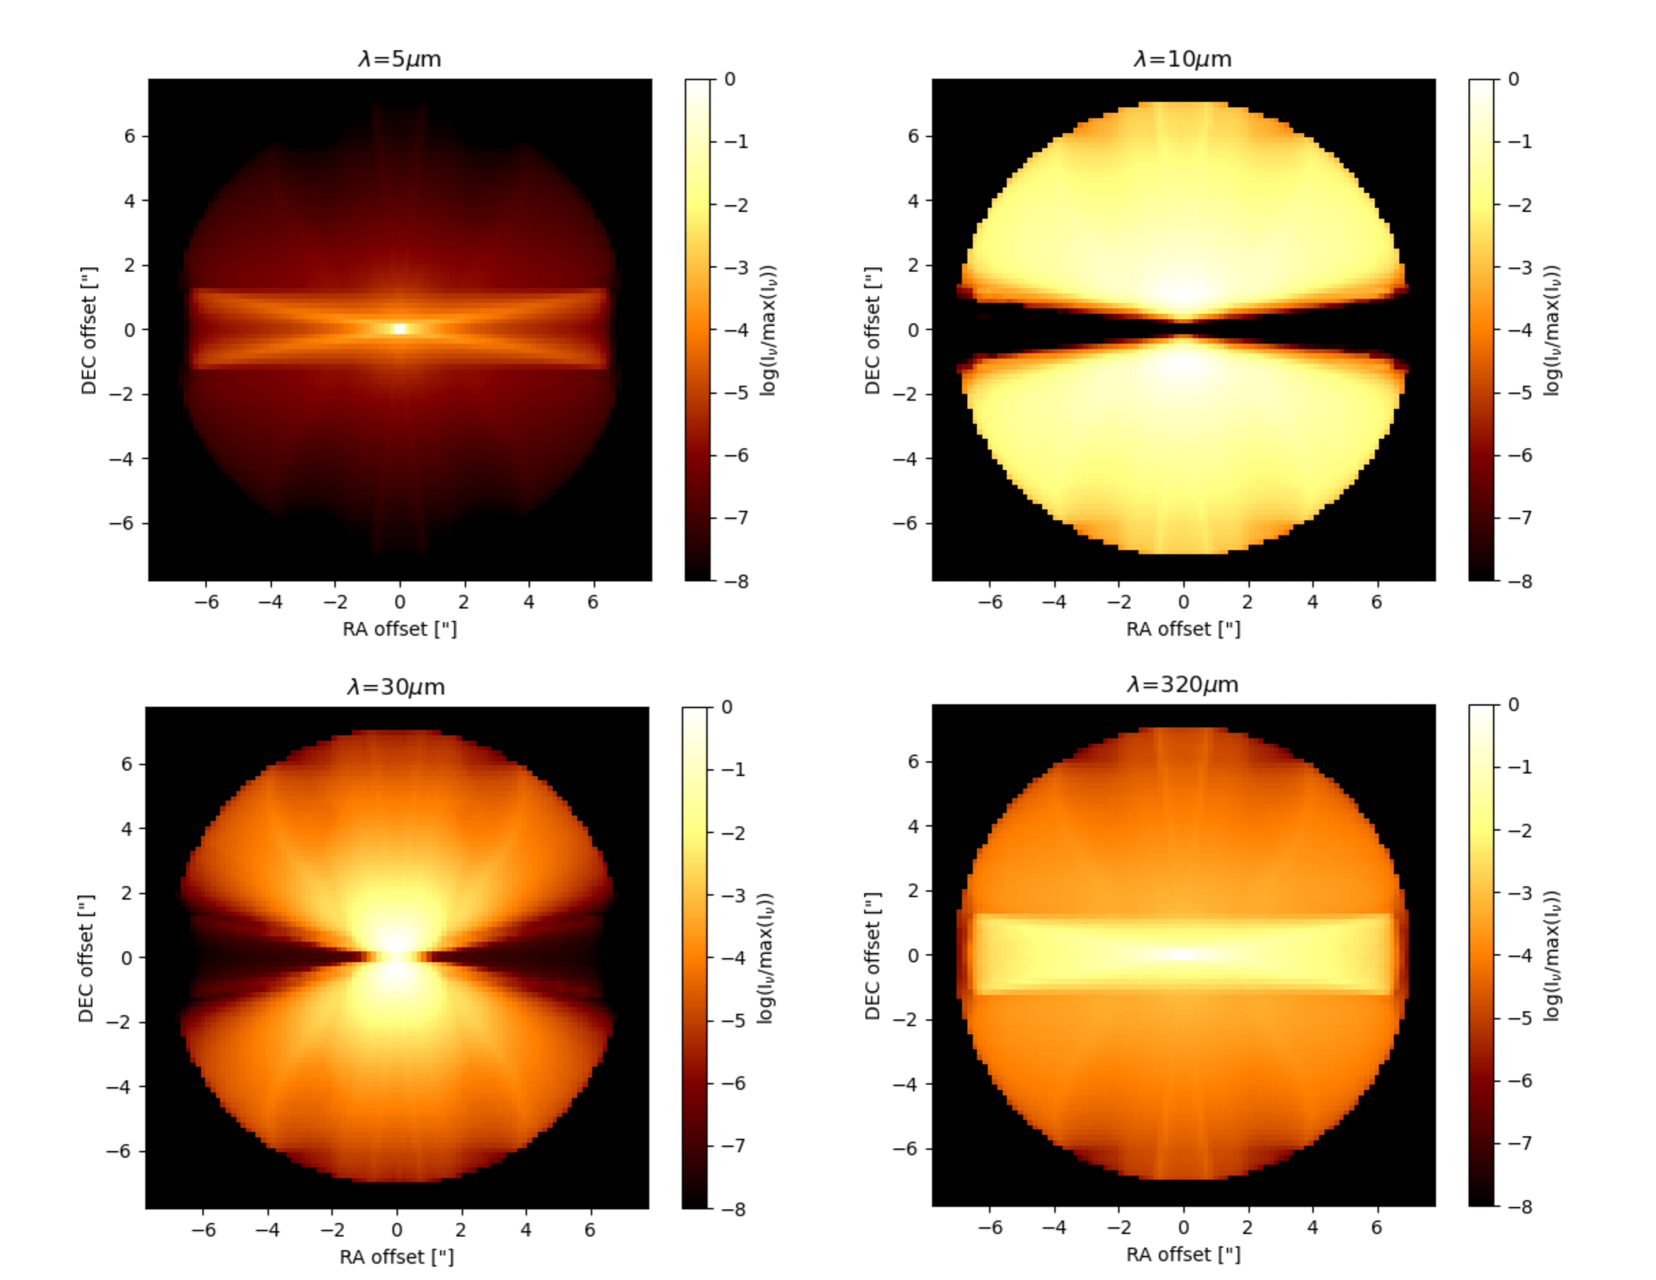
Figure 12 shows the dust continuum radiation maps from our simulations, showcasing the circumstellar disk that initiates the jet in a single star at a dynamical time of t=6000. These snapshots show the radiation map of the disk-jet system at inclinations of 90 degrees, relative to the line of sight, at wavelengths, 5, 10, 30, and 320 microns. The images represent the intensity in units of Jansky per beam assuming a source distance of 140 pc.
In order to better understand and interpret our radiation maps, we may consider the silicate opacity as a function of wavelength, as illustrated in Fig. 11. The opacity values displayed represent the absorption coefficient per unit mass (in blue) and the scattering coefficient per unit mass across the wavelengths. The opacity profile shows a peak around 10 , which is known as an important spectral feature of silicates, and then slowly levels down for larger wavelengths.
Therefore, the disk midplane, which has a larger dust density compared to higher , is opaque for m , but is almost transparent for wavelengths around m. The cross shape seen in m is indeed caused by scattering from the disk surface. This scattered radiation could leave the disk due to the reduced absorption and thus reach the observer.
The wind from the surface can be seen more easily in the m. In longer wavelengths, for example, m, the disk is brighter because of the dust thermal emission.
5.2. Circumstellar disk-jet in a binary star system
In this section, we present radiation maps for a circumstellar disk-jet in a binary system. To generate the radiation map of the disk-jet in a binary system, we employ both approaches outlined in section 4 and then compare the differences.
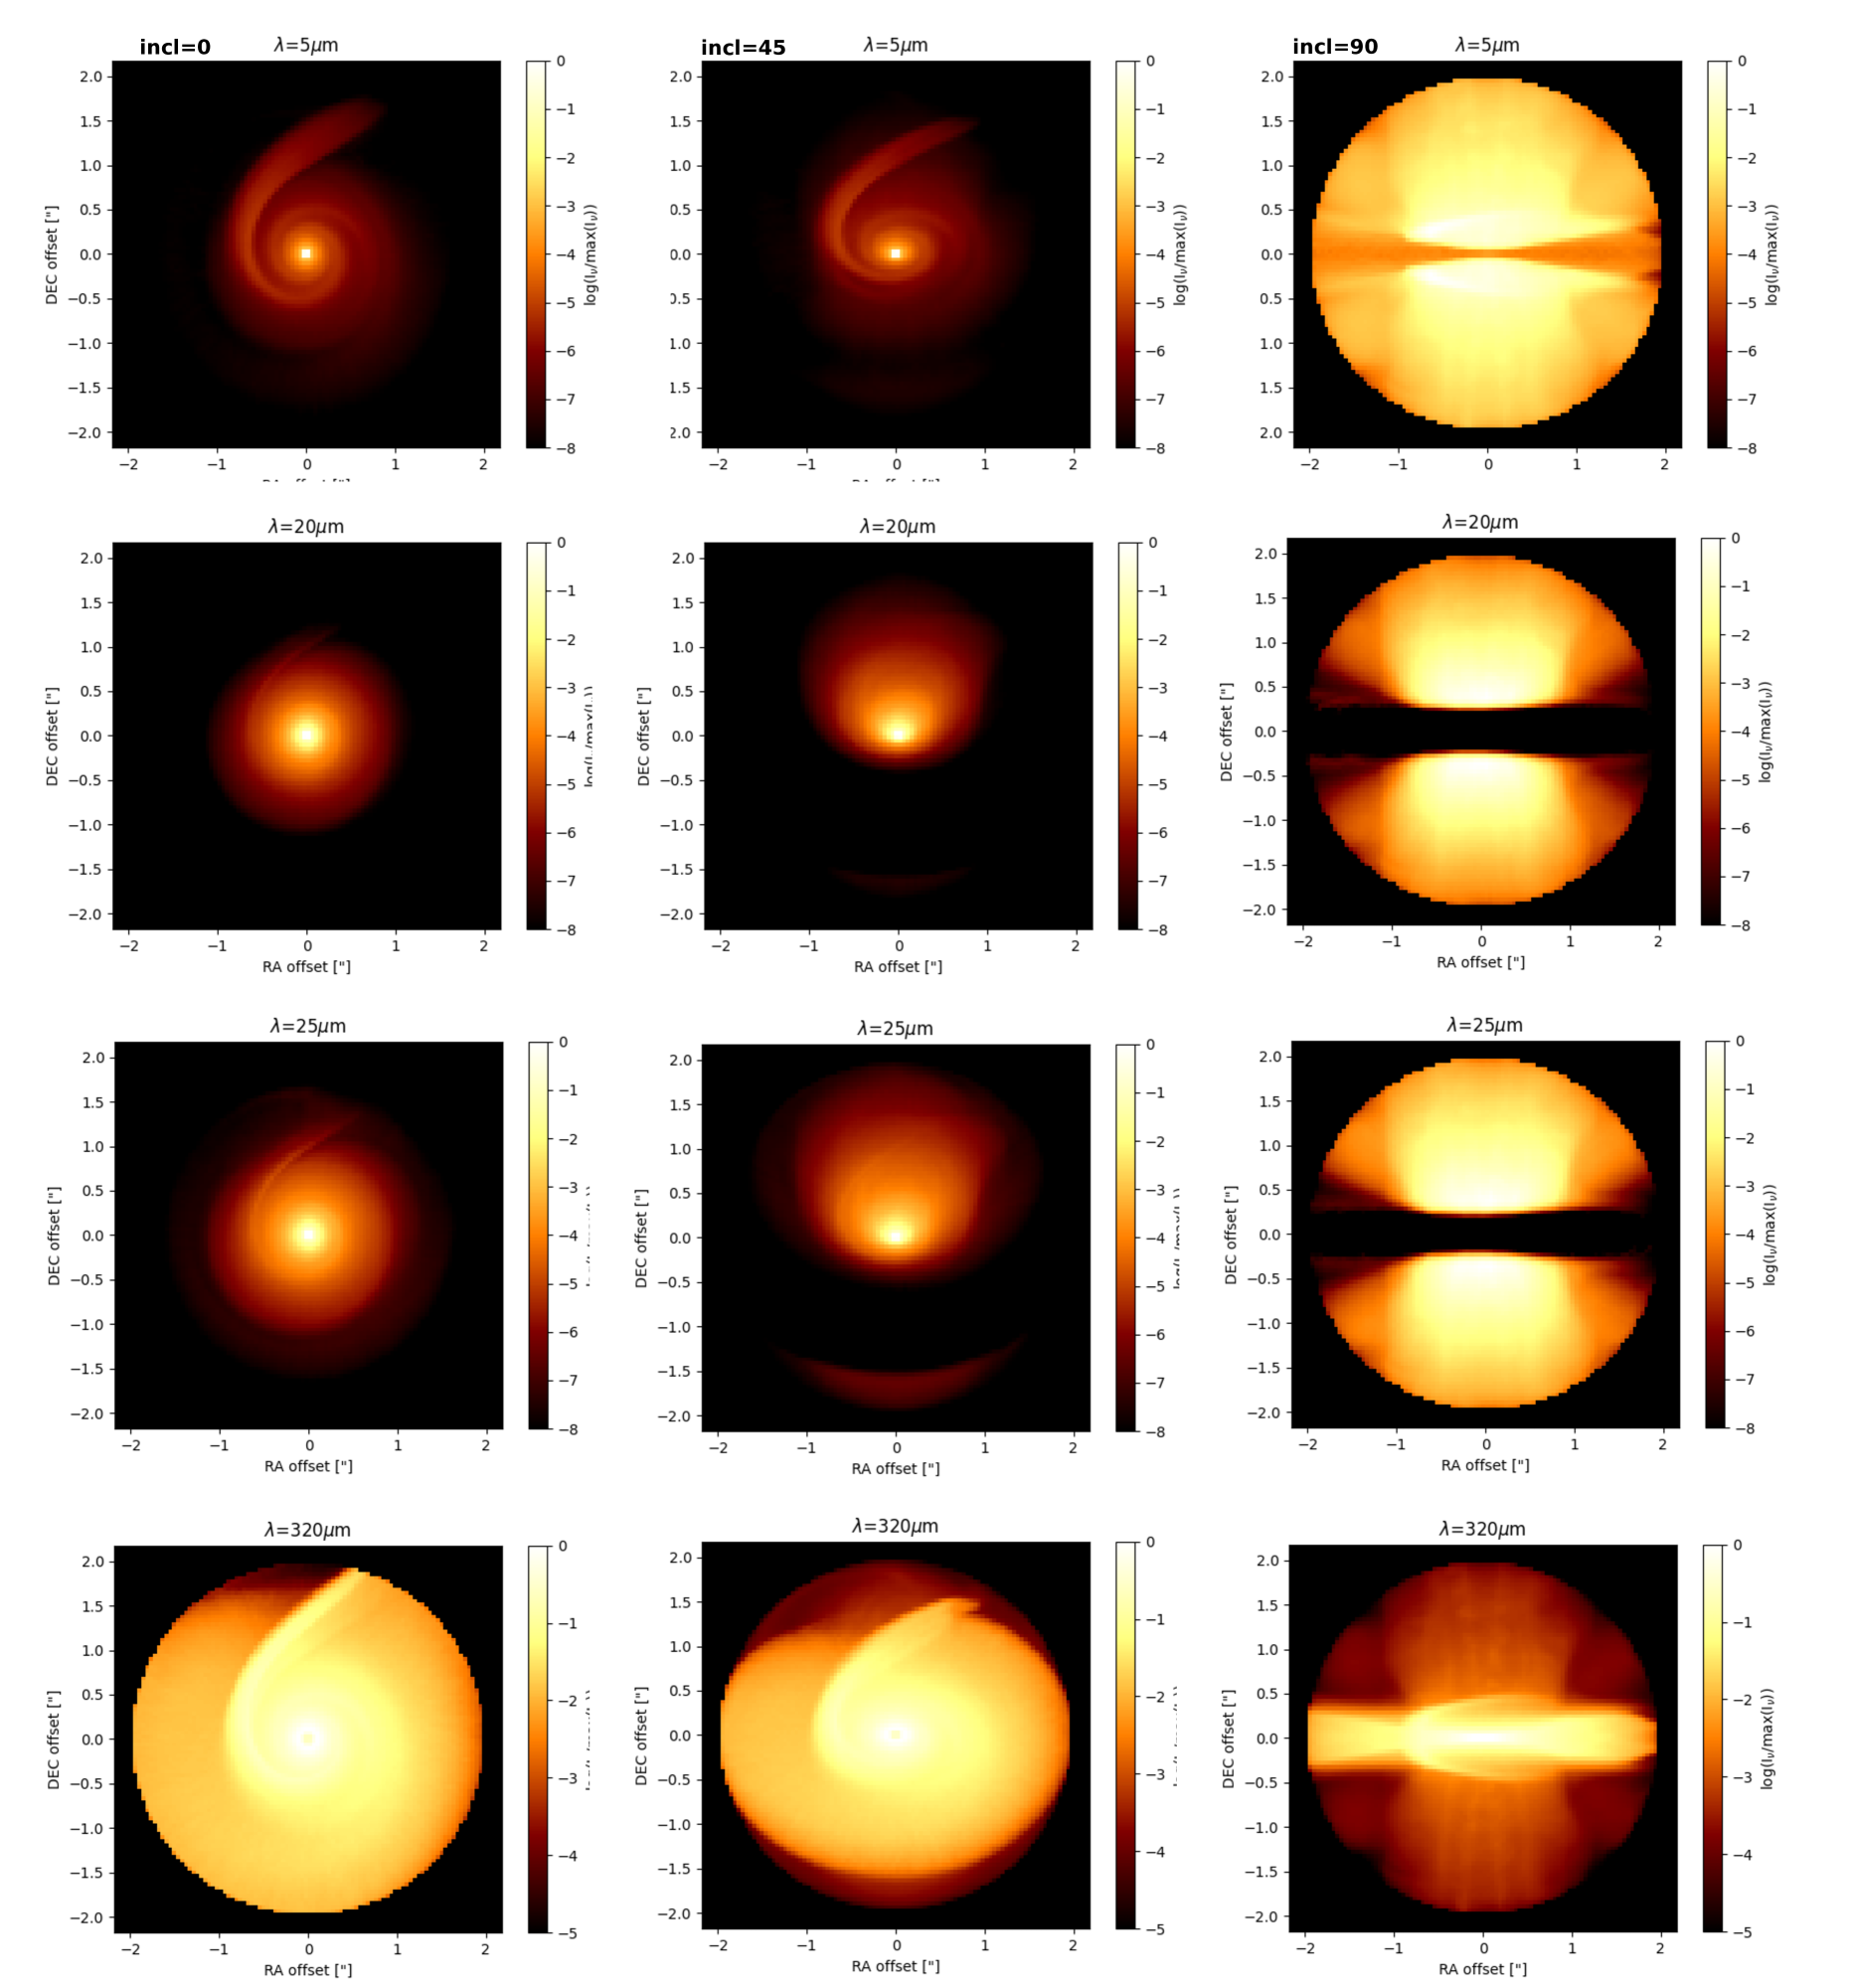
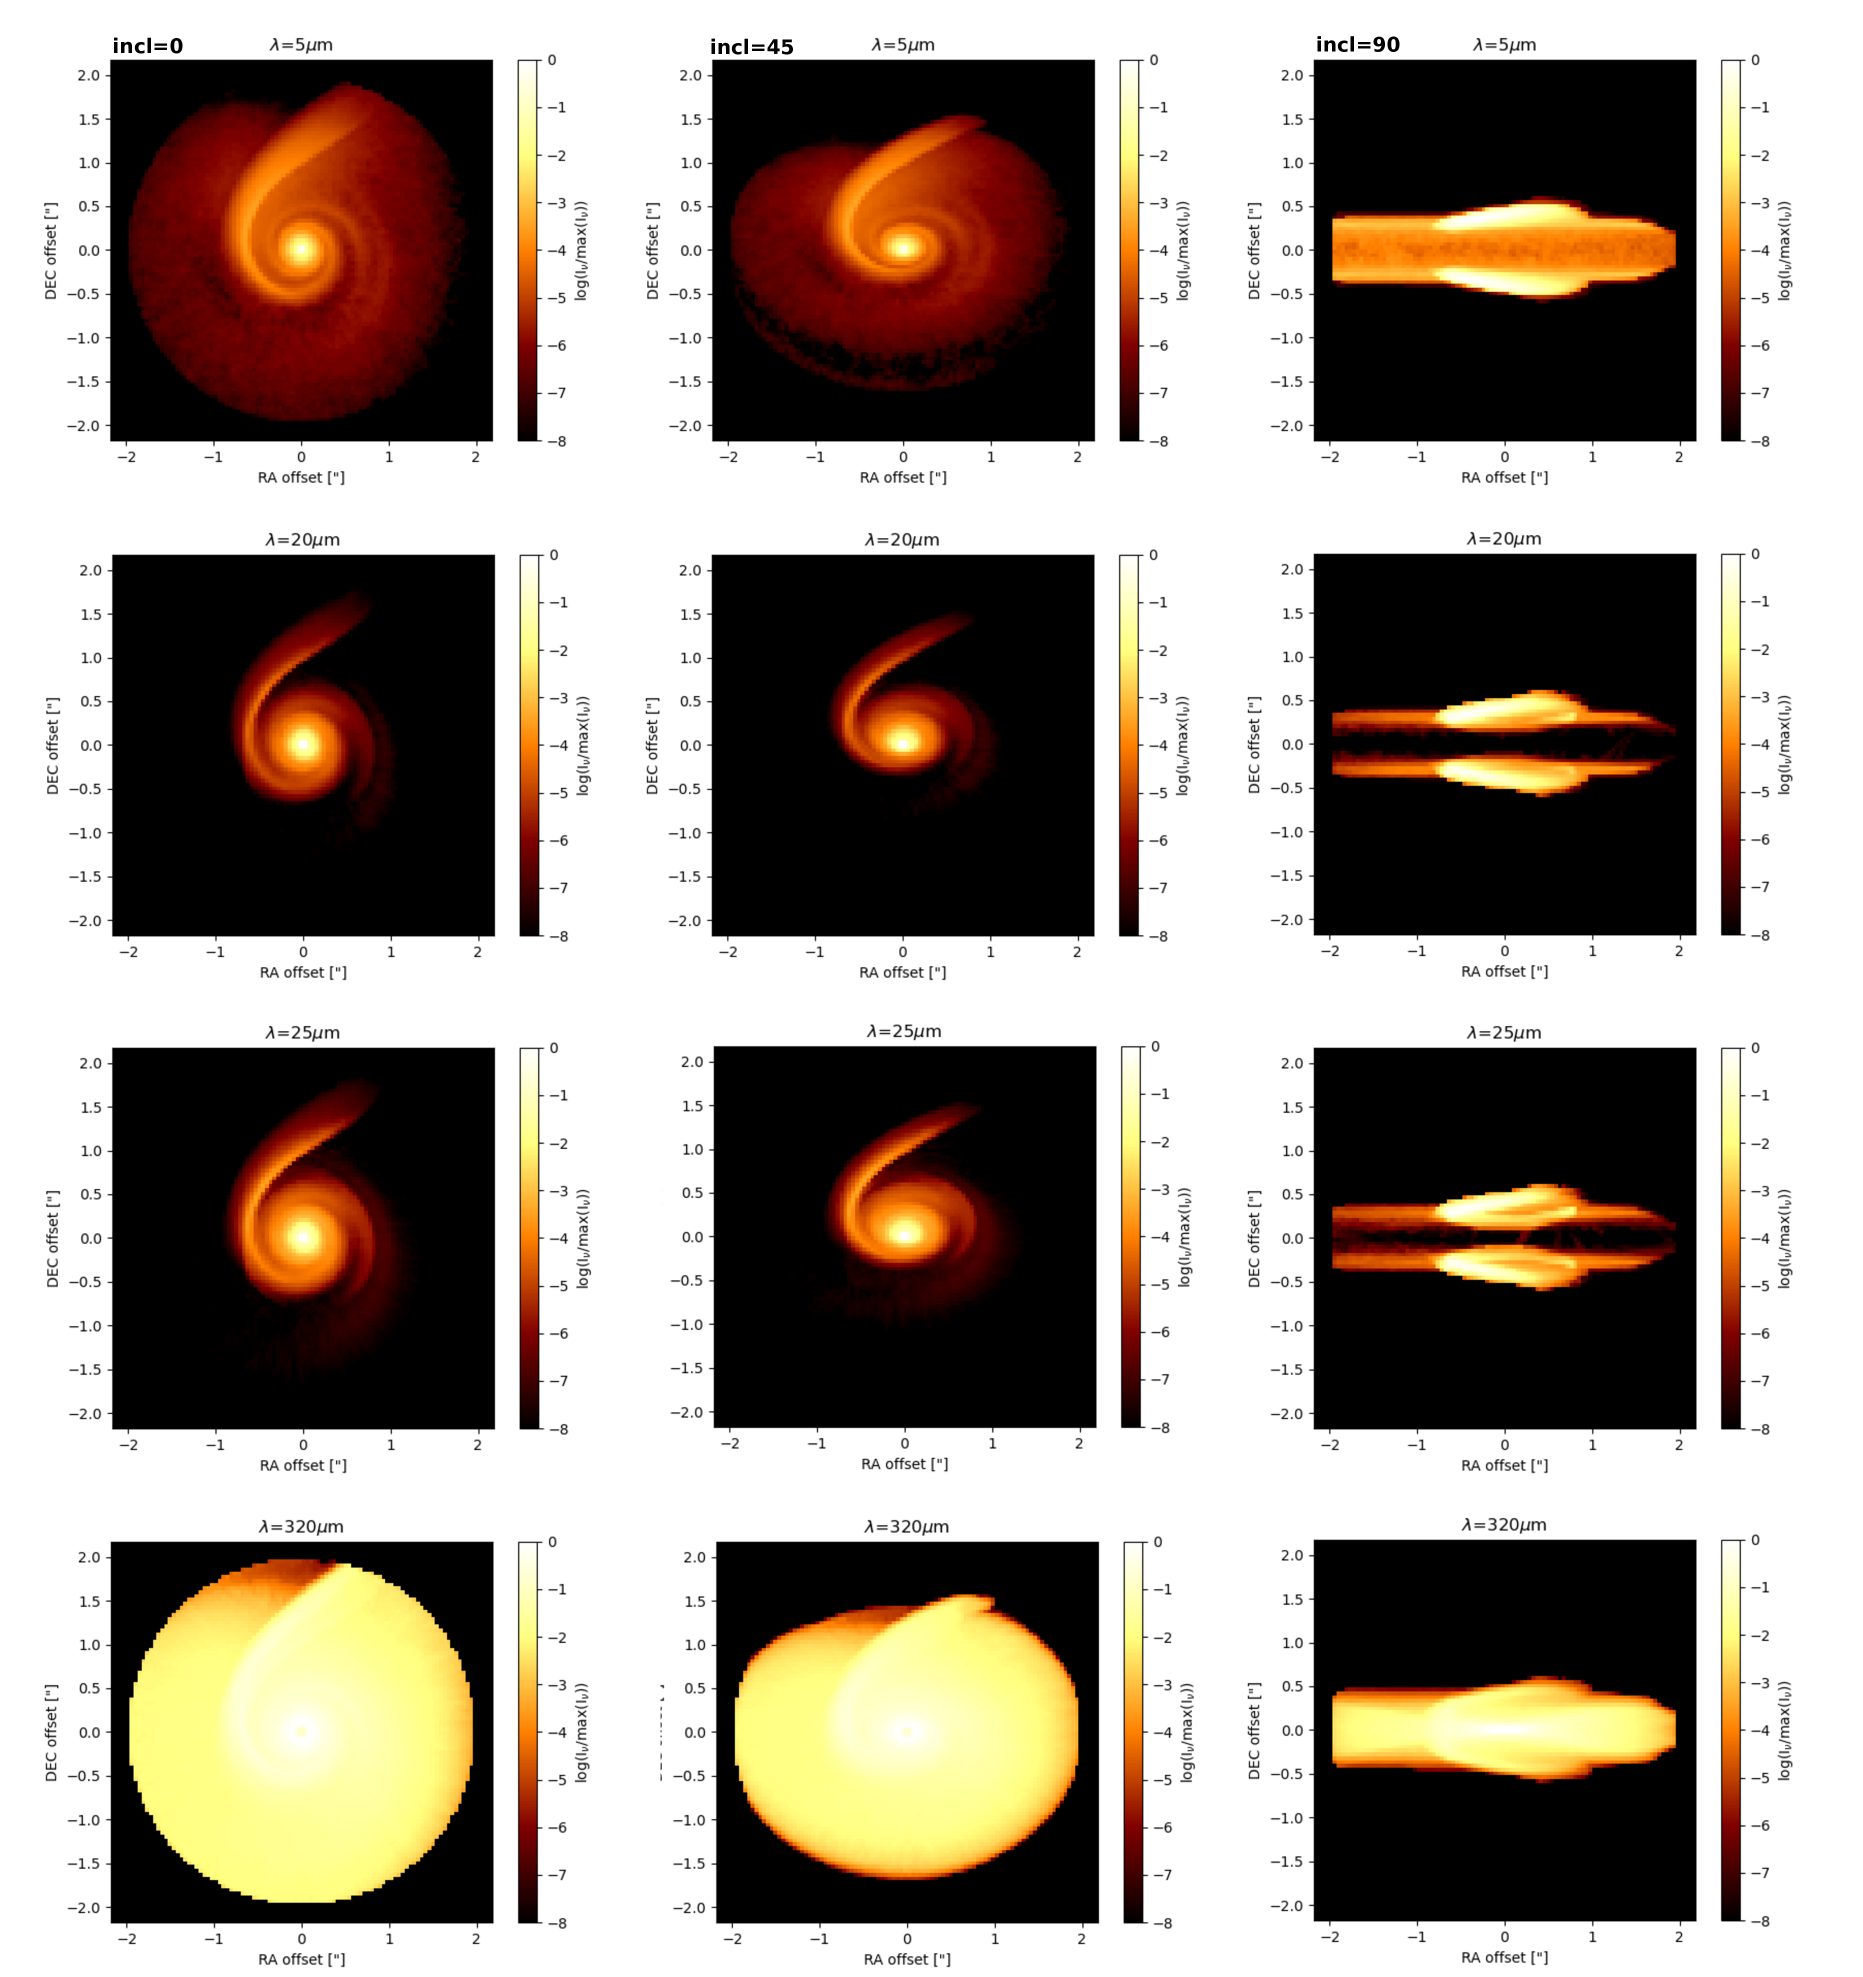
First, we consider the SDD approach, which accounts only for small dust particles with a size of 0.1 m into account. These particles are well-coupled to the gas and follow the dust-to-gas density ratio of 0.01. Figure 13 displays the dust continuum radiation for this model for various inclination angles.
The 5 radiation map distinctly shows the scattered light from both the disk surface and the outflow. The spiral structure on the upper layer of the disk is evident for all inclination values. In the edge-on view, the spirals can be seen on both the top and the bottom sides. The outflow and the disk asymmetry can be also distinguished.
In the radiation maps for and m we see the scattering off the stellar radiation from the spiral on the layers closer to the surface than in the m, while the disk mid-plane remains completely opaque. However, because there is a drop in the opacity of Olivine around m, photons can penetrate deeper into the disk and its outer part are visible in this wavelength.
Spirals are also recognizable in m which shows the thermal emission of the disk mid-plane. There is also some radiation in this wavelength from the dust in the outflow.
While the spiral arms are a prominent feature in the disk mid-plane, these characteristics also manifest themselves in the upper layers of the disk and are also transported into the outflow, thus offering a robust validation tool for forming spiral arms in the disk wind as well. As the wavelength of the stellar radiation increases, photons can penetrate the deeper layers of the disk.
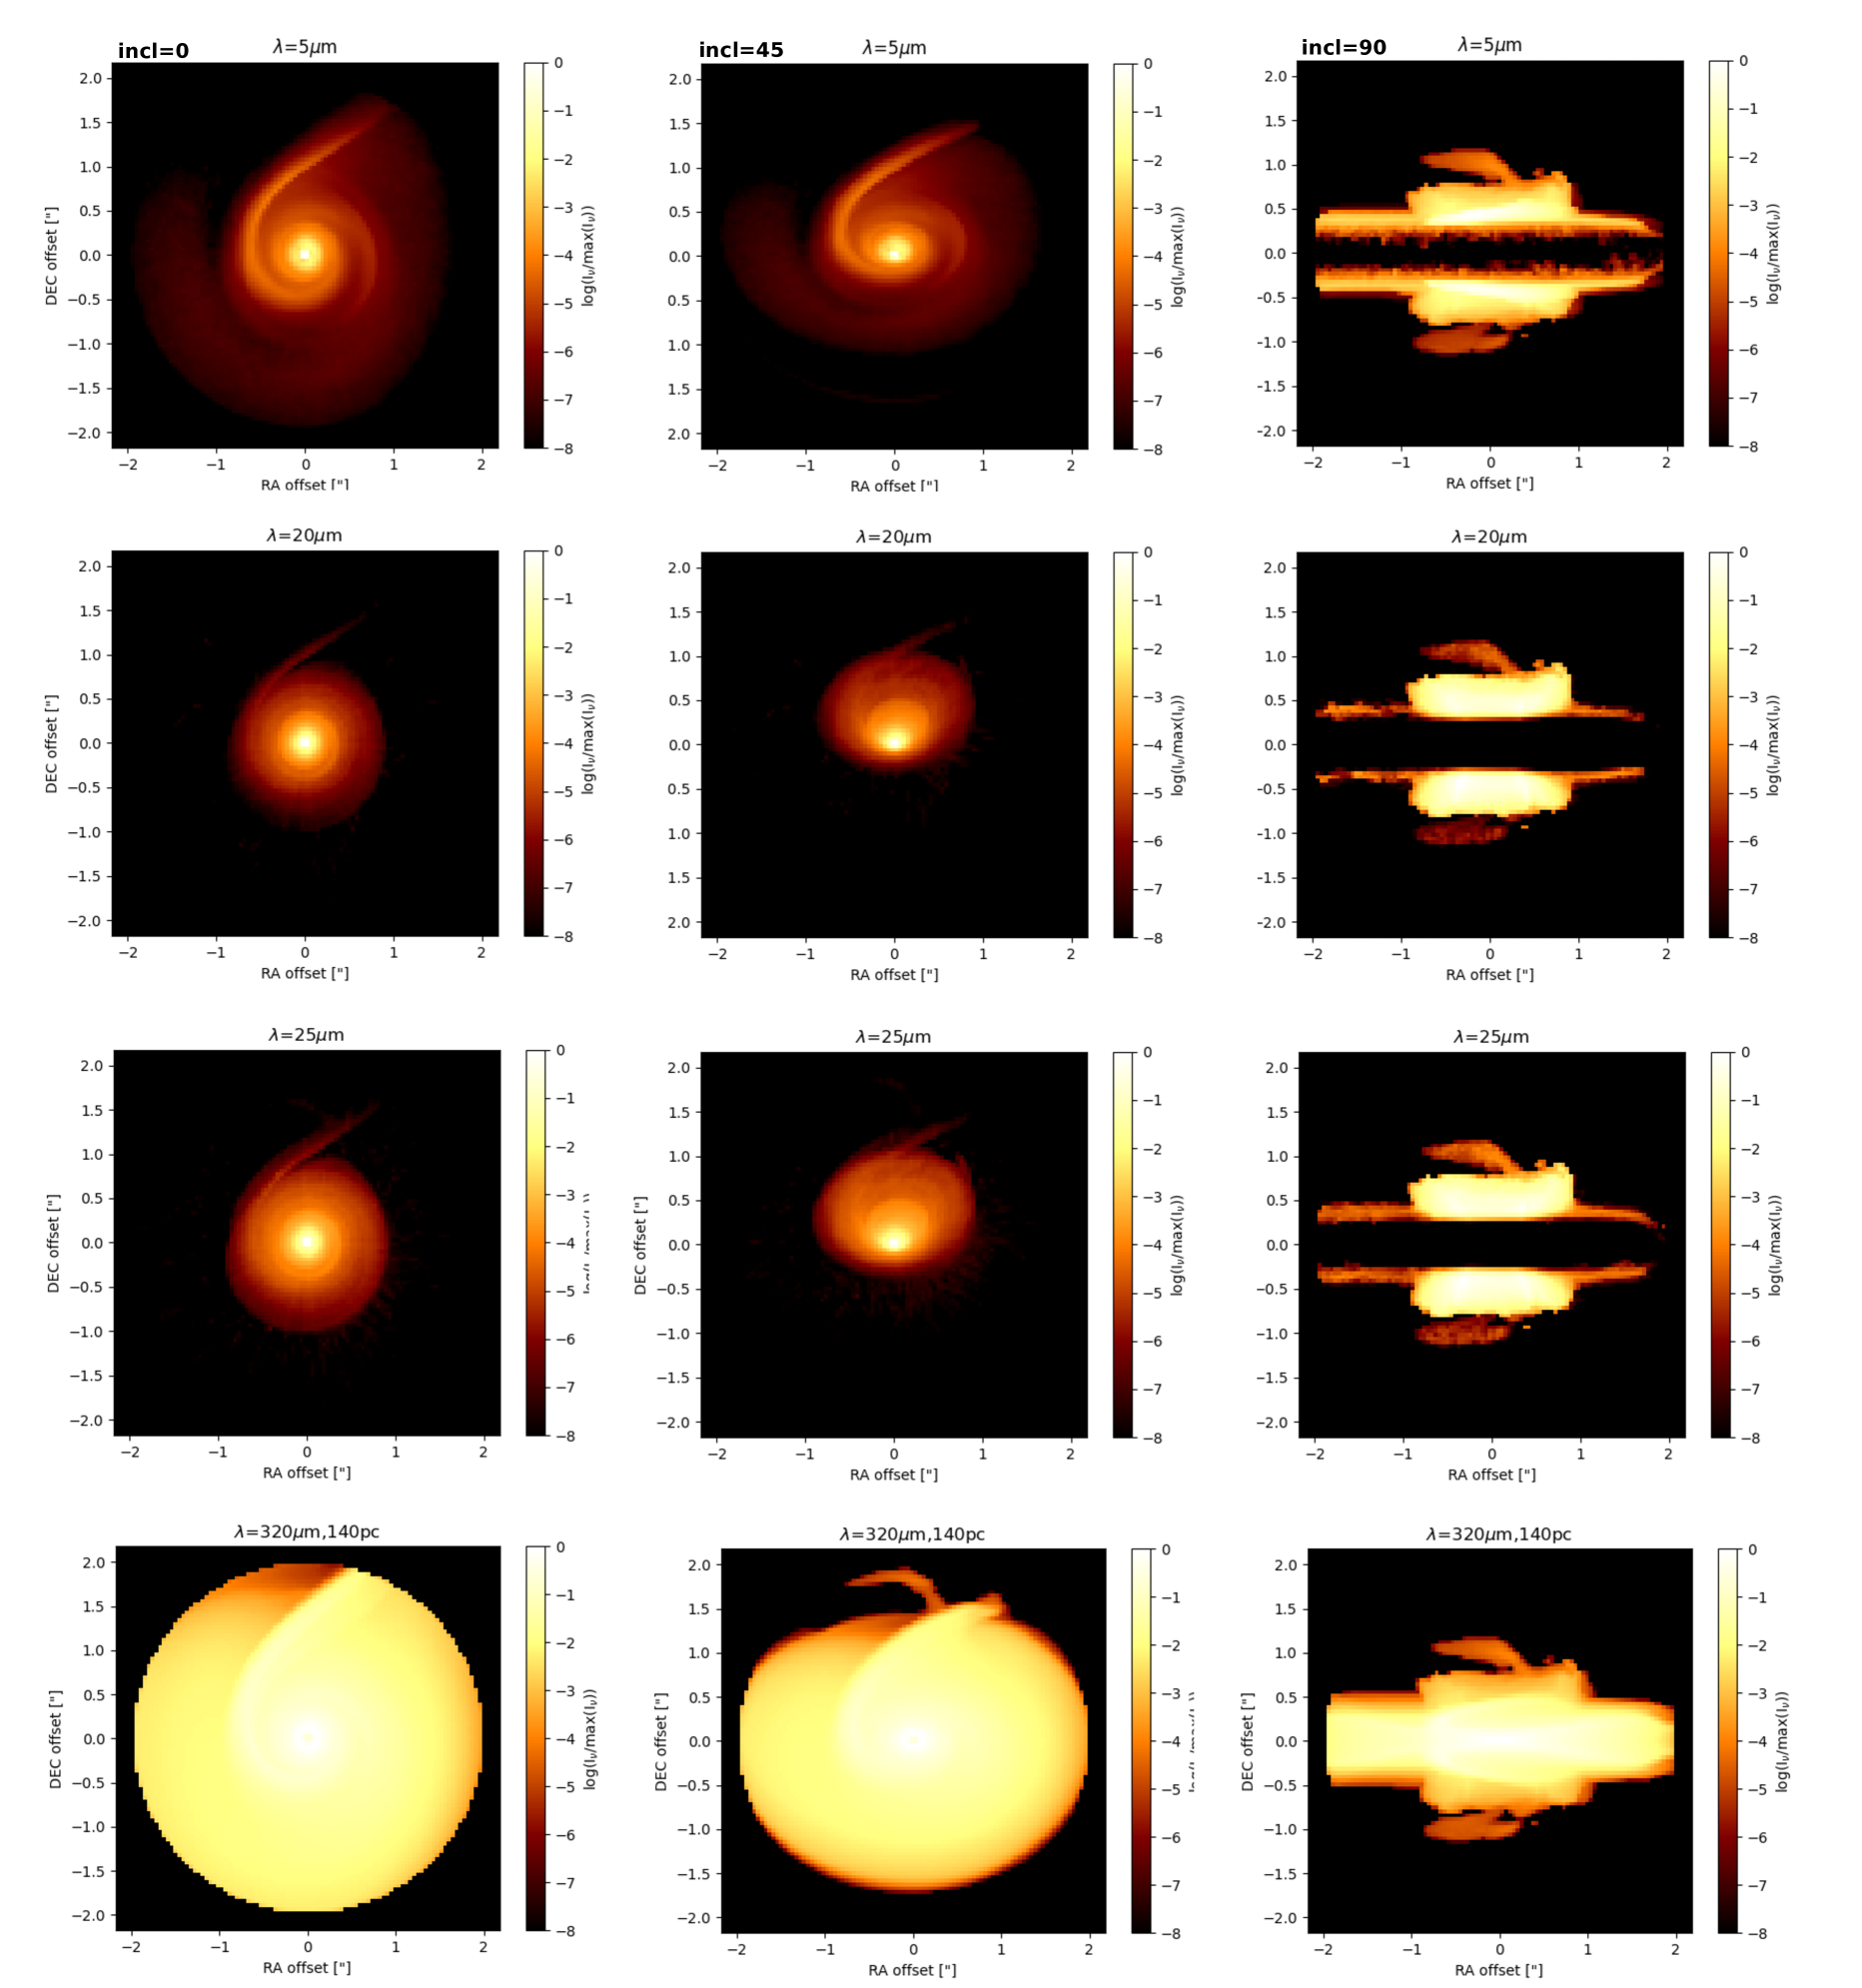
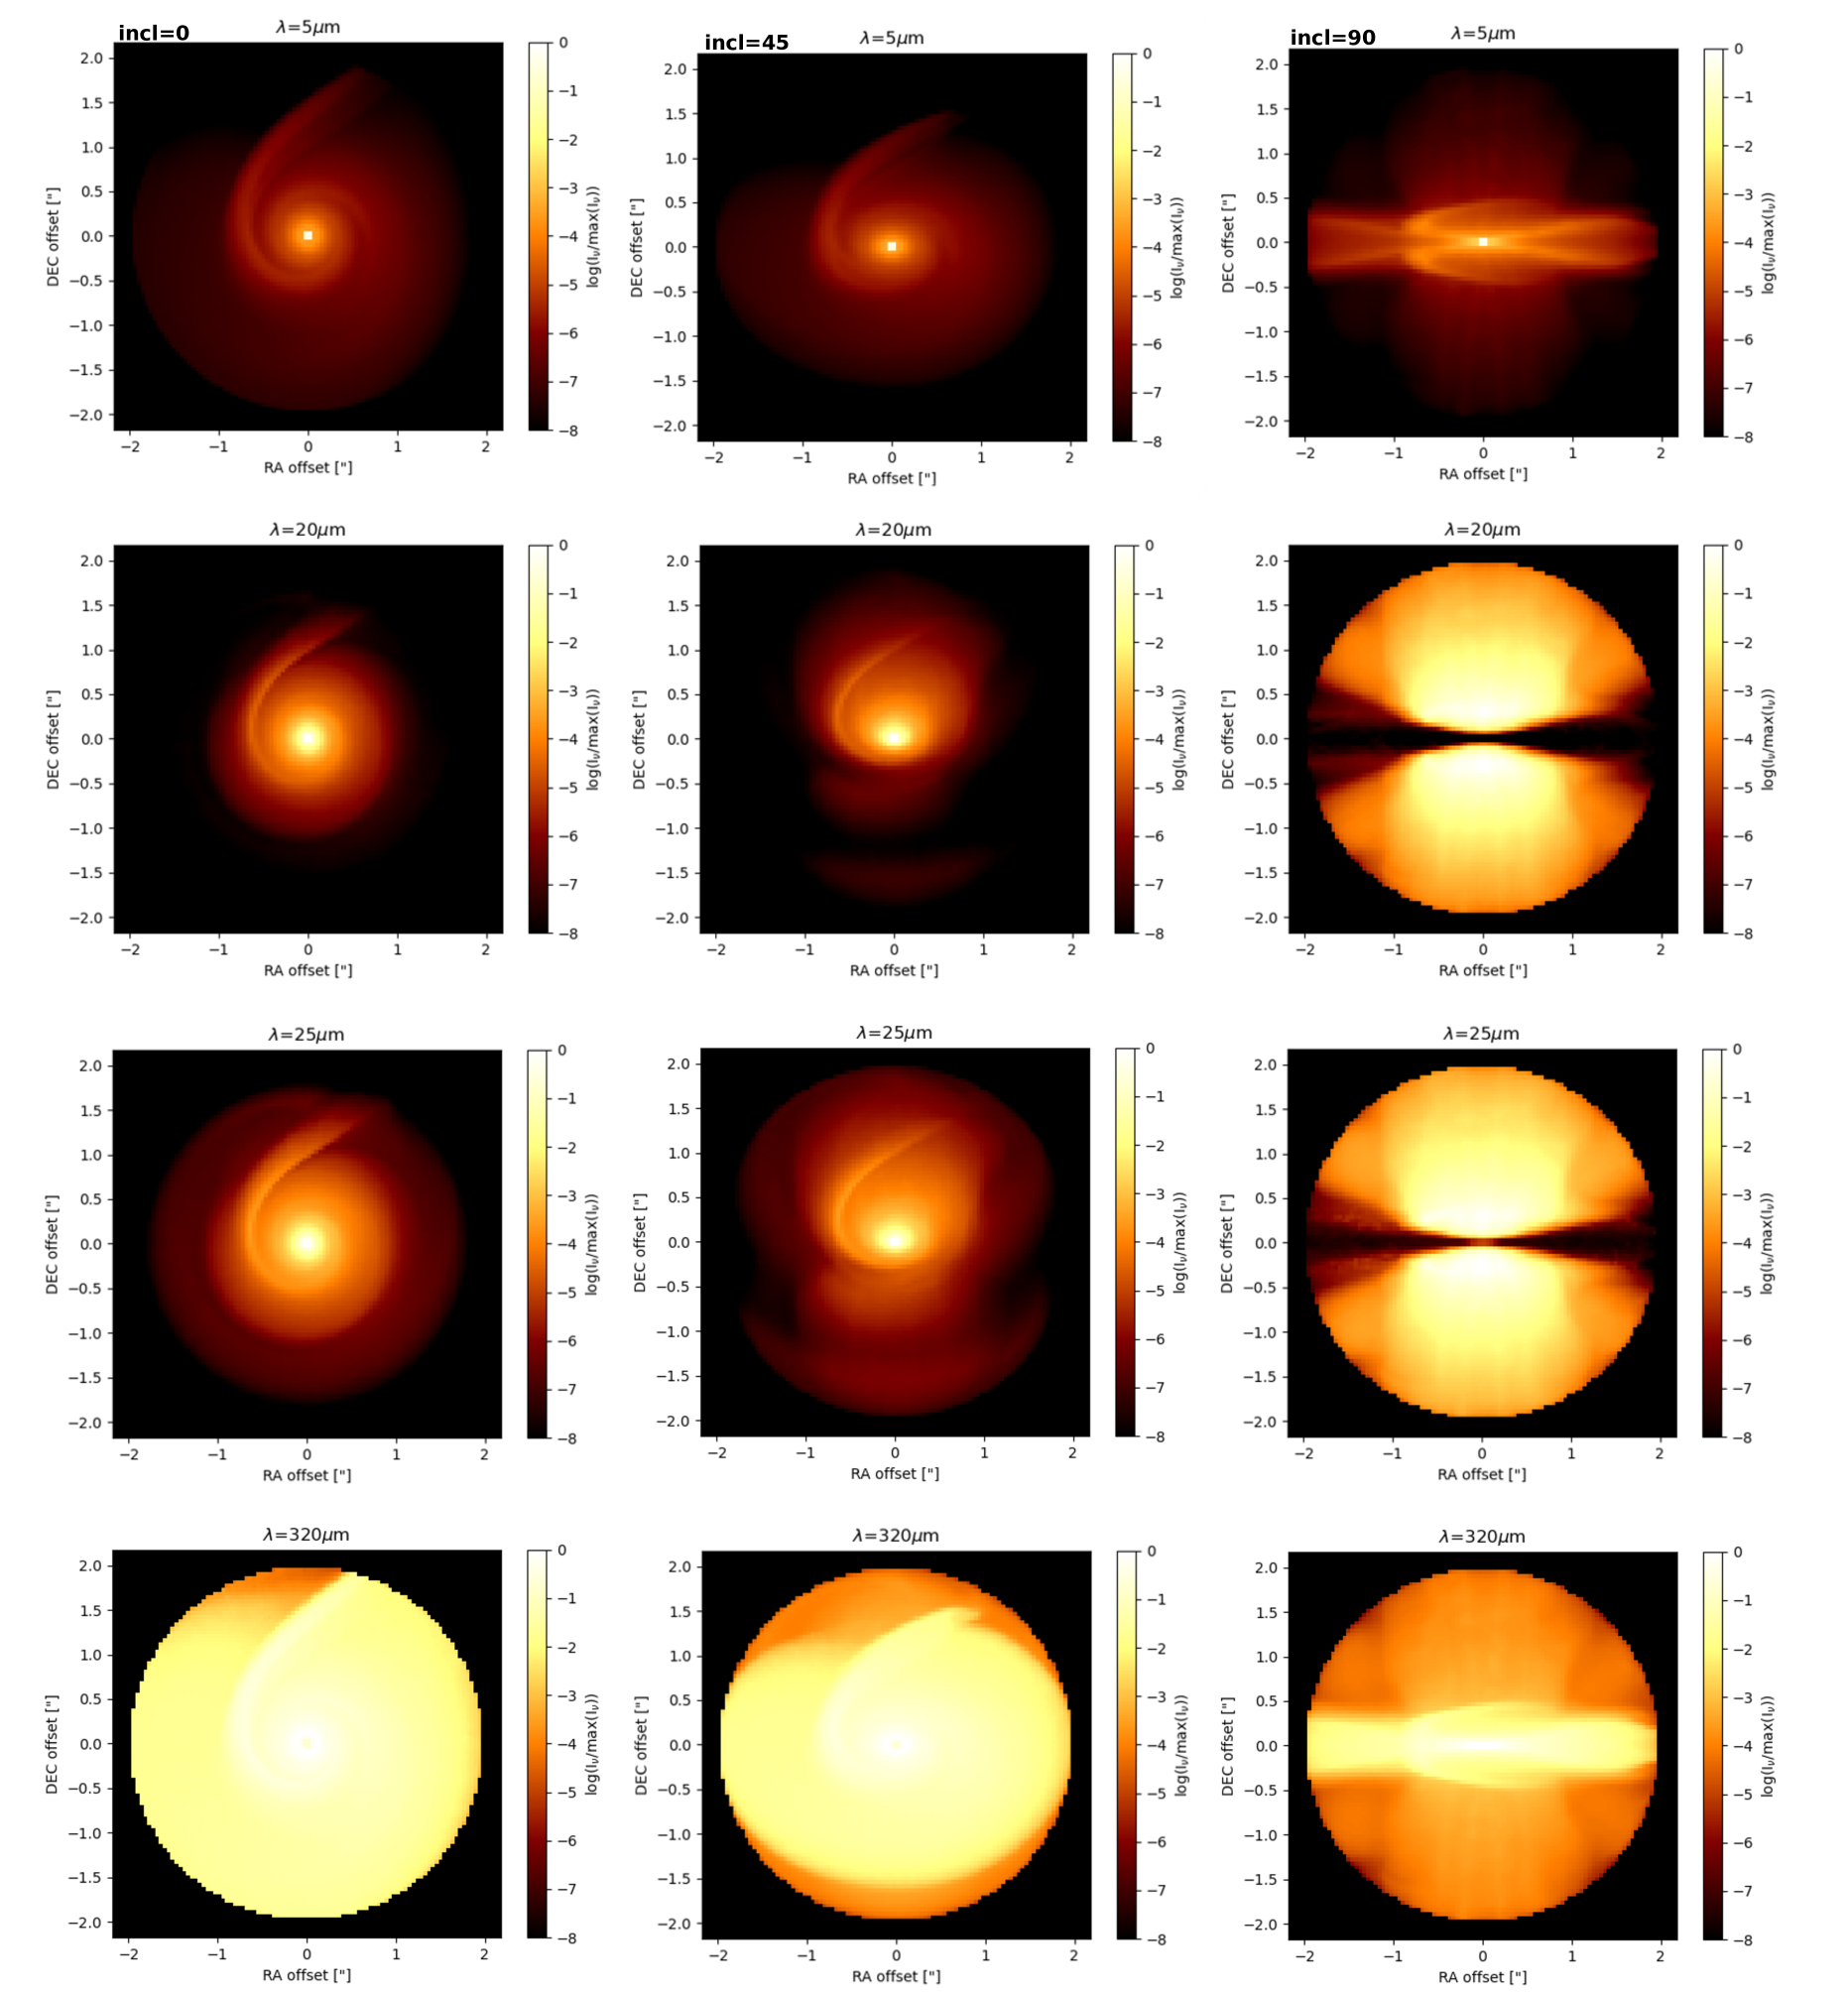
Figure 14 is similar to Fig. 13 but is based on the SND approach. In comparison to the single-size model for dust particles, we find that most dust particles remain in the disk, resulting in a lower concentration of dust in the disk wind. Consequently, we receive radiation primarily from the lower part of the disk wind, while the majority of the radiation originates from the disk itself. In fact, we hypothesize that wind would be better observable in disks where the dust is less settled and not yet grown.
Considering Figure 14, we recognize that the larger dust particles remain in the disk. The spiral arms are visible at 5, 20, and 25 m, as well as at longer wavelengths. In the SND approach, even small dust grains primarily reside in the disk, and partly lower layers of the disk wind, as their large Stokes number results from the low gas density in the wind.
Thus, in summary, the wind becomes observable when small dust is coupled to the gas, while the spiral arms are detectable when the dust has settled.
5.2.1 Larger gas density
To explore the effects of different density normalizations, we also generated radiation maps for the binary star run by applying larger gas densities at the inner radius of the disk, specifically , as shown in Figure 19 and Figure 20, which we display in the appendix for brevity.
Compared to the smaller gas density, distinct differences are observed in the resulting radiation maps applying . As shown in Figure 19 (in the appendix) which has been provided by the SDD approach, the disc is not optically thin for wavelengths around m and the radiation, received by the observer, originates from relatively shallower layers of the disk. The cross and fork shape radiation that exist in the lower density models and is produced by the scattered light from the surface layers of the disc and the spirals does not exist in the higher density model. At wavelengths of and m, the disk with a larger density is more opaque compared to the smaller density model and the dark region seen in the disk has expanded vertically. This effect is particularly evident at an inclination of degree, relative to the line of sight.
The disk wind from the surface is more prominent at and m and originates from upper layers of the disk compared to the lower gas density case. At longer wavelengths, for example, m, the disk and the wind both are visible and bright enough because of the thermal emission of the disk and the base of the wind.
Additionally, we observe differences in the radiation maps when employing the SND approach for the larger gas density of . Regarding Figure 20 (in the appendix), the disk appears opaque at 5, 20, and 25 m, with radiation originating from the upper layers of the disk and the base of the disk wind. As discussed earlier, an increase in gas density allows 0.1 m dust particles to reach higher altitudes and become more widely distributed throughout the disk wind. This effect is evident in the radiation maps shown in Figure 20 (in the appendix), where the disk wind becomes more pronounced at these wavelengths.
Additionally, some features within the wind, which were not visible at lower gas densities, are now visible. At longer wavelengths, such as 320 m, both the disk and the base of the disk wind appear bright, with thermal radiation being received from both. Furthermore, some features within the disk, spirals, and the disk wind are clearly visible at 320 micron.
We would like to note that the spiky features in the smaller wavelengths and inclination are produced because of the high optical depth in the disk. In order to eliminate them, we had to increase the number of scattered photon by at least two order of magnitude that would become very costly. However, after convolution these features would be vanished (see Fig. 21 in the appendix).
5.3. Providing the radiation map for observation
Understanding how a specific telescope observes a real astronomical object is crucial for distinguishing which features in a preliminary radiation map can be practically detected by different instruments.
The radiation map obtained in the previous section requires further improvement to generate an image corresponding to a specific instrument’s capabilities, including the wavelength and distance involved. This improvement is achieved by applying convolution.
Convolution models the impact of a telescope’s optics and atmospheric conditions on the images of an object. Convolution combines the true image of the object with the PSF, producing the observed image by effectively spreading the light from each point source according to the PSF. Based on the above definition, we utilized some routines available in RADMC3D code (Radmc3dpy) and obtained the convolved images of the dust continuum radiation map at 5 and 320 wavelengths.
We only present the convolved image of the radiation maps for the binary system, based on the SND approach.
These wavelengths correspond to typical wavelengths of the MIRI/JWST and ALMA instruments, respectively.
The point spread function (PSF) modeling in MIRI (Dicken et al., 2024) and ALMA is rather complex. Here, in order to simplify our analysis, we approximate the PSF using a Gaussian profile for both instruments.
We use a FWHM of 0.18 arc seconds for the 5-micron MIRI wavelength. For 320 microns and ALMA, we can achieve approximately a FWHM of 0.44 arc seconds for a 150-meter baseline, and 0.13 arc seconds for a 500-meter baseline, respectively.
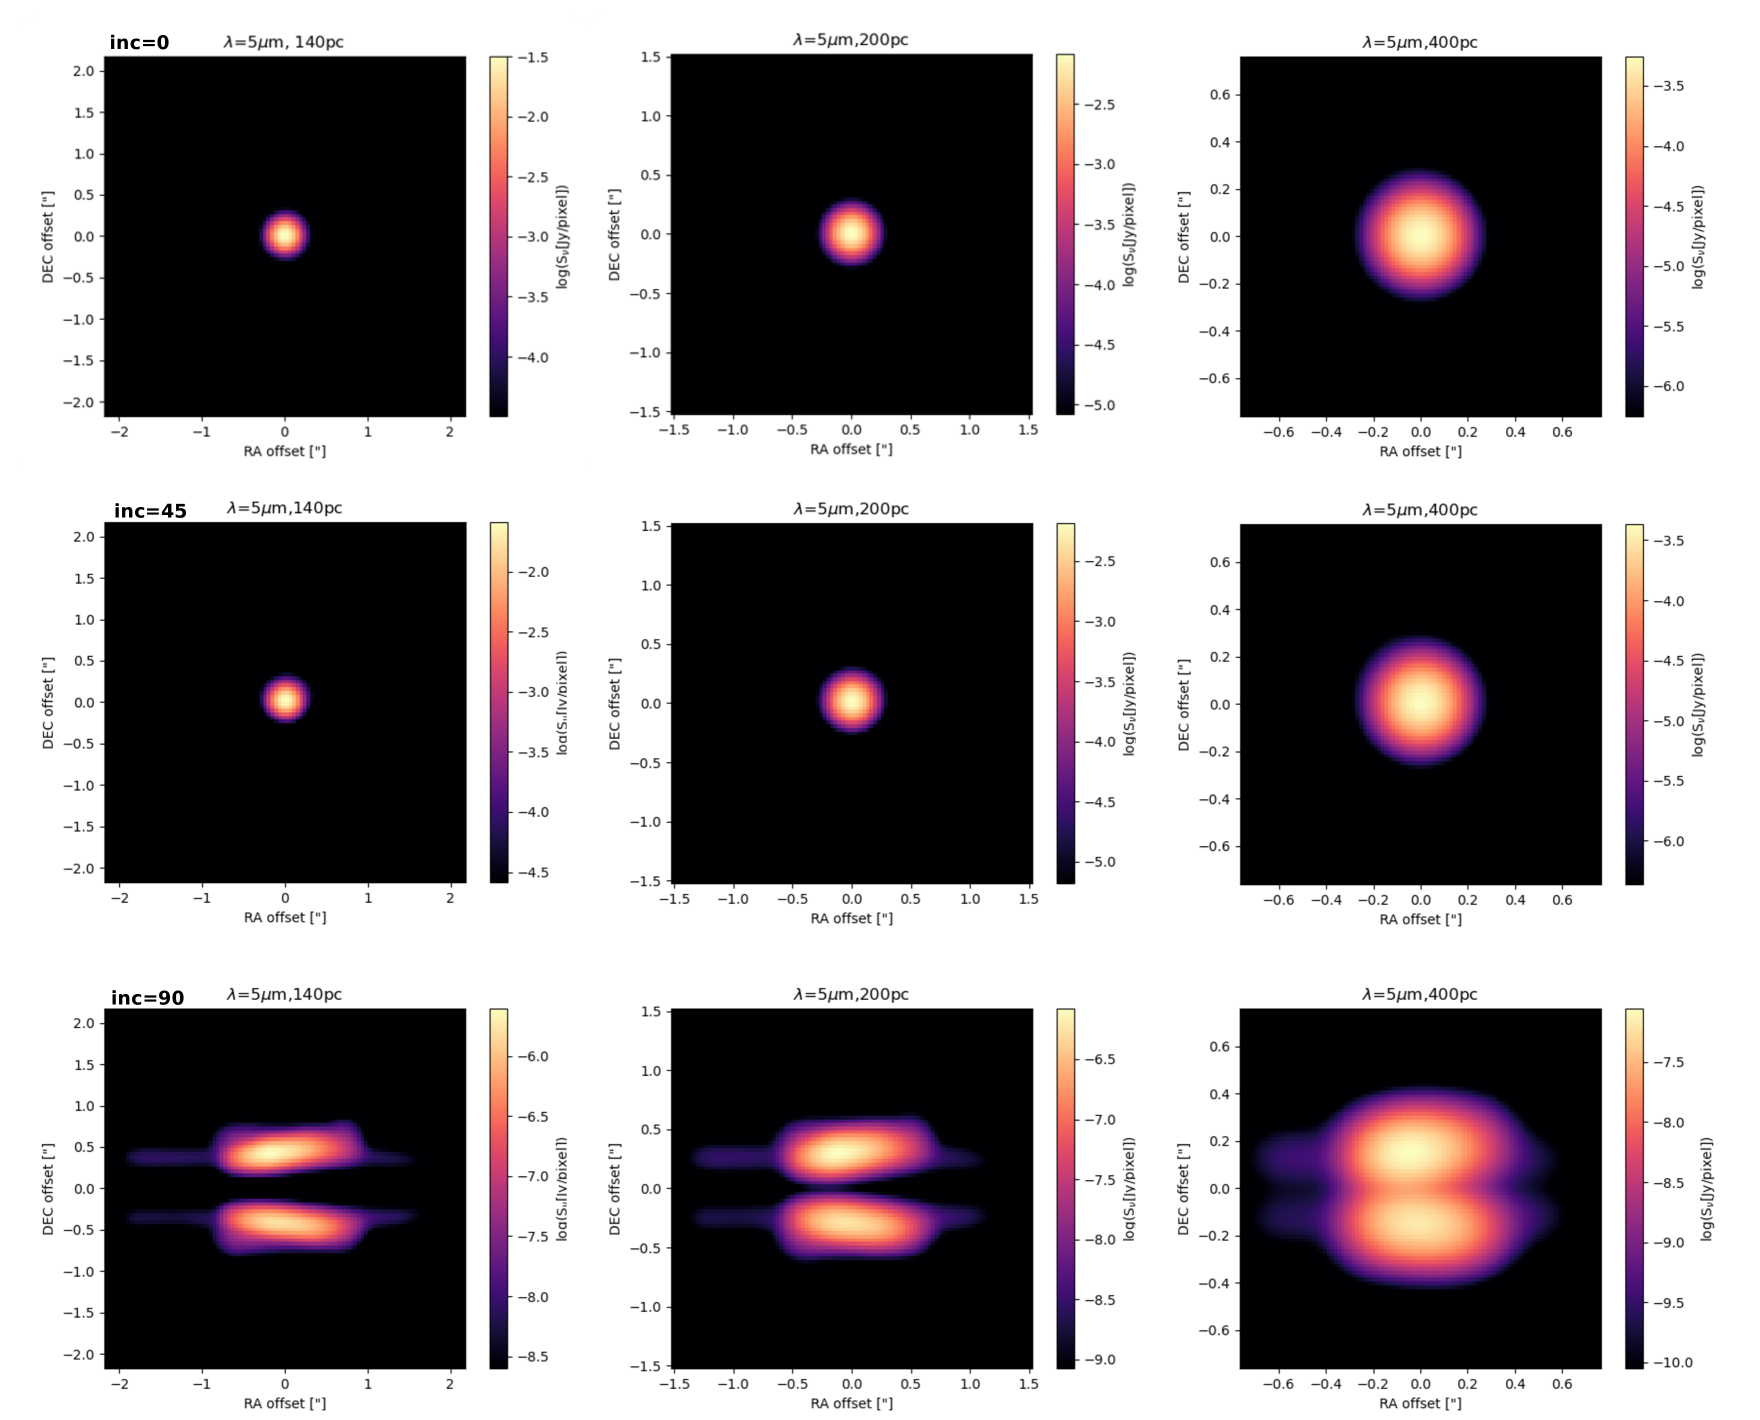
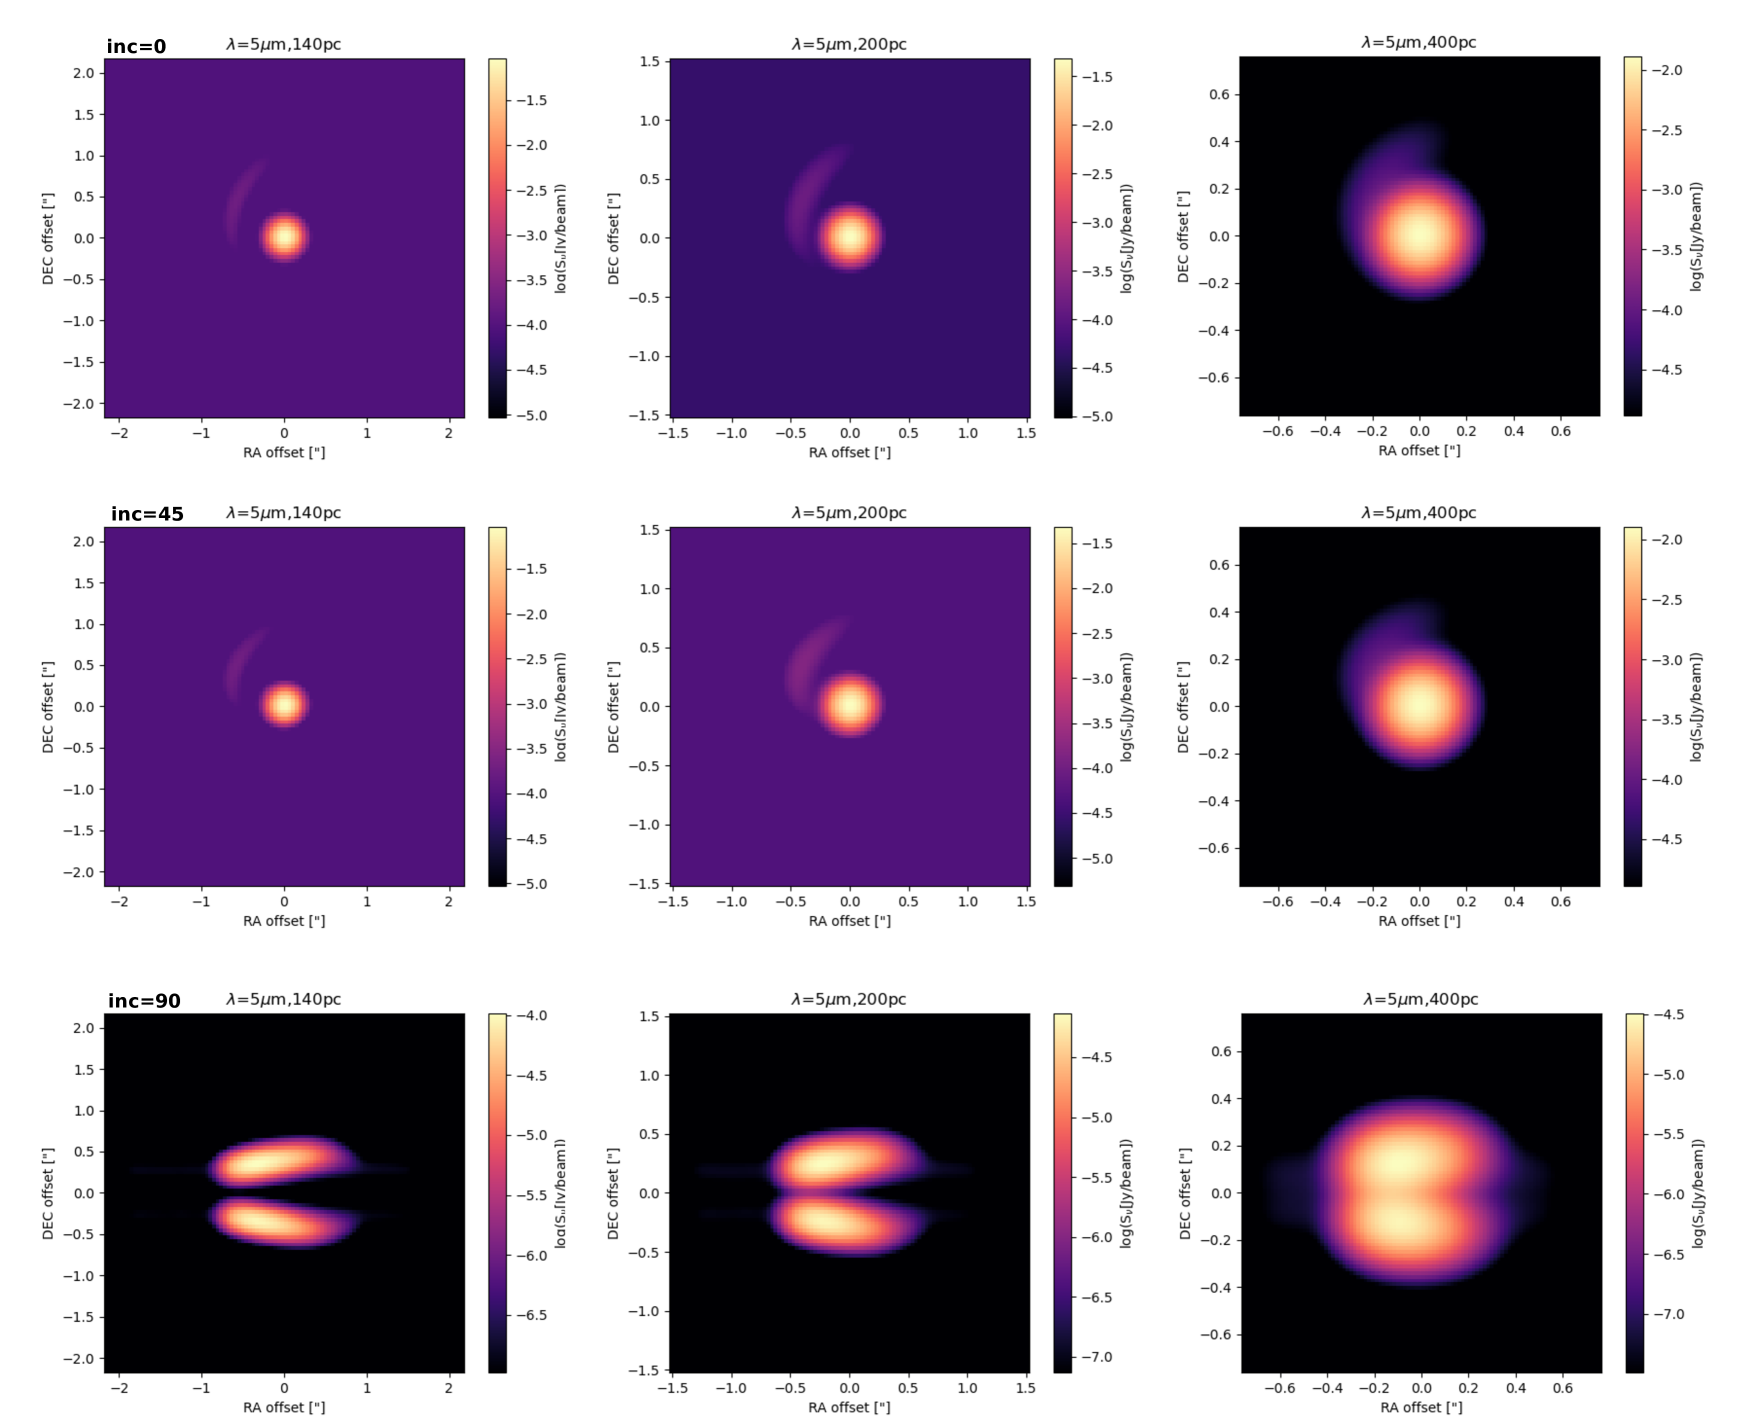
In Figure 15, we display the resulting images after applying convolution by a Point Spread Function (PSF) of the MIRI instrument on the JWST at 5 , at distances of 140, 200, and 400 pc, respectively, and for inclination angles of 0, 45 and 90 degrees to the line of sight.
We observe that at 5 features such as spiral arms are visible. It is important to note that the color bar is normalized to the maximum flux of the disk-jet system at 5 and at a specific distance. At 140 pc, the contrast between the disk and the spiral arms is lower, making the spiral arm feature less distinguishable. However, at 200 pc, the spiral arms become more pronounced and easier to distinguish compared to the closer distance of 140 pc.
We find that with the typical MIRI wavelength, the spiral arms appear as two lobes when the disk is edge-on. On the other hand, for a line of sight below 90 degrees, the spiral arms appear as arc-like structures.
To resolve the spiral arms we may consider longer wavelengths as if we would observe with the ALMA array. The wavelengths covered by ALMA range from 0.3 mm to 3.6 mm. This wavelength range is crucial for studying cold and dusty regions of the universe, which are often invisible in optical and infrared wavelengths. For example, Pérez et al. (2016) used the ALMA Array to observe the protoplanetary disk around the young star Elias 2-27 at a wavelength of 1.3 mm. Their observations reveal two symmetric spiral arms located at a radius of 70 AU within the disk, at a distance of 140 pc.
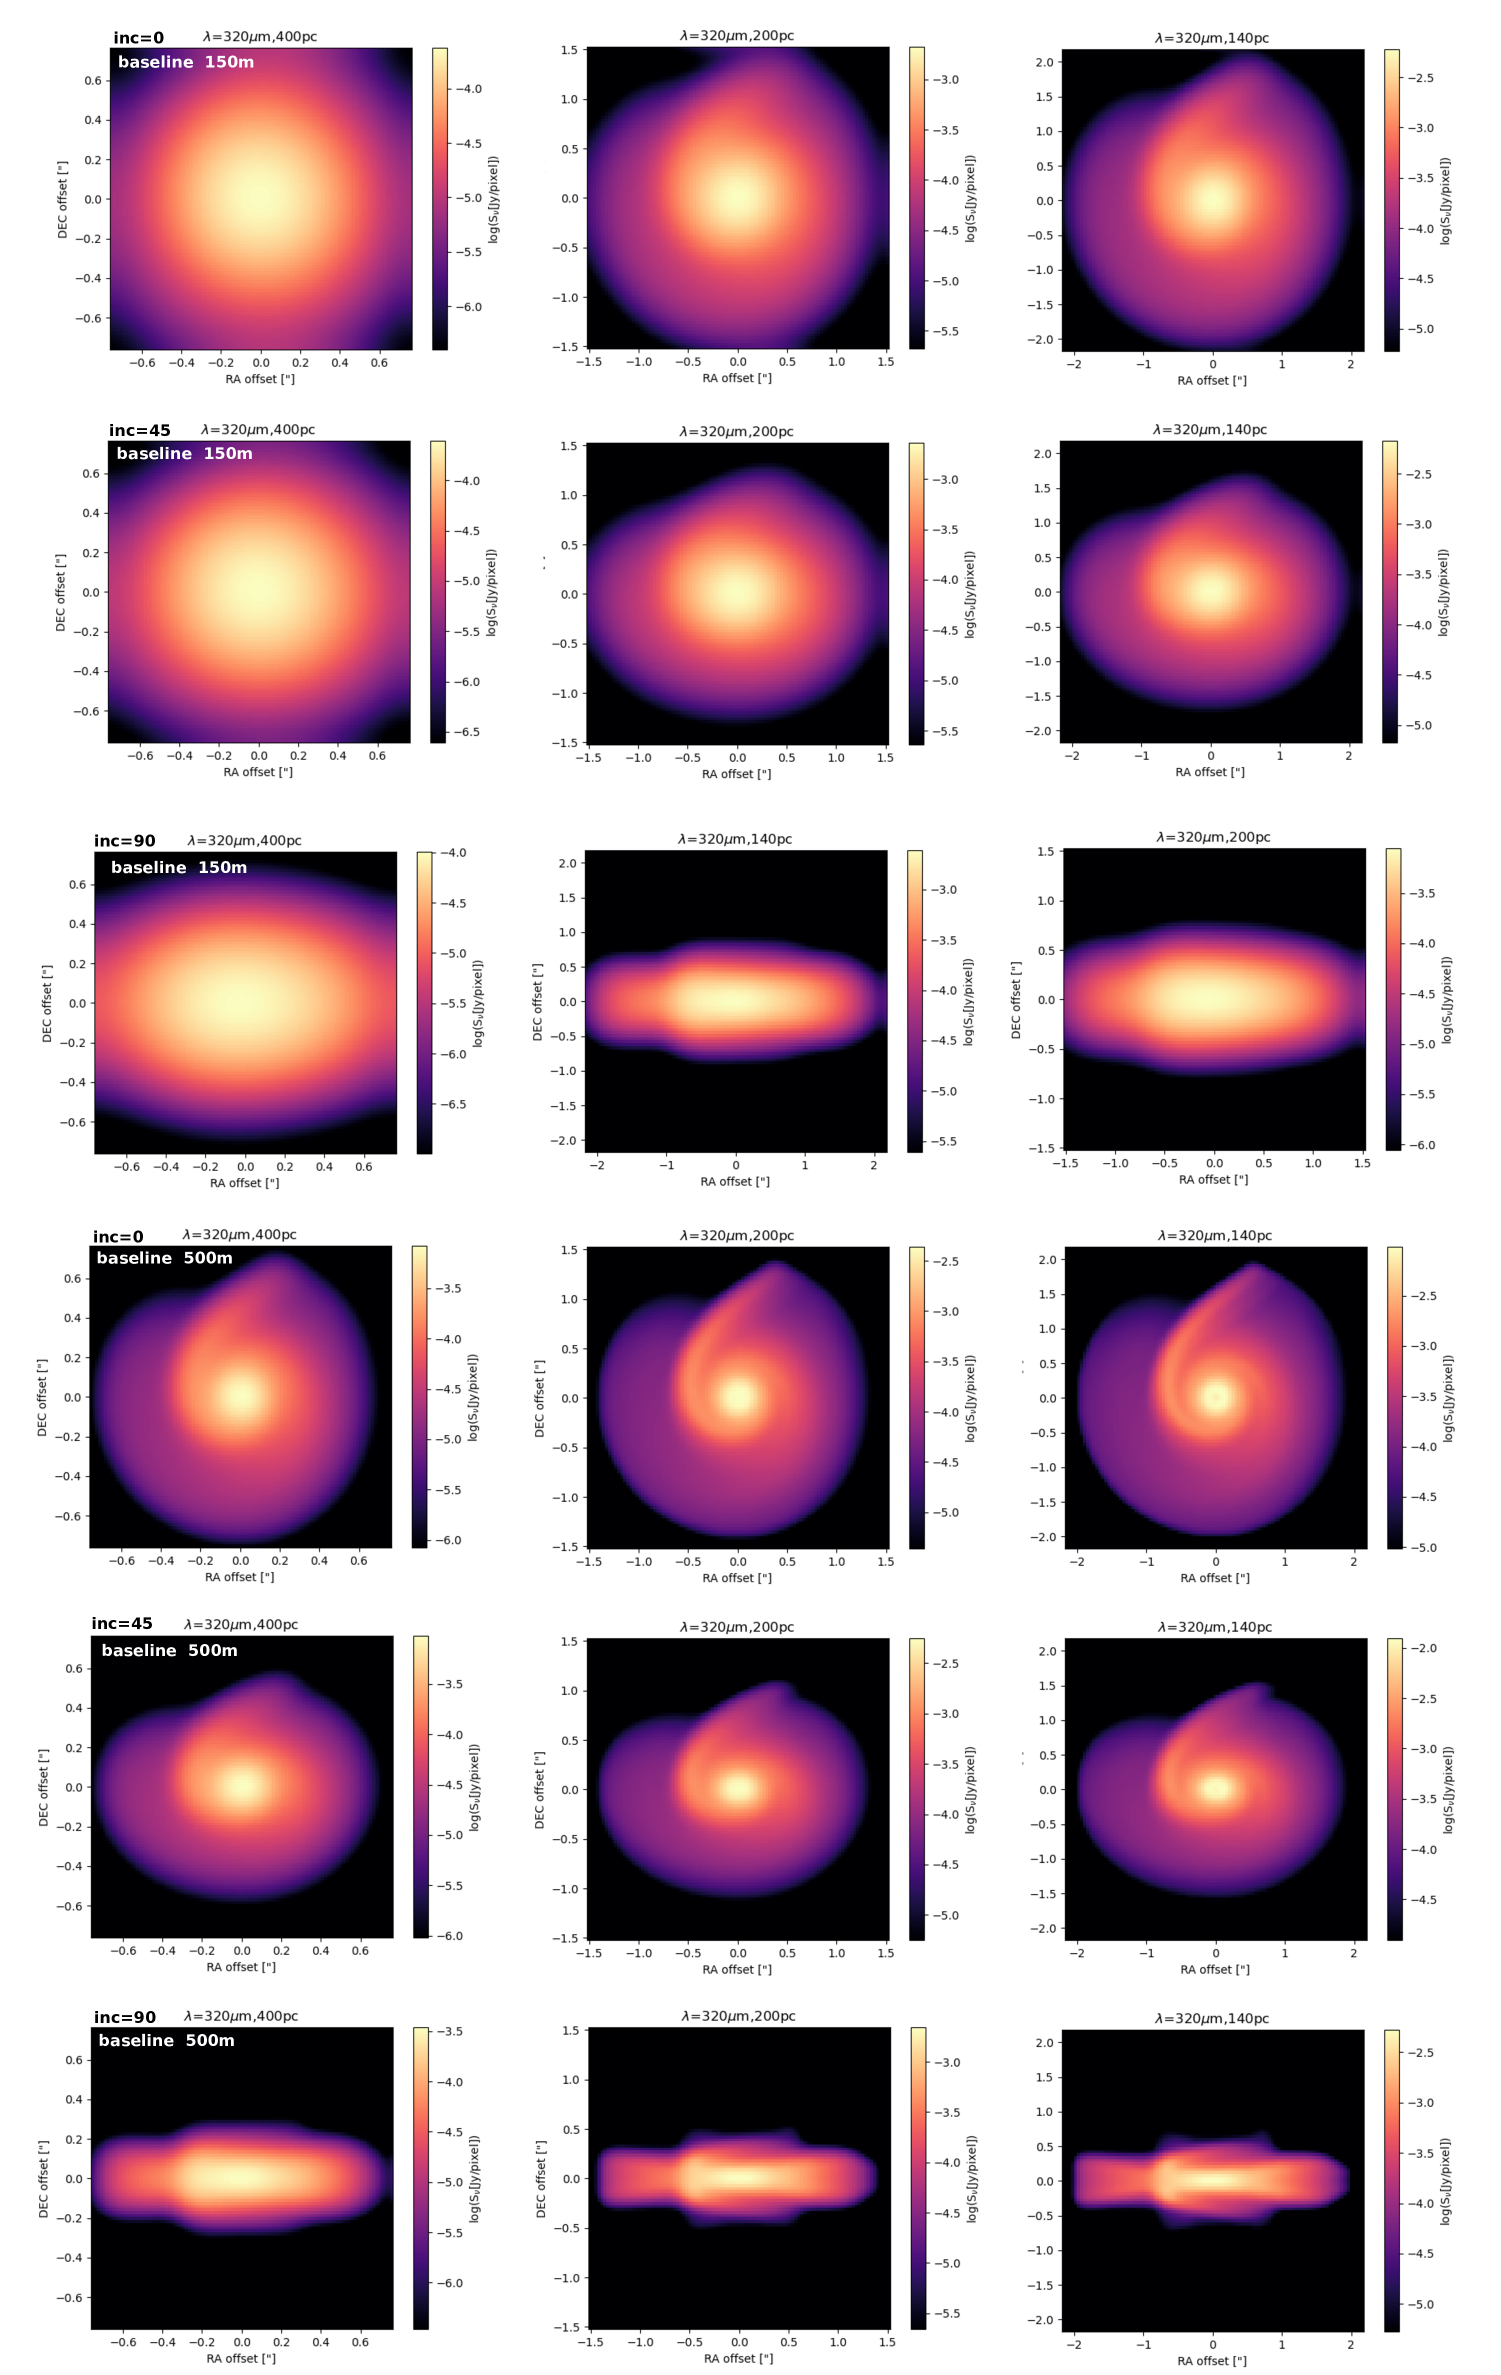
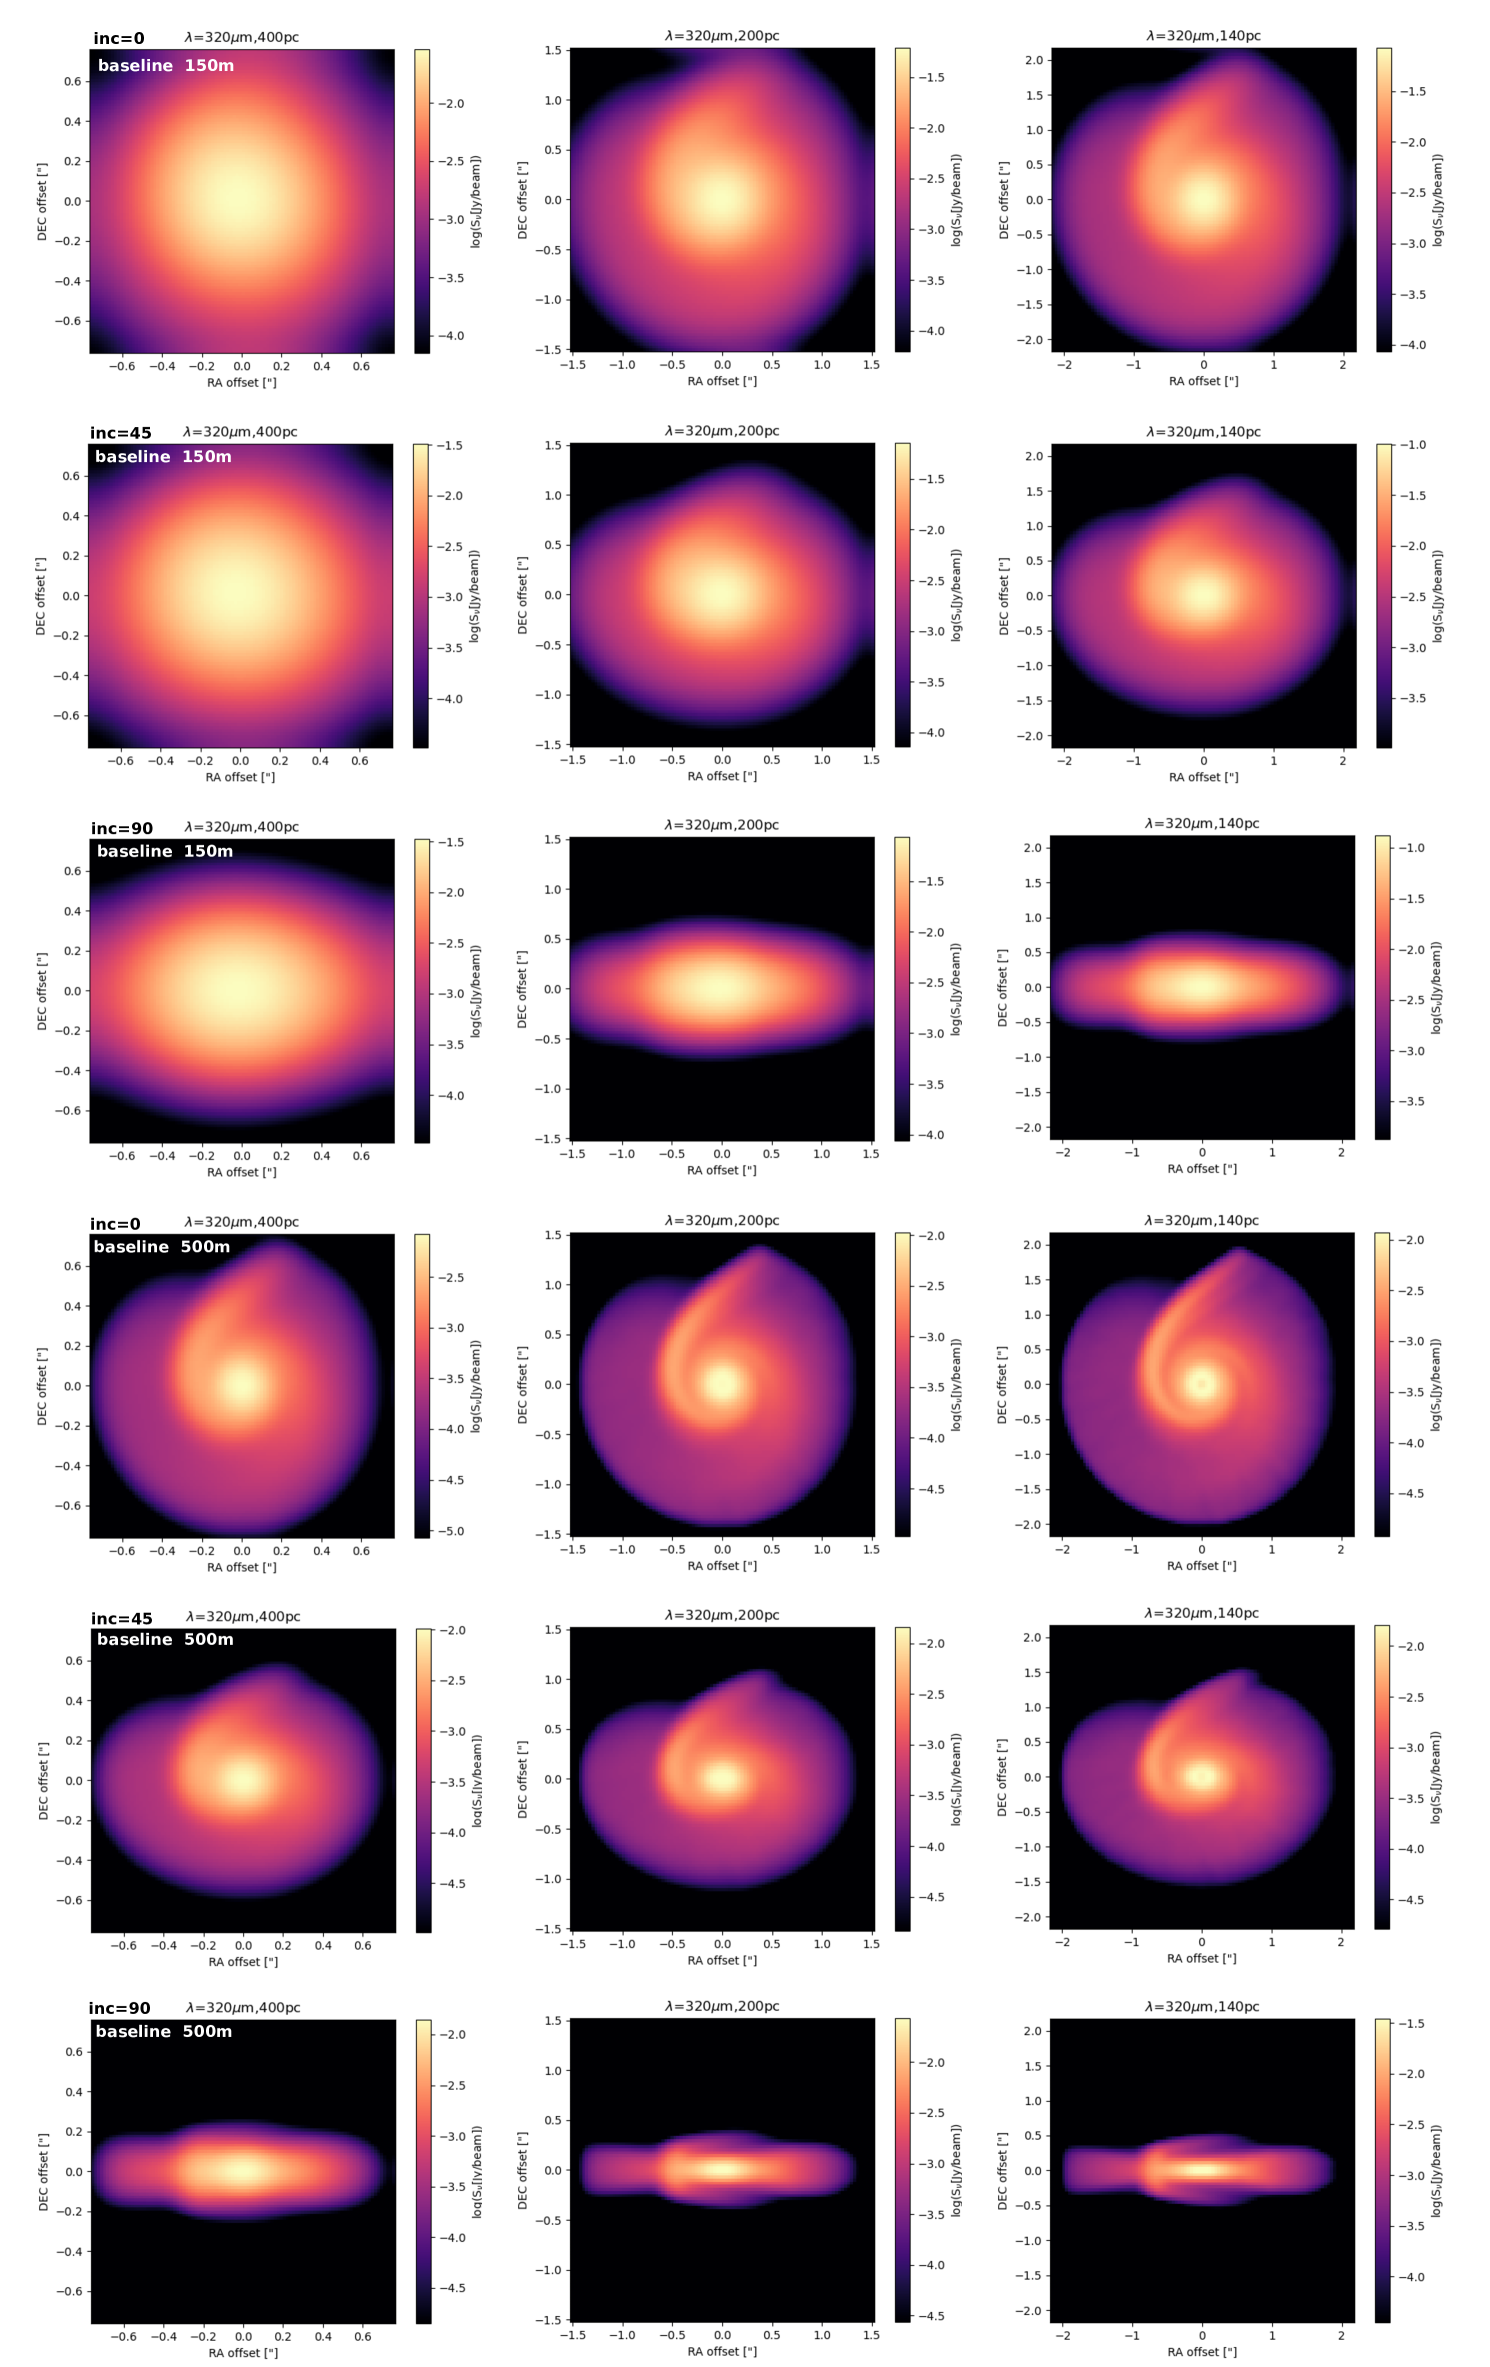
Figure 16 illustrates the resulting images after applying convolution, considering an ALMA PSF at 320 , distances of 140, 200, and 400 pc, respectively, and for inclination angles of 0, 45 and 90 degrees. The convolved images are provided for two different baselines of the ALMA array telescope, 150m, and 500m, respectively.
From Figure 16 we see that when the source distance increases, thus the angular sizes decrease, it becomes more challenging to resolve features with a 150 m baseline. Specifically, at a distance of 400 pc the spiral structure is not visible with the 150 m baseline, but as we observe closer distances, an asymmetric structure begins to emerge clearly. At 140 pc, the substructures are resolved across all inclinations.
With a 500 m baseline, however, the resolution of disk-jet features improves significantly. The image corresponding to the 500 m baseline shows the asymmetric features in the disk and the upper layer of the disk and in the disk wind is much more pronounced.
Increasing the baseline in ALMA is equivalent to increasing the telescope aperture which results in higher resolution and smaller PSF. Therefore, even at 400pc source distance, spiral arms in the accretion disk which are essentially caused by tidal effects seem detectable with ALMA.
For the larger gas density, , as figures 22 and 21 (in the appendix) show, the disc and wind features can be better resolved in the convolved image at 320 m using a 500-meter baseline compared to smaller wavelengths. Furthermore, features such as spiral arms appear brighter at the base of the wind, and the vertical expansion of the opaque disk has increased compared to the model applying lower gas density. At 5 m, no feature is observable unless the disk is edge-on, in which the spirals and some parts of the disk surface could be distingusihed by their different vertical extends.
5.4. Radiation map vs gas density distribution
Here, we discuss the differences we find between the dust continuum radiation map and the more simple picture that we derive from the dynamical simulation, such as gas density, or magnetic field distribution, which cannot actually be observed directly.
Comparing the density distribution, Figure 5, and the radiation map, Figure 14, we find that the gas density map exhibits more small-size features, while the radiation map appears significantly smoother. This difference naturally arises because the gas density is represented in slices, whereas the radiation maps are integrated along the line of sight. So local features or substructure may be averaged out.
For a more reasonable comparison, we provide an integrated gas density along the disk’s scale height in Figure 17, therefore illustrating the disk surface density, . Here, the spiral arms are more pronounced, but the overall density distribution is smoother due to the integration or averaging applied.
If we consider a spiral arm in the density map that is inclined relative to the equatorial plane, then slicing through that arm may reveal only a single, faint feature. In contrast, integrating the radiation along the line of sight captures contributions from all layers, is effectively summing up all the slices. This integration allows us to observe detailed structures in the spiral arm, such as a potential double spiral arm, that may not be visible in the pure density map.
In the radiative transfer simulations, we distribute dust in two distinct ways. First, by placing it uniformly wherever gas exists, using a gas-to-dust ratio of 100 (SDD approach); and second, by placing it only in regions where the gas density is high enough to achieve a specific Stokes number for the dust particles (SND approach).
Applying the first kind of distribution, the dust is present throughout the gas, while in the second, it appears only in denser gas areas. Consequently, the second approach allows the radiation maps to highlight the disk’s gas features with a limited representation of the wind.
The radiation we receive from the overall system corresponds to regions with an optical depth of unity, which varies with wavelength. For example, the radiation between 10 and 30 microns typically originates from the disk’s upper layer, capturing surface features through light scattered by dust particles. In contrast, at longer wavelengths, such as 320 microns, thermal radiation from colder dust emerges, where the disk becomes optically thin, revealing deeper structures.
We note that in this study, we simulate only dust radiation to reflect gas density features. Predictions for gas velocity observations would require gas line radiation, which we defer to our future work.
6. Conclusions
In this paper, we have presented the results of 3D magnetohydrodynamic (MHD) simulations of a resistive, magnetized jet-launching circumstellar disk, which has been applied to both single star and binary star systems. We have employed the PLUTO code version 4.4.2, utilizing a unique combination of 3D MHD launching simulations and 3D radiative transfer to study the tidal effects caused by the companion star on the disk-jet structure.
Our results show that the jets are launched out of the accretion stream and are accelerated magneto-centrifugally.
As a major step forward, from these simulations, we have derived the first 3D radiation map of the dust continuum for such disk-jet structures, utilizing the radiative transfer code ”RADMC-3D”. In principle, this potentially allows us to compare MHD simulation results to observed disk-outflow features. We summarize our main findings as follows:
(i) Our setup, utilizing full 3D spherical coordinates, operates consistently, and can establish
a consistent configuration of the dynamical disk-jet structure.
The jet material is initially launched out of the inner disk while launching gradually extends to larger radii over time.
The simulation domain is sufficiently large to observe the launching of two distinct components;
the faster outflow or jet originating from the inner disk region and the extended disk wind from larger radii.
This confirms the continuous formation of the jet, consistent with our previous 3D studies
(Sheikhnezami & Fendt, 2015, 2018), and earlier axisymmetric simulations in the literature.
(ii) Our results indicate that the implementation of the secondary star via a time-dependent Roche potential leads to clearly visible deviations from axial
symmetry in the disk, which in turn initiates the formation of spiral arms.
This phenomenon is also observed in the jet, albeit with a delayed onset.
The density distribution clearly illustrates the growth and expansion of the spiral arms.
As shown in our previous studies (Sheikhnezami & Fendt, 2018, 2022),
these spiral arms exhibit rotational motion that is synchronized with the orbital motion of the secondary star.
Compared to our previous works, we were now able to consider significantly larger grid scales
within the disk and jet.
Our domain spans approximately 1000 inner disk radii for the single star-disk simulation.
Since the larger disk and thus a more substantial mass reservoir, the run time has been notably extended to about 1600 inner disk revolutions.
The adoption of spherical coordinates has also led to higher computational efficiency.
(iii) By comparing the outflow and accretion mass fluxes obtained from a similar control volume in single and binary star systems, we
find greater perturbations in the time evolution profiles of the mass fluxes in the binary star system.
Additionally, we identify several peaks in these profiles, indicating that both the accretion and outflow mass fluxes are enhanced in a binary system.
In conclusion, our findings confirm that the physical evolution of the ejected material is governed by the evolution
of the material that is accreted.
This finding further supports the discussion in (Sheikhnezami & Fendt, 2022), suggesting that angular momentum removal and tidal effects
influence the disk-jet evolution more efficiently in a binary system.
(iv) We provide dust continuum radiation maps of the disk-jet structure based on the dust density profile obtained from two approaches.
In the SDD approach, we only consider the small dust particles of size 0.1 m which
are well-coupled to the gas and follow the dust-to-gas density ratio of 0.01.
Our findings reveal that spiral arms are visible in all of our un-convolved radiation maps, both in scattered light and thermal radiation,
except for edge-on disks at 20 and 25 wavelengths.
In the 5 and 320 bands, where the disk is optically thin, spiral arms can be
distinguished regardless of disk inclination.
However, at 20 and 25 where the disk becomes optically thick, these features are only distinguishable when the disk inclination is below 90 degrees.
We also detect the signature of spiral arms at the base of the disk wind.
Unlike the disk spiral arms, the outflow is only visible when the disk is viewed edge-on.
(v) In the SND approach, two dust particle sizes are considered and distributed based on their Stokes number.
The spiral arms are visible at 5, 20, and 25 microns, as well as at longer wavelengths.
In this framework, even small dust grains primarily reside in the disk and lower layers of the disk wind, due to their large Stokes number
resulting from the low gas density in the wind.
Thus, the wind becomes observable when small dust is coupled to the gas, while the spiral arms are detectable when the dust has settled.
Consequently, we primarily receive radiation from the lower part of the disk wind, while the majority of the radiation originates from the
disk itself.
Therefore, observing the disk wind is more probable in young disks, where the dust is small and also not settled.
(vi) We have also presented radiation maps for binary system with an increased disk gas density
of at the inner disk radius.
Applying the SDD approach, the disk is not optically thin for wavelengths around m.
Thus, the radiation received by the observer originates from relatively shallower layers of the disk.
The cross and fork shape radiation that is visible in the lower density models arises from
scattered light from the surface layers of the disk. We do not observe a spirals pattern for
the higher-density model.
At wavelengths of and m, the disk with a higher density is more opaque compared to the lower density model.
The dark region seen in the disk has expanded vertically.
However, the disk wind from the surface is more prominent at and m.
At longer wavelengths, e.g. m, the disk and the wind both are visible and bright enough
because of the thermal emission of the disk and the base of the wind.
(vii) When applying the SND approach for the model with larger gas density,
the disk appears opaque at 5, 20, and 25 m, with radiation originating from the upper
layers of the disk and the base of the disk wind.
When increasing the disk gas density, the 0.1 m dust particles now reach higher altitudes
and become more widely distributed throughout the disk wind.
Thus the disk wind becomes more pronounced at these wavelengths.
Therefore, certain features within the wind, which were not visible at lower gas densities, now
become visible.
At longer wavelengths, such as 320 m, both the disk and the base of the disk wind appear
bright, with thermal radiation being received from both.
Furthermore, certain features within the disk, such as spirals, and the disk wind are clearly
visible at 320 micron.
(viii) Applying a convolution that combines the true image of the object with the point spread function of the specific telescope, we were able to
capture more realistic images of the investigated systems.
We only presented the convolved image of the radiation maps for the binary system, based on the SND approach.
We identified two wavelengths that yield well-convolved images with distinguishable features of the disk-jet structure, such as spiral arms.
The first wavelength is 5 , which stays in the observational range of the Mid-Infrared Instrument (MIRI), and the second is 320 ,
which is in the wavelength range of the ALMA array.
Additionally, considering image convolution, we observe that the spiral arms, when the disk is edge-on, should appear as two lobes with MIRI.
If the inclination angle relative to the line of sight is less than 90 degrees, the spiral arms would appear as arc-like structures.
Furthermore, to improve the resolution of the spiral arms, we need to use longer wavelengths and the ALMA array.
Depending on the ALMA baseline, we can achieve a full width at half maximum (FWHM) of approximately 0.44 arcseconds for a 150-meter baseline,
and 0.13 arcseconds for a 500-meter baseline.
This resolution allows us to effectively resolve the spiral arms at all inclination angles relative to the line of sight.
In this paper, we have presented the first radiation maps of MHD jet launching assuming a typical dust distribution in the accretion disk-jet system, potentially observable to present-day infrared instrumentation. Next future steps may include considering a time evolution of the dust distribution; longer, substantially more CPU-expensive simulations of the 3D binary system; and accounting for heating and cooling of the disk.
References
- Bajaj et al. (2024) Bajaj, N. S., Pascucci, I., Gorti, U., Alexander, R., Sellek, A., Morrison, J., Gaspar, A., Clarke, C., Xie, C., Ballabio, G., & Deng, D. 2024, AJ, 167, 127
- Blandford & Payne (1982) Blandford, R. D. & Payne, D. G. 1982, MNRAS, 199, 883
- Booth & Clarke (2021) Booth, R. A. & Clarke, C. J. 2021, Monthly Notices of the Royal Astronomical Society, 502, 1569
- Casse & Keppens (2002) Casse, F. & Keppens, R. 2002, ApJ, 581, 988
- de Valon et al. (2022) de Valon, A., Dougados, C., Cabrit, S., Louvet, F., Zapata, L. A., & Mardones, D. 2022, A&A, 668, A78
- Dicken et al. (2024) Dicken, D., Marín, M. G., Shivaei, I., Guillard, P., Libralato, M., Glasse, A., Gordon, K. D., Cossou, C., Kavanagh, P., Temim, T., Flagey, N., Klaassen, P., Rieke, G. H., Wright, G., Alberts, S., Azzollini, R., Álvarez-Márquez, J., Bouchet, P., Bright, S., Cracraft, M., Coulais, A., Detre, O. H., Engesser, M., Fox, O. D., Gaspar, A., Gastaud, R., Glauser, A. M., Hines, D. C., Kendrew, S., Labiano, A., Lagage, P.-O., Lee, D., Law, D. R., Morrison, J. E., Noriega-Crespo, A., Jones, O., Patapis, P., Scheithauer, S., Sloan, G. C., & Tamas, L. 2024, A&A, 689, A5
- Dorschner et al. (1995) Dorschner, J., Begemann, B., Henning, T., Jaeger, C., & Mutschke, H. 1995, A&A, 300, 503
- Dullemond et al. (2012) Dullemond, C. P., Juhasz, A., Pohl, A., Sereshti, F., Shetty, R., Peters, T., Commercon, B., & Flock, M. 2012, RADMC-3D: A multi-purpose radiative transfer tool, Astrophysics Source Code Library, record ascl:1202.015
- Fang et al. (2023) Fang, M., Wang, L., Herczeg, G. J., Hashimoto, J., Xu, Z., Nemer, A., Pascucci, I., Haffert, S. Y., & Aoyama, Y. 2023, Nature Astronomy, 7, 905
- Fendt (2006) Fendt, C. 2006, ApJ, 651, 272
- Fendt & Čemeljić (2002) Fendt, C. & Čemeljić, M. 2002, A&A, 395, 1045
- Ferreira (1997) Ferreira, J. 1997, A&A, 319, 340
- Ferreira (2003) —. 2003, ArXiv Astrophysics e-prints
- Flock et al. (2011) Flock, M., Dzyurkevich, N., Klahr, H., Turner, N. J., & Henning, T. 2011, ApJ, 735, 122
- Flores-Rivera et al. (2023) Flores-Rivera, L., Flock, M., Kurtovic, N. T., Husemann, B., Banzatti, A., Ringqvist, S. C., Kamann, S., Müller, A., Fendt, C., García Lopez, R., Marleau, G.-D., Henning, T., Carrasco-González, C., van Boekel, R., Keppler, M., Launhardt, R., & Aoyama, Y. 2023, A&A, 670, A126
- Frank et al. (1999) Frank, A., Gardiner, T. A., Delemarter, G., Lery, T., & Betti, R. 1999, ApJ, 524, 947
- Gueth & Guilloteau (1999) Gueth, F. & Guilloteau, S. 1999, A&A, 343, 571
- Heese et al. (2017) Heese, S., Wolf, S., Dutrey, A., & Guilloteau, S. 2017, A&A, 604, A5
- Jaeger et al. (1994) Jaeger, C., Mutschke, H., Begemann, B., Dorschner, J., & Henning, T. 1994, A&A, 292, 641
- Krasnopolsky et al. (1999) Krasnopolsky, R., Li, Z., & Blandford, R. 1999, ApJ, 526, 631
- Kudoh et al. (1998) Kudoh, T., Matsumoto, R., & Shibata, K. 1998, ApJ, 508, 186
- Labdon et al. (2023) Labdon, A., Kraus, S., Davies, C. L., Kreplin, A., Zarrilli, S., Monnier, J. D., Le Bouquin, J.-B., Anugu, N., Setterholm, B., Gardner, T., Ennis, J., Lanthermann, C., ten Brummelaar, T., Schaefer, G., & Harries, T. J. 2023, A&A, 678, A6
- Larwood et al. (1996) Larwood, J. D., Nelson, R. P., Papaloizou, J. C. B., & Terquem, C. 1996, MNRAS, 282, 597
- Lee et al. (2001) Lee, C.-F., Stone, J. M., Ostriker, E. C., & Mundy, L. G. 2001, ApJ, 557, 429
- Li (1995) Li, Z. 1995, ApJ, 444, 848
- Long et al. (2008) Long, M., Romanova, M. M., & Lovelace, R. V. E. 2008, MNRAS, 386, 1274
- Mignone et al. (2007) Mignone, A., Bodo, G., Massaglia, S., Matsakos, T., Tesileanu, O., Zanni, C., & Ferrari, A. 2007, ApJS, 170, 228
- Mignone et al. (2012) Mignone, A., Zanni, C., Tzeferacos, P., van Straalen, B., Colella, P., & Bodo, G. 2012, ApJS, 198, 7
- Murphy et al. (2010) Murphy, G. C., Ferreira, J., & Zanni, C. 2010, A&A, 512, A82+
- Nazari et al. (2024) Nazari, P., Tabone, B., Ahmadi, A., Cabrit, S., van Dishoeck, E. F., Codella, C., Ferreira, J., Podio, L., Tychoniec, Ł., & van Gelder, M. L. 2024, A&A, 686, A201
- Ouyed et al. (2003) Ouyed, R., Clarke, D. A., & Pudritz, R. E. 2003, ApJ, 582, 292
- Ouyed & Pudritz (1997) Ouyed, R. & Pudritz, R. E. 1997, ApJ, 482, 712
- Pascucci et al. (2023) Pascucci, I., Cabrit, S., Edwards, S., Gorti, U., Gressel, O., & Suzuki, T. K. 2023, in Astronomical Society of the Pacific Conference Series, Vol. 534, Protostars and Planets VII, ed. S. Inutsuka, Y. Aikawa, T. Muto, K. Tomida, & M. Tamura, 567
- Pérez et al. (2016) Pérez, L. M., Carpenter, J. M., Andrews, S. M., Ricci, L., Isella, A., Linz, H., Sargent, A. I., Wilner, D. J., Henning, T., Deller, A. T., Chandler, C. J., Dullemond, C. P., Lazio, J., Menten, K. M., Corder, S. A., Storm, S., Testi, L., Tazzari, M., Kwon, W., Calvet, N., Greaves, J. S., Harris, R. J., & Mundy, L. G. 2016, Science, 353, 1519
- Pesenti et al. (2003) Pesenti, N., Dougados, C., Cabrit, S., O’Brien, D., Garcia, P., & Ferreira, J. 2003, A&A, 410, 155
- Porth & Fendt (2010) Porth, O. & Fendt, C. 2010, ApJ, 709, 1100
- Pudritz & Norman (1983) Pudritz, R. E. & Norman, C. A. 1983, ApJ, 274, 677
- Pudritz et al. (2007) Pudritz, R. E., Ouyed, R., Fendt, C., & Brandenburg, A. 2007, Protostars and Planets V, 277
- Rabenanahary et al. (2022) Rabenanahary, M., Cabrit, S., Meliani, Z., & des Forêts, G. P. 2022, Astronomy & Astrophysics
- Rodenkirch & Dullemond (2022) Rodenkirch, P. J. & Dullemond, C. P. 2022, A&A, 659, A42
- Romanova et al. (2013) Romanova, M. M., Ustyugova, G. V., Koldoba, A. V., & Lovelace, R. V. E. 2013, MNRAS, 430, 699
- Shakura & Sunyaev (1973) Shakura, N. I. & Sunyaev, R. A. 1973, A&A, 24, 337
- Sheikhnezami & Fendt (2015) Sheikhnezami, S. & Fendt, C. 2015, ApJ, 814, 113
- Sheikhnezami & Fendt (2018) —. 2018, ApJ, 861, 11
- Sheikhnezami & Fendt (2022) —. 2022, ApJ, 925, 161
- Sheikhnezami et al. (2012) Sheikhnezami, S., Fendt, C., Porth, O., Vaidya, B., & Ghanbari, J. 2012, ApJ, 757, 65
- Sheikhnezami & Sepahvand (2024) Sheikhnezami, S. & Sepahvand, M. 2024, ApJ, 966, 82
- Shibata & Uchida (1985) Shibata, K. & Uchida, Y. 1985, PASJ, 37, 31
- Solf & Boehm (1993) Solf, J. & Boehm, K. H. 1993, ApJ, 410, L31
- Somigliana et al. (2023) Somigliana, A., Testi, L., Rosotti, G., Toci, C., Lodato, G., Tabone, B., Manara, C. F., & Tazzari, M. 2023, ApJ, 954, L13
- Stepanovs & Fendt (2014) Stepanovs, D. & Fendt, C. 2014, ApJ, 793, 31
- Stone et al. (1996) Stone, J. M., Hawley, J. F., Gammie, C. F., & Balbus, S. A. 1996, ApJ, 463, 656
- Tabone et al. (2022) Tabone, B., Rosotti, G. P., Lodato, G., Armitage, P. J., Cridland, A. J., & van Dishoeck, E. F. 2022, MNRAS, 512, L74
- Tambovtseva & Grinin (2008) Tambovtseva, L. V. & Grinin, V. P. 2008, Astronomy Letters, 34, 231
- Tzeferacos et al. (2013) Tzeferacos, P., Ferrari, A., Mignone, A., Zanni, C., Bodo, G., & Massaglia, S. 2013, MNRAS, 428, 3151
- Uchida & Shibata (1985a) Uchida, Y. & Shibata, K. 1985a, PASJ, 37, 515
- Uchida & Shibata (1985b) —. 1985b, PASJ, 37, 515
- Ustyugova et al. (1995) Ustyugova, G. V., Koldoba, A. V., Romanova, M. M., Chechetkin, V. M., & Lovelace, R. V. E. 1995, ApJ, 439, L39
- Vaidya et al. (2011) Vaidya, B., Fendt, C., Beuther, H., & Porth, O. 2011, ApJ, 742, 56
- Valegård et al. (2022) Valegård, P. G., Ginski, C., Dominik, C., Bae, J., Benisty, M., Birnstiel, T., Facchini, S., Garufi, A., Hogerheijde, M., van Holstein, R. G., Langlois, M., Manara, C. F., Pinilla, P., Rab, C., Ribas, Á., Waters, L. B. F. M., & Williams, J. 2022, A&A, 668, A25
- Wardle & Königl (1993) Wardle, M. & Königl, A. 1993, ApJ, 410, 218
- Whelan et al. (2021) Whelan, E. T., Pascucci, I., Gorti, U., Edwards, S., Alexander, R. D., Sterzik, M. F., & Melo, C. 2021, ApJ, 913, 43
- Zanni et al. (2007) Zanni, C., Ferrari, A., Rosner, R., Bodo, G., & Massaglia, S. 2007, A&A, 469, 811