The Structure and Formation Histories of Low-Mass Quiescent Galaxies in the Abell 2744 Cluster Environment
Abstract
Low-mass quiescent galaxies are thought to predominantly reside in overdense regions, as environmental effects are often invoked to explain their shutdown of star formation. These longer-timescale quenching mechanisms - such as interactions with hot gas in the intracluster medium and dynamical encounters with other cluster galaxies - leave imprints on galaxy morphologies, emphasizing the importance of quantifying the structures of low-mass quiescent galaxies in galaxy clusters at . Using spectrophotometric data from the UNCOVER and MegaScience programs, we present the first measurement of the quiescent size-mass relation between using JWST imaging, based on a sample of 1100 galaxies in the Abell 2744 galaxy cluster. The resulting size-mass relation is systematically larger and flatter than samples of dwarf galaxies in less-rich environments (low-mass clusters and groups), and has a higher scatter than similar-redshift field samples. Both “progenitor bias,” where larger, diskier low-mass galaxies enter the cluster at later epochs, and a general expansion of galaxy structure from dynamical interactions could be at play. This evolutionary framework is further supported by the tentative evidence that older low-mass quiescent galaxies in the cluster are more spheroidal. The star-formation histories derived for our cluster sample imply their formation and quenching occurs relatively late, at . In this scenario, the progenitor population would have disky/prolate axis-ratio distributions at cosmic noon, in agreement with recent observations. While this leaves ample time for dynamical interactions to maintain quiescence and drive the observed subsequent morphological evolution post-quenching, the data disfavors an onset of quenching due to the environment.
1 Introduction
Understanding the physical mechanisms driving galaxy quenching is a primary area of research in the field of galaxy evolution. Over the past several decades, empirical studies have established many mechanisms that may be responsible for quenching massive galaxies: active galactic nuclei feedback (e.g., Croton et al., 2006; Choi et al., 2018), bulge formation and other morphological changes (Martig et al., 2009), shock heating of circumgalactic gas (e.g., Dekel & Birnboim, 2006; Dekel et al., 2019), and/or cosmological starvation (Feldmann & Mayer, 2015; Feldmann et al., 2016). However, these processes are all strongly mass dependent and dominate at high masses (“mass quenching,” Baldry et al., 2006; Peng et al., 2010b; Kawinwanichakij et al., 2017), and thus cannot explain the existence of the increasing numbers of low-mass quiescent galaxies discovered with the James Webb Space Telescope (JWST, e.g., Gelli et al., 2023; Marchesini et al., 2023; Cutler et al., 2024; Hamadouche et al., 2024).
The commonly invoked explanation has long been that low-mass galaxies are quenched by environmental effects (Boselli & Gavazzi, 2006), including interactions with other galaxies (e.g., dynamical stirring/harassment) or with the intracluster medium (ICM, e.g., ram pressure stripping or starvation, Gunn & Gott, 1972). In particular, since short-timescale interactions with the intracluster medium (ram-pressure stripping) should not result in significant structural changes, recent morphological studies that find a flatter slope of the quiescent size-mass relation at low stellar masses (relative to the massive end, e.g., Dutton et al., 2011; Mosleh et al., 2013; Lange et al., 2015; Whitaker et al., 2017; Nedkova et al., 2021; Cutler et al., 2022, 2024; Yoon et al., 2023; Hamadouche et al., 2024) are interpreted as direct empirical evidence supporting this paradigm. These studies cover a wide range of redshifts, masses, and environments, suggesting this flatter slope, similar to that of the star-forming size-mass relation, is a physical feature of the quiescent galaxy population and not driven by systematics. Similarly, low-mass quiescent galaxies at cosmic noon have also been observed with disk-like structures and lower Sérsic indices (e.g., Cutler et al., 2024; Hamadouche et al., 2024) with remarkably young (light-weighted) stellar populations overall at cosmic noon (Cutler et al., 2024).
If the onset of environmental quenching occurs at cosmic noon (e.g., Ji et al., 2018; Cutler et al., 2024), these low-mass galaxies should have significantly different morphologies by due to the effects of residing in overdense environments. Indeed, studies that examine the size and structure of local dwarf satellites () find they are predominantly spheroidal (based on axis-ratio distributions) with a steeper size-mass relation (Eigenthaler et al., 2018). However, other studies of dense environments at find the quiescent size-mass relation shows similar morphological properties to cosmic noon samples (Yoon et al., 2023). Several other studies of quiescent galaxy size-mass relations in cluster environments are similarly limited to the most massive end (e.g. Kuchner et al., 2017; Afanasiev et al., 2023; Yang et al., 2024).
Studies of low-mass quiescent galaxies at to date are heterogeneous in nature owing to various observational limitations. In general, surface brightness sensitivity has limited measurements of the size-mass relation in clusters to , while studies of dwarf galaxies at are very nearby and utilize specialized, low-surface-brightness searches. Nedkova et al. (2021) use deep Hubble Space Telscope (HST) data from the Hubble Frontier Fields (HFF, Lotz et al., 2017) to measure galaxy sizes down to , but this sample is not specific to cluster galaxies as it also includes CANDELS (Grogin et al., 2011; Koekemoer et al., 2011) field galaxies and sources at lower redshifts than the clusters. As such, size-mass studies specific to overdense environments only sparsely cover masses between (see, e.g., Fig. 8 in Eigenthaler et al., 2018), though the advent of JWST imaging has recently opened this parameter space. This is a critical stellar mass range thought to contain the low-mass peak of the quiescent stellar mass function at (e.g., Ilbert et al., 2013; Santini et al., 2022; Weaver et al., 2023; Hamadouche et al., 2024), below which quiescent galaxies potentially become more rare.
The star-formation histories (SFHs) of low-mass, low-redshift cluster galaxies offer crucial insights as to whether or not the now observationally-accessible low-mass quiescent population at the peak epoch of star formation (e.g., Cutler et al., 2024) are direct progenitors. In particular, non-parametric SFHs (e.g., Leja et al., 2019) can recover the potentially bursty SFHs many low-mass galaxies are theorized to have (e.g., Tacchella et al. 2016; Anglés-Alcázar et al. 2017; Faucher-Giguère 2018; Ma et al. 2018; Looser et al. 2023, 2024; Sun et al. 2023; Cenci et al. 2024; Dome et al. 2024; Gelli et al. 2025; Trussler et al. 2025; G. Khullar et al. in prep.; A. Mintz et al. in prep.), resulting in more accurate median stellar ages and formation redshifts. SFHs are most often inferred from detailed spectral energy distribution (SED) fitting. However, stellar population modeling from broadband photometry alone is unable to constrain bursts of star formation on 100 Myr to 1 Gyr timescales (e.g., Suess et al. 2022; Wang et al. 2024; G. Khullar et al. in prep.), meaning that accurate measurements of a galaxy’s SFH requires a significant amount of high-spectral-resolution panchromatic data (i.e., medium bands and/or spectroscopy).
In this paper, we perform a comprehensive analysis of the size, structure, and formation histories of low-mass quiescent galaxies in the cluster environment, and compare to recent observations of cosmic noon overdensities to investigate the formation and evolution of low-mass quiescent galaxies across Gyr. Specifically, we leverage the extensive spectrophotometric suite of JWST data associated with the Ultradeep NIRSpec and NIRCam ObserVations before the Epoch of Reionization (UNCOVER) Cycle 1 Treasury program (Bezanson et al., 2024; Weaver et al., 2024). UNCOVER observations cover the Abell 2744 lensing cluster, making it an ideal survey to study low-mass quiescent galaxies in rich overdensities. Aside from having extremely deep NIRCam broadband photometry, UNCOVER also has NIRSpec prism spectroscopy (Price et al., 2024) and associated NIRCam medium band photometry from the Medium Bands, Mega Science Survey (hereafter MegaScience, Suess et al., 2024). Medium bands are crucial in both constraining the shape of the galaxy’s SED and providing additional short-wavelength coverage, while the prism spectroscopy places strong constraints on the inferred parameters from SED modeling via joint spectrophotometric fitting (e.g., Johnson et al., 2021; Akhshik et al., 2023).
We structure this paper as follows. The UNCOVER and MegaScience data and cataloging, as well as our sample selections, are detailed in Section 2. Our morphological fitting methods and stellar population modeling are described in Section 3. In Section 4, we show our Abell 2744 quiescent size-mass relation and the results of our spectrophotmetric SED fitting. Using these results, we contextualize our sample in the overall growth and evolution of low-mass quiescent galaxies since cosmic noon in Section 5. The study is summarized in Section 6. Magnitudes are in the AB system. We assume a Chabrier (2003) initial mass function and a WMAP9 cosmology (Hinshaw et al., 2013): , , and .
2 Data and Sample Selection
2.1 Imaging and Catalogs
This study utilizes observations of the Abell 2744 cluster from the UNCOVER survey (Bezanson et al., 2024; Weaver et al., 2024) with the extended photometric coverage of the Medium Bands, Mega Science Survey (Suess et al., 2024). The resulting dataset contains photometry from JWST/NIRCam in the F070W, F090W, F115W, F150W, F200W, F277W, F356W, and F444W broadband filters, as well as the F140M, F162M, F182M, F210M, F250M, F300M, F335M, F360M, F410M, F430M, F460M, and F480M medium-band filters. We also include archival HST data from the HFF (Lotz et al., 2017) and BUFFALO (Steinhardt et al., 2020) surveys in the ACS F435W, F606W, and F814W and WFC3 F105W, F125W, F140W, and F160W broadband filters. The data presented in this article were obtained from the Mikulski Archive for Space Telescopes (MAST) at the Space Telescope Science Institute. UNCOVER and MegaScience imaging is from the Grili-reduced v7111https://dawn-cph.github.io/dja/imaging/v7/ mosaics (Brammer, 2023) and rescaled to a 40 mas pixel scale in all filters. The specific observations analyzed for UNCOVER and MegaScience can be accessed at https://doi.org/10.17909/16ez-hg64 (catalog DOI: 10.17909/16ez-hg64) and https://doi.org/10.17909/8k5c-xr27 (catalog DOI: 10.17909/8k5c-xr27).
At the redshift of the Abell 2744 galaxy cluster (), the JWST filters sample rest-frame . Thus, galaxies that are red in the rest-optical within Abell 2744 appear relatively blue in our filter set. In order to ensure an effective detection of all cluster galaxies, we build our own short-wavelength (SW) detected catalogs using the Aperpy222https://github.com/astrowhit/aperpy aperture photometry code. All Aperpy settings are identical to Weaver et al. (2024), except the detection image, for which we use a F070W-F090W-F115W selection function (at pixel-1) and detect on imaging with added median filtering. In order to avoid a changing selection function across the image, we only consider pixels where all three filters have data. This SW detection better selects galaxies at the cluster redshift (), while the median filtering assists with the detection of faint sources in areas that still have significant intracluster light (ICL) or residuals after the model-subtraction of bright cluster galaxies (bCGs; see Z. Webb et al. in prep). Using this SW detection, we find 165 (8.4%) additional sources over the fiducial UNCOVER/MegaScience F277W-F356W-F444W detection from Weaver et al. (2024). Photometric measurements, however, are made on F444W PSF-matched imaging with the bCGs, ICL, and sky background subtracted (see Weaver et al., 2024).
Initial redshifts and stellar population parameters for the SW detected catalog are determined with EAY (Brammer et al., 2008) using two templates: the default fsps_full and the sfhz_blue_agn set. sfhz_blue_agn includes additional redshift-dependent priors on galaxy age and SFH, empirical spectra from a , emission-line galaxy (Carnall et al., 2023), and an AGN torus template (Killi et al., 2023). The optional magnitude and -slope (i.e., UV slope) priors are disabled in the fits. The typical photometric redshift uncertainty at is . This uncertainty is irrespective of galaxy selection, but only considers galaxies brighter than 26 ABmag in F200W (the minimum brightness for our sample selection, see Section 2.2).
A subset of UNCOVER sources have JWST/NIRSpec PRISM spectroscopic follow-up observations. We cross-match all sources with a redshift quality flag from the UNCOVER DR4 spectroscopic catalog (see Price et al., 2024) to our SW-selected catalog within a radius threshold in order to determine which sources in our catalog have associated spectroscopic measurements. The publicly-released DR4 PRISM spectra are used in our spectrophotometric modeling (see Section 3.2).
2.2 Sample Selection
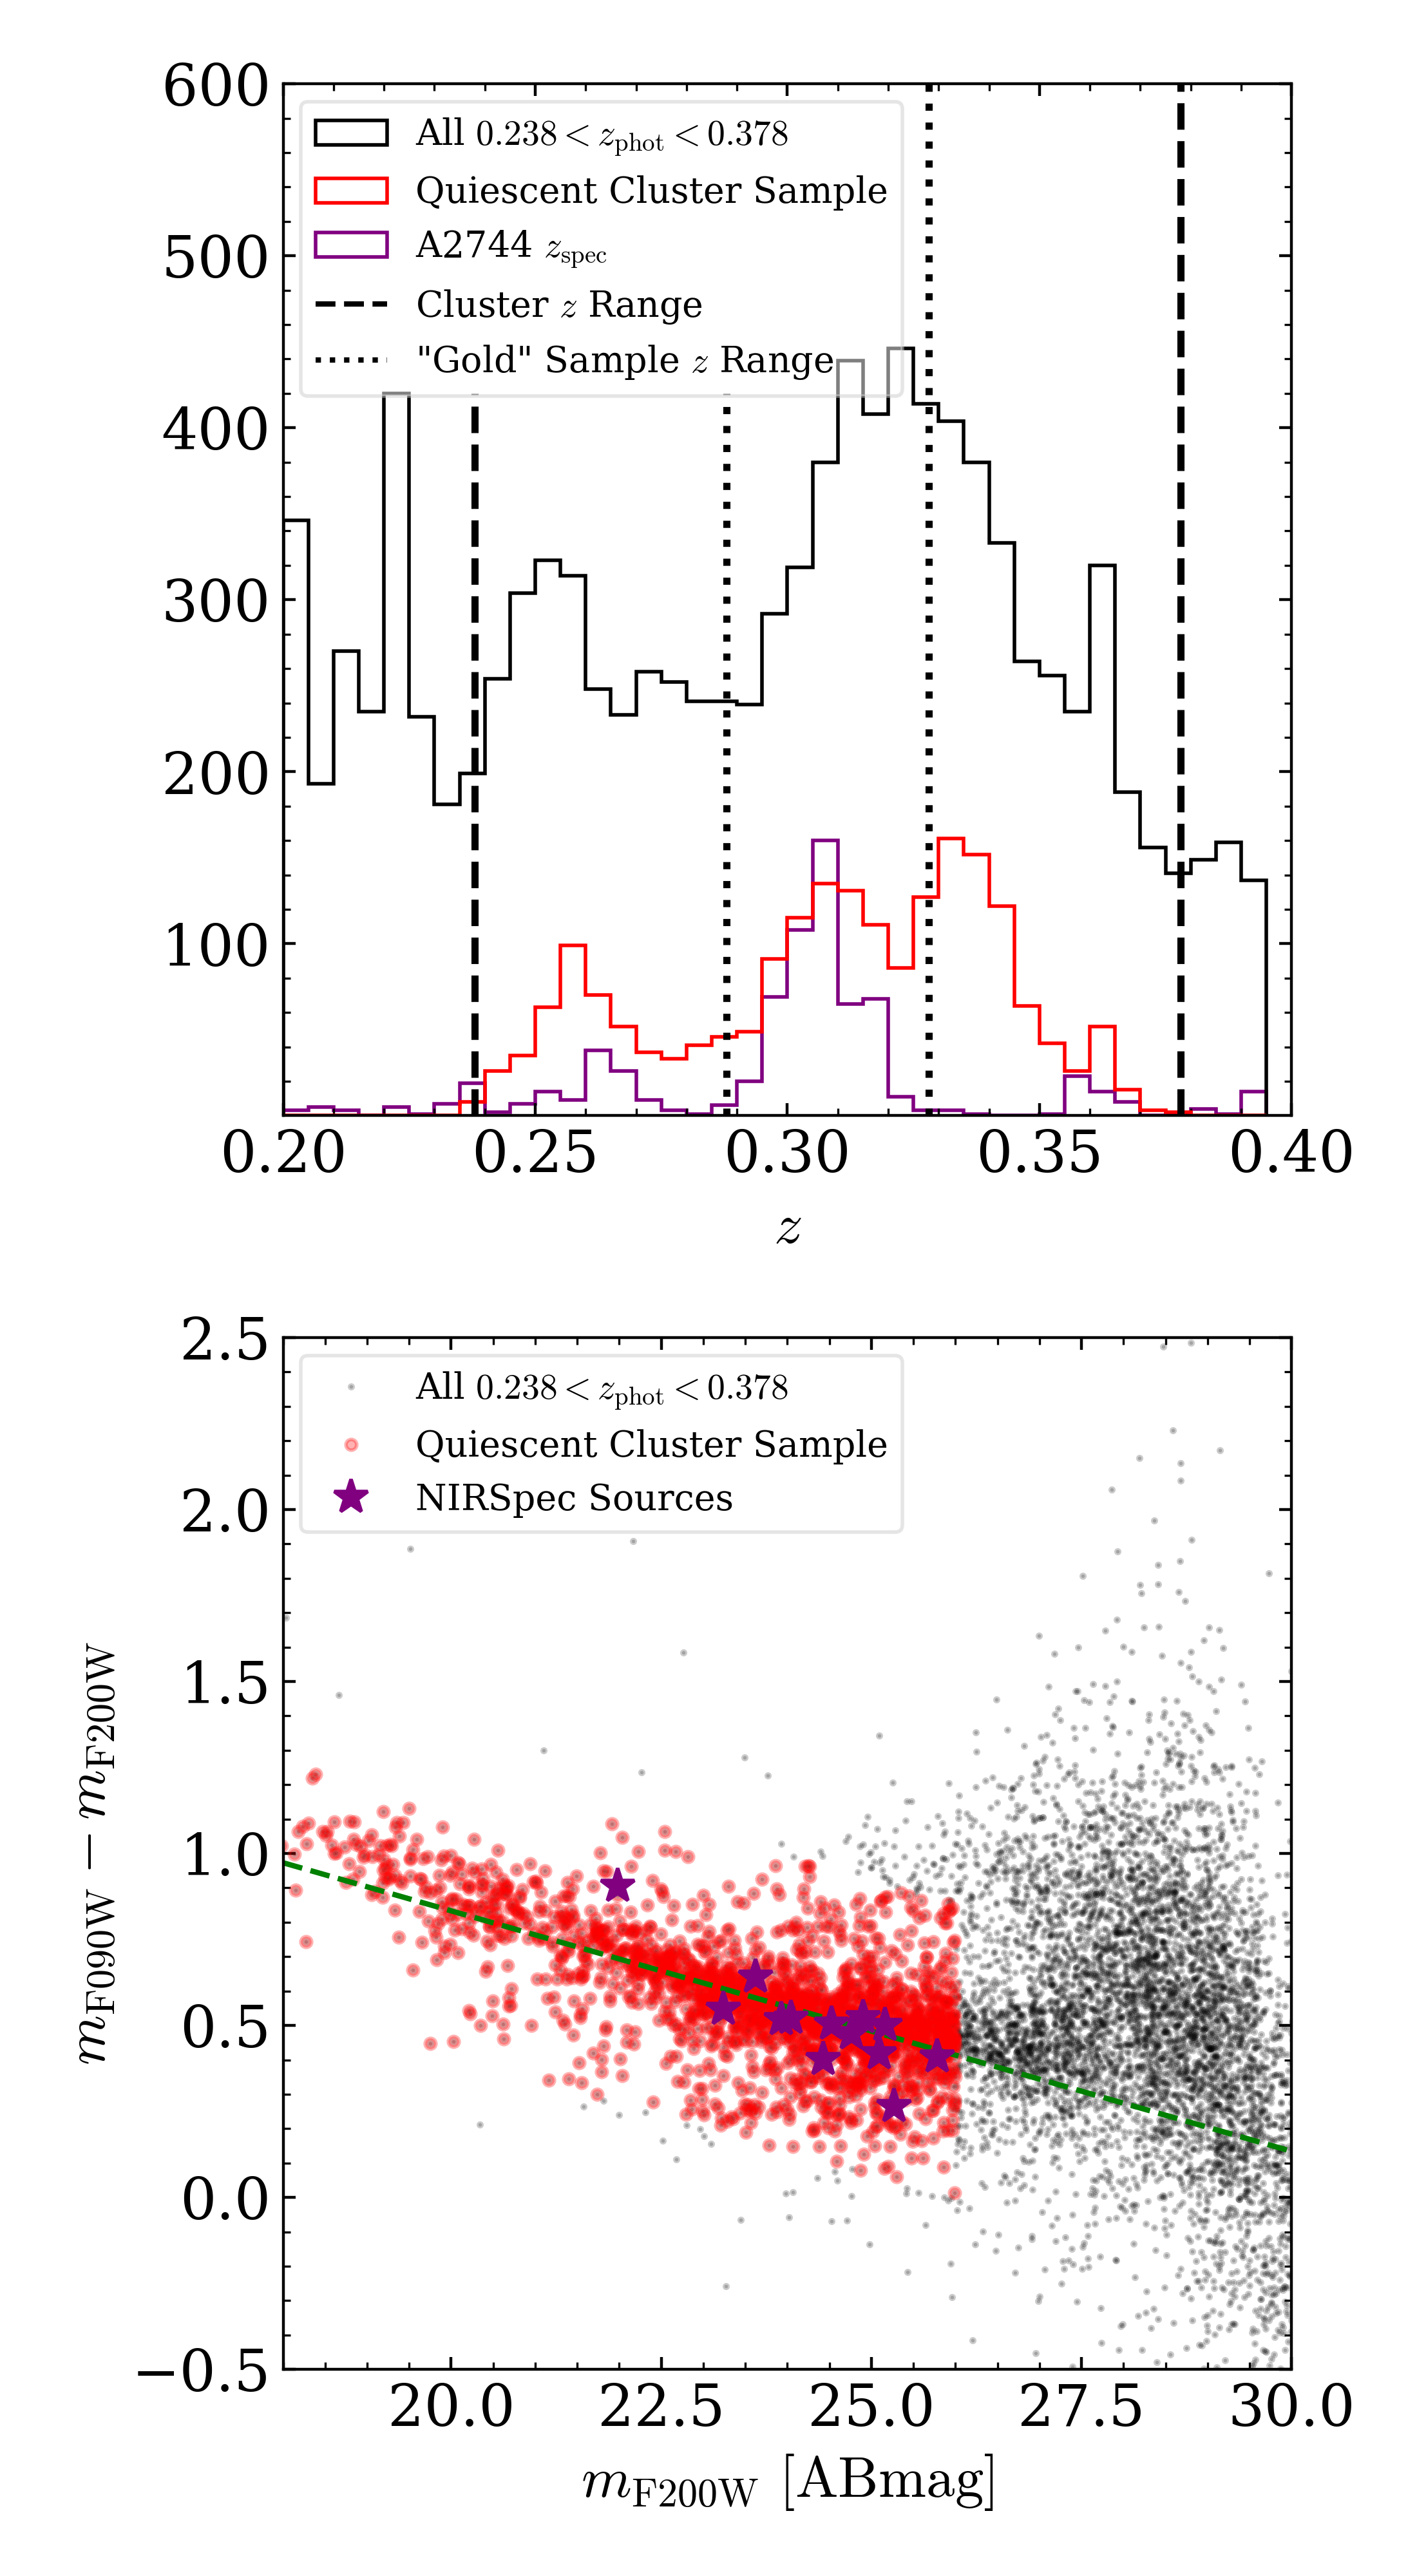
Classically, quiescent cluster members are selected from the red-sequence of the color-magnitude diagram (e.g., Visvanathan & Sandage, 1977; Bower et al., 1992a, b; Stott et al., 2009; Valentinuzzi et al., 2011), including in several studies of Abell 2744 (e.g., Lee & Jang, 2016; Furtak et al., 2023; Harvey & Massey, 2024). Moreover, at the redshift of Abell 2744 (), NIRCam filters do not offer sufficient coverage of the rest-frame or bands to select quiescent galaxies via a color-color selection. Thus, we select quiescent cluster members using a combined F090WF200W color-magnitude and redshift selection. The F090WF200W color roughly approximates the rest-frame , which is useful for separating quenched from dusty star-forming galaxies (e.g., Antwi-Danso et al., 2023). The use of F200W photometry also leverages the m peak of the typical SED for a low-mass quiescent galaxy at . For a redshift selection, we select all 9263 sources with EAY photometric redshifts between ( or Mpc) using the fsps_full templates. This redshift range, which is slightly larger than the typical photometric redshift uncertainty (), covers the other peaks of the redshift distribution around Abell 2744 (see Fig. 1, top). The sfh_blue_agn template is used to remove high-redshift interlopers due to its better performance at . These templates, however, have significant biases at , where the fsps_full templates perform better (see Section 5.3 in Weaver et al., 2024) and are thus used in the actual redshift selection. Including sources marked as artifacts (USE_PHOT) in the photometric catalog, 963 galaxies with in the sfh_blue_agn templates are removed from the initial redshift selection (11.6%).
The total redshift distribution of selected sources is shown in the top panel of Figure 1 for all galaxies (black) and the red-sequence-selected sample (red). The purple histogram shows the distribution of archival spectroscopic redshifts in Abell 2744 (Owers et al. 2011; Richard et al. 2014; Mahler et al. 2018; GLASS 333https://archive.stsci.edu/prepds/glass/). The spectroscopic redshift distribution indicates that there are other structures in the UNCOVER field-of-view at and , which we also see in the photometric redshift distributions. Moreover, the distributions are also broader than the distribution, with more sources at slightly higher redshifts. We include all of these sources in our redshift sample in order to maximize sample size, however we also create a “gold” sample () of sources encapsulated by the central peak (purple histogram in Fig. 1, top). While this ( Mpc) still covers larger physical volumes of space than the cluster occupies, the widths of both the and distributions are likely inflated by uncertainties in fitting redshift solutions to the relatively featureless rest-frame NIR spectra of quiescent galaxies.
The red sequence of the color-magnitude relation is then fit for bright sources () with a linear relation (green line in Fig. 1, bottom). 3 outliers are removed, equivalent to ABmag around the linear fit, resulting in a cluster sample of 1994 and a gold sample of 811 galaxies. We limit the selection to sources brighter than to minimize contamination from faint background sources. If we consider a more pure selection of sources brighter than and removal of outliers ( ABmag), we find no significant change in our results. Part of our selection area does contain rest- photometry from HST/ACS F435W imaging in the HFF (Lotz et al., 2017; Shipley et al., 2018) and BUFFALO (Steinhardt et al., 2020) surveys. As a comparison with typical selections, we compare the cuts in Cutler et al. (2024) with the color-magnitude selection used in this work for regions of the mosaic significant () F435W coverage. We find the color-magnitude selection recovers 90.1% of the galaxies selected with . The total color-magnitude sample (1994 galaxies) thus represents an increase of 252% over a selection based solely on robust .
3 Analysis
3.1 Structural Modeling
Galaxies are modeled using a single 2D Sérsic profile with GALFIT (Peng et al., 2002, 2010a) following the procedure of Cutler et al. (2024), which is based on the methods of van der Wel et al. (2012). The parameter constraints on Sérsic index are slightly different (, as opposed to in Cutler et al. 2024); other constraints are identical ( mag from the photometric catalog value, pixels, and ). The modeling is performed on the bCG-subtracted F200W imaging at native resolution, scaled to an pixel scale. F200W is chosen as the SED of these galaxies peaks at m. In addition to the 565 galaxies removed due to sparse coverage or crowding from nearby sources (28.3% of the initial sample), as well as the 64 removed due to bad GALFIT models (3.2%, see Cutler et al., 2024), we also apply a cut on the residual flux fraction (RFF), similar to Ormerod et al. (2024), which is determined to be RFF through visual inspection of galaxy residuals. 330 additional galaxies (16.5% of the initial sample) are excluded due to high RFF. The RFF-rejected fraction includes 8.9% of low-mass () and 49.1% of massive galaxies. This moderately high rejection fraction is a consequence of the data at hand, primarily due to contamination from nearby sources or other ICL. Moreover, the morphologies of most sources at are too complex to be effectively modeled by a single Sérsic profile, leading to high RFF and the significantly higher rejection rate compared to lower-mass galaxies at these redshifts. As such we impose a upper limit on stellar mass to avoid significantly biasing population statistics at these masses, which removes 9 galaxies (0.9%), resulting in a final morphological sample of 1026 galaxies, 486 of which are from the gold sample. The results shown and discussed in the paper are with respect to the full sample. We find no significant changes when we only consider sources in the gold sample.
3.2 SED Modeling
13 galaxies in our sample have NIRSpec PRISM spectroscopic observations (see Section 2). For these sources, we jointly model the spectrophotometric data using the Bayesian SED fitting code Prospector (Johnson et al., 2021). The SED-fitting procedure closely follows de Graaff et al. (2025). We utilize the default Prospector libraries: the Flexible Stellar Population Synthesis models (FSPS, Conroy et al., 2009, 2010; Conroy & Gunn, 2010), the MILES spectral libraries (Sánchez-Blázquez et al., 2006), and the MIST stellar isochrones (Choi et al., 2016; Dotter, 2016). We also incorporate non-parametric SFH based on the “continuity” prior (Leja et al., 2019), which fits for the logarithmic ratio between adjacent age bins and applies Student’s-t priors centered on 0 with a width of 0.3 and degrees of freedom to these ratios. The SFH is measured over 14 age bins, where the first 100 Myr are divided into bins of width 10, 40, and 50 Myr and the remaining 11 linearly spaced bins (921 Myr widths). Sampling is done using nested sampling from dynesty (Speagle, 2020).
Dust attenuation is modeled using the Kriek & Conroy (2013) curves, which additionally fit for the “dust index”, an offset to the Calzetti et al. (2000) attenuation slope. We also assume twice as much young star ( Myr) attenuation when compared to older stars. Dust emission is set using the Draine & Li (2007) models, where the mass fraction of dust in polycyclic aromatic hydrocarbon and dust in high intensity radiation is fixed at 2 and 1%, respectively, and the interstellar radiation strength is at the Milky Way value. Stellar metallicity is also a free parameter over the range .
To account for resolution effects, the model spectra are convolved with the PRISM resolution curve found in the JWST user documentation444https://jwst-docs.stsci.edu/jwst-near-infrared-spectrograph/nirspec-instrumentation/nirspec-dispersers-and-filters with an added multiplication factor of 1.1 (e.g., Curtis-Lake et al., 2023; de Graaff et al., 2025). This factor accounts for the extended median size of these sources (). Uncertainty in the NIRSpec flux calibration is treated using Prospector PolySpecModel: a 12th order polynomial is fit to the input spectrum during each likelihood call in order to match the observed and model spectra.
The full sample of cluster galaxies is also modeled using the Prospector emulator (Mathews et al., 2023) with the Prospector- model (Leja et al., 2017). Modeling includes 27 photometric filters (where available), including archival HST ACS and WFC3 data and medium- and broad-band photometry from MegaScience and UNCOVER, respectively.
4 Results
4.1 Low-Mass Quiescent Galaxy Structure
4.1.1 The Size-Mass Relation
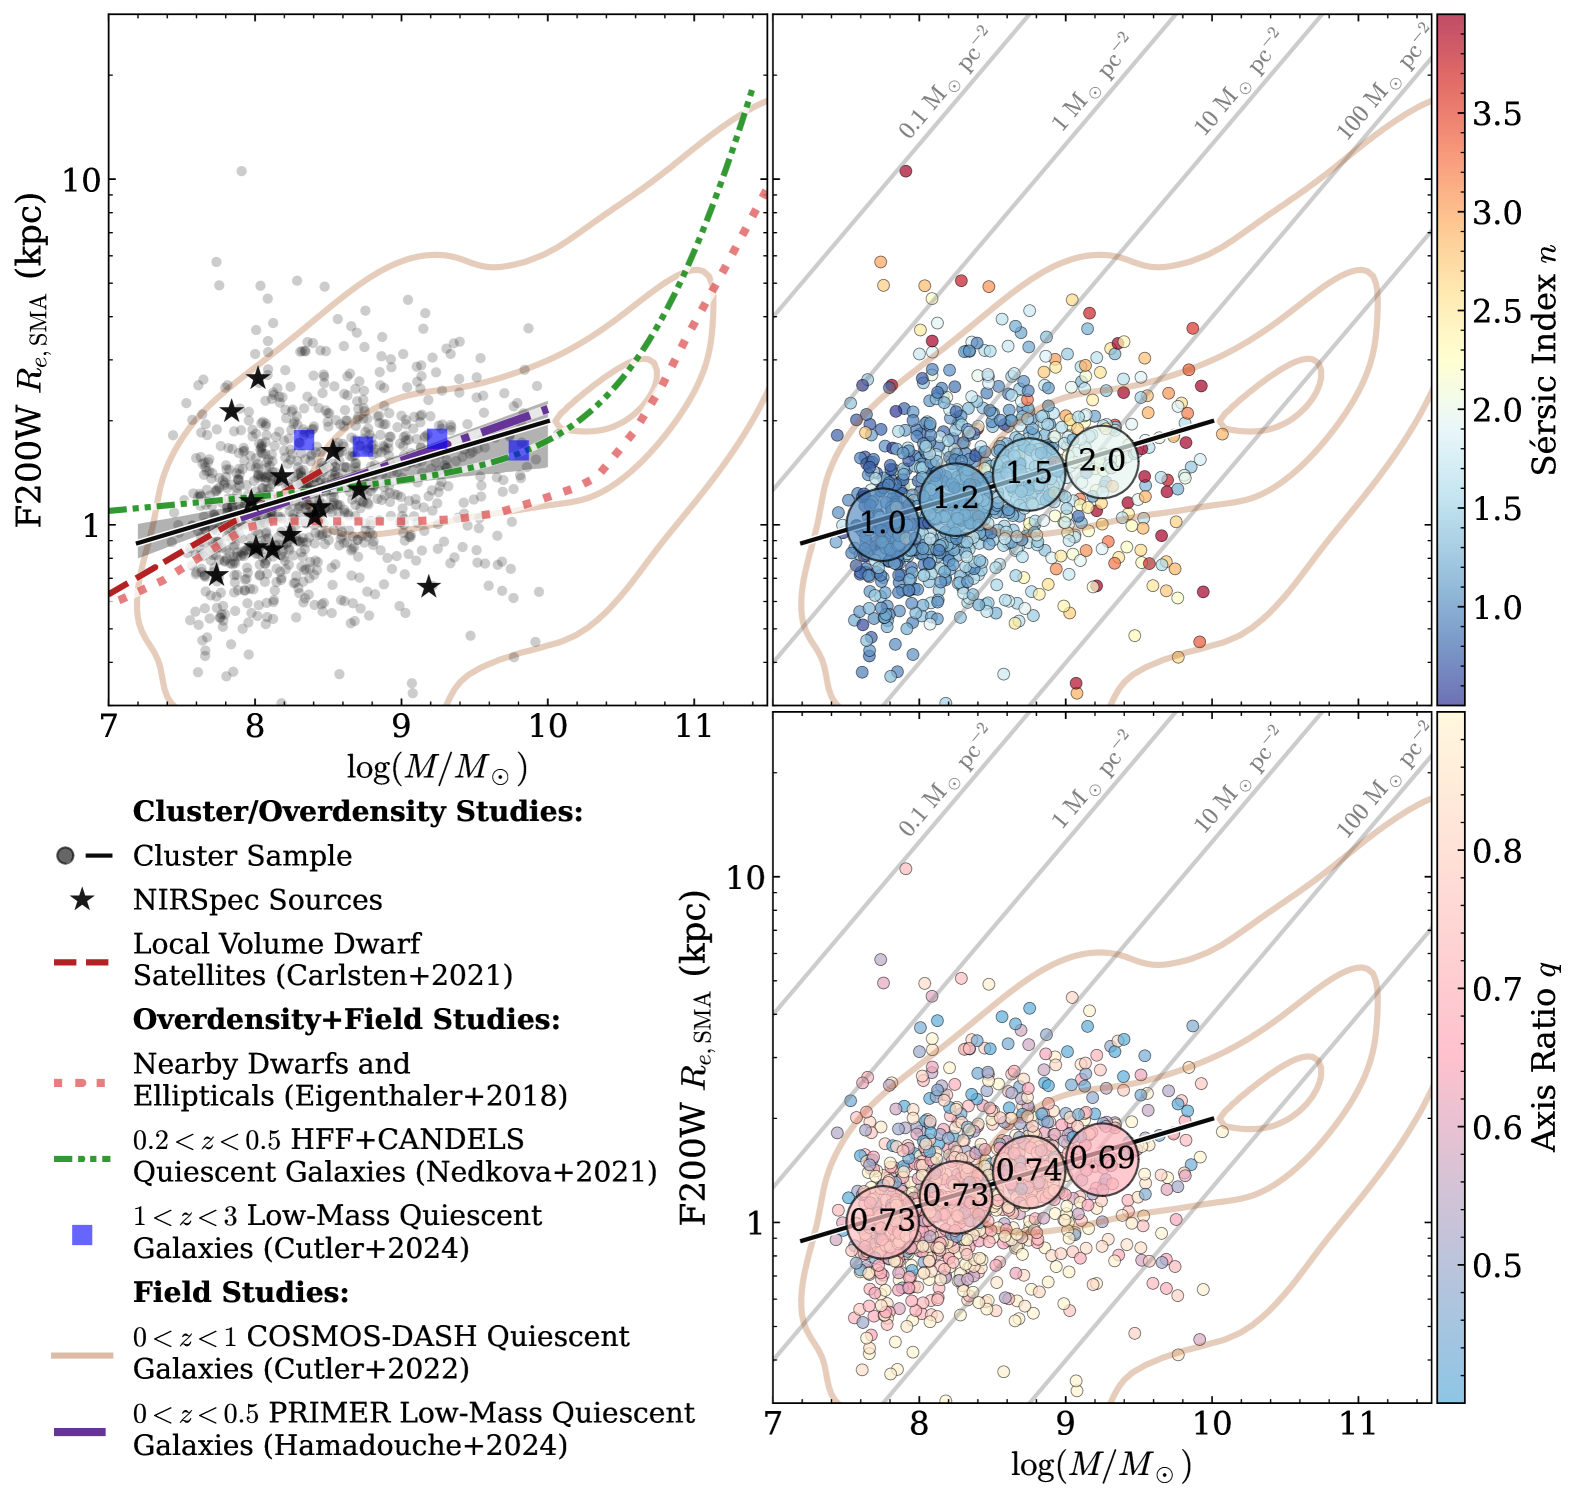
Several studies have presented quiescent size-mass relations in cluster environments (Kuchner et al., 2017; Afanasiev et al., 2023; Yang et al., 2024), though these studies are limited to . Our analysis obtains cluster galaxy sizes at , filling in this gap in the literature. In the left panel of Figure 2, we show the sizes of quiescent galaxies in Abell 2744 (black points). Following Hamadouche et al. (2024), we fit the low-mass quiescent size-mass relation using a single power law of the form
| (1) |
finding best-fit values of and . Our best-fit relation (black line) is systematically larger and significantly flatter than the size-mass relation for dwarf galaxies from the Fornax cluster (dotted red line, Eigenthaler et al., 2018) and the Local Volume (dashed maroon line, Carlsten et al., 2021). This discrepancy is likely due to a lack of ultra-diffuse galaxies (UDGs) in the Fornax and Local Volume samples, which is discussed more below. We measure a model scatter of , a factor of two larger than the dex size scatter in quiescent field galaxies (van der Wel et al., 2014a; Kawinwanichakij et al., 2021; Hamadouche et al., 2024). The large scatter we find is not primarily driven by projection effects. If we instead consider circularized sizes (), we find a comparable scatter of .
The differences in scatter could be due in part to differences in selection methods; Hamadouche et al. (2024) use the selections of Williams et al. (2009), which differs from our red-sequence selection (Section 2.2) and from the extended selection from Belli et al. (2019) and specific star-formation rate cuts used in Cutler et al. (2024). Moreover, as the results of Hamadouche et al. (2024) are based on PRIMER (Dunlop et al., 2021) observations, the shallower depth of this survey relative to UNCOVER may bias the sample selection such that they preferentially miss galaxies with lower surface brightnesses, such as potential larger low-mass quiescent galaxies. Moreover, PRIMER is a field survey, thus with a lower space density of galaxies at relative to the targeted Abell 2744 cluster observations. In Hamadouche et al. (2024), the majority of low-mass quiescent galaxies in the bin are at . Meanwhile, the Hamadouche et al. (2024) galaxies at are notably smaller than the overall population within the lowest redshift bin. This either hints at a potential bias against larger low-mass quiescent galaxies at the lowest redshifts or real systematic differences between field and cluster samples.
Likewise, the deeper UNCOVER photometry may lead to biases at the more massive end (), as more complex morphologies emerge. We estimate rough completeness limits in 0.5 dex mass bins by comparing the mass distribution of galaxies in our sample to the best-fit quiescent mass function from Santini et al. (2022), ignoring cosmic variance. The completeness at is notably suppressed relative to lower masses, which is likely due to two factors: brighter, more extended galaxies are more difficult to extract as single objects and to model with single Sérsic profiles in this ultra-deep imaging. There may also be a significant fraction of cluster galaxies missed in our detection step due to segmentation “shredding”, with a further fraction removed due to large residuals in the GALFIT modeling step. These biases could in principle result in a more compact sample of quiescent galaxies at and subsequently a flatter size-mass relation. However, the combined HFF and CANDELS relation from Nedkova et al. (2021), which likely includes cluster galaxies from HFF, has similar scatter to the Abell 2744 sample at , suggesting that our measured relation is due to physical effects.
If the flatter size-mass relation discussed above is indeed a physical effect, it could indicate that rich, massive () cluster, like Abell 2744, environments have a significant population of larger ( kpc) low-mass quiescent galaxies at relative to dwarf galaxies in less-rich environments (e.g., Fornax, Local Volume). This effect could be naturally explained by dynamical interactions within the cluster environment, such as tidal heating, tidal stripping, and ram-pressure stripping, causing low-mass disky galaxies to “puff up” or undergo expansion, resulting in a population of UDGs (e.g., Safarzadeh & Scannapieco, 2017; Ogiya, 2018; Carleton et al., 2019; Sales et al., 2020; Tremmel et al., 2020; Benavides et al., 2021, 2025; Grishin et al., 2021; Jones et al., 2021; Junais et al., 2022). While the bulk population in Abell 2744 appears in line with mostly dwarf spheroids (see Section 4.1.2), the larger median size of the Abell 2744 galaxies relative to nearby dwarf galaxy in less rich environments and the higher scatter relative to field studies may also be a result of significant contributions from UDGs, as UDGs are predominantly found in overdense (specifically massive cluster) environments (van der Burg et al., 2017). Studies of the Fornax cluster (, Drinkwater et al., 2001) estimate a population of roughly 42 UDGs within the virial radius (Venhola et al., 2017) compared to 288 in Coma (Yagi et al., 2016), which is more massive by 2 orders of magnitude (, Ho et al., 2022). The Fornax UDGs also appear smaller than those from Coma (van Dokkum et al., 2015b) or Virgo (Mihos et al., 2015), with very few larger than kpc (e.g., Fig. 2, Muñoz et al. 2015; Fig. 8, Eigenthaler et al. 2018). Likewise, UDGs associated with group galaxies have less regular morphologies than those in clusters (Merritt et al., 2016), indicating different formation mechanisms than cluster UDGs. As such, UDGs can explain the flattened size-mass relation at the lowest masses relative to local populations in less-rich environments.
Similarly this large UDG population (which may correspond to the previously mentioned “puffed up” galaxy population), could explain the larger size scatter relative to field studies. The combination of UDGs with smaller, compact dwarf galaxies (those that instead were eroded) - together forming via cluster-specific dynamical processing - sets the cluster size scatter apart from field galaxies. Alternatively, if UDGs are present in the comparison field sample, we would not be sensitive to detecting them given the depths of the survey. UDGs typically have surface brightnesses fainter than (van Dokkum et al., 2015a) PRIMER has a surface brightness depth of (compared to in UNCOVER). Field studies using PRIMER data (i.e., Hamadouche et al., 2024) are thus unlikely to detect UDGs at , suggesting their absence from these samples is due to observational biases. Despite this, the discrepancies between the Abell 2744 size-mass relation and those of dwarf galaxies in less-dense environments suggests there should be very few UDGs in field samples, and thus we adopt this assumption going forward.
In addition to explaining differences between literature samples, UDGs have similar masses and sizes - and kpc, respectively (van Dokkum et al., 2015a; Janssens et al., 2017, 2019; Lee et al., 2017; Carleton et al., 2023) - to many of the larger galaxies in our low-mass quiescent galaxy sample. In particular, Janssens et al. (2019) find 99 UDGs at in Abell 2744, suggesting a significant fraction may be present in our sample down to . After cross-matching with the Janssens et al. (2019) sample, we find 16 UDGs (26.7% of the 60 UDGs that overlap with our detection region) are included in the Abell 2744 low-mass quiescent galaxies. The other sources are often detected but assigned a higher redshift in our catalogs, thus it is hard to discern if they are bonafide cluster members or not. The moderate fraction of UDGs found in our sample, combined with the fact that all are located above the measured size-mass relation, indicate that the inclusion of UDGs may explain the flatter relation and higher scatter in Abell 2744.
4.1.2 Axis-Ratio Distributions
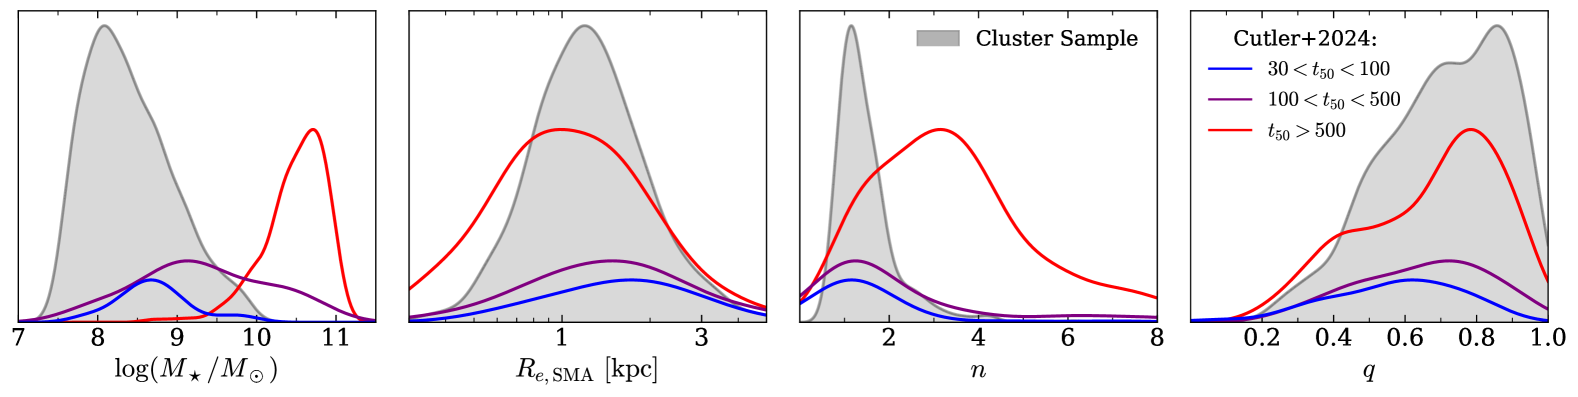
The middle panel of Figure 2 indicates that Abell 2744 galaxies predominantly have exponential disk light profiles (), similar to Cutler et al. (2024) and Hamadouche et al. (2024). However, the median axis ratios (Fig. 2, right) are slightly larger than the cosmic noon sample from Cutler et al. (2024): compared to . The larger axis ratios suggest that the low-mass quiescent populations has more spheroidal morphologies, potentially driven by billions of years worth of dynamical interactions in the cluster environment. Figure 3 shows the distribution of structural parameters in both Abell 2744 low-mass quiescent galaxies (gray shaded histograms) and quiescent galaxies from Cutler et al. (2024) (colored histograms). In terms of mass, size, and Sérsic index, our sample is most similar to younger ( Myr), low-mass quiescent galaxies at cosmic noon (blue and purple curves). Conversely, we find that the distribution of axis ratios strongly peaks at ; this behavior is similar to old ( Myr), massive quiescent galaxies at (red curve), whereas low-mass quiescent galaxies exhibit broad, flat distributions.
However, before proceeding we must address a significant caveat: only a fraction of the sample reside in an overdensity, meaning the full Cutler et al. (2024) sample is not necessarily a direct comparison to our Abell 2744 galaxies. Recently, the JWST Cycle 2 grism survey All the Little Things (ALT, Naidu et al., 2024) has provided robust grism redshifts out to across the Abell 2744 lensing field and in doing so identified several overdensities at high redshifts, including a significant overdensity (Naidu et al., 2024; Whitaker et al., 2025). We find that a significant fraction (73%) of the quiescent galaxies from Cutler et al. (2024) at are within (roughly equivalent to the typical photometric redshift uncertainty of this sample) of , indicating they are likely a part of this overdensity. Combined with the structural and stellar population analysis, these results support the idea that, taking into account the redshift distribution of the Cutler et al. (2024) sample (with 73% at ), at least a subset (16%) of the overall Cutler et al. (2024) sample may occupy a cluster environment at lower redshifts. Sources in the overdensity have a median and , suggesting that low-mass quiescent galaxies in the overdensity are comparable structurally to those in the field at .
In this case, the overall young ages of the low-mass quenched population from Cutler et al. (2024), including both field and cluster galaxies, imply that they have experienced only the initial onset of quenching. Multiple quenching mechanisms can act on a galaxy at the same time, making the timescale needed to significantly impact the suppression of star formation the distinguishing factor. As the majority of environmental quenching mechanisms act over longer timescales (excluding ram-pressure stripping), the goal herein is to assess the impact of those effects that are unique to the cluster environment. The full cosmic noon sample is therefore a good morphological comparison point relative to the sample, as the latter has had quenching maintained over many Gyr through dynamical interactions with the cluster environment, whereas the former has only just had quenching triggered. Thus, as this comparison can afford to remain agnostic to the root cause of the onset, the focus instead will be on the impact of the specific longer timescale mechanisms that can only occur in dense environments.
In order to constrain the intrinsic shapes of the Abell 2744 low-mass quiescent galaxies, we fit their axis ratio distribution using a three-population model of disky, spheroidal, and elongated (prolate) galaxies. We estimate ellipticity and triaxiality using a least-squares minimization technique that most accurately reproduces our observed axis ratio distributions. From these best-fit parameters, we then generate a sample population as seen from random viewing angles to model the intrinsic axis-ratio distribution. Based on the categories from van der Wel et al. (2014b), we classify morphology fractions belonging to each intrinsic population that collectively define the axis-ratio distribution of our observed population. We find that the Abell 2744 low-mass quiescent galaxies are primarily (76%) spheroidal, while the low-mass, Myr quiescent galaxies from Cutler et al. (2024) are composed of only 46% spheroids. The fraction of spheroids in the Abell 2744 sample is much closer to what we see in the massive, Myr quiescent galaxies at cosmic noon (78%). However, this is likely driven by different physical processes: massive galaxy structures are largely impacted by merger and accretion events adding stars, whereas low-mass galaxies are shaped instead by tidal effects from close-encounters that redistribute or even strip away existing stars. The intrinsic shapes of the low-mass galaxies implied by these axis-ratio distributions, along with the low Sérsic indices, are indicative of a population of predominantly dwarf ellipticals (Graham & Guzmán, 2003). The higher axis ratios of Abell 2744 galaxies relative to cosmic noon samples could also be explained by UDG contamination; Carleton et al. (2023) find that the low-stellar-surface-density galaxies, the likely progenitors of UDGs, in the El Gordo cluster () have similar Sérsic indices () and axis-ratio distributions to the Abell 2744 low-mass quiescent galaxies.
4.2 Low-Mass Quiescent Galaxy Formation Histories
At , a majority of low-mass quiescent galaxies have Myr (e.g., Fig. 6 in Cutler et al., 2024, but see caveat in Sec. 5). While this age distribution may be due to selection effects (older, faint red sources are harder to detect), it could also be physically motivated. Several studies of the quiescent galaxy stellar mass function find that low-mass quiescent galaxies only start to appear at (e.g., Santini et al., 2022; Hamadouche et al., 2024), suggesting that the lack of old, low-mass quiescent galaxies is simply due to the fact that they have only just begun to quench at cosmic noon. Environmental quenching processes (both longer timescale gas heating and more rapid gas removal) are largely dependent upon the existence of a hot ICM in the overdensity, which takes time to be established. Thus, the existence of low-mass quiescent galaxies prior to that of (proto-)clusters with hot ICM would rule out these quenching mechanisms, at least in the case of onset (as opposed to physical mechanisms that maintain quiescence).
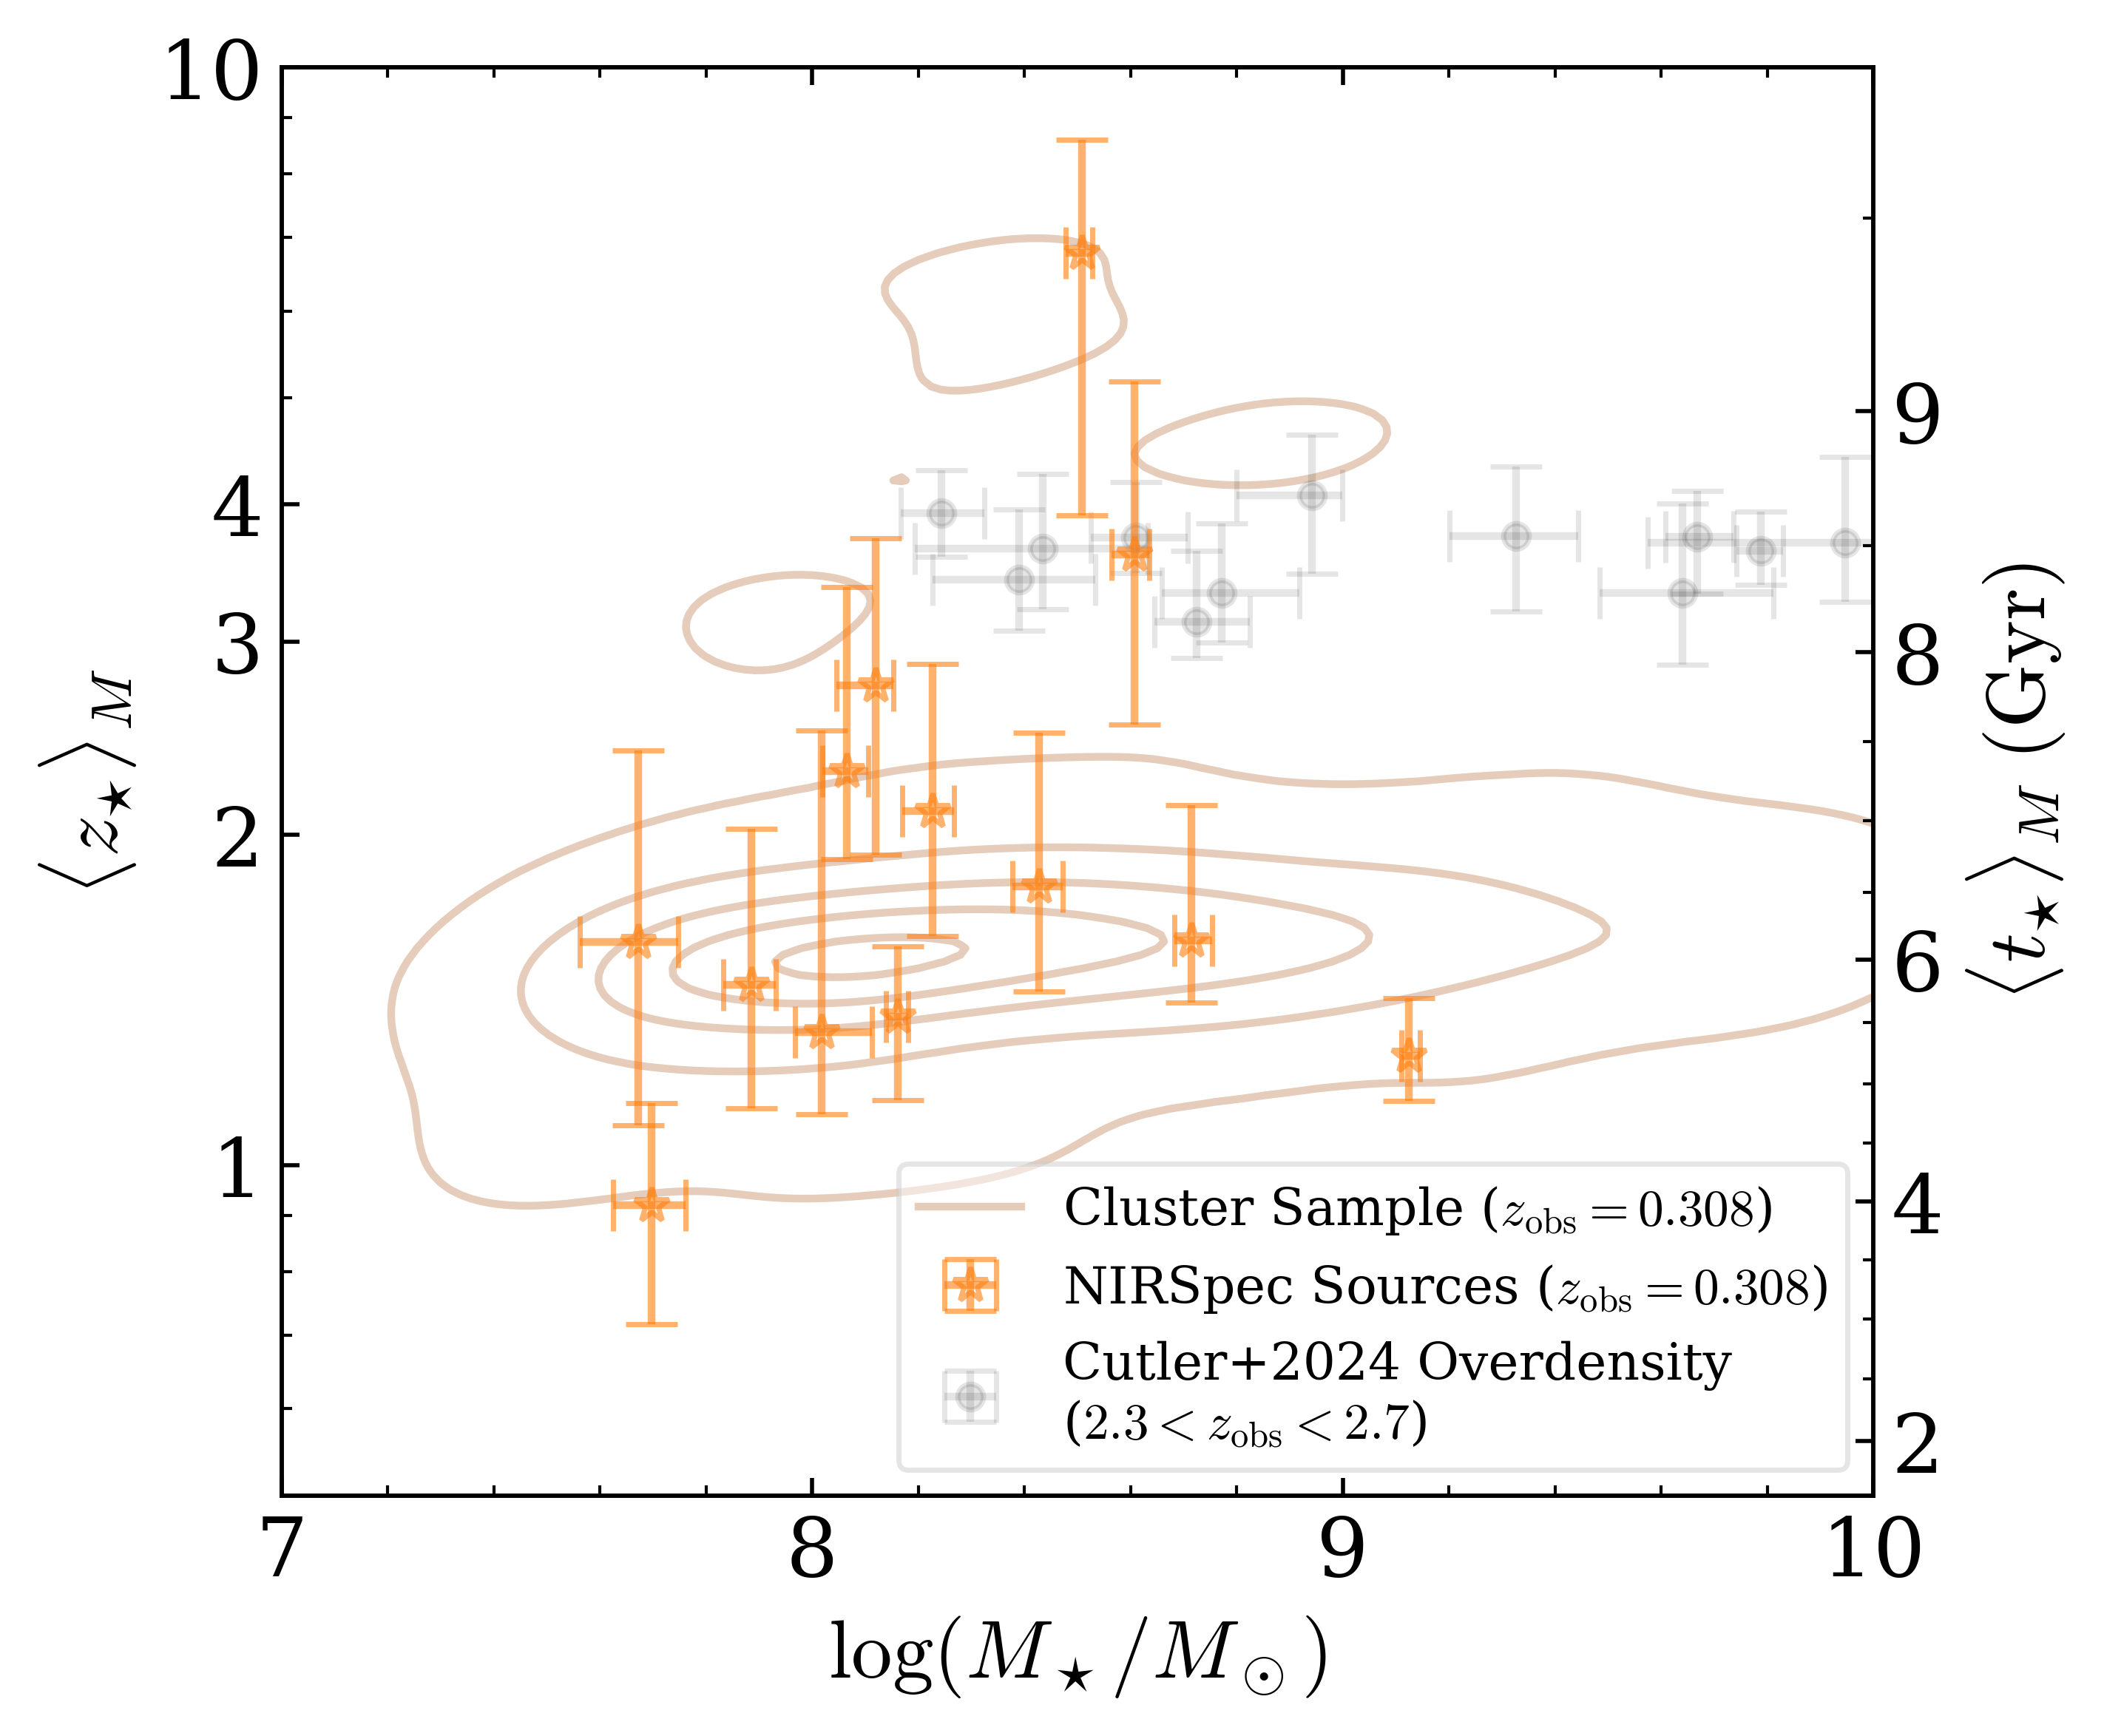
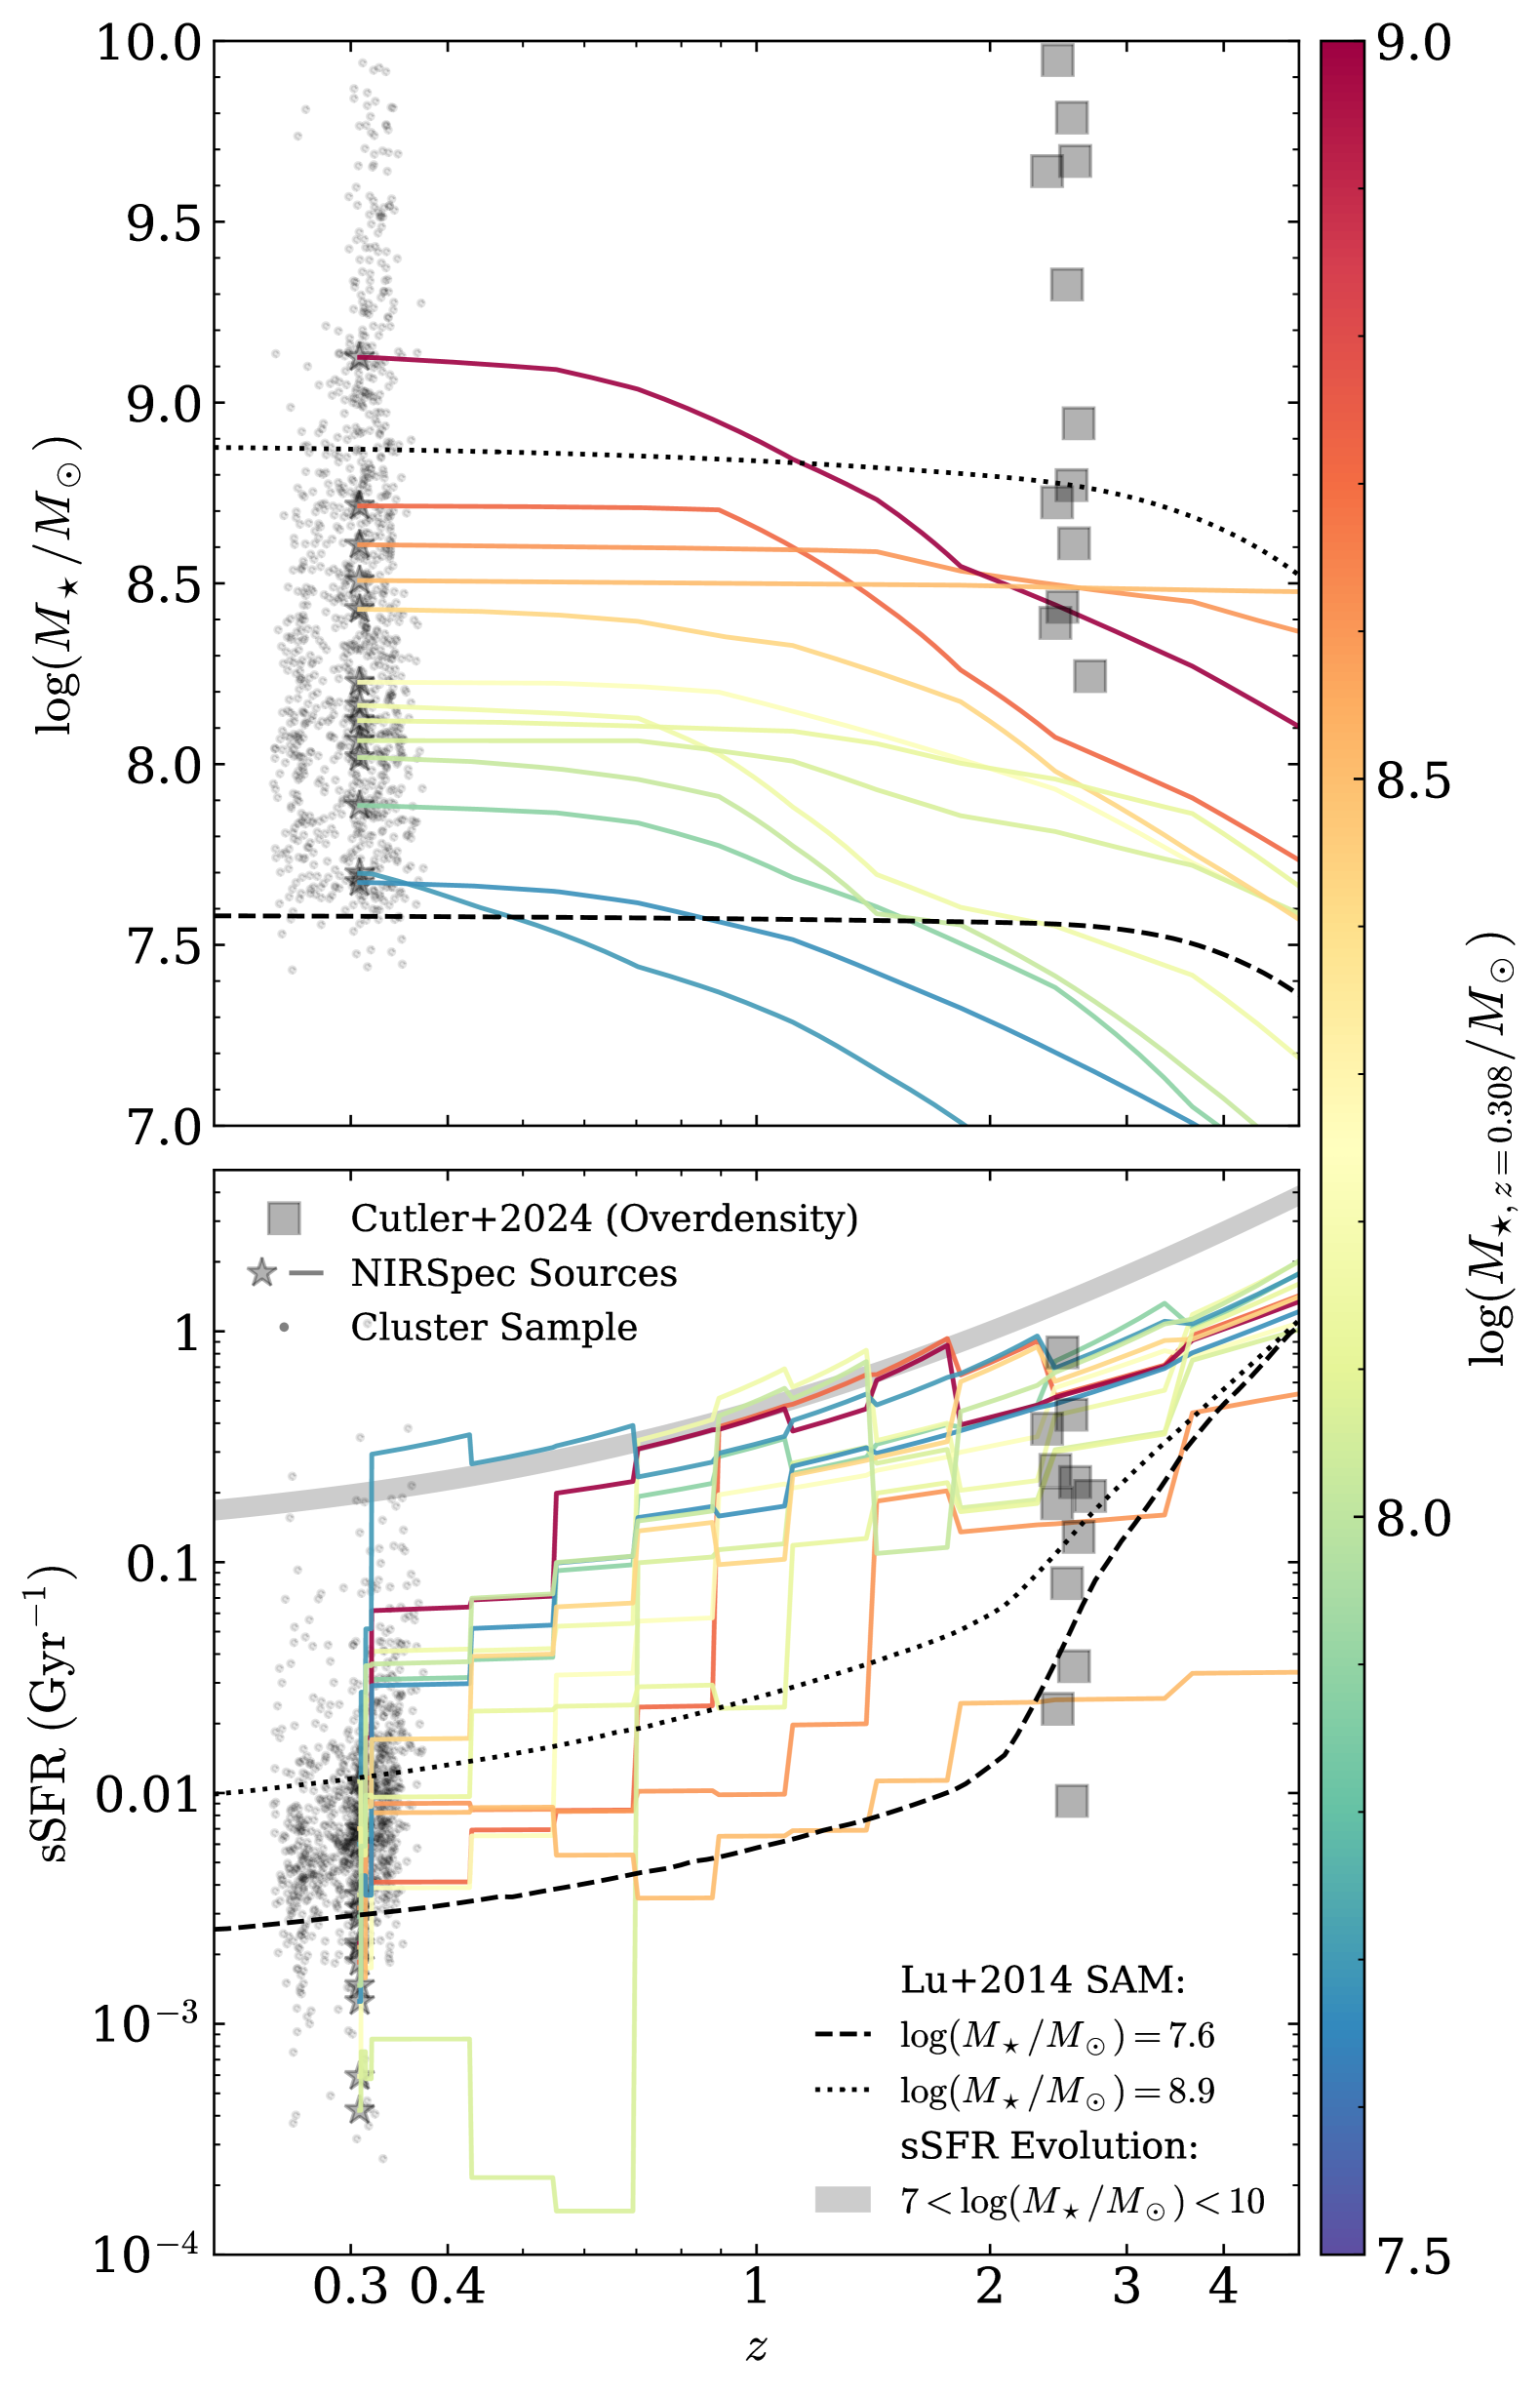
To test if we are detecting the equivalent descendant population of the low-mass quiescent galaxies in the aforementioned overdensity (Sec. 4.1.2), we use spectrophotometric stellar population modeling from Prospector to examine the SFHs of low-mass quiescent galaxies in Abell 2744 with associated NIRSpec spectroscopy. While we cannot expect to find definitive evidence of a progenitor-descendant link, we can consider all of the stellar population and morphological information together in order to interpret the possible origin of low-mass quiescent galaxies. Figure 4 shows the mass-weighted formation redshifts of NIRSpec sources (orange stars) and sources from Cutler et al. (2024) associated with the overdensity (black points) as a function of stellar mass. In general, the Abell 2744 low-mass quiescent galaxies with NIRSpec spectroscopy have much lower formation redshifts () relative to those at . Moreover, the bulk photometric-only sample of Abell 2744 low-mass quiescent galaxies also tend to form later.
Figure 5 shows the stellar masses (top) and specific star-formation rates (sSFR, bottom) as a function of redshift for these NIRSpec sources, colored by their stellar masses at the epoch of observation. At , we find that only the galaxies have similar stellar masses to the Cutler et al. (2024) overdensity galaxies, in rough agreement with the formation redshift analysis in Figure 4. Many of the galaxies have comparable sSFRs to the cosmic noon sample when traced back to , however they appear to quench at lower redshifts (). The growth in stellar mass (Fig. 5, top) for most of these galaxies also falls between the Lu et al. (2014) semi-analytic models at and (black dotted and dashed lines). These models predict a transition redshift of below which low-mass halos see significantly lower SFRs, a result that Lu et al. (2014) explain via a mix of environmental and physical effects that lead to different SFRs at high redshifts (such as intergalactic medium preheating, Mo & Mao, 2002). However, we see that this major transition occurs at lower redshifts (Fig. 5, bottom), at least in the Abell 2744 cluster, with sSFRs seeing significant decreases as late as or even .
5 Discussion
In this work, we observe the structural and star-formation properties of low-mass quiescent galaxies in a low-redshift cluster environment. These galaxies have likely seen significant changes to their structure and star-formation due to environmental effects associated with overdensities. We find low-mass quiescent galaxies in Abell 2744 have axis-ratio distributions consistent with a primarily spheroidal population, despite their exponential () light profiles (Fig. 3). These structural measurements are comparable to nearby lenticular (S0-type, Lambas et al., 1992) or dwarf elliptical galaxies (Graham & Guzmán, 2003), which are prevalent in cluster environments (Abraham et al., 1996; D’Onofrio et al., 2015). Moreover, similar morphologies are often associated with UDGs (e.g., Janssens et al., 2017, 2019; Lee et al., 2017; Carleton et al., 2023), which could explain the large scatter in our size-mass relation relative to field samples. However, we include only a moderate fraction (37.1%) of the Janssens et al. (2019) Abell 2744 UDGs in our sample. The missing UDGs (mostly caused by redshift discrepancies, source “shredding”, and contamination/crowding from nearby sources) have roughly the same median size ( kpc) as those in our sample, suggesting we are not biased against larger UDGs. The right panels of Figure 2 also show that galaxies in our sample exhibit surface densities as low as the where Coma UDGs are found (van Dokkum et al., 2015a).
The best-fit size-mass relation for our low-mass quiescent sample is also notably flatter and systematically larger than the relation for local dwarf satellites in group and cluster environments (Eigenthaler et al., 2018; Carlsten et al., 2021). This flattened relation is also inherent to our sample regardless of how we parameterize the size-mass relation at low masses. This indicates that the Abell 2744 sample is being impacted by different physical processes and/or a population of kpc galaxies (e.g. UDGs), though we cannot rule out that other low-redshift studies suffer from selection biases.
Environmental mechanisms are often attributed with shutting off star formation in low-mass quiescent galaxies. However, it is currently unclear when these processes become relevant and how this population becomes more prevalent. Recent results suggest that these physical processes could become important as early as cosmic noon: at these redshifts, proto-clusters and other large scale structures form and begin to host a robust ICM capable of efficiently stripping gas (e.g., Kravtsov & Borgani, 2012; Di Mascolo et al., 2023; Travascio et al., 2024; van Marrewijk et al., 2024; Kiyota et al., 2025). Moreover, several studies find evidence of an upturn in the quiescent galaxy mass function around (e.g., Santini et al., 2022; Weaver et al., 2023; Hamadouche et al., 2024) as early as (though the onset of incompleteness limits precludes more definitive conclusions at ). In this work, we project the formation histories of low-mass quiescent galaxies in Abell 2744 back to their epoch of formation, and find these to be delayed relative to samples in overdensities found at cosmic noon (Section 4.2). Formation redshifts indicate that the majority of galaxies formed at (Fig. 4), with only the most massive () sources with spectrophotometric modeling having comparable stellar masses to the quiescent population in the overdensity (Fig. 5).
5.1 Low-Mass Quenching at Cosmic Noon
The formation histories in Section 4.2 point towards a scenario where the first low-mass quiescent galaxies form en masse at . At the same time, newly discovered populations at cosmic noon () are young, with the majority of sources younger than Myr (Cutler et al., 2024). These young ages suggest that we are seeing the onset of low-mass quenching at , though in this case it remains unclear what specific mechanisms are responsible. An important disclaimer here is that while the luminosity-weighted ages at cosmic noon (Cutler et al., 2024) are unambiguously young by virtue of the blue rest-frame colors of the galaxies, models have not yet reached consensus on the mass-weighted ages inferred for this particular regime, ranging from tens of Myr up to 1 Gyr (Kaushal et al. 2024; Gallazzi et al. in prep.). Indeed, these differences between light- and mass-weighted ages may explain existing tensions in reported ages of low-mass quiescent galaxies at cosmic noon; Pan et al. (2025), using mass-weighted , find roughly half their low-mass quiescent galaxies at have Myr, while the vast majority of the Cutler et al. (2024) galaxies (which are based on light-weighted ages inferred from colors) are younger than 500 Myr. Regardless, the past SFH of the cosmic noon sample is not particularly relevant here. Rather, the most recent quenching episode, as traced by luminosity-weighted ages, helps guide our interpretation.
Based on the younger ages in Cutler et al. (2024), and the age of the universe at ( Gyr), environmental quenching mechanisms like starvation, dynamical stirring (i.e. harassment), or tidal effects, which are known to act over longer periods of cosmic time ( Gyr, Wetzel et al., 2013; Hirschmann et al., 2014; Wright et al., 2019), are not yet likely to impact this population. This leaves ram-pressure stripping (Gunn & Gott, 1972; Boselli & Gavazzi, 2006) as a potential environmental cause, as it take place on timescales of Gyr (e.g., Samuel et al., 2023) and hot ICM has been shown to exist in proto-clusters at these redshifts (e.g., Kravtsov & Borgani, 2012; Di Mascolo et al., 2023; Travascio et al., 2024; van Marrewijk et al., 2024; Kiyota et al., 2025). However, Pan et al. (2025) analyze the SFHs and sizes of low-mass quiescent galaxies in the overdensity behind Abell 2744, finding near-identical physical properties and quenching timescales between low-mass galaxies in the field and those in the overdensity. The Pan et al. (2025) results strongly indicate there is no evidence that low-mass quenching is environmentally driven in this overdensity, calling into question theories that invoke environment to explain the buildup of low-mass quiescent galaxies at cosmic noon. Moreover, the Abell 2744 low-mass quiescent galaxies, which will undoubtedly have had their quenching maintained by environmental mechanisms, at least in their late-time evolution, tend to form Gyr later than those in the overdensity (Fig. 4). These results either suggest that a) the initial quenching of low-mass galaxies at is not driven by environment, or b) these galaxies at are not permanently quenched.
If ram-pressure stripping is not the cause of low-mass quenching in overdense environments (due to the potential lack of a hot ICM), other mechanisms must be required to quench them at similar epochs to purported high-redshift overdensities. Stellar feedback is often invoked to explain field quenching (e.g., Fitts et al., 2017). It has also been shown to promote disk formation and correlate with larger sizes and would thus result in an overall flatter size-mass relation (e.g., Übler et al., 2014; Pillepich et al., 2018). As such, it could explain the non-environmental quenching of low-mass cluster galaxies beyond . However, stellar feedback may not be able to permanently quench low-mass galaxies as interstellar gas can be replenished by accretion from the circumgalactic medium (e.g., Tacchella et al., 2016).
The lack of evidence for environmental quenching at , along with the overabundance of young () low-mass quiescent galaxies at , strongly hints that low-mass quiescent galaxies are only temporarily quenched. Recent studies have highlighted that high-redshift galaxies caught in a lull within bursty SFHs can be mistaken both photometrically and spectroscopically for “permanently” quenched systems (so-called mini-quenched/napping galaxies, e.g., Tacchella et al. 2016; Anglés-Alcázar et al. 2017; Faucher-Giguère 2018; Ma et al. 2018; Looser et al. 2023, 2024; Sun et al. 2023; Dome et al. 2024; Gelli et al. 2025; Trussler et al. 2025; G. Khullar et al. in prep.; A. Mintz et al. in prep.). It is thus possible that some galaxies in the very young population within the high-redshift overdensity (Pan et al., 2025) will resume star-formation on moderately short timescales of order 100 Myr or less (Dome et al., 2024). Indeed, the star-formation and structural properties of these low-mass quiescent galaxies could in principle be consistent with either scenario, be that recent quenching (from environmental effects or stellar feedback) or temporary quenching via bursty SFHs. These galaxies have sSFRs dex below the Whitaker et al. (2014) main sequence evolution (grey shading in Fig. 5, bottom), suggesting a population that is either transitioning into quiescence (e.g., Tacchella et al., 2019) or is temporarily quenched. Similarly, the low Sérsic indices () and flatter axis-ratio distributions (e.g., Fig. 3) could indicate recent permanent quenching or temporary quiescence. As such, it stands to reason that some fraction of these galaxies are only temporarily quenched, though the exact demographics are challenging to pin down. Future studies could leverage the ages of low-mass quiescent galaxies in overdensities at intermediate redshifts (), where (proto-)clusters with hot ICM are more abundant to help distinguish napping quiescent galaxies from environmentally quenched galaxies over a wider baseline.
5.2 Connecting Cosmic Noon to Low-Redshift Clusters
Regardless of whether or not the galaxies associated with the overdensity are permanently quenched, these galaxies will eventually be impacted by interactions with the cluster environment, leading to permanent quenching and structural changes. These changes must occur in the several Gyr between and , since we see dramatic differences in the star-formation and morphological properties of low-mass quiescent galaxies at cosmic noon relative to those observed locally; in the low-redshift () cluster, galaxies are much more spheroidal (based on axis-ratio distributions, Fig. 3) whereas their sizes are roughly similar to high redshift () samples for (Fig. 2, left). Similarly, the overdensity sample has sSFRs roughly dex higher than the cluster galaxies in Abell 2744 (Fig. 5, bottom; main sequence shown as benchmark). Moreover, while the low-mass size-mass relation is roughly identical between field and proto-cluster galaxies at (Pan et al., 2025), at we find a significantly larger scatter in Abell 2744 relative to the field relation (Hamadouche et al., 2024).
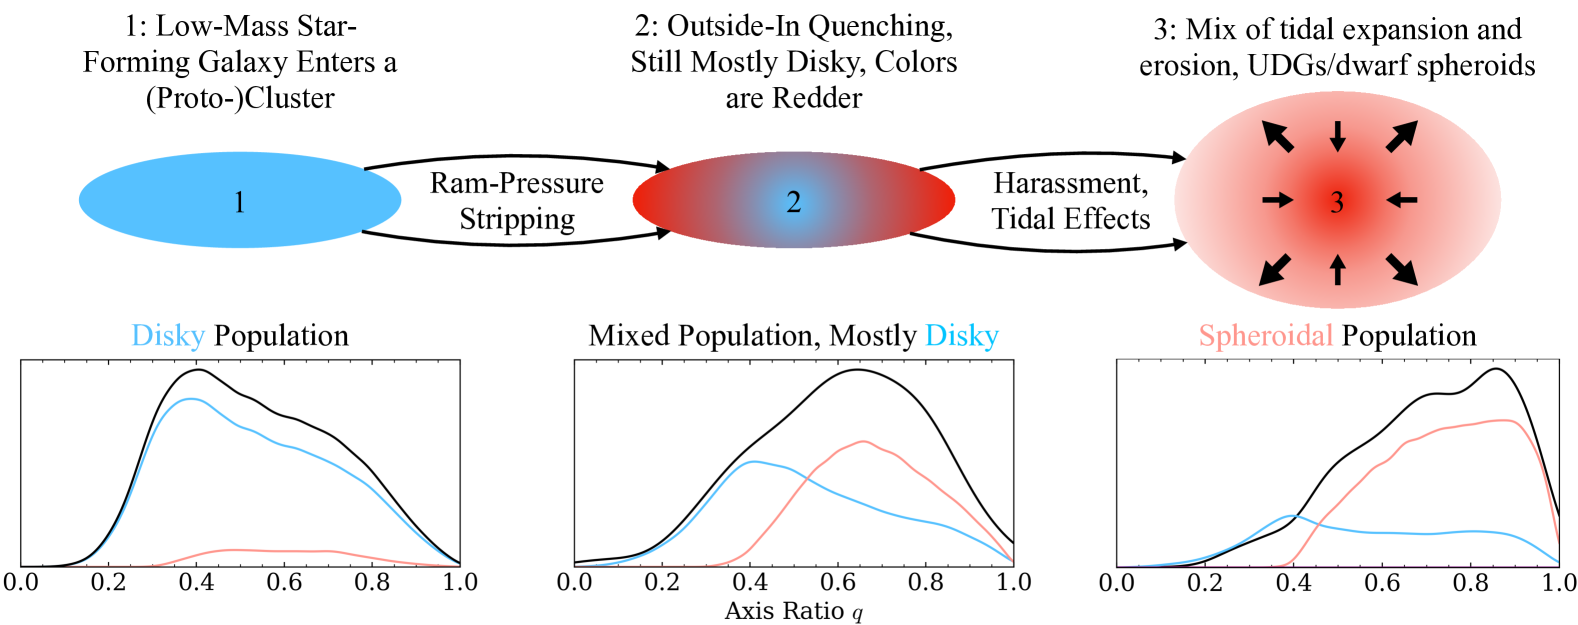
These physical observations allow us to speculate on the evolutionary pathways that connect low-mass galaxies in cosmic noon overdensities to those in low-redshift clusters. The establishment of sufficient amounts of hot ICM in proto-clusters allows ram-pressure stripping to remove gas from all but the most interior regions of low-mass galaxies (Gunn & Gott, 1972; Boselli & Gavazzi, 2006). After this process, the resulting galaxy retains its disky morphology (several Gyr are required to cause significant morphological changes, Marasco et al., 2023), and may have residual, centrally-concentrated star formation (Schaefer et al., 2017). This process is detailed by the transition from stage 1 to 2 in Figure 6. Assuming the low-mass galaxies in the overdensity recently underwent permanent quenching, this leftover star formation could explain why they all occupy a “transitional” region dex below the main sequence. The observed disky morphologies and exponential light profiles of low-mass quenched galaxies at cosmic noon is congruent with this picture.
As low-mass quiescent galaxies gradually fall into the cluster, continued interactions with the ICM strip the remaining gas from their centers and further erode the outer stellar regions (Boselli & Gavazzi, 2006). The Gyr between and are consistent with the timescales on which reoccurring dynamical interactions can significantly change the morphology of low-mass galaxies into red, predominantly spheroidal galaxies (Wetzel et al., 2013; Hirschmann et al., 2014; Wright et al., 2019; Marasco et al., 2023). At the same time, dynamical stirring from other cluster galaxies can cause further morphological changes, contributing to the population of dwarf ellipticals (Moore et al., 1996), which have consistent axis-ratio distributions and Sérsic indices with our low-redshift Abell 2744 sample (Graham & Guzmán, 2003). The transition from stage 2 to 3 in Figure 6 highlights this process. Notably, some studies (e.g., Feldmann et al., 2011) argue that morphological changes in cluster environments occur first (as a form of pre-processing) and are later followed by quenching via ram-pressure stripping, a reversal of the process detailed in Figure 6.
The effects of dynamical stirring and tidal interactions can be erosive or expansive (indicated by the black arrows in stage 3 of Figure 6), either stripping loosely-bound stellar material and shrinking the size of a galaxy or disturbing ordered motion leading to larger velocity dispersions and sizes. The competition between tidally-driven erosion and expansion may explain the larger size scatter in the size-mass relation relative to field studies. When tidal expansion dominates the result is a population of UDGs found above the size-mass relation, while erosion-dominated galaxies become primarily compact dwarf spheroids. It appears as though these dynamical interactions cancel out on average, owing to the comparable sizes to low-mass quiescent galaxies (blue squares in Fig. 2). Several studies suggest low-mass galaxies undergo expansion first, while erosive mechanisms occur after tidal heating has already disrupted galaxy structure (Gnedin, 2003a, b; Kazantzidis et al., 2011; Paudel & Ree, 2014, e.g.,). The lowest-mass galaxies may also preferentially lose more stellar material due to their smaller potential wells, reducing their size over time. In this case, the end result of the picture shown in Figure 6 may be mass dependent over sufficiently long timescales, with the lowest-mass sources becoming progressively smaller while slightly more massive sources stay the same on average.
The smaller population of UDGs in less rich clusters (e.g., Fornax) relative to more massive clusters (e.g., Abell 2744, Coma) may be due to differences in the strength of dynamical processes in these environments. In the most massive clusters, higher speed tidal interactions can inject more energy into stellar orbits, leading to tidally-driven expansion (e.g., Moore et al., 1996, 1998, 1999; Bialas et al., 2015; Safarzadeh & Scannapieco, 2017). Meanwhile, the lower speeds in less-massive clusters would result in primarily erosion-dominated galaxies, resulting in less UDGs. A similar rationale may explain why UDGs in group environments have irregular morphologies compared to those in clusters (Merritt et al., 2016): the lower velocities in groups allow for more merger interactions to occur, creating elongated and tidally-disrupted UDGs (e.g., Crnojević et al., 2016; Toloba et al., 2016).
In the most massive cluster environments (such as Abell 2744), the continued accretion of low-mass galaxies could also explain the wide range of axis ratios we find in this work (Fig. 2) by acting as a kind of progenitor bias: newly-accreted quiescent galaxies at would have larger sizes (e.g., van der Wel et al., 2014a) and disky morphologies to those at cosmic noon, while those that have been in the cluster since are more spheroidal but retain similar sizes on average due to the combined effects of tidal erosion and expansion. To test for this “progenitor bias”, we measure the median mass-weighted age () above and below the best-fit size-mass relation from Section 4.1. Since local environmentally-quenched low-mass galaxies have older stellar populations than similar-mass field galaxies (e.g., Trager et al., 2000; van Dokkum & Stanford, 2003; Thomas et al., 2005, 2010; Renzini, 2006; Paulino-Afonso et al., 2020), which would be the source for newly accreted cluster galaxies, we would expect to see an age gradient across the size-mass relation where larger and predominantly diskier, newly-accreted galaxies have younger ages than smaller, older spheroids. However, while larger galaxies have a median age of Gyr that is slightly younger than the Gyr of galaxies below the size-mass relation, the difference is not significant. That said, the difference is a factor of 3 larger if we consider the spectrophotometrically-modeled galaxies only, but there are then small number statistics to contend with.
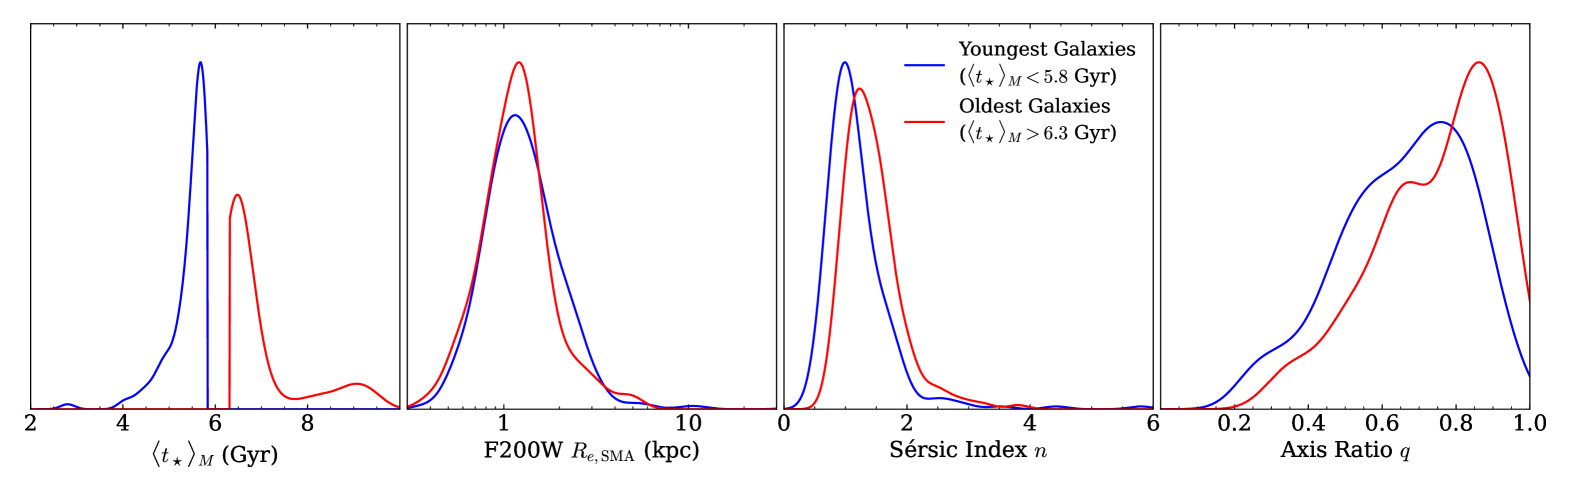
In Figure 7, we compare the mass-weighted age to both Sérsic index and axis ratio for the youngest (blue) and oldest (red) quartiles. From this analysis, we find that, despite being roughly identical in size, the youngest sources have smaller Sérsic indices and a flatter axis-ratio distribution that peaks at a smaller axis ratio (). Though the overall mass-weighted age distribution is narrow, the older galaxies are more spheroidal on average. This is comparable to the results of Allen et al. (2016), who find that star-forming galaxies at have smaller sizes and larger Sérsic indices than those at . Moreover, Allen et al. (2016) also find that quiescent galaxies have roughly similar sizes and Sérsic indices on average regardless of how close they are to the cluster center (and subsequently their age), suggesting that most of the morphological gradient we are seeing is driven by recently quenched/transitioning galaxies.
6 Summary
Understanding how and why low-mass galaxies quench is a crucial but relatively underexplored component of quiescent galaxy formation theory. Massive quiescent galaxies are thought to grow primarily through dissipationless, minor mergers (e.g., Naab et al., 2009; van Dokkum et al., 2010; Feldmann et al., 2010; van Dokkum et al., 2015b; Trujillo et al., 2011; Cimatti et al., 2012; McLure et al., 2013; Hamadouche et al., 2022), making these gas-free, low-mass quiescent sources an ideal “missing link” in these merger pathways. In this paper, we leverage spectrophotometric data from the JWST UNCOVER and MegaScience programs to study the size, morphology, and formation histories of low-mass quiescent galaxies in Abell 2744. Our main results are listed below:
-
(i)
We measure a flatter low-mass quiescent size-mass relation and higher normalization compared to local dwarf galaxy studies (e.g., Eigenthaler et al., 2018; Carlsten et al., 2021), as well as larger intrinsic model scatter relative to field studies at a similar redshift (e.g., van der Wel et al., 2014a; Kawinwanichakij et al., 2021; Hamadouche et al., 2024). If real, a broader and flatter size-mass relation in Abell 2744 could be indicative of a mixed population of tidally expanded (ultra-diffuse) and eroded (compact dwarf spheroidal) galaxies. The combined effects of erosion and expansion through dynamical interactions could result in sizes similar to those at cosmic noon, on average. That said, we cannot rule out that these discrepancies are instead driven by incompleteness at in the field samples and/or biases at in our cluster sample.
-
(ii)
Low-mass quiescent galaxies in Abell 2744 have axis-ratio distributions consistent with a primarily spheroidal population, which indicates these galaxies are mostly lenticulars and/or dwarf ellipticals (Graham & Guzmán, 2003). This represents a stark transition from the disky population of low-mass quiescent galaxies at cosmic noon (Cutler et al., 2024), suggesting that continued effects of the cluster (ram-pressure stripping, dynamical stirring, etc.) cause significant morphological changes between and today.
-
(iii)
Robust SFHs derived from spectrophotometric SED modeling of Abell 2744 cluster galaxies at show that these galaxies formed much later () than low-mass quiescent galaxies associated with a overdensity. Should an evolutionary link exist, this implies that, at , low-mass quenching is not driven primarily by environment. Moreover, these higher-redshift galaxies may only be temporarily quenched.
Overall, these results allow us to speculate on an evolutionary framework where disky low-mass quiescent galaxies in overdense environments evolve into a population of quenched dwarf spheroids in low-redshift clusters. At , the establishment of a hot ICM in early (proto-)cluster environments can permanently quench low-mass galaxies. These galaxies are stripped of their gas by tidal effects and ram-pressure stripping, quenching them from the outside in (Gunn & Gott, 1972; Boselli & Gavazzi, 2006), but their disky morphologies are largely retained along with some residual, centrally-concentrated star formation (Schaefer et al., 2017). Over the several Gyr separating the initial quenching at and our observations of the cluster at , low-mass quiescent galaxies undergo morphological changes driven by the continued effects of the cluster (Marasco et al., 2023), creating a population of older spheroids and/or dwarf ellipticals with very low sSFRs.
Further studies utilizing more in-depth SED modeling for the entire sample of low-mass quiescent galaxies in Abell 2744 will be crucial to fully investigate whether we do in fact see younger, newly-quenched disky galaxies entering the cluster sample at later epochs. Spectroscopic redshift surveys, such as ALT (Naidu et al., 2024), and upcoming medium-band surveys, like MINERVA (JWST-GO-7814, PI: Muzzin), will lead to improved redshift constraints and provide an opportunity to find overdensities at higher redshifts, which we can use to directly connect low-mass quenching at cosmic noon to environment. Moreover, future probes into the ages of low-mass quiescent galaxies in overdensities can help untangle the impact of mini-quenched galaxies on our speculated picture of low-mass quenching.
Acknowledgments
This work is based in part on observations made with the NASA/ESA/CSA James Webb Space Telescope obtained from the Space Telescope Science Institute, which is operated by the Association of Universities for Research in Astronomy, Inc., under NASA contract NAS 5–26555. Financial support for programs JWST-GO-1837, JWST-GO-2561, JWST-GO-4111, and JWST-GO-6405 is gratefully acknowledged and is provided by NASA through grants from the Space Telescope Science Institute, which is operated by the Associations of Universities for Research in Astronomy, Incorporated, under NASA contract NAS 5-03127. These observations are associated with programs JWST-GO-2561, JWST-ERS-1324, JWST-DD-2756, JWST-GO-4111, HST-GO-11689, HST-GO-13386, HST-GO/DD-13495, HST-GO-13389, HST-GO-15117, and HST-GO/DD-17231. Some of the data products presented herein were retrieved from the Dawn JWST Archive (DJA). DJA is an initiative of the Cosmic Dawn Center, which is funded by the Danish National Research Foundation under grant No. 140.
References
- Abraham et al. (1996) Abraham, R. G., Smecker-Hane, T. A., Hutchings, J. B., et al. 1996, ApJ, 471, 694, doi: 10.1086/177999
- Afanasiev et al. (2023) Afanasiev, A. V., Mei, S., Fu, H., et al. 2023, A&A, 670, A95, doi: 10.1051/0004-6361/202244634
- Akhshik et al. (2023) Akhshik, M., Whitaker, K. E., Leja, J., et al. 2023, ApJ, 943, 179, doi: 10.3847/1538-4357/aca677
- Allen et al. (2016) Allen, R. J., Kacprzak, G. G., Glazebrook, K., et al. 2016, ApJ, 826, 60, doi: 10.3847/0004-637X/826/1/60
- Anglés-Alcázar et al. (2017) Anglés-Alcázar, D., Faucher-Giguère, C.-A., Kereš, D., et al. 2017, MNRAS, 470, 4698, doi: 10.1093/mnras/stx1517
- Antwi-Danso et al. (2023) Antwi-Danso, J., Papovich, C., Leja, J., et al. 2023, ApJ, 943, 166, doi: 10.3847/1538-4357/aca294
- Astropy Collaboration et al. (2013) Astropy Collaboration, Robitaille, T. P., Tollerud, E. J., et al. 2013, A&A, 558, A33, doi: 10.1051/0004-6361/201322068
- Astropy Collaboration et al. (2018) Astropy Collaboration, Price-Whelan, A. M., Sipőcz, B. M., et al. 2018, AJ, 156, 123, doi: 10.3847/1538-3881/aabc4f
- Astropy Collaboration et al. (2022) Astropy Collaboration, Price-Whelan, A. M., Lim, P. L., et al. 2022, ApJ, 935, 167, doi: 10.3847/1538-4357/ac7c74
- Baldry et al. (2006) Baldry, I. K., Balogh, M. L., Bower, R. G., et al. 2006, MNRAS, 373, 469, doi: 10.1111/j.1365-2966.2006.11081.x
- Barbary (2016) Barbary, K. 2016, extinction v0.3.0, Zenodo, doi: 10.5281/zenodo.804967
- Barbary (2016) Barbary, K. 2016, JOSS, 1, 58, doi: 10.21105/joss.00058
- Belli et al. (2019) Belli, S., Newman, A. B., & Ellis, R. S. 2019, ApJ, 874, 17, doi: 10.3847/1538-4357/ab07af
- Benavides et al. (2025) Benavides, J. A., Navarro, J. F., Sales, L. V., Pérez, I., & Bidaran, B. 2025, arXiv e-prints, arXiv:2501.13159, doi: 10.48550/arXiv.2501.13159
- Benavides et al. (2021) Benavides, J. A., Sales, L. V., Abadi, M. G., et al. 2021, Nature Astronomy, 5, 1255, doi: 10.1038/s41550-021-01458-1
- Bezanson et al. (2024) Bezanson, R., Labbe, I., Whitaker, K. E., et al. 2024, ApJ, 974, 92, doi: 10.3847/1538-4357/ad66cf
- Bialas et al. (2015) Bialas, D., Lisker, T., Olczak, C., Spurzem, R., & Kotulla, R. 2015, A&A, 576, A103, doi: 10.1051/0004-6361/201425235
- Boselli & Gavazzi (2006) Boselli, A., & Gavazzi, G. 2006, PASP, 118, 517, doi: 10.1086/500691
- Boucaud et al. (2016) Boucaud, A., Bocchio, M., Abergel, A., et al. 2016, A&A, 596, A63, doi: 10.1051/0004-6361/201629080
- Bower et al. (1992a) Bower, R. G., Lucey, J. R., & Ellis, R. S. 1992a, MNRAS, 254, 589, doi: 10.1093/mnras/254.4.589
- Bower et al. (1992b) —. 1992b, MNRAS, 254, 601, doi: 10.1093/mnras/254.4.601
- Bradley et al. (2022) Bradley, L., Sipőcz, B., Robitaille, T., et al. 2022, astropy/photutils: v1.5.0, Zenodo, doi: 10.5281/zenodo.6825092
- Brammer (2023) Brammer, G. 2023, grizli, v1.9.11, Zenodo, doi: 10.5281/zenodo.8370018
- Brammer et al. (2008) Brammer, G. B., van Dokkum, P. G., & Coppi, P. 2008, ApJ, 686, 1503, doi: 10.1086/591786
- Calzetti et al. (2000) Calzetti, D., Armus, L., Bohlin, R. C., et al. 2000, ApJ, 533, 682, doi: 10.1086/308692
- Carleton et al. (2019) Carleton, T., Errani, R., Cooper, M., et al. 2019, MNRAS, 485, 382, doi: 10.1093/mnras/stz383
- Carleton et al. (2023) Carleton, T., Cohen, S. H., Frye, B. L., et al. 2023, ApJ, 953, 83, doi: 10.3847/1538-4357/ace343
- Carlsten et al. (2021) Carlsten, S. G., Greene, J. E., Greco, J. P., Beaton, R. L., & Kado-Fong, E. 2021, ApJ, 922, 267, doi: 10.3847/1538-4357/ac2581
- Carnall et al. (2023) Carnall, A. C., Begley, R., McLeod, D. J., et al. 2023, MNRAS, 518, L45, doi: 10.1093/mnrasl/slac136
- Cenci et al. (2024) Cenci, E., Feldmann, R., Gensior, J., et al. 2024, MNRAS, 527, 7871, doi: 10.1093/mnras/stad3709
- Chabrier (2003) Chabrier, G. 2003, PASP, 115, 763, doi: 10.1086/376392
- Choi et al. (2018) Choi, E., Somerville, R. S., Ostriker, J. P., Naab, T., & Hirschmann, M. 2018, ApJ, 866, 91, doi: 10.3847/1538-4357/aae076
- Choi et al. (2016) Choi, J., Dotter, A., Conroy, C., et al. 2016, ApJ, 823, 102, doi: 10.3847/0004-637X/823/2/102
- Cimatti et al. (2012) Cimatti, A., Nipoti, C., & Cassata, P. 2012, MNRAS, 422, L62, doi: 10.1111/j.1745-3933.2012.01237.x
- Conroy & Gunn (2010) Conroy, C., & Gunn, J. E. 2010, ApJ, 712, 833, doi: 10.1088/0004-637X/712/2/833
- Conroy et al. (2009) Conroy, C., Gunn, J. E., & White, M. 2009, ApJ, 699, 486, doi: 10.1088/0004-637X/699/1/486
- Conroy et al. (2010) Conroy, C., White, M., & Gunn, J. E. 2010, ApJ, 708, 58, doi: 10.1088/0004-637X/708/1/58
- Crnojević et al. (2016) Crnojević, D., Sand, D. J., Spekkens, K., et al. 2016, ApJ, 823, 19, doi: 10.3847/0004-637X/823/1/19
- Croton et al. (2006) Croton, D. J., Springel, V., White, S. D. M., et al. 2006, MNRAS, 365, 11, doi: 10.1111/j.1365-2966.2005.09675.x
- Curtis-Lake et al. (2023) Curtis-Lake, E., Carniani, S., Cameron, A., et al. 2023, Nature Astronomy, 7, 622, doi: 10.1038/s41550-023-01918-w
- Cutler et al. (2022) Cutler, S. E., Whitaker, K. E., Mowla, L. A., et al. 2022, ApJ, 925, 34, doi: 10.3847/1538-4357/ac341c
- Cutler et al. (2024) Cutler, S. E., Whitaker, K. E., Weaver, J. R., et al. 2024, ApJ, 967, L23, doi: 10.3847/2041-8213/ad464c
- de Graaff et al. (2025) de Graaff, A., Setton, D. J., Brammer, G., et al. 2025, Nature Astronomy, 9, 280, doi: 10.1038/s41550-024-02424-3
- Dekel & Birnboim (2006) Dekel, A., & Birnboim, Y. 2006, MNRAS, 368, 2, doi: 10.1111/j.1365-2966.2006.10145.x
- Dekel et al. (2019) Dekel, A., Lapiner, S., & Dubois, Y. 2019, arXiv e-prints, arXiv:1904.08431, doi: 10.48550/arXiv.1904.08431
- Di Mascolo et al. (2023) Di Mascolo, L., Saro, A., Mroczkowski, T., et al. 2023, Nature, 615, 809, doi: 10.1038/s41586-023-05761-x
- Dome et al. (2024) Dome, T., Tacchella, S., Fialkov, A., et al. 2024, MNRAS, 527, 2139, doi: 10.1093/mnras/stad3239
- D’Onofrio et al. (2015) D’Onofrio, M., Marziani, P., & Buson, L. 2015, Frontiers in Astronomy and Space Sciences, 2, 4, doi: 10.3389/fspas.2015.00004
- Dotter (2016) Dotter, A. 2016, ApJS, 222, 8, doi: 10.3847/0067-0049/222/1/8
- Draine & Li (2007) Draine, B. T., & Li, A. 2007, ApJ, 657, 810, doi: 10.1086/511055
- Drinkwater et al. (2001) Drinkwater, M. J., Gregg, M. D., & Colless, M. 2001, ApJ, 548, L139, doi: 10.1086/319113
- Dunlop et al. (2021) Dunlop, J. S., Abraham, R. G., Ashby, M. L. N., et al. 2021, PRIMER: Public Release IMaging for Extragalactic Research, JWST Proposal. Cycle 1, ID. #1837
- Dutton et al. (2011) Dutton, A. A., van den Bosch, F. C., Faber, S. M., et al. 2011, MNRAS, 410, 1660, doi: 10.1111/j.1365-2966.2010.17555.x
- Eigenthaler et al. (2018) Eigenthaler, P., Puzia, T. H., Taylor, M. A., et al. 2018, ApJ, 855, 142, doi: 10.3847/1538-4357/aaab60
- Faucher-Giguère (2018) Faucher-Giguère, C.-A. 2018, MNRAS, 473, 3717, doi: 10.1093/mnras/stx2595
- Feldmann et al. (2011) Feldmann, R., Carollo, C. M., & Mayer, L. 2011, ApJ, 736, 88, doi: 10.1088/0004-637X/736/2/88
- Feldmann et al. (2010) Feldmann, R., Carollo, C. M., Mayer, L., et al. 2010, ApJ, 709, 218, doi: 10.1088/0004-637X/709/1/218
- Feldmann et al. (2016) Feldmann, R., Hopkins, P. F., Quataert, E., Faucher-Giguère, C.-A., & Kereš, D. 2016, MNRAS, 458, L14, doi: 10.1093/mnrasl/slw014
- Feldmann & Mayer (2015) Feldmann, R., & Mayer, L. 2015, MNRAS, 446, 1939, doi: 10.1093/mnras/stu2207
- Fitts et al. (2017) Fitts, A., Boylan-Kolchin, M., Elbert, O. D., et al. 2017, MNRAS, 471, 3547, doi: 10.1093/mnras/stx1757
- Foreman-Mackey et al. (2014) Foreman-Mackey, D., Sick, J., & Johnson, B. 2014, python-fsps: Python bindings to FSPS (v0.1.1), v0.1.1, Zenodo, doi: 10.5281/zenodo.12157
- Furtak et al. (2023) Furtak, L. J., Zitrin, A., Weaver, J. R., et al. 2023, MNRAS, 523, 4568, doi: 10.1093/mnras/stad1627
- Gelli et al. (2025) Gelli, V., Pallottini, A., Salvadori, S., et al. 2025, arXiv e-prints, arXiv:2501.16418, doi: 10.48550/arXiv.2501.16418
- Gelli et al. (2023) Gelli, V., Salvadori, S., Ferrara, A., Pallottini, A., & Carniani, S. 2023, ApJ, 954, L11, doi: 10.3847/2041-8213/acee80
- Gnedin (2003a) Gnedin, O. Y. 2003a, ApJ, 582, 141, doi: 10.1086/344636
- Gnedin (2003b) —. 2003b, ApJ, 589, 752, doi: 10.1086/374774
- Gonzaga et al. (2012) Gonzaga, S., Hack, W., Fruchter, A., & Mack, J. 2012, The DrizzlePac Handbook (Baltimore, MD: STScI)
- Graham & Guzmán (2003) Graham, A. W., & Guzmán, R. 2003, AJ, 125, 2936, doi: 10.1086/374992
- Grishin et al. (2021) Grishin, K. A., Chilingarian, I. V., Afanasiev, A. V., et al. 2021, Nature Astronomy, 5, 1308, doi: 10.1038/s41550-021-01470-5
- Grogin et al. (2011) Grogin, N. A., Kocevski, D. D., Faber, S. M., et al. 2011, ApJS, 197, 35, doi: 10.1088/0067-0049/197/2/35
- Gunn & Gott (1972) Gunn, J. E., & Gott, III, J. R. 1972, ApJ, 176, 1, doi: 10.1086/151605
- Hamadouche et al. (2022) Hamadouche, M. L., Carnall, A. C., McLure, R. J., et al. 2022, MNRAS, 512, 1262, doi: 10.1093/mnras/stac535
- Hamadouche et al. (2024) Hamadouche, M. L., McLure, R. J., Carnall, A., et al. 2024, arXiv e-prints, arXiv:2412.09592, doi: 10.48550/arXiv.2412.09592
- Harvey & Massey (2024) Harvey, D. R., & Massey, R. 2024, MNRAS, 529, 802, doi: 10.1093/mnras/stae370
- Hinshaw et al. (2013) Hinshaw, G., Larson, D., Komatsu, E., et al. 2013, ApJS, 208, 19, doi: 10.1088/0067-0049/208/2/19
- Hirschmann et al. (2014) Hirschmann, M., De Lucia, G., Wilman, D., et al. 2014, MNRAS, 444, 2938, doi: 10.1093/mnras/stu1609
- Ho et al. (2022) Ho, M., Ntampaka, M., Rau, M. M., et al. 2022, Nature Astronomy, 6, 936, doi: 10.1038/s41550-022-01711-1
- Hunter (2007) Hunter, J. D. 2007, CSE, 9, 90, doi: 10.1109/MCSE.2007.55
- Ilbert et al. (2013) Ilbert, O., McCracken, H. J., Le Fèvre, O., et al. 2013, A&A, 556, A55, doi: 10.1051/0004-6361/201321100
- Janssens et al. (2017) Janssens, S., Abraham, R., Brodie, J., et al. 2017, ApJ, 839, L17, doi: 10.3847/2041-8213/aa667d
- Janssens et al. (2019) Janssens, S. R., Abraham, R., Brodie, J., Forbes, D. A., & Romanowsky, A. J. 2019, ApJ, 887, 92, doi: 10.3847/1538-4357/ab536c
- Ji et al. (2018) Ji, Z., Giavalisco, M., Williams, C. C., et al. 2018, ApJ, 862, 135, doi: 10.3847/1538-4357/aacc2c
- Johnson et al. (2021) Johnson, B. D., Leja, J., Conroy, C., & Speagle, J. S. 2021, ApJS, 254, 22, doi: 10.3847/1538-4365/abef67
- Jones et al. (2021) Jones, M. G., Bennet, P., Mutlu-Pakdil, B., et al. 2021, ApJ, 919, 72, doi: 10.3847/1538-4357/ac0975
- Junais et al. (2022) Junais, Boissier, S., Boselli, A., et al. 2022, A&A, 667, A76, doi: 10.1051/0004-6361/202244237
- Kaushal et al. (2024) Kaushal, Y., Nersesian, A., Bezanson, R., et al. 2024, ApJ, 961, 118, doi: 10.3847/1538-4357/ad0c4e
- Kawinwanichakij et al. (2017) Kawinwanichakij, L., Papovich, C., Quadri, R. F., et al. 2017, ApJ, 847, 134, doi: 10.3847/1538-4357/aa8b75
- Kawinwanichakij et al. (2021) Kawinwanichakij, L., Silverman, J. D., Ding, X., et al. 2021, ApJ, 921, 38, doi: 10.3847/1538-4357/ac1f21
- Kazantzidis et al. (2011) Kazantzidis, S., Łokas, E. L., Callegari, S., Mayer, L., & Moustakas, L. A. 2011, ApJ, 726, 98, doi: 10.1088/0004-637X/726/2/98
- Killi et al. (2023) Killi, M., Watson, D., Brammer, G., et al. 2023, arXiv e-prints, arXiv:2312.03065, doi: 10.48550/arXiv.2312.03065
- Kiyota et al. (2025) Kiyota, T., Ando, M., Tanaka, M., et al. 2025, ApJ, 980, 104, doi: 10.3847/1538-4357/ada5f4
- Koekemoer et al. (2011) Koekemoer, A. M., Faber, S. M., Ferguson, H. C., et al. 2011, ApJS, 197, 36, doi: 10.1088/0067-0049/197/2/36
- Kravtsov & Borgani (2012) Kravtsov, A. V., & Borgani, S. 2012, ARA&A, 50, 353, doi: 10.1146/annurev-astro-081811-125502
- Kriek & Conroy (2013) Kriek, M., & Conroy, C. 2013, ApJ, 775, L16, doi: 10.1088/2041-8205/775/1/L16
- Kuchner et al. (2017) Kuchner, U., Ziegler, B., Verdugo, M., Bamford, S., & Häußler, B. 2017, A&A, 604, A54, doi: 10.1051/0004-6361/201630252
- Lambas et al. (1992) Lambas, D. G., Maddox, S. J., & Loveday, J. 1992, MNRAS, 258, 404, doi: 10.1093/mnras/258.2.404
- Lange et al. (2015) Lange, R., Driver, S. P., Robotham, A. S. G., et al. 2015, MNRAS, 447, 2603, doi: 10.1093/mnras/stu2467
- Lee & Jang (2016) Lee, M. G., & Jang, I. S. 2016, ApJ, 831, 108, doi: 10.3847/0004-637X/831/1/108
- Lee et al. (2017) Lee, M. G., Kang, J., Lee, J. H., & Jang, I. S. 2017, ApJ, 844, 157, doi: 10.3847/1538-4357/aa78fb
- Leja et al. (2019) Leja, J., Carnall, A. C., Johnson, B. D., Conroy, C., & Speagle, J. S. 2019, ApJ, 876, 3, doi: 10.3847/1538-4357/ab133c
- Leja et al. (2017) Leja, J., Johnson, B. D., Conroy, C., van Dokkum, P. G., & Byler, N. 2017, ApJ, 837, 170, doi: 10.3847/1538-4357/aa5ffe
- Leja et al. (2022) Leja, J., Speagle, J. S., Ting, Y.-S., et al. 2022, ApJ, 936, 165, doi: 10.3847/1538-4357/ac887d
- Looser et al. (2023) Looser, T. J., D’Eugenio, F., Maiolino, R., et al. 2023, arXiv e-prints, arXiv:2306.02470, doi: 10.48550/arXiv.2306.02470
- Looser et al. (2024) —. 2024, Nature, 629, 53, doi: 10.1038/s41586-024-07227-0
- Lotz et al. (2017) Lotz, J. M., Koekemoer, A., Coe, D., et al. 2017, ApJ, 837, 97, doi: 10.3847/1538-4357/837/1/97
- Lu et al. (2014) Lu, Z., Mo, H. J., Lu, Y., et al. 2014, MNRAS, 439, 1294, doi: 10.1093/mnras/stu016
- Ma et al. (2018) Ma, X., Hopkins, P. F., Garrison-Kimmel, S., et al. 2018, MNRAS, 478, 1694, doi: 10.1093/mnras/sty1024
- Mahler et al. (2018) Mahler, G., Richard, J., Clément, B., et al. 2018, MNRAS, 473, 663, doi: 10.1093/mnras/stx1971
- Marasco et al. (2023) Marasco, A., Poggianti, B. M., Fritz, J., et al. 2023, MNRAS, 525, 5359, doi: 10.1093/mnras/stad2604
- Marchesini et al. (2023) Marchesini, D., Brammer, G., Morishita, T., et al. 2023, ApJ, 942, L25, doi: 10.3847/2041-8213/acaaac
- Martig et al. (2009) Martig, M., Bournaud, F., Teyssier, R., & Dekel, A. 2009, ApJ, 707, 250, doi: 10.1088/0004-637X/707/1/250
- Mathews et al. (2023) Mathews, E. P., Leja, J., Speagle, J. S., et al. 2023, ApJ, 954, 132, doi: 10.3847/1538-4357/ace720
- McLure et al. (2013) McLure, R. J., Pearce, H. J., Dunlop, J. S., et al. 2013, MNRAS, 428, 1088, doi: 10.1093/mnras/sts092
- Merritt et al. (2016) Merritt, A., van Dokkum, P., Danieli, S., et al. 2016, ApJ, 833, 168, doi: 10.3847/1538-4357/833/2/168
- Mihos et al. (2015) Mihos, J. C., Durrell, P. R., Ferrarese, L., et al. 2015, ApJ, 809, L21, doi: 10.1088/2041-8205/809/2/L21
- Mo & Mao (2002) Mo, H. J., & Mao, S. 2002, MNRAS, 333, 768, doi: 10.1046/j.1365-8711.2002.05416.x
- Moore et al. (1996) Moore, B., Katz, N., Lake, G., Dressler, A., & Oemler, A. 1996, Nature, 379, 613, doi: 10.1038/379613a0
- Moore et al. (1998) Moore, B., Lake, G., & Katz, N. 1998, ApJ, 495, 139, doi: 10.1086/305264
- Moore et al. (1999) Moore, B., Lake, G., Quinn, T., & Stadel, J. 1999, MNRAS, 304, 465, doi: 10.1046/j.1365-8711.1999.02345.x
- Mosleh et al. (2013) Mosleh, M., Williams, R. J., & Franx, M. 2013, ApJ, 777, 117, doi: 10.1088/0004-637X/777/2/117
- Muñoz et al. (2015) Muñoz, R. P., Eigenthaler, P., Puzia, T. H., et al. 2015, ApJ, 813, L15, doi: 10.1088/2041-8205/813/1/L15
- Naab et al. (2009) Naab, T., Johansson, P. H., & Ostriker, J. P. 2009, ApJ, 699, L178, doi: 10.1088/0004-637X/699/2/L178
- Naidu et al. (2024) Naidu, R. P., Matthee, J., Kramarenko, I., et al. 2024, arXiv e-prints, arXiv:2410.01874, doi: 10.48550/arXiv.2410.01874
- Nedkova et al. (2021) Nedkova, K. V., Häußler, B., Marchesini, D., et al. 2021, MNRAS, 506, 928, doi: 10.1093/mnras/stab1744
- Ogiya (2018) Ogiya, G. 2018, MNRAS, 480, L106, doi: 10.1093/mnrasl/sly138
- Ormerod et al. (2024) Ormerod, K., Conselice, C. J., Adams, N. J., et al. 2024, MNRAS, 527, 6110, doi: 10.1093/mnras/stad3597
- Owers et al. (2011) Owers, M. S., Randall, S. W., Nulsen, P. E. J., et al. 2011, ApJ, 728, 27, doi: 10.1088/0004-637X/728/1/27
- Pan et al. (2025) Pan, R., Suess, K. A., Marchesini, D., et al. 2025, arXiv e-prints, arXiv:2504.06334. https://arxiv.org/abs/2504.06334
- Paudel & Ree (2014) Paudel, S., & Ree, C. H. 2014, ApJ, 796, L14, doi: 10.1088/2041-8205/796/1/L14
- Paulino-Afonso et al. (2020) Paulino-Afonso, A., Sobral, D., Darvish, B., et al. 2020, A&A, 633, A70, doi: 10.1051/0004-6361/201834244
- Peng et al. (2002) Peng, C. Y., Ho, L. C., Impey, C. D., & Rix, H.-W. 2002, AJ, 124, 266, doi: 10.1086/340952
- Peng et al. (2010a) —. 2010a, AJ, 139, 2097, doi: 10.1088/0004-6256/139/6/2097
- Peng et al. (2010b) Peng, Y.-j., Lilly, S. J., Kovač, K., et al. 2010b, ApJ, 721, 193, doi: 10.1088/0004-637X/721/1/193
- Pillepich et al. (2018) Pillepich, A., Springel, V., Nelson, D., et al. 2018, MNRAS, 473, 4077, doi: 10.1093/mnras/stx2656
- Price et al. (2024) Price, S. H., Bezanson, R., Labbe, I., et al. 2024, arXiv e-prints, arXiv:2408.03920, doi: 10.48550/arXiv.2408.03920
- Renzini (2006) Renzini, A. 2006, ARA&A, 44, 141, doi: 10.1146/annurev.astro.44.051905.092450
- Richard et al. (2014) Richard, J., Jauzac, M., Limousin, M., et al. 2014, MNRAS, 444, 268, doi: 10.1093/mnras/stu1395
- Safarzadeh & Scannapieco (2017) Safarzadeh, M., & Scannapieco, E. 2017, ApJ, 850, 99, doi: 10.3847/1538-4357/aa94c8
- Sales et al. (2020) Sales, L. V., Navarro, J. F., Peñafiel, L., et al. 2020, MNRAS, 494, 1848, doi: 10.1093/mnras/staa854
- Samuel et al. (2023) Samuel, J., Pardasani, B., Wetzel, A., et al. 2023, MNRAS, 525, 3849, doi: 10.1093/mnras/stad2576
- Sánchez-Blázquez et al. (2006) Sánchez-Blázquez, P., Peletier, R. F., Jiménez-Vicente, J., et al. 2006, MNRAS, 371, 703, doi: 10.1111/j.1365-2966.2006.10699.x
- Santini et al. (2022) Santini, P., Castellano, M., Fontana, A., et al. 2022, ApJ, 940, 135, doi: 10.3847/1538-4357/ac9a48
- Schaefer et al. (2017) Schaefer, A. L., Croom, S. M., Allen, J. T., et al. 2017, MNRAS, 464, 121, doi: 10.1093/mnras/stw2289
- Schlafly & Finkbeiner (2011) Schlafly, E. F., & Finkbeiner, D. P. 2011, ApJ, 737, 103, doi: 10.1088/0004-637X/737/2/103
- Schlegel et al. (1998) Schlegel, D. J., Finkbeiner, D. P., & Davis, M. 1998, ApJ, 500, 525, doi: 10.1086/305772
- Shipley et al. (2018) Shipley, H. V., Lange-Vagle, D., Marchesini, D., et al. 2018, ApJS, 235, 14, doi: 10.3847/1538-4365/aaacce
- Speagle (2020) Speagle, J. S. 2020, MNRAS, 493, 3132, doi: 10.1093/mnras/staa278
- Steinhardt et al. (2020) Steinhardt, C. L., Jauzac, M., Acebron, A., et al. 2020, ApJS, 247, 64, doi: 10.3847/1538-4365/ab75ed
- Stott et al. (2009) Stott, J. P., Pimbblet, K. A., Edge, A. C., Smith, G. P., & Wardlow, J. L. 2009, MNRAS, 394, 2098, doi: 10.1111/j.1365-2966.2009.14477.x
- Suess et al. (2022) Suess, K. A., Leja, J., Johnson, B. D., et al. 2022, ApJ, 935, 146, doi: 10.3847/1538-4357/ac82b0
- Suess et al. (2024) Suess, K. A., Weaver, J. R., Price, S. H., et al. 2024, arXiv e-prints, arXiv:2404.13132, doi: 10.48550/arXiv.2404.13132
- Sun et al. (2023) Sun, G., Faucher-Giguère, C.-A., Hayward, C. C., & Shen, X. 2023, MNRAS, 526, 2665, doi: 10.1093/mnras/stad2902
- Tacchella et al. (2016) Tacchella, S., Dekel, A., Carollo, C. M., et al. 2016, MNRAS, 457, 2790, doi: 10.1093/mnras/stw131
- Tacchella et al. (2019) Tacchella, S., Diemer, B., Hernquist, L., et al. 2019, MNRAS, 487, 5416, doi: 10.1093/mnras/stz1657
- Thomas et al. (2005) Thomas, D., Maraston, C., Bender, R., & Mendes de Oliveira, C. 2005, ApJ, 621, 673, doi: 10.1086/426932
- Thomas et al. (2010) Thomas, D., Maraston, C., Schawinski, K., Sarzi, M., & Silk, J. 2010, MNRAS, 404, 1775, doi: 10.1111/j.1365-2966.2010.16427.x
- Toloba et al. (2016) Toloba, E., Sand, D. J., Spekkens, K., et al. 2016, ApJ, 816, L5, doi: 10.3847/2041-8205/816/1/L5
- Trager et al. (2000) Trager, S. C., Faber, S. M., Worthey, G., & González, J. J. 2000, AJ, 120, 165, doi: 10.1086/301442
- Travascio et al. (2024) Travascio, A., Cantalupo, S., Tozzi, P., et al. 2024, arXiv e-prints, arXiv:2410.03933, doi: 10.48550/arXiv.2410.03933
- Tremmel et al. (2020) Tremmel, M., Wright, A. C., Brooks, A. M., et al. 2020, MNRAS, 497, 2786, doi: 10.1093/mnras/staa2015
- Trujillo et al. (2011) Trujillo, I., Ferreras, I., & de La Rosa, I. G. 2011, MNRAS, 415, 3903, doi: 10.1111/j.1365-2966.2011.19017.x
- Trussler et al. (2025) Trussler, J. A. A., Conselice, C. J., Adams, N., et al. 2025, MNRAS, doi: 10.1093/mnras/staf213
- Übler et al. (2014) Übler, H., Naab, T., Oser, L., et al. 2014, MNRAS, 443, 2092, doi: 10.1093/mnras/stu1275
- Valentinuzzi et al. (2011) Valentinuzzi, T., Poggianti, B. M., Fasano, G., et al. 2011, A&A, 536, A34, doi: 10.1051/0004-6361/201117522
- van der Burg et al. (2017) van der Burg, R. F. J., Hoekstra, H., Muzzin, A., et al. 2017, A&A, 607, A79, doi: 10.1051/0004-6361/201731335
- van der Walt et al. (2011) van der Walt, S., Colbert, S. C., & Varoquaux, G. 2011, CSE, 13, 22, doi: 10.1109/MCSE.2011.37
- van der Wel et al. (2012) van der Wel, A., Bell, E. F., Häussler, B., et al. 2012, ApJS, 203, 24, doi: 10.1088/0067-0049/203/2/24
- van der Wel et al. (2014a) van der Wel, A., Franx, M., van Dokkum, P. G., et al. 2014a, ApJ, 788, 28, doi: 10.1088/0004-637X/788/1/28
- van der Wel et al. (2014b) van der Wel, A., Chang, Y.-Y., Bell, E. F., et al. 2014b, ApJ, 792, L6, doi: 10.1088/2041-8205/792/1/L6
- van Dokkum et al. (2015a) van Dokkum, P. G., Abraham, R., Merritt, A., et al. 2015a, ApJ, 798, L45, doi: 10.1088/2041-8205/798/2/L45
- van Dokkum & Stanford (2003) van Dokkum, P. G., & Stanford, S. A. 2003, ApJ, 585, 78, doi: 10.1086/345989
- van Dokkum et al. (2010) van Dokkum, P. G., Whitaker, K. E., Brammer, G., et al. 2010, ApJ, 709, 1018, doi: 10.1088/0004-637X/709/2/1018
- van Dokkum et al. (2015b) van Dokkum, P. G., Nelson, E. J., Franx, M., et al. 2015b, ApJ, 813, 23, doi: 10.1088/0004-637X/813/1/23
- van Marrewijk et al. (2024) van Marrewijk, J., Di Mascolo, L., Gill, A. S., et al. 2024, A&A, 689, A41, doi: 10.1051/0004-6361/202348213
- Venhola et al. (2017) Venhola, A., Peletier, R., Laurikainen, E., et al. 2017, A&A, 608, A142, doi: 10.1051/0004-6361/201730696
- Virtanen et al. (2020) Virtanen, P., Gommers, R., Oliphant, T. E., et al. 2020, Nature Methods, 17, 261, doi: 10.1038/s41592-019-0686-2
- Visvanathan & Sandage (1977) Visvanathan, N., & Sandage, A. 1977, ApJ, 216, 214, doi: 10.1086/155464
- Wang et al. (2024) Wang, B., Leja, J., Atek, H., et al. 2024, ApJ, 963, 74, doi: 10.3847/1538-4357/ad187c
- Waskom (2021) Waskom, M. L. 2021, Journal of Open Source Software, 6, 3021, doi: 10.21105/joss.03021
- Weaver et al. (2023) Weaver, J. R., Davidzon, I., Toft, S., et al. 2023, A&A, 677, A184, doi: 10.1051/0004-6361/202245581
- Weaver et al. (2024) Weaver, J. R., Cutler, S. E., Pan, R., et al. 2024, ApJS, 270, 7, doi: 10.3847/1538-4365/ad07e0
- Wetzel et al. (2013) Wetzel, A. R., Tinker, J. L., Conroy, C., & van den Bosch, F. C. 2013, MNRAS, 432, 336, doi: 10.1093/mnras/stt469
- Whitaker et al. (2014) Whitaker, K. E., Franx, M., Leja, J., et al. 2014, ApJ, 795, 104, doi: 10.1088/0004-637X/795/2/104
- Whitaker et al. (2017) Whitaker, K. E., Bezanson, R., van Dokkum, P. G., et al. 2017, ApJ, 838, 19, doi: 10.3847/1538-4357/aa6258
- Whitaker et al. (2025) Whitaker, K. E., Cutler, S. E., Chandar, R., et al. 2025, arXiv e-prints, arXiv:2501.07627, doi: 10.48550/arXiv.2501.07627
- Williams et al. (2009) Williams, R. J., Quadri, R. F., Franx, M., van Dokkum, P., & Labbé, I. 2009, ApJ, 691, 1879, doi: 10.1088/0004-637X/691/2/1879
- Wright et al. (2019) Wright, R. J., Lagos, C. d. P., Davies, L. J. M., et al. 2019, MNRAS, 487, 3740, doi: 10.1093/mnras/stz1410
- Yagi et al. (2016) Yagi, M., Koda, J., Komiyama, Y., & Yamanoi, H. 2016, ApJS, 225, 11, doi: 10.3847/0067-0049/225/1/11
- Yang et al. (2024) Yang, L., Silverman, J., Oguri, M., et al. 2024, MNRAS, 531, 4006, doi: 10.1093/mnras/stae1374
- Yoon et al. (2023) Yoon, Y., Kim, J.-W., & Ko, J. 2023, ApJ, 957, 59, doi: 10.3847/1538-4357/acfed5