DeepGreen: Effective LLM-Driven Green-washing Monitoring System Designed for Empirical Testing —Evidence from China
Abstract
This paper proposes DeepGreen, an Large Language Model Driven (LLM-Driven) system for detecting corporate green-washing behaviour. Utilizing dual-layer LLM analysis, DeepGreen preliminarily identifies potential green keywords in financial statements and then assesses their implementation degree via iterative semantic analysis of LLM. A core variable GreenImplement is derived from the ratio from the two layers’ output. We extract 204 financial statements of 68 companies from A-share market over three years, comprising 89,893 words, and analyse them through DeepGreen. Our analysis, supported by violin plots and K-means clustering, reveals insights and validates the variable against the Huazheng ESG rating. It offers a novel perspective for regulatory agencies and investors, serving as a proactive monitoring tool that complements traditional methods.Empirical tests show that green implementation can significantly boost the asset return rate of companies, but there is heterogeneity in scale. Small and medium-sized companies have limited contribution to asset return via green implementation, so there is a stronger motivation for green-washing.
Keywords Green-washing Monitoring Large Language Models Financial Statement Analysis Unstructured Data Analysis
1 Introduction
Amid intensifying global focus on sustainable development and environmental protection, the phenomenon of corporate “green-washing” has emerged as a contentious issue. “Green-washing” typically refers to those companies exaggerating or misrepresenting their environmental protection efforts in promotional materials, while their actual practices fail to meet sustainable development standards [1]. However, a more elusive challenge lies in “general green-washing”, which involves subtler tactics that distort perceptions by repeatedly invoking terms such as “carbon peak” or “green development” without substantive evidence [2].
The elusiveness of general green-washing stems from its exploitation of human psychology and information processing mechanisms. By strategically emphasizing environmentally related terminology, companies construct a superficial image of environmental responsibility [3]. Furthermore, this behaviour leverages information asymmetry, creating a barrier that prevents analysts and consumers from accurately distinguishing between genuine and misleading environmental commitments [4]. Such strategic manipulation not only undermines the credibility of corporate sustainability claims but also complicates accountability efforts regarding environmental impact.
In the face of these challenges, there is a pressing need for advanced analytical tools that can efficiently and accurately detect instances of green-washing, particularly in the complex landscape of financial reporting. However, traditional methods, such as manual review and basic keyword frequency analysis, often fall short due to the sheer volume of data and the sophistication of general green-washing tactics [5]. These methods are time-consuming, prone to human error, and lack the depth required to uncover subtle discrepancies between corporate claims and actual practices.
Recent advancements in artificial intelligence, especially Large Language Models (LLMs), offer promising solutions to these limitations [6]. LLMs, with their ability to process and understand vast amounts of textual data, provide a powerful means of analysing financial statements and other corporate disclosures. The recent emergence of DeepSeek-V3 [7] and DeepSeek-R1 [8] further demonstrates the unparalleled potential of LLM in natural language processing (NLP). By leveraging their powerful NLP capabilities, LLMs can not only identify specific keywords related to environmental claims but also contextualize these terms within the broader narrative of a company’s sustainability efforts. This enables a more nuanced and accurate assessment of the authenticity of corporate environmental commitments.
Building on these capabilities, this paper introduces DeepGreen, an innovative dual-layer analysis framework that harnesses LLMs to detect green-washing behaviour. This systematic and data-driven method addresses the elusiveness of general green-washing by providing a quantifiable measure of a company’s green-washing tendencies.
The contributions of our paper are listed as follows:
(1) This paper proposes DeepGreen, an innovative dual-layer LLM-based analysis framework that effectively detects corporate green-washing behaviour by quantifying the discrepancy between green claims and actual implementation. This framework provides a novel perspective for regulatory agencies and investors, serving as a proactive monitoring tool that complements traditional methods.
(2) We develop a core variable, , which is derived from the ratio of implemented green practices to total green claims identified through LLM analysis. This variable offers a quantifiable measure of green-washing tendencies, enhancing the detection of subtle discrepancies between corporate claims and actual practices.
(3) We validate the effectiveness of via several empirical tests and comparison with the Huazheng ESG rating. Our analysis demonstrates that the indicator is robust and correlates closely with traditional ESG ratings, reinforcing its reliability as a complementary monitoring tool.
(4) We demonstrate that the implementation of genuine green practices can positively impact companies’ financial performance, as evidenced by the strong positive relationship between and asset return ratio (). From the perspective of heterogeneity, we have discovered the of small and medium-sized companies I. It has little effect on promoting their own profits, revealing the potential motivation for small and medium-sized companies to go green, and providing potential reference for policy-making.
The reminder of this paper are arranged in the following order: We first introduce the related work in the field of textural analysis, traditional methods for green-washing monitoring and obstacles of LLM-based systems (§ 2). Then, we represent DeepGreen’s framework overview and its technical and mathematical details of each layer (§ 3). After that, we show our raw dataset’s overview before our experiment and the results and its analysis after the experiments (§ 4), verifying the effectiveness of our indicators from a qualitative perspective. Subsequently, we validate the effectiveness of our indicators quantitatively through empirical testing (§ 5). After completing all the analysis work, we discussed our methods and contributions (§ 6). Finally, we summarize our work and prospect further potential research directions (§ 7).
2 Related Work
This paper investigates the capabilities of LLMs on green-washing monitoring. We aim to provide a comprehensive overview of the current landscape and identify key areas for future research and development. In this regard, this section reviews the existing text analysis methods for financial statements (§ 2.1), which provide a foundation for understanding how textual data can be leveraged to detect potential discrepancies. We also explore the traditional methods in green-washing monitoring (§ 2.2), highlighting their strengths and limitations in the context of evolving corporate sustainability practices. Finally, we delve into the difficulties in LLM-based green-washing monitoring (§ 2.3), examining the unique challenges that arise when deploying advanced language models for this purpose.
2.1 Text Analysis methods for Financial Statements
Financial statements are usually included in a company’s annual report, serving as a mirror that reflects the financial status and operating information. Today’s financial statements have undergone a transformation from simple financial reports to being promoted and presented to investors [9]. In order to meet social, policy, regulatory, and other requirements, longer and more complex textual information is included in the financial statements [10, 11]. Analysing a large amount of textual information greatly increases the time cost to investors [12]. Meanwhile, the organization and utilization of textual information require greater integration costs, often causing investors to overlook some effective information and leading to decision-making biases [13]. Therefore, the urgent demand of efficient analysis for financial context provides opportunities for the widespread application of text analysis tools.
Researches initially focus on how to extract keywords that investors are concerned about from financial statements. Most of these studies are inspired by Bag of Words (BoW) [14] and achieves keyword frequency statistics by adopting a unique encoding method for text, represented by “textrank” [15]. They can complete some simple tasks, such as dividing words and classifying statistics.
Subsequently, word vector representation techniques which converting text into word vectors emerged (e.g., Word2Vec [16], BERT[17]). After the emergence of technological methods, some studies have started to use these word frequency statistics for empirical analysis. When evaluating the quality and risk of a company’s information disclosure, [18] utilizes the frequency of specific vocabulary as a key variable and reveals that the company’s financial condition is closely related to market reactions. [19] uses word frequency statistics to measure the level of detail in information disclosure, in order to study the problem of information asymmetry. [20] also employs word frequency statistics in financial statements as an important tool for identifying financial fraud, which has achieved significant results.
With the enhancement of practical computility, some theoretical models of natural language processing (NLP) have been implemented. Large language models (LLMs) based on Transformer architecture [21] show potential on several text analysis tasks. Some of the representative ones are GPT-4 [22], LLaMA-3 [23]. They demonstrate powerful advantages in massive text reading, context understanding, and keyword extraction tasks [24, 25]. These applications highlight the growing role of text analysis tools in efficiently interpreting financial data.
2.2 Traditional methods in Green-washing Monitoring
Compared with clear numerical indicators in financial statement tables, although word frequency statistics and analysis techniques have improved the efficiency of investors and researchers, it is still difficult to accurately grasp some attitude that can only be reflected in unstructured text [26].
With the increasing attention of investors and regulatory agencies to Environment, Social, Governance (ESG), companies are facing enormous pressure to enhance ESG performance [27]. It is common for some financial statements to extensively repeat green keywords in the text to “wash away” the company’s ESG problems, as some psychological studies have revealed that human might consider repeated words to be more important [28, 29]. This kind of operation leads to a worrying phenomenon of “green-washing” [30].
Recent research indicates that the investors will combine third-party ratings and on-site inspections to avoid green-washing when evaluating a company’s ESG performance [31], but this strict scrutiny might also bring huge cost. There is also study that monitors green-washing behaviour through feedback from consumers and investors, but due to their limited professional knowledge, it also struggle to accurately judge a company’s true environmental performance [5]. Besides, research has also demonstrated that relying solely on word frequency statistics cannot solve such problem, and the current mainstream method is to establish an ESG dictionary in advance and then match keyword semantics [32]. And due to the high instability of traditional LLM answers and the limitations of creating quantitative features, there have been few studies in the past that are willing to use LLM for Green-washing monitoring tasks.
Therefore, how to efficiently, sensibly and accurately monitor corporate green-washing behaviour has become a focus and hotspot in both academia and practice domains [33]. Developing new methods that go beyond manual investigation, word frequency statistics and dictionary evaluation has become a new path for monitoring corporate green-washing behaviour.
2.3 Difficulties in LLM-based Green-washing Monitoring
There is no research on the use of LLMs for the detection of corporate green-washing [34, 35, 36]. However, when we try to utilize LLMs for green-washing monitoring, there’re now facing several obstacles.
Firstly, several studies indicate that LLMs cause hallucinations during content generation [37, 38]. Original LLM agents suffer from unstable input & output, and individual differences [39]. Though developers have designed a number of strategies to mitigate the hallucination problem, the final solution is still unknown [40]. Therefore, using LLM alone to analyze text for financial text analysis statically is never an option.
Secondly, companies mainly choose to disclose their green content in the ESG sector, causing the contradiction between qualitative unstructured ESG information extraction and the demand from quantitative and empirical research creates tremendous challenges in adapting to a uniform framework for studying monitoring green-washing. For instance, [35]’s contribution is staying at the accuracy of disclosure itself, without linking the disclosure rate with important data such as company performance and prospects. [36] failures to anticipate and take corresponding measures to address the green deception behaviour, may lead to a certain degree of bias in empirical results. Semantic understanding and generation capabilities of LLM can be utilized as indicators related to green-washing [41], but the lack of quantitative criteria for defining green-washing behaviour makes “Green-washing detective” difficult to establish across the various companies.
Due to the aforementioned difficulties, both traditional text analysis and directly utilizing LLMs are difficult to accomplish the significant task of monitoring corporate green-washing [42]. As a result, this paper proposes “DeepGreen” designed for empirical testing. Specifically, it achieves green-washing monitoring and solves the two main obstacles above. Firstly, this framework integrates the strengths of LLMs in NLP with the rigour of statistical analysis, providing a comprehensive and quantifiable measure of green-washing tendencies. Secondly, we introduce a novel green-washing indicator, , which quantifies the ratio of implemented green practices to total green claims. Thirdly, we develop an iterative analysis mechanism within DeepGreen to mitigate the hallucination problem commonly associated with LLMs. This mechanism enhances the accuracy and reliability of LLMs in analysing financial texts, ensuring that the generated results are more trustworthy and less prone to errors caused by hallucinations. Lastly, we establish a bridge between qualitative LLM analyses and quantitative empirical analyses through regression modelling. It enables a more comprehensive understanding of green-washing behaviour and its impact on corporate performance.
3 Framework
3.1 Overview
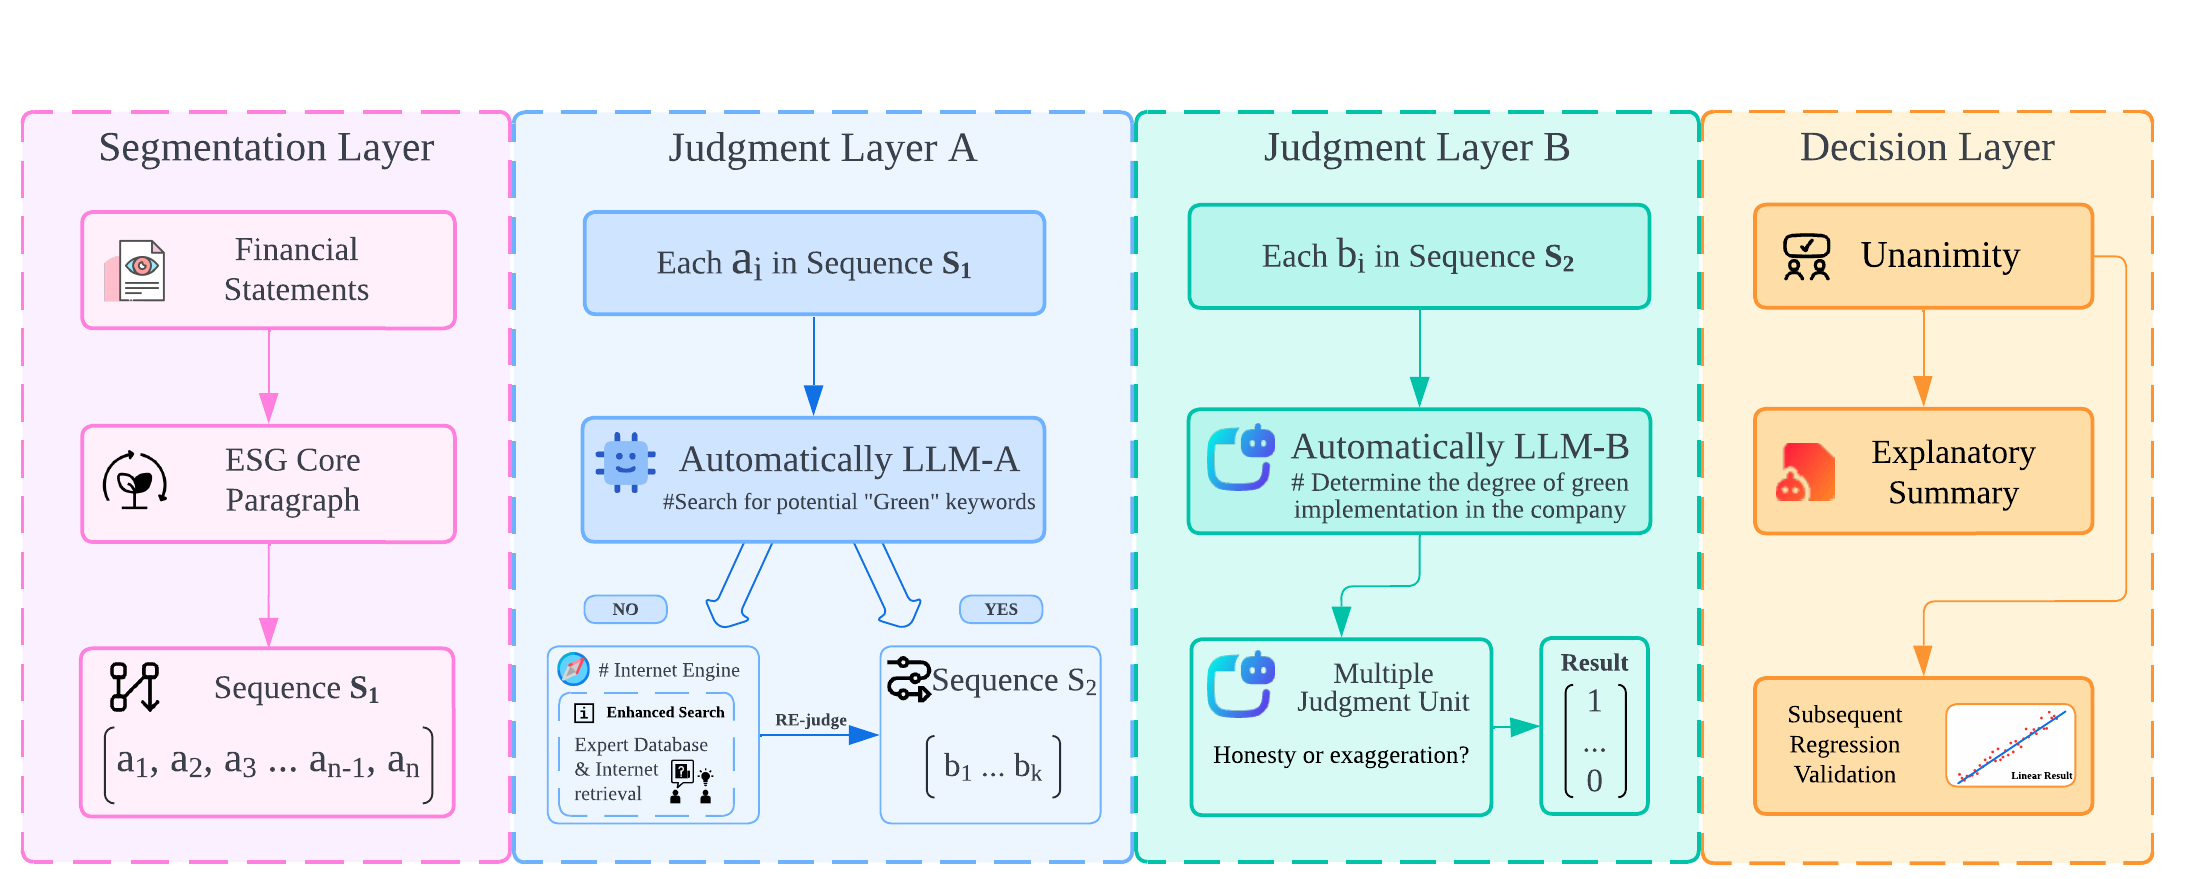
We roughly summarize the DeepGreen workflow in Figure 1, which consists of four layers with LLM agents at its core. It starts with the Segmentation Layer, where financial statements are processed and the extracted ESG core paragraphs will be segmented word for word literally as sequence . The first LLM layer (Judgment Layer A) employs LLM to extract “Green” keywords in each element of , delivering these elements to sequence . In the second LLM layer (Judgment Layer B), LLM agents will filter the implemented green keywords from elements of . Finally, the Decision Layer aggregates results, reaches a consensus, generates an explanatory summary to improve the interpretability and credibility, and generates an indicator to quantify the target company’s green-washing degree for empirical validation. Specifically, we utilize a hybrid approach of “Definition Pre-learning Enhanced Retrieval Iterative Judgment” to reduce the hallucinations of LLM and enhance its performance to monitor green-washing.
3.2 Standardize the Targeted Input Paragraph
Recent studies have indicated that LLMs may exhibit diminished performance on complex tasks when confronted with excessively long input texts, leading to analysis bias and focus errors [43, 44]. Consequently, we retain the ESG sections and employ a long-text-oriented LLM () to review the remaining portions, while refraining from engaging it in detailed analysis. When the LLM proposes the possibility of potential green information for the remaining parts, we adopt a manual inspection approach to determine the trade-off. This step can be expressed using the following formula Equation 1 & Equation 2:
| (1) |
| (2) |
where represents the raw file, is the part extracted by human experts from the remaining part after weighing the opinions of on the remaining part. is the standardized targeted input paragraph, presented in “” format. And function means connecting the two pieces of text.
When the text length is reduced, a broader range of high-performance LLMs can be effectively utilized for more complex tasks. However, at this stage, it is still necessary to perform segmentation to obtain the input sequence . This approach can be formally expressed as shown in Equation 3.
| (3) |
where function is according to the natural sentence division rule of .
3.3 Green Cognition and RAG for Green Keywords Detecting
The premise of monitoring green-washing behaviour is that we need to find green keywords in financial statements as comprehensively as possible. A common practice in practical research is to set a fixed domain and then determine whether the keyword falls within it. However, due to our requirement for LLMs to achieve more flexible and universal operations and tasks, it is not rigorous to pre-set a fixed green domain at this stage. We choose to fine-tune an general LLM to accomplish this task, with the core concept of adjusting LLM’s “green cognition”, and the termination condition of finding green keywords is to maximize the objective function in Equation 4:
| (4) |
where is a judgment module whose state is determined by the following Equation 5:
| (5) |
Here represents the “Green Cognition” of , and it is an parameter that we need to constantly adjust. is the conditional probability which represents the degree of the confidence that is a green keyword based on . Both and are rely on the conditional probability judgment boundary of , representing the lower () and upper () bounds of LLM’s judgment on the concept of “green” in a probabilistic sense. This double boundary is in line with human intuition: when confidence is out of both sides of the boundaries, the conclusion of “yes” or “no” can be directly obtained based on experience; when confidence falls into the middle stage, it simulates the human behaviour of "hesitant judgment", so that by seeking external help, we can achieve better screening of this part and find potential but missed green keywords.
Considering the hesitation part in detail, we utilize RAG method to find additional information from the professional green & environmental protection knowledge database and the Internet. This information is usually a detailed explanation of the hesitating green keyword . By automatically employing RAG only in this situation, we can greatly reduce the cost of information processing and improve the efficiency of our framework. Every time the RAG strategy is enabled, it can be seen as an update to LLM’s “Green Cognition”, which can be expressed as Equation 6:
| (6) |
Through the above process, the output that meet the judgment will constitute the input sequence of the next layer.
Meanwhile, we record the intermediate result as , which is the number of the elements in .
3.4 Iterative Semantic Analysis of Green Implementation
The key to determining whether a company has engaged in green-washing in known statements is to determine the relative ratio between the implemented and empty parts, which is the basic principle of our framework for detecting green-washing behaviour. As a result, we employ an advanced LLM expert for the detailed semantic analysis to determine the implementation status. In this layer, green keywords are placed back into the original text one by one for semantic measurement. However, it should be noted that in order to maximize the accuracy and responsibility of LLM’s analysis, we have adopted an iterative semantic analysis process that gradually expands the scope. Initially, LLM needs to find a minimum discriminative unit that must satisfies:
| (7) |
where is the minimum standard limit for LLM to make a confident judgment on the implementation of green keywords () , and represents the size of the inside element’s scope. Equation 7 determines the initial conditions for iterative judgment, and the core steps of this layer are determined by Equation 9:
| (9) |
is a matrix that stores the judgment results of for the green keyword . can only output value 0 or 1, respectively representing the judgment of unimplemented and implemented, so all values in the matrix are either 0 or 1. The termination condition for this iteration is that for any expanded range starting from a certain , it satisfies Equation 10:
| (10) |
At this point, we call it that there is sufficient confidence that has obtained a consistent judgment result. After performing the same operation on all , and the ratio of the actual number of implemented keywords in this stage to the total is recorded as:
| (11) |
3.5 Green-washing Indicator & Responsible Report Generation
The credibility and interpretability of LLMs have always been a key concern in the financial field [45, 46]. Recent study [47] has proposed many methods to enhance the reliability and effectiveness of LLMs in practical applications, and the common category is to generate natural language explanations for humans.
In the monitoring of green-washing behaviour, the output result being only a numerical indicator may lead to a decrease in persuasiveness and amplify the “black box” problem of LLM. Regarding this, we add a step for generating analysis reports, in which a Long-CoT LLM [48] () can freely call all the resources generated in the previous two layers, while completing the autonomous understanding and execution planning of the report generation task. This process can be simply described as Equation 12:
| (12) |
where is the generated Green Report, is the mark for those green keywords processed by RAG in Judgment Layer A, and is another mark for those in Judgment Layer B. Through the above four layers, it is possible that DeepGreen framework can have capability for both providing an accurate quantitative indicator and generating a detailed and credible green financial analysis report.
4 Experiment Details
4.1 Dataset
Our research aims to find a potential monitoring solution for the green-washing behaviour of companies. To ensure the independence of each analysis as much as possible, both layers of our framework need extensive invocation of LLMs. In order to reduce analysis costs, we stratify the 2021-2023 annual reports of 68 Chinese A-share companies based on assets (, , ), totalling 89893 words in 204 annual reports, as our experimental analysis dataset. We avoid companies labelled as , , , and specifically exclude financial companies, for their evaluation system differs significantly from other industries. Details including the minimum and maximum number of words in among the statement reports ( and ), the total length of all statements (), and the total potential words () are shown in Table 1.
| (Obvs.) | (bit) | (Obvs.) | ||||
|---|---|---|---|---|---|---|
| 75 | 762041 | 10160.55 | 41832 | 64 | 2347 | |
| 54 | 143023 | 2648.57 | 21063 | 105 | 1339 | |
| 75 | 495661 | 6608.81 | 26998 | 66 | 2312 | |
| 204 | 1400725 | 6866.30 | 89893 | / | / |
4.2 Model Setting
In an idealized scenario, it is more appropriate for DeepGreen to use an financial-fine-tuned LLM for analysing financial statement texts. However, in reality, training a dedicated LLM often comes with huge costs, therefore a generic LLM is chosen as an alternative solution to undertake the text analysis work in our experiment.
We deploy a fully open-source and low-cost LLM DeepSeek-V3 [49] in both layers, whose performance is not inferior to the current state-of-the-art OpenAI flagship product GPT-4o [50], ensuring that the model performance meets the needs of large-scale analysis, and still provides the possibility for enterprises to train their own low-cost financial models and apply them to the framework.
4.3 Results
4.3.1 Manually Classified Green Matching Degree: Violin Plot
In this section, we provide some possible reasons based on empirical evidence as a preliminary analysis of our experimental below.
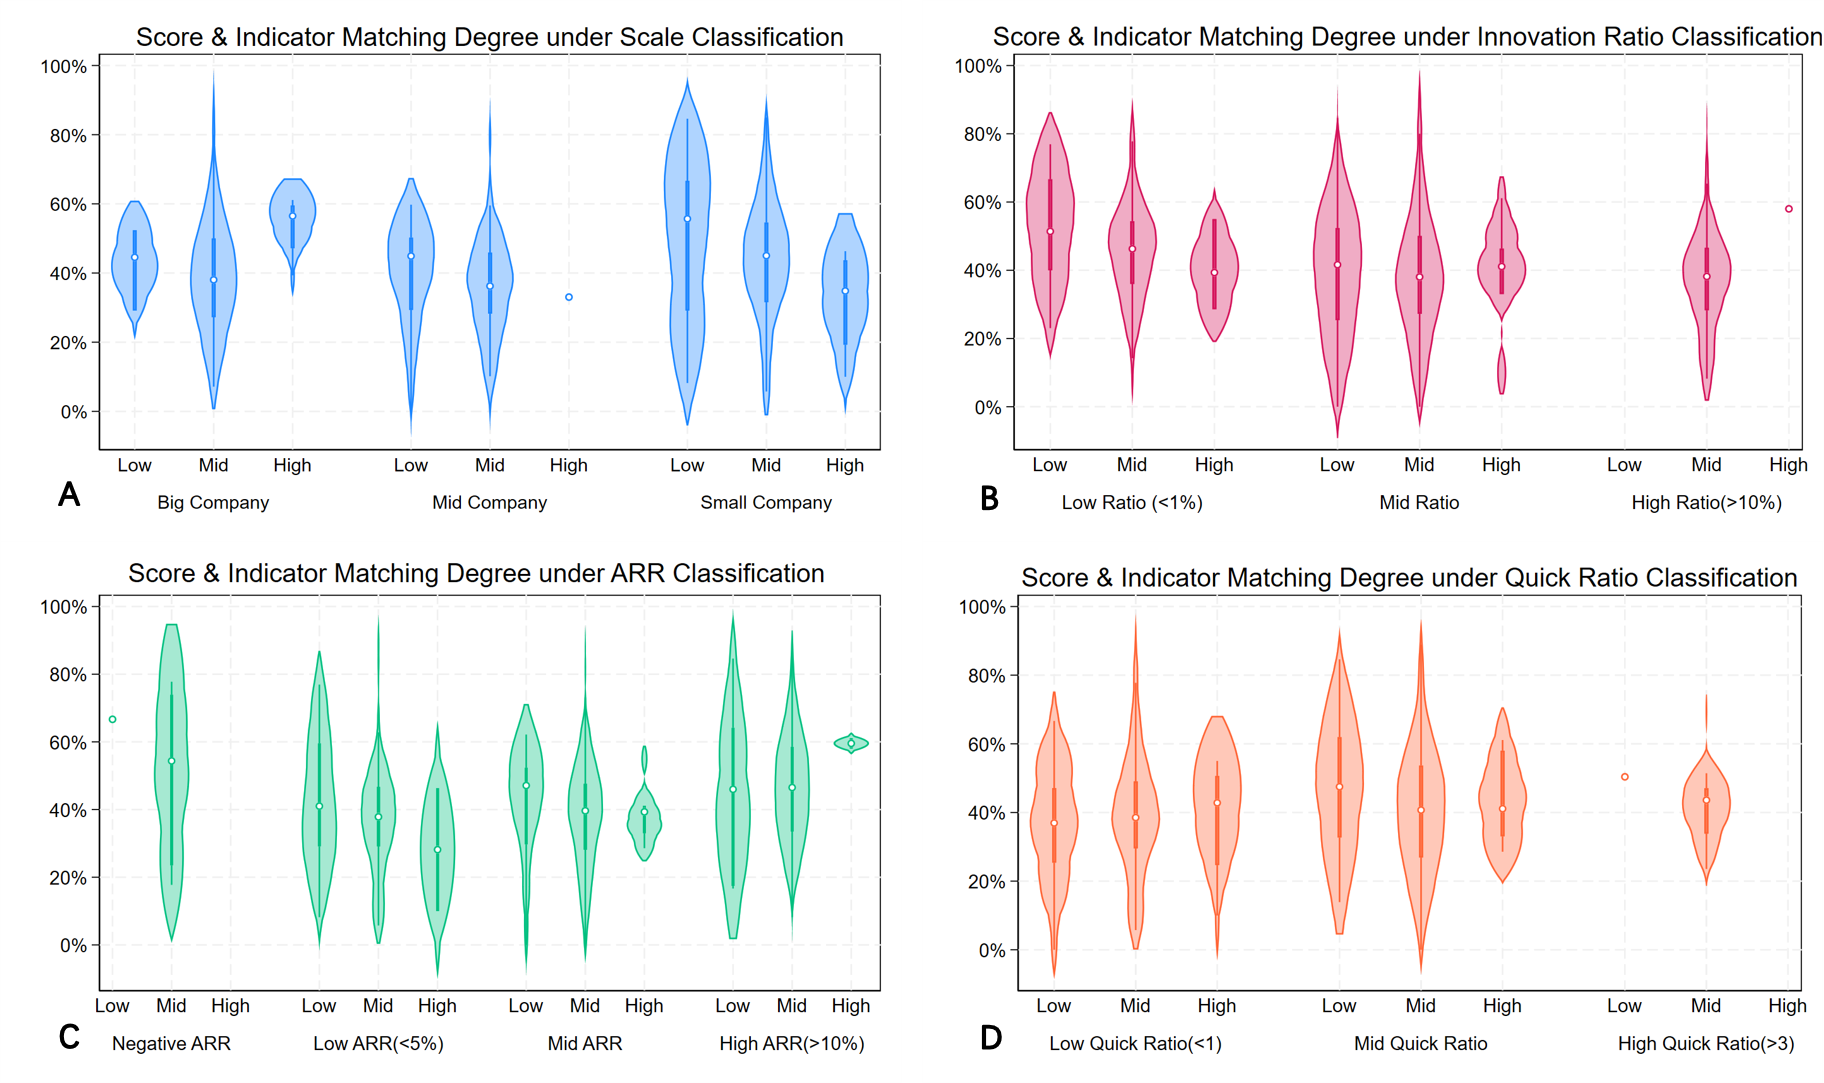
From Figure 2, we easily obtain some clues about the green-washing of companies. The classification of scale is based on the latest relevant documents (2017) issued by National Bureau of Statistics of China. The Innovation Ratio and Quick Ratio are manually divided into three intervals according to empirical values, while the ARR takes into account those negative values. This graph shows the mean and distribution of the experiment’s result under four different categorical variables. We ignore the outliers with too few samples and observe that:
(1) Sub-figure A shows that the high Huazheng ESG score of large companies are truly deserving, presenting a distribution of high green implementation and a positive relationship. This may be due to the fact that large companies have more complete management systems, are subject to stricter regulation, and are more valued by the market, resulting in greater risks and costs of their “green-washing”. The reason might also be the large companies themselves, which have more scientific production and operation systems, providing more truthful statements in the ESG report section. However, the high Huazheng ESG score of small and medium-sized companies seem not to live up to their names. Although some of them have achieved medium to high ESG scores, their level of green implementation is relatively low. This suggests that these companies might have improved their score level through “green-washing”, while some small and medium-sized companies have achieved high levels of green implementation but received lower scores. We suppose that although they have truthfully reported their innovation and application of green technologies, their limited scale, incomplete green management systems and insufficient green innovation, result in low ESG scores with a high indicator.
(2) Sub-figure B focuses on different . It can be clearly observed that for medium-to-high innovation level companies, an increase in the ratio of innovation expense does not have a significant impact on Huazheng ESG score. This indicates that the innovation expense ratio represents a threshold, and doesn’t mean the more available funds a company leans towards innovation, the better the ESG score will be. Companies with low innovation ratio achieve higher ESG scores with lower implementation levels, even those with lower implementation levels receive higher Huazheng ESG score, implying potential “green-washing” behaviour. Additionally, although companies with low innovation ratio and low ESG score have relatively high green implementation degree, they are often limited by their innovation capabilities and have a lower “upper bound”, making it difficult to achieve the entire process of green.
(3) Sub-figure C shows the classifications. Companies with negative are mainly concentrated in medium Huazheng ESG scores, and the degree of implementation is actually not too low. This phenomenon might because that these companies can’t afford the additional negative effects brought about by the disclosure of green-washing behaviour, such as administrative fines and market disappointment, which will make the company’s financial situation extremely worse. Another reason may be that large amount of funds invested in green innovation projects under construction have not yet brought significant green benefits. While companies with low to medium but high Huazheng ESG scores show a low degree of reality, indicating the possibility of potential “green-washing” behaviour by such companies. High companies demonstrate high implementation in high ESG scores, possibly because they have already built sound green production processes, enjoyed the dividends brought by green innovation achievements, and thus received the deserved scores.
(4) Sub-figure D uses as a classification metric to further explore our green implementation indicator and Huazheng’s standard scores. Companies with high don’t achieve the corresponding high ESG scores and are concentrated in medium scores. As a company with a high has sufficient liquidity to repay short-term liabilities, there is no obvious default risk. Therefore, the company will choose to use these short-term liabilities to earn higher returns. Although green innovation can bring policy rewards and other dividends, it may not be the most profitable path, and the company may not vigorously promote the development of its own green field. Consequently, they obtain moderate Huazheng ESG scores and normal green implementation. Medium companies have limited liquidity and need to plan their short-term liabilities more carefully when obtaining the highest possible returns. However, building a green production process is a long-term and high investment project that may bring liquidity risks to these companies, making them more inclined to exhibit certain “green-washing” behaviour. Companies with low have poor liquidity and weak short-term debt paying ability. They tend to directly obtain policy dividends and avoid exposing themselves to short-term debt crises. They vigorously promote green innovation projects and construction, which to some extent exacerbates short-term debt paying risks, but the subsidies provided by policy advocacy for green development can compensate for this gap, thus demonstrating the consistency between the implementation level of low companies and Huazheng ESG scores.
4.3.2 Eliminating Human Interference: K-means Clustering
In this section, we analyse the joint distribution of green implementation indicators, Huazheng ESG index, and categorical variable (). We utilize the K-means clustering method for clustering and perform three and four classification operations respectively to improve the accuracy and stability and eliminate interference from human classification decision. In K-Means processing, we choose the traditional Euclidean distance as a measurement criterion:
| (13) |
Here we set as the absolute difference between the Huazheng ESG index and our indicator, where we map the beforehand Huazheng ESG index to interval as . Then we obtain:
| (14) |
And the distribution we study is . Three cluster and four cluster analyses are conducted separately and shown below in Figure 3, The results of Three-Centre cluster are displayed in figure AD, and Four-Centre cluster results are shown in figure EH.
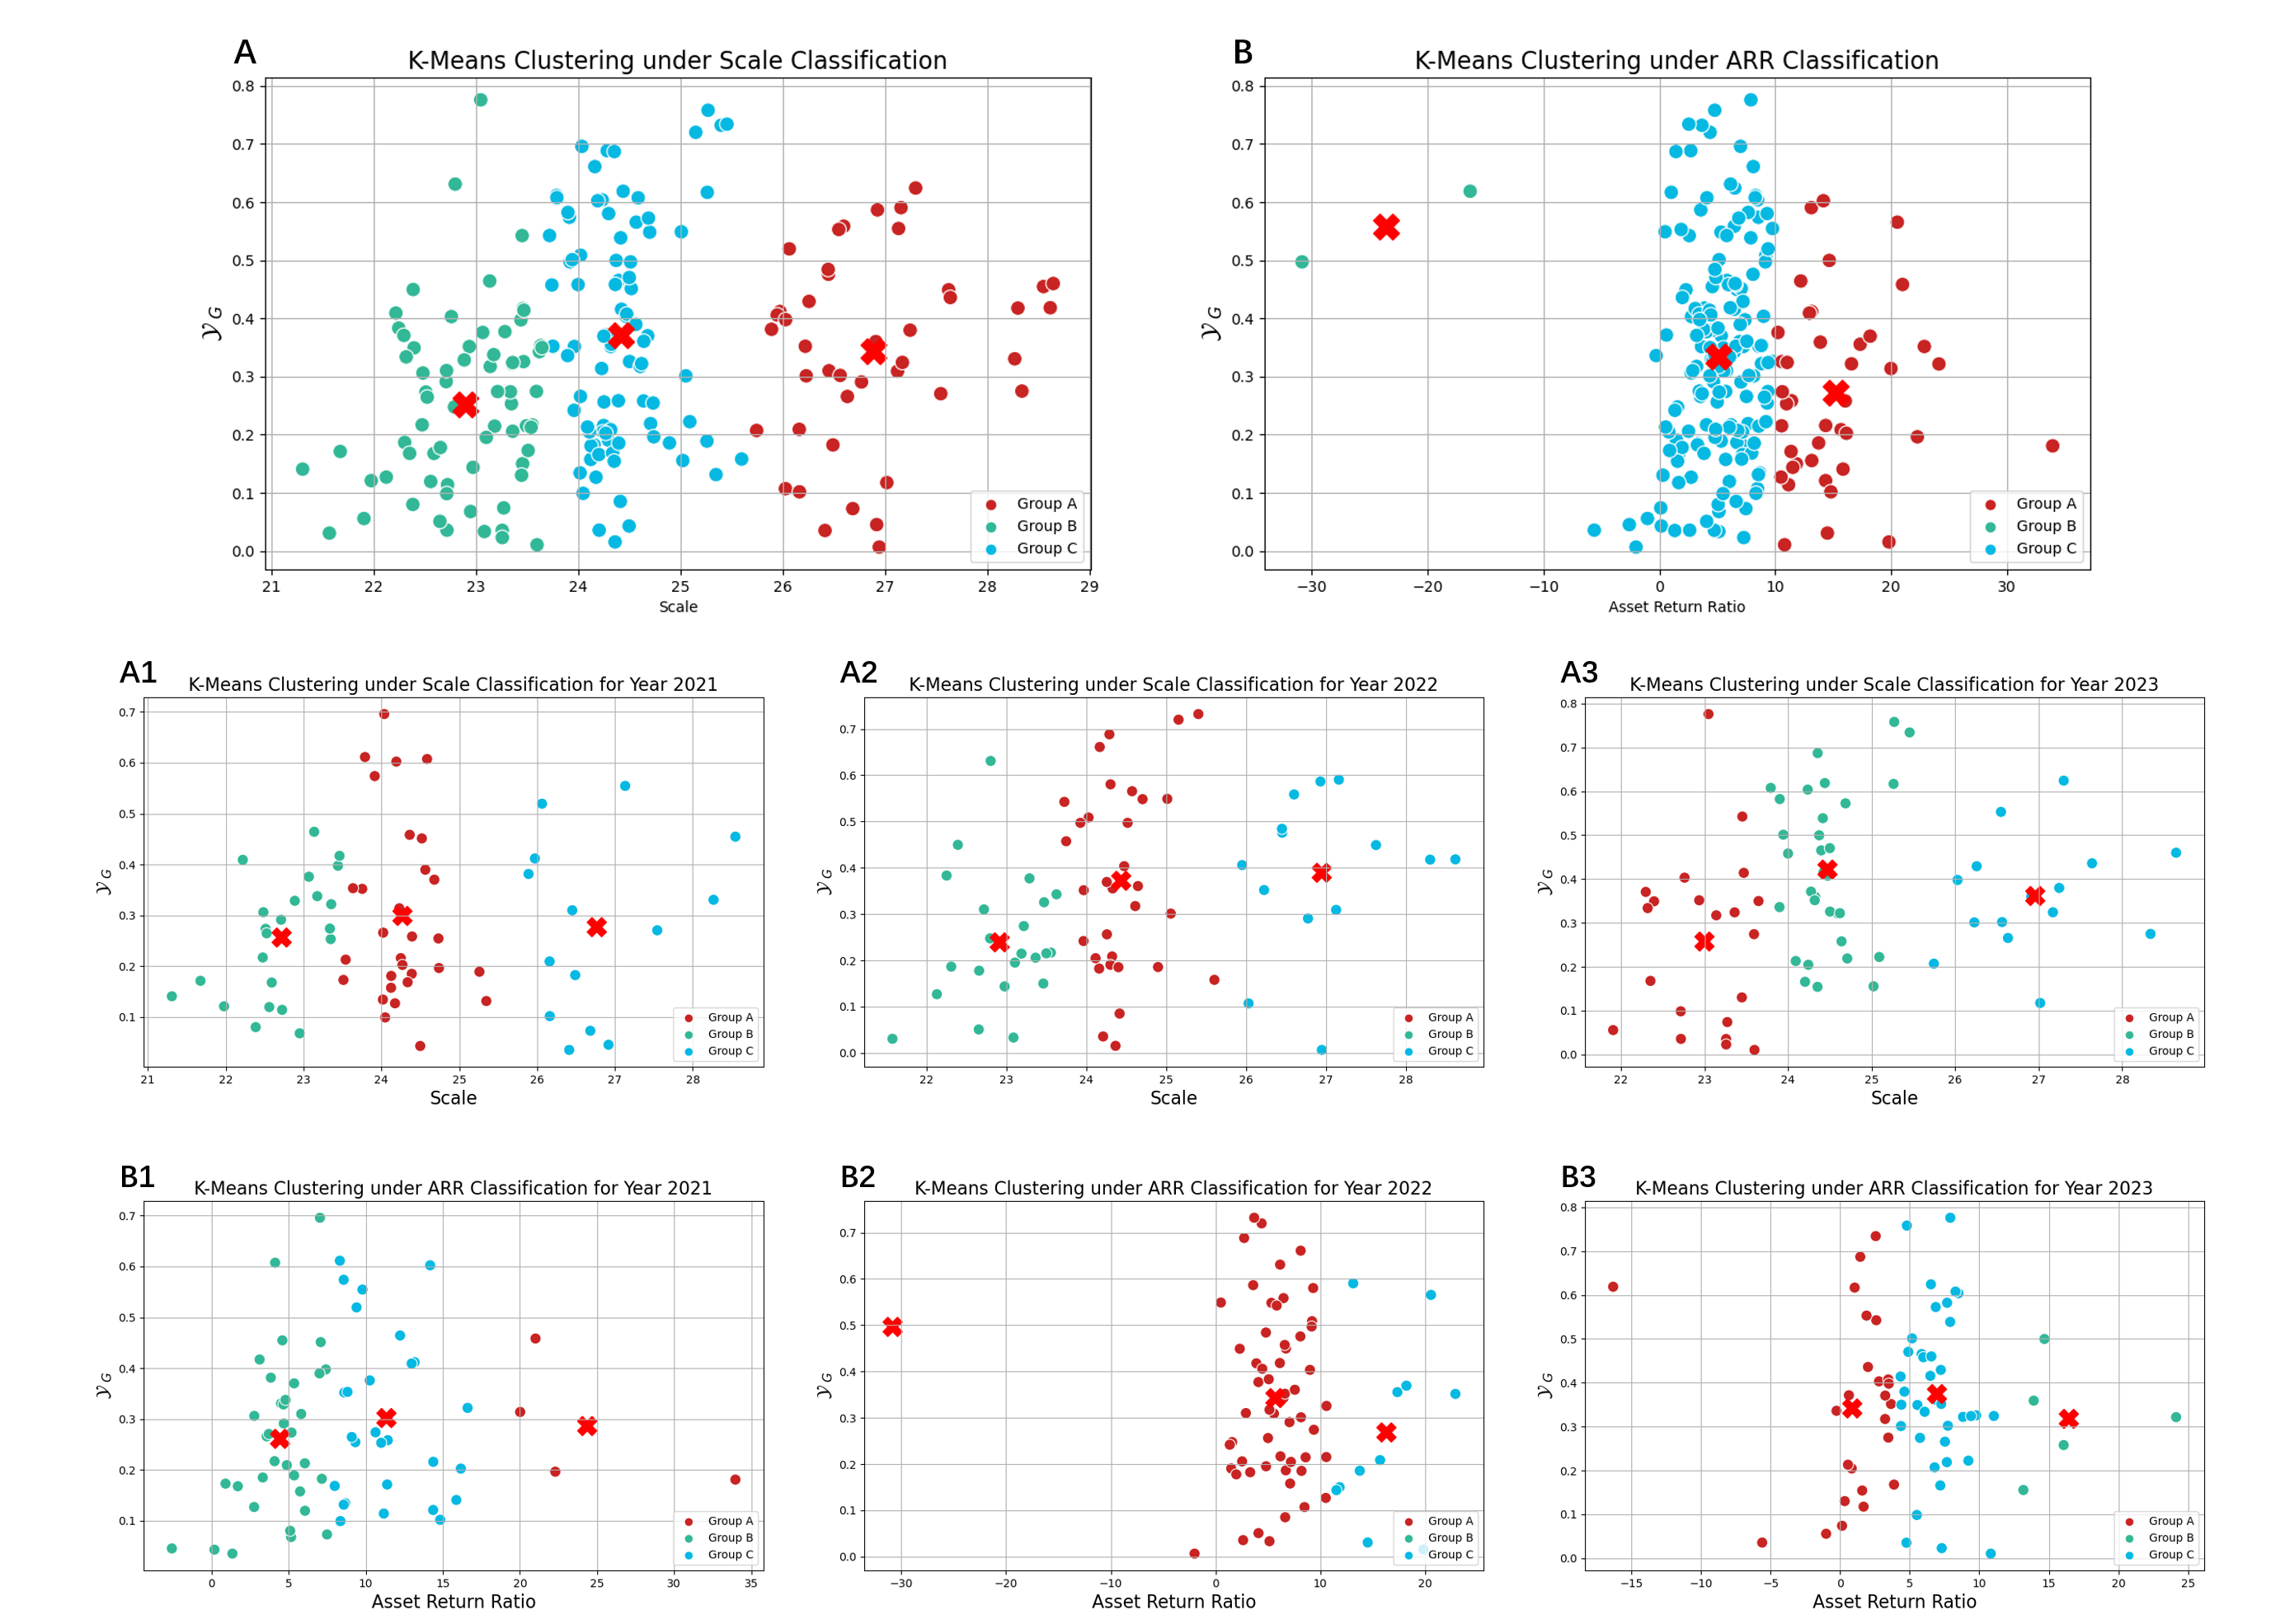
We also ignore the outliers with too few samples and some conclusions can be drawn from the cluster analysis of the dataset:
(1) From sub-figure A, we find that our indicator and Huazheng ESG index are more consistent in small-scale companies. The advantage of large companies in terms of size can demonstrate a greater degree of green innovation and perform better in fulfilling responsibilities such as green processing. At the same time, large companies have strict regulatory and market attention supervision effects, so that rating agencies can use these obvious characteristics to conduct ESG scores. Smaller companies are difficult to establish a comprehensive green production and operation system, and rating agencies have to verify the specific situation more carefully. Therefore, the implementation of green policies is more considered in the rating agencies’ ratings, which is closer to our results. This phenomenon not only supports analysis in the previous section, but also brings a new viewpoint: small companies are more likely to engage in "green-washing" behaviour, but they are also more likely to be detected by rating agencies, while rating agencies probably achieve such monitoring through research on green implementation. The clustering results by year in A1 A3 show that our conclusions are generally reliable, and large companies’ year-separated further indicates the potential non-linear relationship between Huazheng ESG index and of large companies.
(2) Sub-figure B reveals the inverse relationship between and , that is, the group with higher has a closer relationship between our and Huazheng ESG score. Existing research has widely recognized that Huazheng ESG scores effectively reflect companies’ green level, showing the positive result for companies’ financial performance [51]. The cluster result supports this opinion, and also justify the value of our indicator that it reaches a high degree of consistency with traditional research on certain issues that already have highly recognized conclusions. But cluster centre points in B1 B3 do not fully present the above analysis results, so further analysis is needed.
Although we obtain some analysis and conclusions through plotting the distribution and clustering results, simply stating “consistency” is far from enough. Therefore, in next section, we will conduct empirical tests to obtain quantitative results on the impact of on .
5 Empirical Test
In this section, we leverage the results of DeepGreen framework to explore the impact of corporate green-washing behaviour on asset return ratio (). We propose hypothesis () below:
| Corporate green-washing behaviour can positively impact | |||
| the companies’ Asset Return Ratio (ARR) |
The variables involved in the regression models will initially be described in Table 2. represents the Asset Return Ratio, indicating the efficiency of asset utilization in generating profit. , our proprietary Green Implementation index, quantifies the extent of a company’s green practices. is the logarithm of Huazheng ESG rating score. is a common financial metric that measures the market valuation of assets relative to their replacement cost. (Cost Ratio) indicates operational efficiency by showing the proportion of operating costs to total revenue. (Innovation Ratio) measures the proportion of revenue allocated to research and development. and are the logarithms of total assets and depreciation, respectively. Lastly, , the Investment Return Rate, assesses the profitability of investments by comparing net income to average investment.
| Obvs. | 204 | 204 | 203 | 204 | 204 | 203 | 204 | 204 | 200 |
|---|---|---|---|---|---|---|---|---|---|
| Mean | 6.77 | 0.41 | 1.58 | 2.75 | 0.90 | 0.070 | 24.43 | 20.62 | 0.15 |
| SD | 6.31 | 0.18 | 0.18 | 2.27 | 0.18 | 0.14 | 1.540 | 1.850 | 0.71 |
| Min | -30.85 | 0.00 | 1.10 | 0.76 | 0.60 | 0 | 21.31 | 17.50 | -0.85 |
| Max | 33.97 | 0.92 | 1.98 | 13.58 | 2.42 | 1.26 | 28.64 | 26.09 | 9.29 |
5.1 Benchmark: Tobit Model
To test our hypothesis, we build the benchmark model specified as follows:
| (15) |
As takes a positive probability value of 0, we set this Tobit model. is the parameter we need to estimate, and its economic significance influence that per-unit change in the degree of green-washing of a company on its asset return ratio (). Specifically, we will gradually add control variables and set the model in the following form:
| (16) |
In the robustness stage, we utilize the robust standard errors, transform explanatory variable form and sequentially adding new control variables: , and to verify the reliability of our model. Before conducting regression analysis, we first conduct correlation analysis on the selected variables, especially focusing on whether there is a strong correlation between the core explanatory variable and the control variables. The correlation matrix is shown in Table 3:
| 1.0000 | ||||||||
| -0.1303 | 1.0000 | |||||||
| -0.0509 | 0.1191 | 1.0000 | ||||||
| 0.0115 | 0.2587* | 0.0047 | 1.0000 | |||||
| -0.0633 | 0.4797* | -0.0996 | -0.3489* | 1.0000 | ||||
| -0.0492 | -0.1421* | 0.4500* | -0.3463* | 0.1052 | 1.0000 | |||
| 0.0333 | -0.1560* | 0.4349* | -0.3669* | 0.0688 | 0.9373* | 1.0000 | ||
| -0.1348 | 0.0673 | -0.0260 | 0.1894* | -0.0631 | -0.0467 | -0.0282 | 1.0000 | |
| * Significant at a confidence level of | ||||||||
5.2 Regression Tables
The regression results are shown in Table 4. Additionally, the results of our robustness test are presented in Table 5, And the heterogeneity research table on company size (Big, Mid, Small) can be found in Table 6 After carefully analysing both tables, we draw the following conclusions.
(1) These six benchmark results show the significant positive relationship between and and thus support . Across all six models, ’s coefficient ranges from 2.183 to 2.803 and is significant at the 5% or 1% level. We believe that our variable is an effective indicator distinct from Huazheng ESG, as its coefficient remains significant even after controlling for .
(2) Our models support the traditional conclusion [51] that Huazheng ESG rating scores positively drive . In addition, the positive and negative coefficients of other control variables do not conflict with existing empirical conclusions: there is a negative correlation between cost rate and asset return rate [52, 53], and a clear positive correlation between and [54]. The impact of innovation ratio is close to zero in the negative direction, consistent with the short-term negative correlation and long-term positive correlation conclusions of existing research [55, 56].
(3) The logarithmic transformation of explanatory variable is not significant at a confidence level of 10%, indicating that our model is free from model misspecification. The coefficient for remains positive and significant across all specifications. The addition of control variables such as , , , , and does not alter the significance of the main variables, suggesting that the model is robust to the inclusion of additional controls.
(4) Heterogeneity testing shows that, for large companies, the degree of green implementation has a significant positive impact on asset return, but for medium and small companies, it is still not significant at the 10% significance level. This indicates that the degree of green implementation does not have a significant positive impact on the asset return of these companies. This also reveals another potential motivation for small and medium-sized companies to engage in greenwashing: A high degree of green implementation does not bring significant growth to the company. For those who aim to maximize profits, they are more likely to engage in greenwashing behavior in order to avoid wasting limited funds in this field and meet regulatory requirements.
| Model1 | Model2 | Model3 | Model4 | Model5 | Robust | |
| 2.183** | 2.751*** | 2.803*** | 2.738*** | 2.467*** | 2.467** | |
| (0.950) | (0.436) | (0.483) | (0.472) | (0.349) | (1.130) | |
| -47.12*** | -46.50*** | -47.33*** | -39.44*** | -39.44*** | ||
| (3.543) | (3.822) | (3.937) | (2.979) | (4.319) | ||
| 1.442*** | 1.561*** | 2.603*** | 2.603** | |||
| (0.518) | (0.490) | (0.946) | (1.064) | |||
| -0.141*** | -0.370*** | -0.370*** | ||||
| (0.0390) | (0.0618) | (0.0988) | ||||
| 0.619*** | 0.619*** | |||||
| (0.100) | (0.136) | |||||
| 6.152*** | 47.39*** | 44.55*** | 45.49*** | 35.93*** | 35.93*** | |
| (1.081) | (3.492) | (4.576) | (4.657) | (3.818) | (4.666) | |
| 28.28*** | 9.185*** | 9.114*** | 9.009*** | 7.886*** | 7.886*** | |
| (4.769) | (0.850) | (0.893) | (0.857) | (0.894) | (1.243) | |
| Year Ctrl. | Yes | Yes | Yes | Yes | Yes | No |
| N | 204 | 204 | 203 | 203 | 203 | 203 |
| Standard errors in parentheses | ||||||
| * p<0.1, ** p<0.05, *** p<0.01 | ||||||
| Benchmark | Add Var. | Add Var. | Add Var. | Benchmark | Replaced | |
| 2.467*** | 2.594*** | 2.908*** | 1.687*** | 2.467** | ||
| (0.349) | (0.486) | (0.626) | (0.362) | (1.130) | ||
| 0.497 | ||||||
| (0.349) | ||||||
| -39.44*** | -40.30*** | -40.12*** | -36.03*** | -39.44*** | -40.00*** | |
| (2.979) | (3.208) | (3.258) | (1.536) | (4.319) | (4.433) | |
| 2.603*** | 1.190 | 1.300* | 0.522 | 2.603** | 2.540** | |
| (0.946) | (0.809) | (0.755) | (0.867) | (1.064) | (1.073) | |
| -0.370*** | -0.336*** | -0.319*** | -0.304*** | -0.370*** | -0.370*** | |
| (0.0618) | (0.0656) | (0.0656) | (0.0517) | (0.0988) | (0.0992) | |
| 0.619*** | 0.663*** | 0.640*** | 0.704*** | 0.619*** | 0.600*** | |
| (0.100) | (0.108) | (0.104) | (0.0821) | (0.136) | (0.139) | |
| 0.340*** | 0.786*** | 0.476*** | ||||
| (0.0302) | (0.0534) | (0.129) | ||||
| -0.408*** | -0.0999 | |||||
| (0.0545) | (0.119) | |||||
| 0.282*** | ||||||
| (0.0910) | ||||||
| 35.93*** | 30.36*** | 27.44*** | 26.41*** | 35.93*** | 38.12*** | |
| (3.818) | (4.342) | (4.007) | (3.897) | (4.666) | (4.806) | |
| 7.886*** | 7.709*** | 7.649*** | 6.276*** | 7.886*** | 7.951*** | |
| (0.894) | (0.911) | (0.895) | (0.833) | (1.243) | (1.275) | |
| Year Ctrl. | Yes | Yes | Yes | Yes | No | No |
| N | 203 | 203 | 203 | 199 | 203 | 201 |
| Standard errors in parentheses | ||||||
| * p<0.1, ** p<0.05, *** p<0.01 | ||||||
| Big | Mid | Small | Big | Mid | Small | |
| 7.213*** | 0.313 | -1.063 | 6.846*** | 1.024 | -0.376 | |
| (0.694) | (0.538) | (1.567) | (0.625) | (0.632) | (1.915) | |
| -41.96*** | -33.27*** | -38.80*** | -40.86*** | -36.62*** | -39.96*** | |
| (8.187) | (4.360) | (1.820) | (7.250) | (2.711) | (1.752) | |
| 2.686 | -1.235 | 0.768 | 3.171 | -3.808*** | -0.459 | |
| (2.082) | (0.804) | (0.962) | (1.962) | (1.025) | (0.703) | |
| -0.508*** | 0.105 | -0.285*** | -0.570*** | 0.356 | -0.265*** | |
| (0.0257) | (0.242) | (0.0543) | (0.0719) | (0.320) | (0.0524) | |
| 0.671*** | 0.244 | 0.765*** | 0.627*** | 0.504*** | 0.896*** | |
| (0.125) | (0.215) | (0.0836) | (0.142) | (0.151) | (0.0955) | |
| -0.227*** | 1.952*** | 0.850*** | ||||
| (0.0742) | (0.288) | (0.0848) | ||||
| -0.0899 | -0.0879 | -0.385** | ||||
| (0.215) | (0.270) | (0.178) | ||||
| 36.60*** | 36.35*** | 39.15*** | 43.05*** | -2.256 | 28.65*** | |
| (10.50) | (5.068) | (2.749) | (12.41) | (5.074) | (2.843) | |
| 9.698*** | 6.781** | 3.874*** | 9.554*** | 5.655** | 3.543*** | |
| (1.798) | (2.676) | (0.823) | (1.703) | (2.516) | (0.851) | |
| Year Ctrl. | Yes | Yes | Yes | Yes | Yes | Yes |
| N | 74 | 54 | 75 | 74 | 54 | 75 |
| Standard errors in parentheses | ||||||
| * p<0.1, ** p<0.05, *** p<0.01 | ||||||
6 Discussion
In this section, we propose some discussion based on our research.
(1) The indicator constructed in this study has significant empirical significance. It can serve as an additional perspective proactive tool for monitoring ESG implement of companies, releasing the stress of the implementation of relevant policies on defining and punishing green-washing behaviour.
(2) The application of DeepGreen can provide regulatory agencies with an additional perspective to supervise companies’ green transformation and explore potential green-washing behaviours. Market investors can obtain more timely market green supervision capabilities through DeepGreen.
(3) Generative AI has demonstrated strong efficiency in the extraction and analysis of unstructured text. Our results reveal that even non-financial-fine-tuned LLM can already be used to detect potential green-washing behaviour. Nevertheless, LLM is not a replacement for existing monitoring and rating methods, but rather a supplement. The efficiency of financial statement analysis can be greatly improved through the application of LLM, making it a more timely dynamic monitoring method that complements rigorous but slowly updated rating systems.
(4) The implementation of green behavior by enterprises can bring greater asset return rates, demonstrating the universality of our conclusion across companies of different sizes. Relevant institutions not only need to advocate for green transformation, but also need to monitor the implementation part, which can better promote the development of these companies.
(5) For the heterogeneity analysis that ’small and medium-sized enterprises are more likely to engage in greenwashing behavior’, the government can consider providing tax exemptions, subsidies, or other fiscal incentives for small and medium-sized companies to implement green projects, in order to reduce their costs in green implementation and increase their enthusiasm. It is also possible to encourage large enterprises and small and medium-sized companies to establish green supply chains through government mediation, and promote small and medium-sized companies to improve their green implementation by purchasing green products and services.
7 Conclusion
We introduce DeepGreen in this paper, which is an innovative system that leveraging LLMs (typically DeepSeek-V3 in this paper) to monitor A-share companies’ green-washing behaviour. This framework employs a dual-layer LLM analysis, starting with the extraction of potential green keywords from financial statements and then evaluating their implementation through semantic analysis. indicator generated from the two layers, which quantifies the ratio of implemented green practices to total green claims, can provide a novel approach for monitoring green-washing. This approach not only enhances the detection of green-washing, but also generates detailed, interpretable reports to improve transparency and credibility.
Our experimental analysis, conducted on 204 annual reports from A-share companies spanning 2021 to 2023, confirms the robustness of the indicator. The results align with established phenomena and theoretical frameworks, demonstrating the applicability of this new method in existing research. Furthermore, regression analysis validates DeepGreen’s effectiveness in identifying discrepancies between green claims and actual implementation. indicator exhibits a strong positive relationship with , suggesting that companies with higher levels of genuine green practices tend to achieve superior financial performance. Additionally, the system’s outputs correlate closely with traditional Huazheng ESG scores, reinforcing its reliability as a complementary monitoring tool. These findings underscore DeepGreen’s potential to assist regulatory agencies and investors in making more informed decisions regarding corporate sustainability claims.
In addition, we identify potential motivations for small and medium-sized companies to engage in greenwashing behavior more easily. Due to the high degree of green implementation not bringing significant growth to these companies, they may tend to reduce their investment in the ESG field. At the same time, through greenwashing behavior, they can also meet regulatory requirements and achieve compliance without increasing additional costs. This behavior not only helps small and medium-sized companies save resources, but may also enhance their market image and competitiveness to a certain extent. We believe that regulatory agencies need to consider the different needs and motivations of companies of different sizes in the ESG field when formulating relevant policies, in order to promote the sustainable development of the entire industry.
While DeepGreen represents a significant advancement in green-washing detection, its reliance on LLMs introduces certain limitations. Despite iterative analysis and external knowledge retrieval, hallucinations remain an inherent challenge of LLMs, which may randomly impact output accuracy. Future research will focus on developing more robust techniques to address this issue, such as enhanced training methodologies or hybrid models that integrate LLMs with traditional analytical tools. Additionally, we plan to conduct comparative analyses of global rating systems and explore the universal suitability of DeepGreen under diverse rating systems as well.
References
- [1] Magdalena Zioło, Iwona Dorota Bąk, and Anna Spoz. Literature review of greenwashing research: State of the art. Corporate Social Responsibility and Environmental Management, 2024.
- [2] Yupei Liu, Weian Li, Lixiang Wang, and Qiankun Meng. Why greenwashing occurs and what happens afterwards? a systematic literature review and future research agenda. Environmental Science and Pollution Research, 30:118102–118116, 2023.
- [3] Li Cai, Jinhua Cui, and Hoje Jo. Corporate environmental responsibility and firm risk. Journal of Business Ethics, 139:563 – 594, 2015.
- [4] Albert Acheampong and Tamer Elshandidy. Do social and environmental disclosures impact information asymmetry? Economics Letters, 2023.
- [5] Francesca Bernini, Marco Giuliani, and Fabio La Rosa. Measuring greenwashing: A systematic methodological literature review. Business Ethics, the Environment & Responsibility, 2023.
- [6] Felice Janice Olivia Boedijanto and Laurence L. Delina. Potentials and challenges of artificial intelligence-supported greenwashing detection in the energy sector. Energy Research & Social Science, 2024.
- [7] DeepSeek-AI, Aixin Liu, Bei Feng, et al. Deepseek-v3 technical report. ArXiv, 2024.
- [8] DeepSeek-AI, Daya Guo, Dejian Yang, et al. Deepseek-r1: Incentivizing reasoning capability in llms via reinforcement learning, 2025.
- [9] Partha Mohanram, Wei Sun, Baohua Xin, and Jigao Zhu. Does financial information presentation format matter? evidence from research and development expense reporting. SSRN Electronic Journal, 2024.
- [10] Benjamin Clapham, Michael Bender, Jens Lausen, and Peter Gomber. Policy making in the financial industry: A framework for regulatory impact analysis using textual analysis. Journal of Business Economics, 93:1463 – 1514, 2022.
- [11] Travis Dyer, Mark Lang, and Lorien Stice-Lawrence. The evolution of 10-k textual disclosure: Evidence from latent dirichlet allocation. Journal of Accounting and Economics, 64:221–245, 2017.
- [12] Tim Loughran and Bill Mcdonald. Textual analysis in accounting and finance: A survey. Behavioral & Experimental Finance eJournal, 2016.
- [13] Elizabeth Blankespoor, Ed dehaan, John Wertz, and Christina Zhu. Why do individual investors disregard accounting information? the roles of information awareness and acquisition costs. Household Finance eJournal, 2018.
- [14] Zellig S. Harris. Distributional structure. WORD, 10(2-3):146–162, 1954.
- [15] Rada Mihalcea and Paul Tarau. Textrank: Bringing order into text. Conference on Empirical Methods in Natural Language Processing, 2004.
- [16] Tomas Mikolov, Kai Chen, Gregory S. Corrado, and Jeffrey Dean. Efficient estimation of word representations in vector space. International Conference on Learning Representations, 2013.
- [17] Jacob Devlin, Ming-Wei Chang, Kenton Lee, and Kristina Toutanova. Bert: Pre-training of deep bidirectional transformers for language understanding. North American Chapter of the Association for Computational Linguistics, 2019.
- [18] Thomas M. Arnold. When is a liability not a liability? textual analysis, dictionaries, and 10-ks. Cfa Digest, 41:57–59, 2011.
- [19] Christine Botosan and Marlene A. Plumlee. A re-examination of disclosure level and the expected cost of equity capital. Journal of Accounting Research, 40:21–40, 2002.
- [20] Petr Hájek and Roberto Henriques. Mining corporate annual reports for intelligent detection of financial statement fraud - a comparative study of machine learning methods. Knowl. Based Syst., 128:139–152, 2017.
- [21] Ashish Vaswani, Noam M. Shazeer, Niki Parmar, et al. Attention is all you need. Neural Information Processing Systems, 2017.
- [22] OpenAI Josh Achiam, Steven Adler, Sandhini Agarwal, et al. Gpt-4 technical report. ArXiv, 2023.
- [23] Aaron Grattafiori, Abhimanyu Dubey, Abhinav Jauhri, et al. The llama 3 herd of models, 2024.
- [24] Mark Chen, Jerry Tworek, Heewoo Jun, et al. Evaluating large language models trained on code. ArXiv, 2021.
- [25] Shervin Minaee, Tomàš Mikolov, Narjes Nikzad, et al. Large language models: A survey. Arxiv, 2024.
- [26] H. Scott Asay, Robert Libby, and Kristina Rennekamp. Firm performance, reporting goals, and language choices in narrative disclosures. Journal of Accounting and Economics, 65:380–398, 2018.
- [27] Amir Amel-Zadeh and George Serafeim. Why and how investors use esg information: Evidence from a global survey. Financial Analysts Journal, 74:103 – 87, 2017.
- [28] Aumyo Hassan and Sarah J. Barber. The effects of repetition frequency on the illusory truth effect. Cognitive Research: Principles and Implications, 6, 2021.
- [29] Tuan Q. Lam and Duane G. Watson. Repetition is easy: Why repeated referents have reduced prominence. Memory & Cognition, 38:1137–1146, 2010.
- [30] Matthew J. Spaniol, Evita Danilova-Jensen, Martin Nielsen, Carl Gyldenkærne Rosdahl, and Clara Jasmin Schmidt. Defining greenwashing: A concept analysis. Sustainability, 2024.
- [31] Florencio Lopez-de-Silanes, Joseph A. McCahery, and Paul C. Pudschedl. Institutional investors and esg preferences. Corporate Governance: An International Review, 2024.
- [32] Nina Gorovaia and Michalis Makrominas. Identifying greenwashing in corporate-social responsibility reports using natural-language processing. European Financial Management, 2024.
- [33] Thomas P. Lyon and A. Wren Montgomery. The means and end of greenwash. Organization & Environment, 28:223 – 249, 2015.
- [34] Katherine Wood, Chaehyun Pyun, and Hieu Pham. Beyond green labels: Assessing mutual funds’ esg commitments through large language models. Finance Research Letters, 74:106713, 2025.
- [35] Yi Zou, Mengying Shi, Zhongjie Chen, et al. Esgreveal: An llm-based approach for extracting structured data from esg reports. Journal of Cleaner Production, 489:144572, 2025.
- [36] Qishu Wang. Generative ai-assisted evaluation of esg practices and information delays in esg ratings. Finance Research Letters, 74:106757, 2025.
- [37] Yue Zhang, Yafu Li, Leyang Cui, et al. Siren’s song in the ai ocean: A survey on hallucination in large language models. ArXiv, 2023.
- [38] Shangying Hua, Shuangci Jin, and Shengyi Jiang. The limitations and ethical considerations of chatgpt. Data Intelligence, 6:201–239, 2023.
- [39] Yupeng Chang, Xu Wang, Jindong Wang, et al. A survey on evaluation of large language models. ACM Trans. Intell. Syst. Technol., 15(3), March 2024.
- [40] Gabrijela Perković, Antun Drobnjak, and Ivica Botički. Hallucinations in llms: Understanding and addressing challenges. In 2024 47th MIPRO ICT and Electronics Convention (MIPRO), pages 2084–2088, 2024.
- [41] Marco Bronzini, Carlo Nicolini, Bruno Lepri, Andrea Passerini, and Jacopo Staiano. Glitter or gold? deriving structured insights from sustainability reports via large language models, 2024.
- [42] Tin Yuet Chung and Majid Latifi. Evaluating the performance of state-of-the-art esg domain-specific pre-trained large language models in text classification against existing models and traditional machine learning techniques, 2024.
- [43] Ryo Kamoi, Sarkar Snigdha Sarathi Das, Renze Lou, Jihyun Janice Ahn, Yilun Zhao, Xiaoxin Lu, Nan Zhang, Yusen Zhang, Ranran Haoran Zhang, Sujeeth Reddy Vummanthala, Salika Dave, Shaobo Qin, Arman Cohan, Wenpeng Yin, and Rui Zhang. Evaluating llms at detecting errors in llm responses. ArXiv, 2024.
- [44] Richard Yuanzhe Pang, Alicia Parrish, Nitish Joshi, et al. QuALITY: Question answering with long input texts, yes! In Proceedings of the 2022 Conference of the North American Chapter of the Association for Computational Linguistics: Human Language Technologies, pages 5336–5358, 2022.
- [45] Huaqin Zhao, Zheng Liu, Zihao Wu, et al. Revolutionizing finance with llms: An overview of applications and insights. ArXiv, 2024.
- [46] Lichao Sun, Yue Huang, Haoran Wang, et al. Trustllm: Trustworthiness in large language models. ArXiv, 2024.
- [47] Xuansheng Wu, Haiyan Zhao, Yaochen Zhu, et al. Usable xai: 10 strategies towards exploiting explainability in the llm era, 2024.
- [48] Edward Yeo, Yuxuan Tong, Morry Niu, Graham Neubig, and Xiang Yue. Demystifying long chain-of-thought reasoning in llms, 2025.
- [49] DeepSeek-AI, Aixin Liu, Bei Feng, et al. Deepseek-v3 technical report, 2025.
- [50] OpenAI, Aaron Hurst, Adam Lerer, et al. Gpt-4o system card, 2024.
- [51] Li-Sen Zhang. The impact of esg performance on the financial performance of companies: evidence from china’s shanghai and shenzhen a-share listed companies. Frontiers in Environmental Science, 2025.
- [52] Bart Frijns, Dimitris Margaritis, and Maria Psillaki. Firm efficiency and stock returns. Journal of Productivity Analysis, 2012.
- [53] Duc Hung Tran. Multiple corporate governance attributes and the cost of capital – evidence from germany. British Accounting Review, 2014.
- [54] Erik Syawal Alghifari, Sigit Triharjono, and Yuyu Siti Juhaeni. Effect of return on assets (roa) against tobin ’ s q : Studies in food and beverage company in indonesia stock exchange years 2007-2011. International Journal of Science and Research (IJSR), 2013.
- [55] Katerina Lyroudi. "the r&d effect on firm value in the information technology industry. Business Development and Economic Governance in Southeastern Europe, 2022.
- [56] Xiaohong Wang, Min Fan, Yaojun Fan, Yue Li, and Xianghua Tang. R&d investment, financing constraints and corporate financial performance: Empirical evidence from china. Frontiers in Environmental Science, 10:1056672, 12 2022.
Appendix A Method Comparison
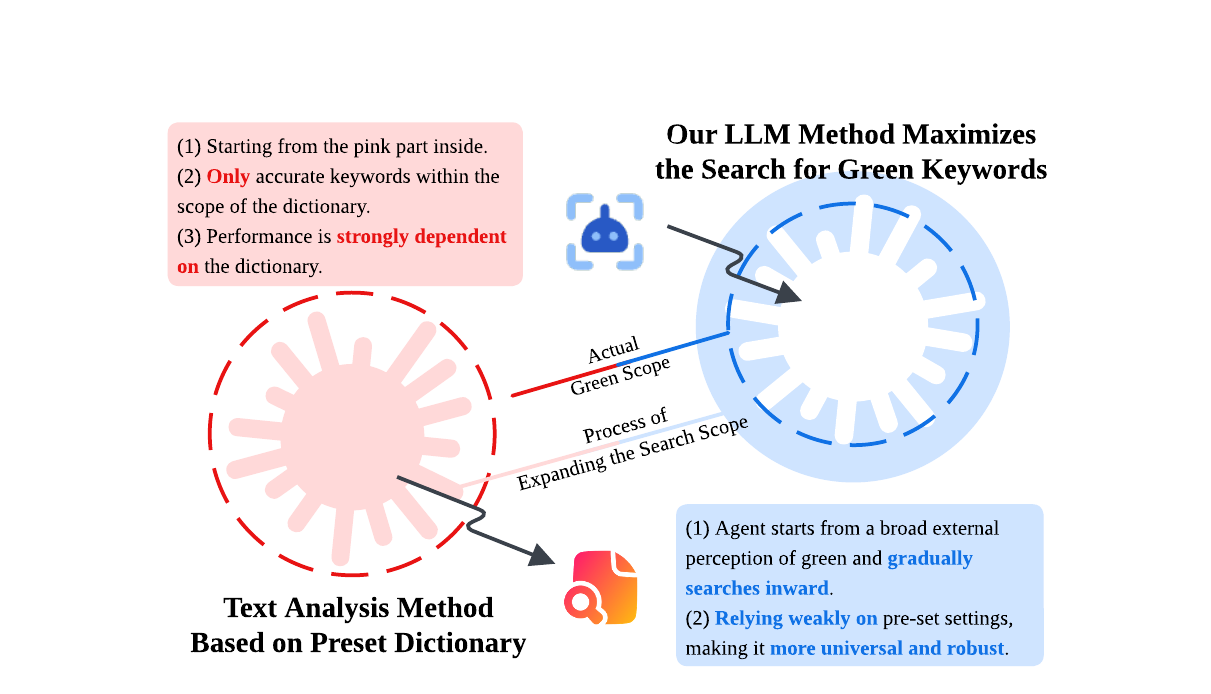
Our search method, as shown in Figure 4, outperforms traditional pre-set dictionary approaches. Given the rapid technological advancements and diverse environmental practices of companies, a single dictionary cannot effectively capture their unique green behaviours. Incomplete dictionaries may skew word frequency data, amplifying issues in empirical research. Moreover, constructing a comprehensive dictionary is time-consuming, costly, and lacks timeliness. Our method, rooted in semantic segmentation, leverages public cognition to approximate professional understanding, ensuring that potential green behaviours are not overlooked.
The severity of LLM judgment will be directly influenced by the user’s intention. If the user wishes to make lenient judgments and explicitly express the intention of "lenient search" in the prompt, the range of keywords generated by the model will be relatively wide; On the contrary, if users want stricter judgments, the keyword range will be relatively narrow. This is an ideal state of human-computer interaction.
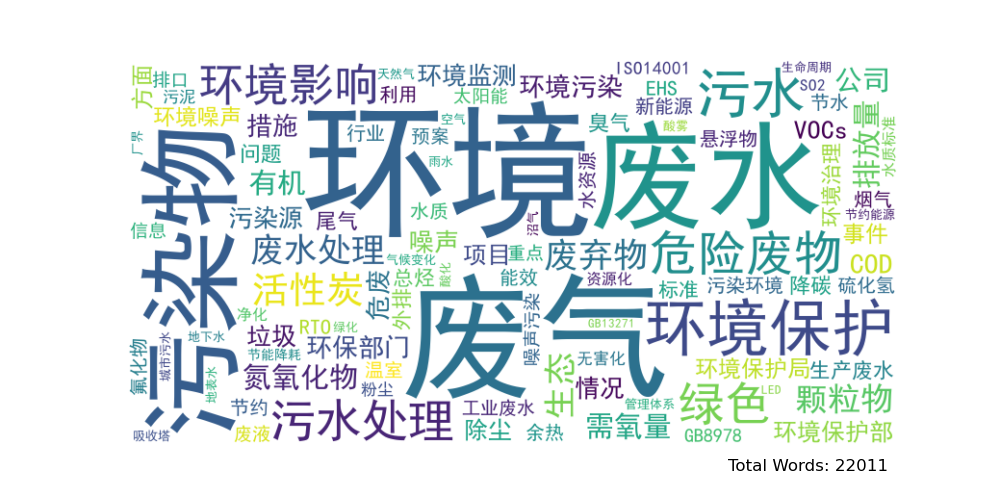
Appendix B Word Cloud Plot of the Green Keywords
We do not intend to design our dual-layer LLM system as a “black box”. To enhance the interpretability of LLM analysis and the basis of decision-making, the output of each layer can be examined, accompanied by a brief analysis from the LLM.
In this section, we adopt a lenient judgment degree here in LayerA, and its output will be presented, with the top 100 words sorted by frequency displayed in a word cloud as shown in Figure 5, and the total number of green keywords filtered from the original word segmentation is displayed in the lower right corner of the figure. It’s worth mentioning that even under such circumstances, we retain the flexibility to manually fine-tune the final indicator by eliminating those "weakly conforming" words before we send them to the next layer.