Improved visual-information-driven model for crowd simulation and its modular application
Abstract
Data-driven crowd simulation models offer advantages in enhancing the accuracy and realism of simulations, and improving their generalizability is essential for promoting application. Current data-driven approaches are primarily designed for a single scenario, with very few models validated across more than two scenarios. It is still an open question to develop data-driven crowd simulation models with strong generalizibility. We notice that the key to addressing this challenge lies in effectively and accurately capturing the core common influential features that govern pedestrians’ navigation across diverse scenarios. Particularly, we believe that visual information is one of the most dominant influencing features. In light of this, this paper proposes a data-driven model incorporating a refined visual information extraction method and exit cues to enhance generalizability. The proposed model is examined on four common fundamental modules: bottleneck, corridor, corner and T-junction. The evaluation results demonstrate that our model performs excellently across these scenarios, aligning with pedestrian movement in real-world experiments, and significantly outperforms the classical knowledge-driven model. Furthermore, we introduce a modular approach to apply our proposed model in composite scenarios, and the results regarding trajectories and fundamental diagrams indicate that our simulations closely match real-world patterns in the composite scenario. The research outcomes can provide inspiration for the development of data-driven crowd simulation models with high generalizability and advance the application of data-driven approaches.111This work has been submitted to the IEEE for possible publication. Copyright may be transferred without notice, after which this version may no longer be accessible.
keywords:
Crowd simulation , Data-driven , Visual information , Generalizability , Modular approach1 Introduction
Crowd simulation is an essential tool for predicting pedestrian movement and behavior. It facilitates the enhancement of safety measures, optimization of spatial designs, and improvement of overall service levels in public spaces.
The most widely utilized crowd movement simulation models are knowledge-driven approaches, wherein pedestrian movement is governed by established physical equations and behavioral rules. The primary knowledge-driven models include the social force (SF) model [1], the cellular automaton (CA) model [2], and the velocity model [3, 4]. These models have been applied to simulate crowd movement in various scenarios, encompassing bottlenecks, corridors, corners, and crosswalks [1, 5, 6, 7, 8]. Additionally, a range of pedestrian interactions (e.g., group behavior, following behavior, and avoidance behavior) has been modeled within these frameworks [9, 10, 11]. Furthermore, several typical self-organization collective behaviors, such as arch formation and lane formation, have been successfully reproduced by these models [12]. While these knowledge-driven models can adapt to diverse scenarios and effectively reproduce typical self-organization phenomena at the macroscopic level, they remain inadequate in accurately representing individual trajectories and velocities at the microscopic scale [13]. This limitation arises from the complex nature of pedestrian movement [14], as the equations and rules employed in knowledge-driven models are often overly simplistic to accurately capture these intricate mechanisms.
Alternatively, data-driven crowd simulation is gaining increasing attention due to its potential to enhance the accuracy of pedestrian trajectory predictions at the microscopic scale. Advancements in image processing and trajectory extraction technologies have enabled researchers to collect substantial and accurate pedestrian trajectory data [15, 16, 17], encompassing daily walking patterns captured by cameras and crowd movement data from controlled laboratory experiments. Several publicly available pedestrian movement datasets offer a valuable foundation for data-driven crowd simulation, facilitating the development of data-driven approaches. Similar to knowledge-driven models, data-driven models have also been employed to simulate crowd movement in various scenarios, such as crosswalks [18, 14], corridors [19, 20, 21, 13], bottlenecks [13, 22], T-junctions [23, 21], and corners [21, 24]. The primary data-driven crowd simulation models are based on deep learning methods, encompassing convolutional neural networks [24], long short-term memory (LSTM) networks [13], temporal convolutional networks (TCN) [21], and pure linear layers [19, 20, 18, 14]. Various features that may influence pedestrian movement have been investigated and incorporated as inputs to these neural networks. These features typically include the velocity of the subject pedestrian, the relative motion status of neighboring pedestrians, exit information, and other relevant factors [20, 18, 13]. It has been demonstrated that data-driven crowd simulation models achieve significantly more realistic and accurate results than knowledge-driven models at both the macroscopic and microscopic levels, as evidenced by the fundamental diagram and individual movement trajectories [13]. This advantage stems from two key aspects. First, data-driven models learn directly from a substantial volume of real-world pedestrian motion data [14]. Second, the numerous parameters within these models enhance their capacity to capture the complex mechanisms of crowd movement[21].
Although current data-driven crowd simulation models have achieved notable results, they are still in their infancy due to limited generalizability. More specifically, these models are primarily developed for a single geometric configuration, which restricts their adaptability to other geometries. For instance, the model proposed in [20] is specifically designed for corridor scenarios, and its adaptability to other typical scenarios (e.g., corners, T-junctions, and bottlenecks) remains highly questionable. Song et al. [13] proposed a data-driven model, the deep convolutional LSTM network (DCLN), which can be simultaneously applied to two scenarios: rooms and corridors. However, data-driven models like DCLN that are capable of functioning in both scenarios are still limited in number. The scarcity of data-driven crowd simulation models with high generalization capability arises from the challenges in accurately identifying the core common information that pedestrians utilize when navigating various scenarios. Moreover, the lack of generalizability significantly impedes the practical application of data-driven approaches. Hence, the motivation of this study is to further improve the data-driven crowd simulation model in terms of generalizability. Inspired by a recent study demonstrating that a theoretical flocking model based purely on vision can effectively generate organized collective behavior in biological systems [25], we proposed a visual-information-driven (VID) crowd simulation model in our previous work [21] to enhance generalizability through the integration of visual information. To the best of our knowledge, the VID model is the first data-driven crowd simulation model demonstrated to be adaptable across three geometries: corridor, corner and T-junction. However, the original VID model is not applicable in bottleneck scenarios, as it poses challenges for pedestrians in accurately locating the exit within this framework.
Bottlenecks, corridors, corners and T-junctions are often considered the most prevalent modules of walking spaces. If we can achieve realistic pedestrian movement within these modules through data-driven crowd simulation, we can further attempt to simulate crowd dynamics in complex scenarios by integrating these spatial modules, much like assembling Lego pieces. Particularly, bottlenecks significantly influence passage efficiency and are among the most hazardous areas due to restricted movement and increased density. Accurately capturing pedestrian behavior and predicting crowd movement in bottleneck scenarios is of paramount importance. Although the original VID model is not suitable for such situations, we found that it can be further improved to accommodate bottleneck scenarios by refining the methods for extracting visual information and incorporating exit information. Therefore, in this paper, we propose an improved VID (IVID) model to further extend generalizability for bottleneck scenarios. As a result, the IVID model is adaptable to four common scenarios: corridors, corners, T-junctions, and bottlenecks. Additionally, we introduce a modular approach for applying the IVID model in complex scenarios.
The contributions of this paper can be outlined as follows:
-
•
We highlight the critical importance of accurately capturing influential features in data-driven models and refine the visual information extraction method to accommodate bottleneck scenarios. The simulation results confirm this importance.
-
•
We establish an IVID model and assess the model on four common fundamental modules: bottleneck, corridor, corner and T-junction. The results show that our model performs excellently across these scenarios and markedly outperforms the SF [1] model. The generalizability of our model significantly surpasses that of previous related data-driven models.
-
•
We propose the task of applying data-driven models in composite scenarios and introduce a modular approach to address it. Our successful implementation represents a substantial progress, as prior research has predominantly remained at the stage of simulating only one basic module and few studies have achieved simulations in composite scenarios.
The rest of this paper is organized as follows. Section 2 introduces the IVID model and the modular approach. Section 3 details the experiments and simulation results across the four modules. Section 4 illustrates the application of the modular approach. Section 5 discusses the findings, and Section 6 presents the conclusions.
2 Methodology
In this section, we present the IVID model, including its overall framework and providing a detailed description of each component. Furthermore, we describe the modular approach for implementing the IVID model in complex scenarios.
2.1 Model
2.1.1 Model framework
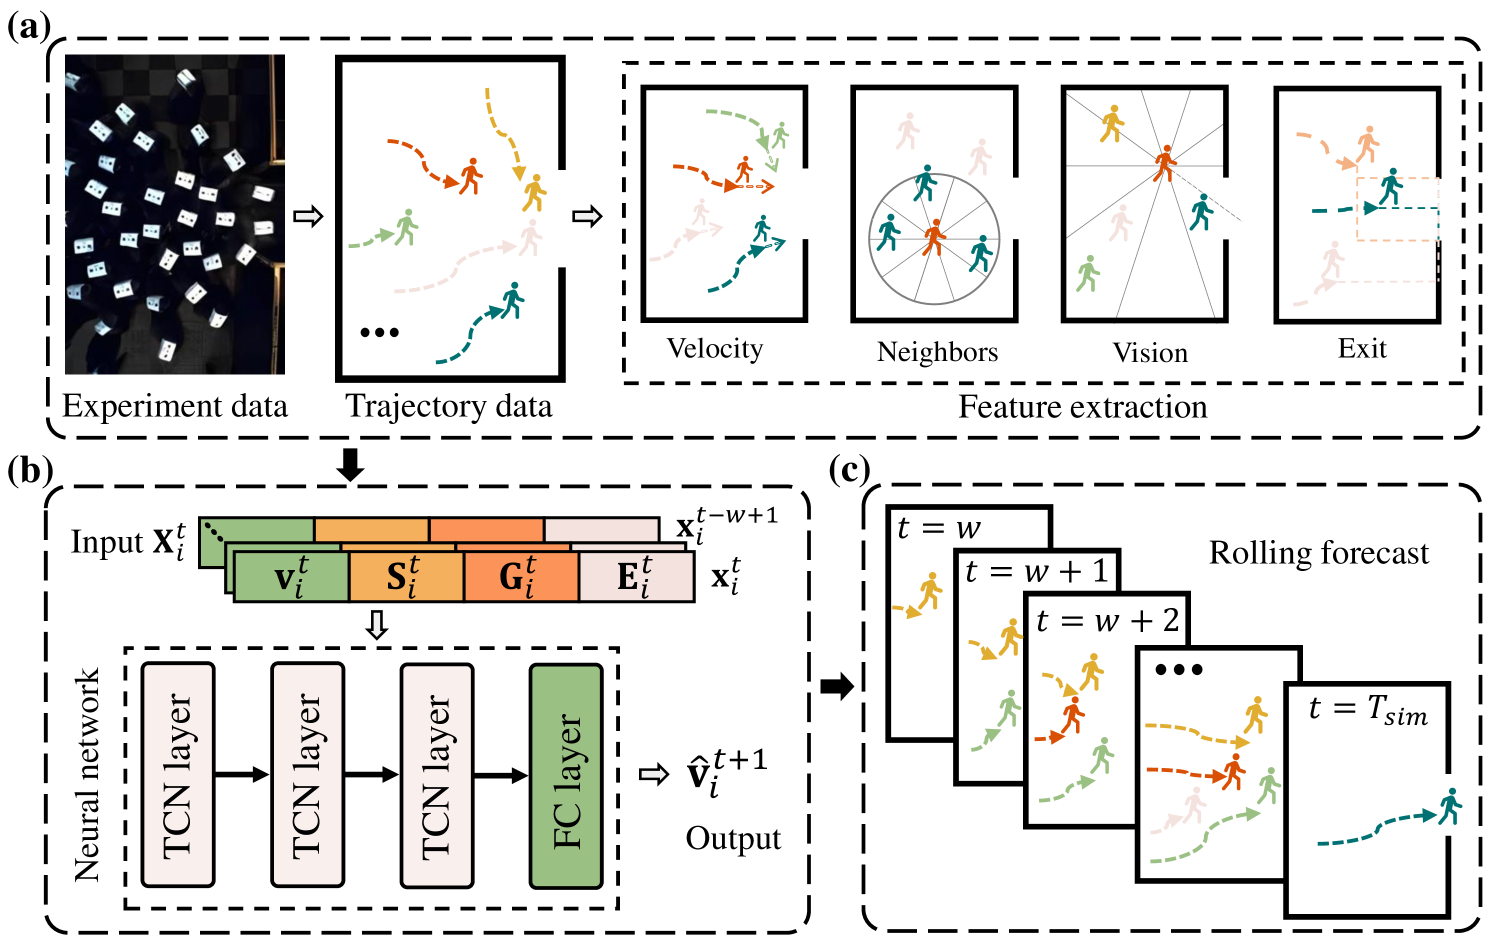
The objective of our IVID model is to simulate continuous crowd movement based on the initial motion status of pedestrians. The overall framework of the model is illustrated in Fig. 1. The IVID model comprises three key components: feature extraction, velocity-prediction neural network (VPNN), and rolling forecast. First, the feature extraction component obtains features that influence pedestrian movements from experimental trajectory data, as depicted in Fig. 1 (a). Subsequently, these features are input into the VPNN, which outputs the predicted velocities of pedestrians at the next time step, as shown in Fig. 1 (b). The VPNN is trained based on the predicted and the ground truth values of velocities. Last, upon completing the training, the rolling forecast component enables continuous crowd movement simulation based on the initial motion status of each pedestrian by iteratively predicting velocity using the trained model and updating pedestrians’ positions, as represented in Fig. 1 (c).
2.1.2 Feature extraction
The feature extraction component is responsible for extracting features influencing pedestrians’ movement. Effectively capturing these features and inputting them into the neural network is paramount for the accuracy of trajectory prediction. Pedestrian movement is primarily influenced by individual velocity, social interactions with neighboring pedestrians, and the physical environment [1]. Specifically, the physical environment encompasses visual information and exit information. Visual information provides pedestrians with the geometry of their surrounding walkable space and their own location, thereby facilitating navigation. Exit information indicates the intended destination of the pedestrians. Consequently, the component extracts these influential features, which are detailed below.
-
1.
Individual velocity . A pedestrian’s future velocity is influenced by their previous velocities due to the effects of inertia [26, 27, 28]. This correlation justifies the inclusion of individual velocity as input for the VPNN. Specifically, represents the magnitude of the velocity components of subject pedestrian in the - and -axis directions at time step .
-
2.
Social information . Social information primarily originates from neighboring pedestrians. As pedestrians walk, they exhibit various social behaviors, including following, avoidance, and other interactions with their neighbors [29, 30]. Pedestrians’ movements are significantly influenced by their neighboring pedestrians. Several methods have been proposed to identify these neighbors [6, 31, 18]. In our IVID model, as in the original VID model [21], we continue to utilize the radar-nearest-neighbor (Radar-NN) method proposed by [20] due to its demonstrated effectiveness. Fig. 2 (a) illustrates the interaction pattern of the Radar-NN. First, for the subject pedestrian at time step (denoted as ()), a circular social interaction area is defined, centered at the current position of pedestrian with an interaction radius . This circular social interaction area is subsequently divided into equally sized subareas beginning from the -axis with a unified central angle . Here, represents the index, and is the number of the subareas. Radar-NN identifies a single nearest neighbor for each subarea . Specifically, neighbor is defined as
where denotes the set of other pedestrians or wall points within the subarea ; represents the distance between pedestrian and entity ; and represents the midpoint of the arc corresponding to the sector .
Thus, a total of neighbors are identified. Last, the input feature represents the relative positions and velocities of the neighbors with respect to pedestrian in the - and -axis directions at time step .
-
3.
Visual information . Pedestrians inherently perceive their surroundings through visual information, which is essential for navigating various scenarios as it reveals the geometry of walkable spaces and their own location. Consequently, effectively extracting and incorporating visual information is vital for enhancing model generalizability. In the original VID model [21], we employ a velocity-direction-based half-vision mode to extract visual information. However, this mode is not adaptable for scenarios that involve frequent backward movement, such as bottleneck situations, where pedestrians are unable to detect the exit while moving backward. Therefore, in the IVID model, we adopt a -axis-based full-vision extraction mode to extend its generalizability for bottleneck scenarios. Fig. 2 (b) illustrates the visual information extraction pattern. Specifically, for (), the subject pedestrian serves as the center, emitting rays originating from the -axis within a 360-degree area at uniform intervals of . Here, represents the index, and is the number of the rays. Each ray corresponds to a unique visual point . Specifically, point is defined as the nearest intersection point where ray intersects with the scenario wall. If no intersection occurs, points toward the exit. Given that the space in the exit direction is unbounded, we introduce a virtual exit-distance parameter , where is a large constant. In this context, point is defined as the location along the ray that is situated at a distance from pedestrian . Consequently, a total of visual points are identified. The input feature represents the relative positions of the visual points with respect to pedestrian in the - and -axis directions at time step .
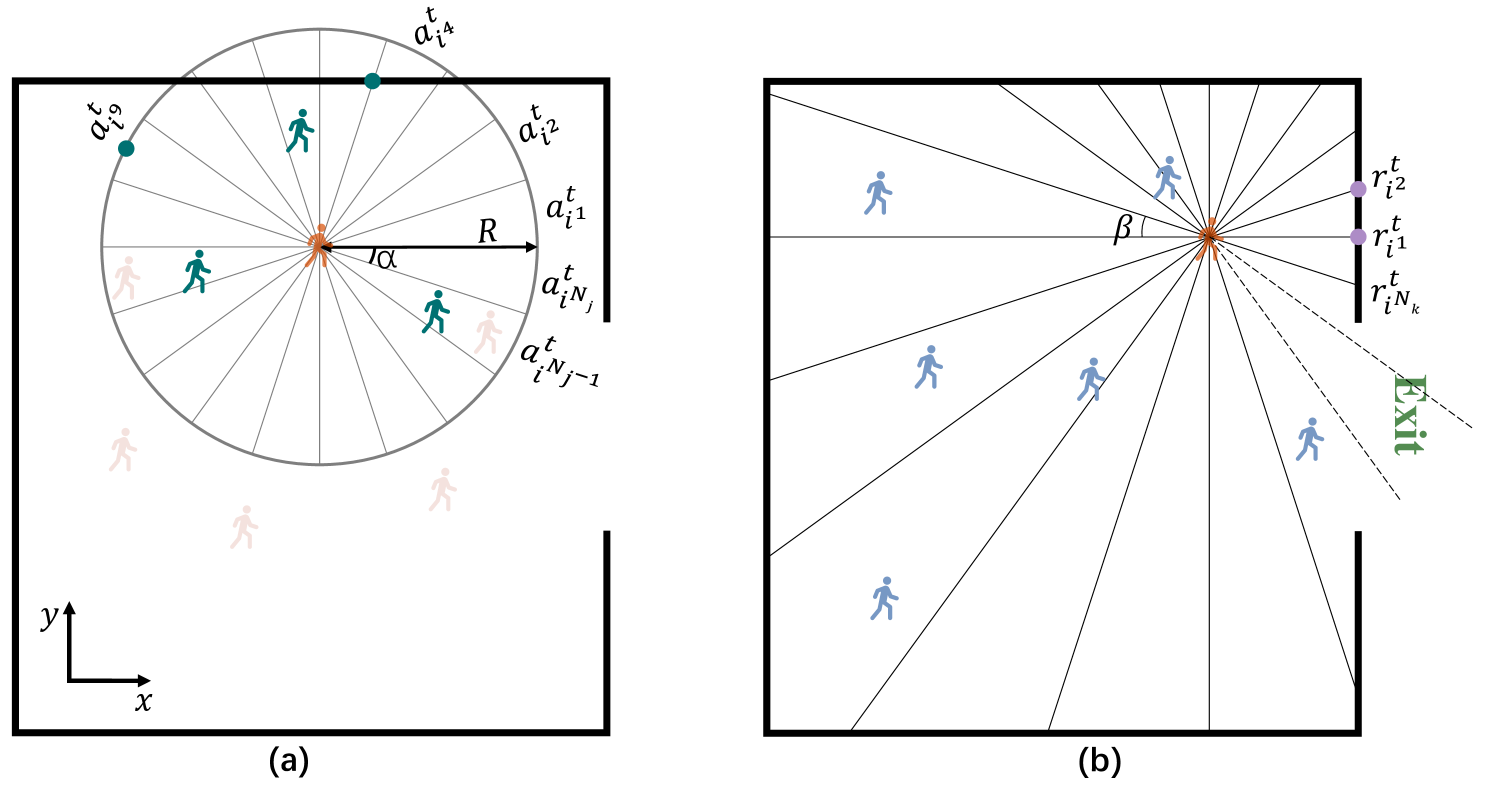
Figure 2: Extraction of social and visual information. (a) Interaction pattern of Radar-NN. The orange pedestrian icon represents the current pedestrian . The green and pink pedestrian icons denote neighbors and non-neighbors, respectively, within the Radar-NN pattern. If the nearest entity in the subarea is another pedestrian, that pedestrian is designated as neighbor (green pedestrian icon in ). Conversely, if the nearest entity in the subarea is a wall point, this wall point is considered neighbor (green point in ). If contains neither pedestrians nor wall points, the midpoint of the arc corresponding to the sector is regarded as (green point in ). (b) Visual information extraction pattern. The representation of is indicated by solid and dotted black lines when it intersects with a wall and an exit, respectively. The lengths of the dashed lines are . The purple points on and represent the corresponding visual points of and . -
4.
Exit information . Exit information indicates the intended destinations of pedestrians. Particularly, in bottleneck scenarios, the passage narrows abruptly at the exit, significantly influencing pedestrian movement. Accurate identification of the exit enables pedestrians to effectively plan their routes and navigate the confined space. Therefore, we incorporate exit information into the IVID model, relative to the original VID model [21], to enhance its generalizability. Specifically, denotes the relative positions of the two endpoints of the exit with respect to pedestrian along the - and -axis directions at time step .
Lastly, we reshape , , , and into one-dimensional (1D) vectors, and then concatenate these reshaped vectors to .
2.1.3 Velocity-prediction neural network (VPNN)
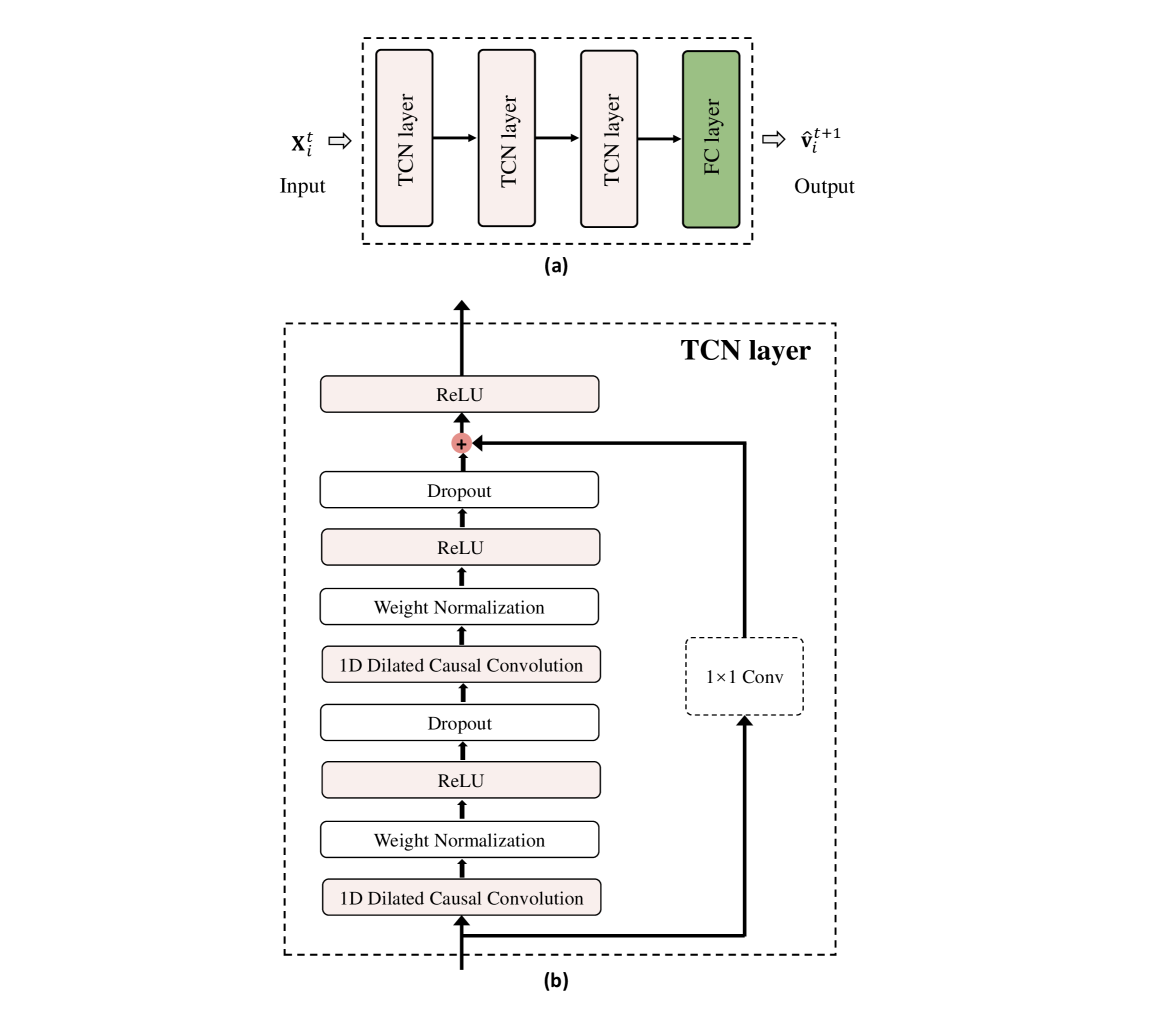
The VPNN is responsible for predicting pedestrian’s velocity at the next time step based on the extracted features from previous time steps. A TCN-based neural network [32, 21] is employed to address this sequence modeling problem. The architecture of the VPNN is depicted in Fig. 3 (a). Specifically, VPNN takes as input and outputs . Here, denotes the lookback window, and represents the magnitude of the predicted velocity components along the - and -axis. The VPNN comprises three TCN layers and one fully connected (FC) layer. The architecture of the TCN layer is illustrated in Fig. 3 (b). It includes 1D dilated causal convolutions, weight normalization [33], rectified linear unit (ReLU) activation [34], and dropout [35]. Notably, the 1D dilated causal convolution is the most critical operation within the TCN layer, as it ensures that there is no information leakage from future to past and that the input and output sequences of the TCN layer maintain the same length. For a sequence input denoted as and a filter , the 1D dilated causal convolution operation on element of the sequence is defined as
| (1) |
where is the kernel size, and is the dilation factor. VPNN is trained by minimizing the sum of for all training samples using back-propagation, where represents the ground true value of velocity.
2.1.4 Rolling forecast
The rolling forecast component is responsible for simulating continuous crowd movement following the completion of VPNN training. The configuration of the rolling forecast simulation scenarios is based on the controlled-experiment scenarios (i.e., the test datasets presented in Table 1), thereby ensuring the comparability of experimental and simulated data. Further information regarding these scenarios is provided in Section 3.1.1. The entry times of pedestrians into the scenario and the trajectories of their initial time steps are consistent with those in the corresponding controlled experiments. The simulation for each pedestrian commences once the length of their previous trajectory sequence reaches .
At each time step , the influencing feature of each pedestrian is extracted and subsequently input into the trained VPNN model to predict the velocity at the next time step, . Based on the current position of each pedestrian and the predicted velocity , the new position of each pedestrian can be updated. This process is repeated until all pedestrians have exited the scenario.
2.2 Modular approach
We propose a modular approach for applying the IVID model in complex scenarios. Various complex scenarios are constructed from simple scene modules, the most common of which include corridors, bottlenecks, corners, and T-junctions. Leveraging the high generalizability of the IVID model across these simple scene modules, we can assemble these fundamental modules into diverse complex scenarios, similar to building with Lego, thereby facilitating the simulation of intricate environments.
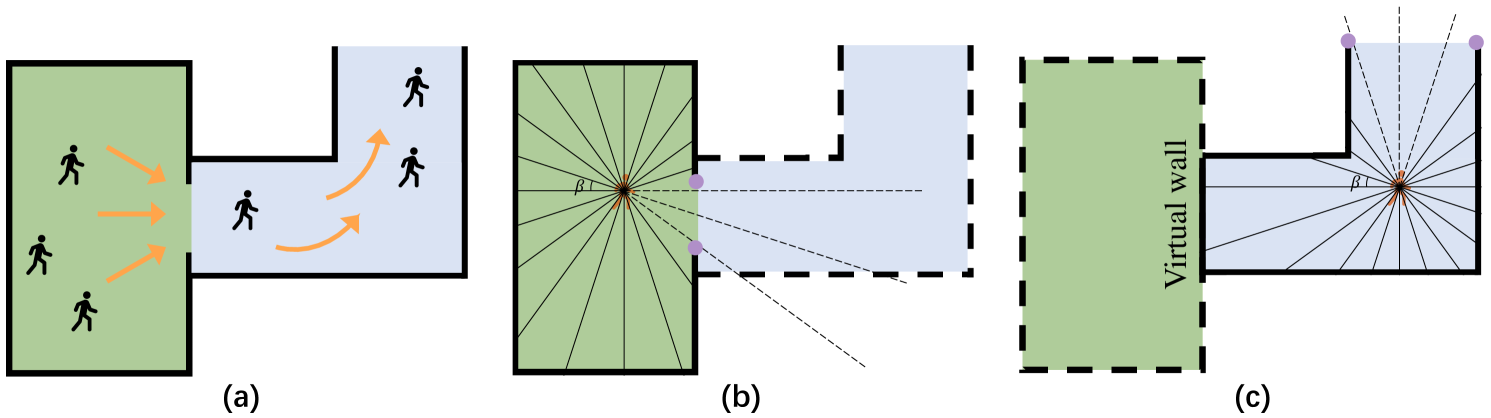
The schematic representation of the modular approach is illustrated in Fig. 4. The core principle of this approach is that a pedestrian, when situated within a specific module, considers only the influences of walls within that same module, effectively disregarding interactions from walls in other modules. Furthermore, the target exit for each pedestrian corresponds to the exit of the module in which they are located. For instance, Fig. 4 depicts a scenario composed of a bottleneck and a corner. The orange arrows indicate the direction of pedestrian movement. When pedestrian is situated within the bottleneck module, as shown in Fig. 4 (b), only the walls of the bottleneck, represented by solid lines, are considered for the extraction of visual information . Additionally, during the extraction of exit information , the exit points of the bottleneck, indicated as purple points in Fig. 4 (b), are identified. When pedestrian exits the bottleneck and is located within the corner module, the extraction of visual information and exit information is illustrated in Fig. 4 (c). In this context, the walls of the bottleneck are disregarded, while the walls of the corner are taken into account for the extraction of visual information . Furthermore, a virtual wall is introduced at the junction between the bottleneck and the corner. Simultaneously, the exit information is identified as the exit of the corner, represented as purple points in Fig. 4 (c).
3 Experiments and results
3.1 Experiments
3.1.1 Datasets
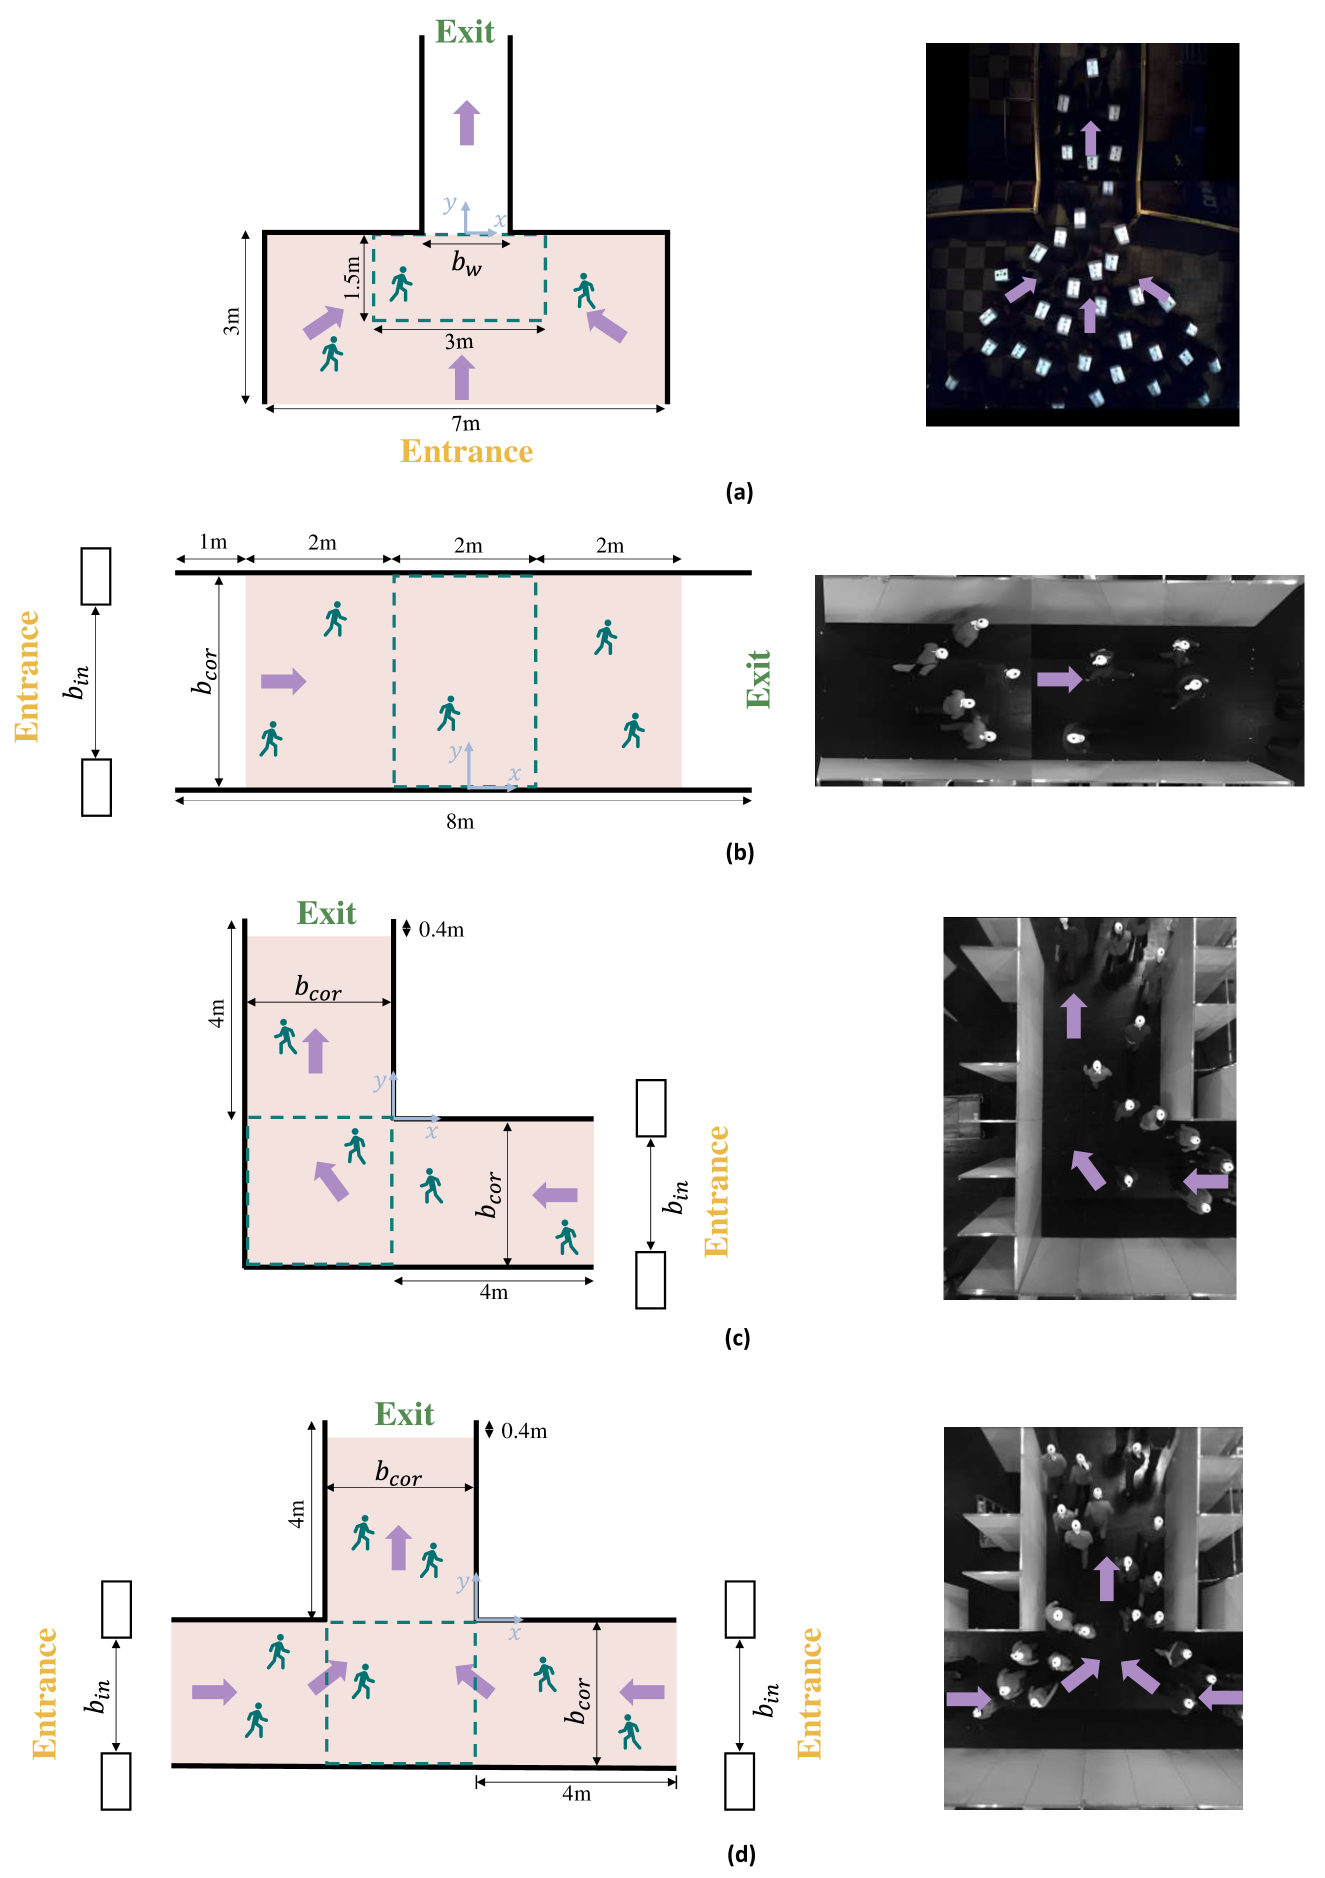
We evaluate the IVID model in four scenarios: bottleneck, corridor, corner and T-junction. These scenarios are among the most common architectural modules, from which various complex environments are constructed. The datasets utilized in our study originate from a series of controlled experiments conducted within these four geometries by the Institute of Civil Safety Research at the Research Centre Jülich, Germany. The experimental data are accessible through the pedestrian dynamics data archive (https://ped.fz-juelich.de/da/doku.php). A concise overview of the experiments is provided below.
Fig. 5 illustrates the experimental setup along with snapshots from the experiments. In each run, pedestrians are instructed to enter the scenario through the designated entrance and exit via the specified exit. The purple arrows in Fig. 5 indicate the direction of pedestrian movement within each scenario. Multiple runs were conducted for each scenario. Specifically, in bottleneck experiments, the exit width () was varied across different runs. In corridor, corner and T-junction experiments, the width of the entrance () and the width of the corridor () were altered in different runs to regulate pedestrian density within the experimental area. The entire experimental process was recorded on video, and pedestrian trajectories were extracted at a rate of 25 fps for the bottleneck scenario and 16 fps for the corridor, corner and T-junction scenarios. We mainly focus on the pink area in Fig. 5 for each scenario. In other words, we utilize the trajectory data from this region to construct the dataset while simulating pedestrian movement within this area.
We divided the multiple runs from each scenario into training-validation datasets and test datasets, as illustrated in Table 1. Specifically, we extracted input features and target values utilizing the feature extraction component described in Section 2.1.2 from the training-validation runs to train and validate the VPNN. The training-validation samples from the four scenarios were combined, with a sample ratio of 4:1 between training and validation datasets. After training the VPNN, we performed crowd simulations based on the test runs using the rolling forecast component.
| Dataset | Scenario | Name |
|---|---|---|
| Training-validation | Bottleneck | W110, W120, W140, W180, W200, W250 |
| Corridor | E050-C180, E060-C180, E070-C180, E100-C180, E145-C180, E180-C180, E065-C240, E080-C240, E095-C240, E145-C240, E190-C240, E240-C240 | |
| Corner | E050-C240, E060-C240, E080-C240, E100-C240, E150-C240, E240-C240 | |
| T-junction | E050-C240, E060-C240, E080-C240, E100-C240, E120-C240, E150-C240, E240-C240 | |
| Test | Bottleneck | W120, W160, W220 |
| Corridor | E080-C300, E100-C300, E120-C300, E180-C300, E240-C300, E300-C300 | |
| Corner | E050-C300, E060-C300, E080-C300, E100-C300, E150-C300, E300-C300 | |
| T-junction | E050-C300, E080-C300, E120-C300, E150-C300 |
Note: In the bottleneck scenario, the symbols ’W’ followed by a width value denote controlled experiments with varying exit widths (), where ’W110’ indicates an exit width of 110 cm. In the corridor, corner and T-junction scenarios, these symbols represent controlled experiments with different combinations of entrance width () and corridor width (); for instance, ’E050-C180’ signifies an entrance width of 50cm and a corridor width of 180cm. It is important to note that ’W120’ in the Training-validation dataset and the test dataset for the bottleneck scenario refers to two distinct experiments.
3.1.2 Settings
We set the interaction radius and the central angle to 1.2m and 18∘ , respectively, for social information extraction, based on their demonstrated effectiveness [20, 21]. To evaluate the robustness and efficacy of the full-vision extraction mode, we conduct a sensitivity analysis on the virtual exit-distance parameter and the interval . Specifically, is tested at distances of 20m and 100m, while is examined at angles of 5∘, 10∘, 15∘ and 18∘. The lookback window is set to 8 time steps. The Adam optimizer [36] is employed to train the VPNN, with a learning rate of 0.0001 and a total of 3000 iterations. The kernel size is consistently set to 8 for each TCN layer. The dilation factors for the three TCN layers are configured as 1, 2 and 4, respectively, facilitating exponential dilation. Additionally, the channels for the convolutional layers in the three TCN layers are set to 32, 64 and 96.
Since our model employs a data-driven approach, deviations in pedestrian trajectory predictions may occur, leading to minor occurrences of trajectory passing through walls during the rolling forecast simulation. In such instances, following the methods outlined in [20, 21], we reset the trajectories of pedestrians for the preceding time steps. Specifically, we guide pedestrians to move along the walls in corridor, corner and T-junction scenarios, or towards the exit in bottleneck scenarios. Subsequently, we re-extract and update the input features for the preceding time steps of the pedestrians.
3.2 Results
3.2.1 Parameter sensitivity analysis
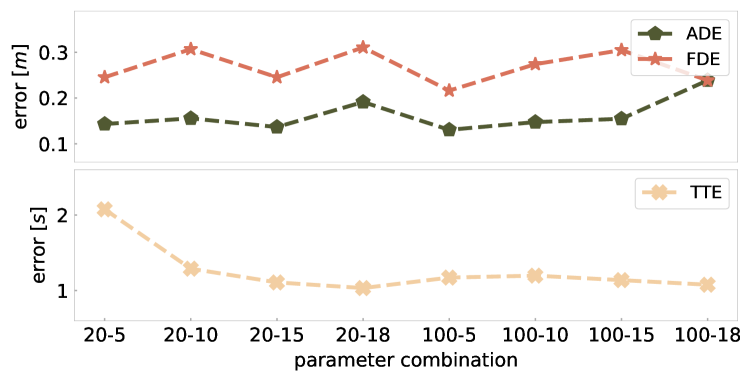
We conducted a sensitivity analysis on the virtual exit-distance parameter and the interval to evaluate the robustness of the proposed full-vision extraction mode. Three quantitative metrics are used to assess the parameter sensitivity based on the trajectories obtained from the controlled experiments and our simulation:
-
1.
Average Displacement Error (ADE): The mean Euclidean distance between trajectory points in the simulation and those from the corresponding controlled experiments.
-
2.
Final Displacement Error (FDE): The Euclidean distance between the final locations in the simulation and the controlled experiments.
-
3.
Travel Time Error (TTE): The difference between the simulated travel time and the actual travel time.
The mean values across all pedestrians of these three metrics for different parameter combinations are presented in Fig. 6. It can be observed that our model maintains relative stability within the tested parameter ranges of and , as the three metric values exhibit minimal variation across different parameter combinations. This indicates the robustness of the proposed full-vision extraction mode and a substantial parameter selection space for and .
3.2.2 Qualitative and quantitative comparisons
We compare the simulation results of the proposed IVID model and the SF model [1], along with data obtained from the control experiments, to assess the validity and superiority of the IVID model. Specifically, we reproduce the SF model in the testing scenarios of the four geometries (i.e., bottleneck, corridor, corner and T-junction), respectively. The direction of the desired velocity in the corner and T-junction scenarios is determined by the method proposed in [37]. The magnitude of the desired velocity is set to follow a normal distribution with a mean of 1.4m/s and a variance of 0.2m/s, as the average speed of pedestrians during conditions approaching free movement in controlled experiments is approximately 1.4m/s [21]. Both qualitative metrics (i.e., trajectories and fundamental diagrams) and quantitative metrics (i.e., ADE, FDE and TTE) are employed to evaluate and compare simulation performance. The results are detailed below.
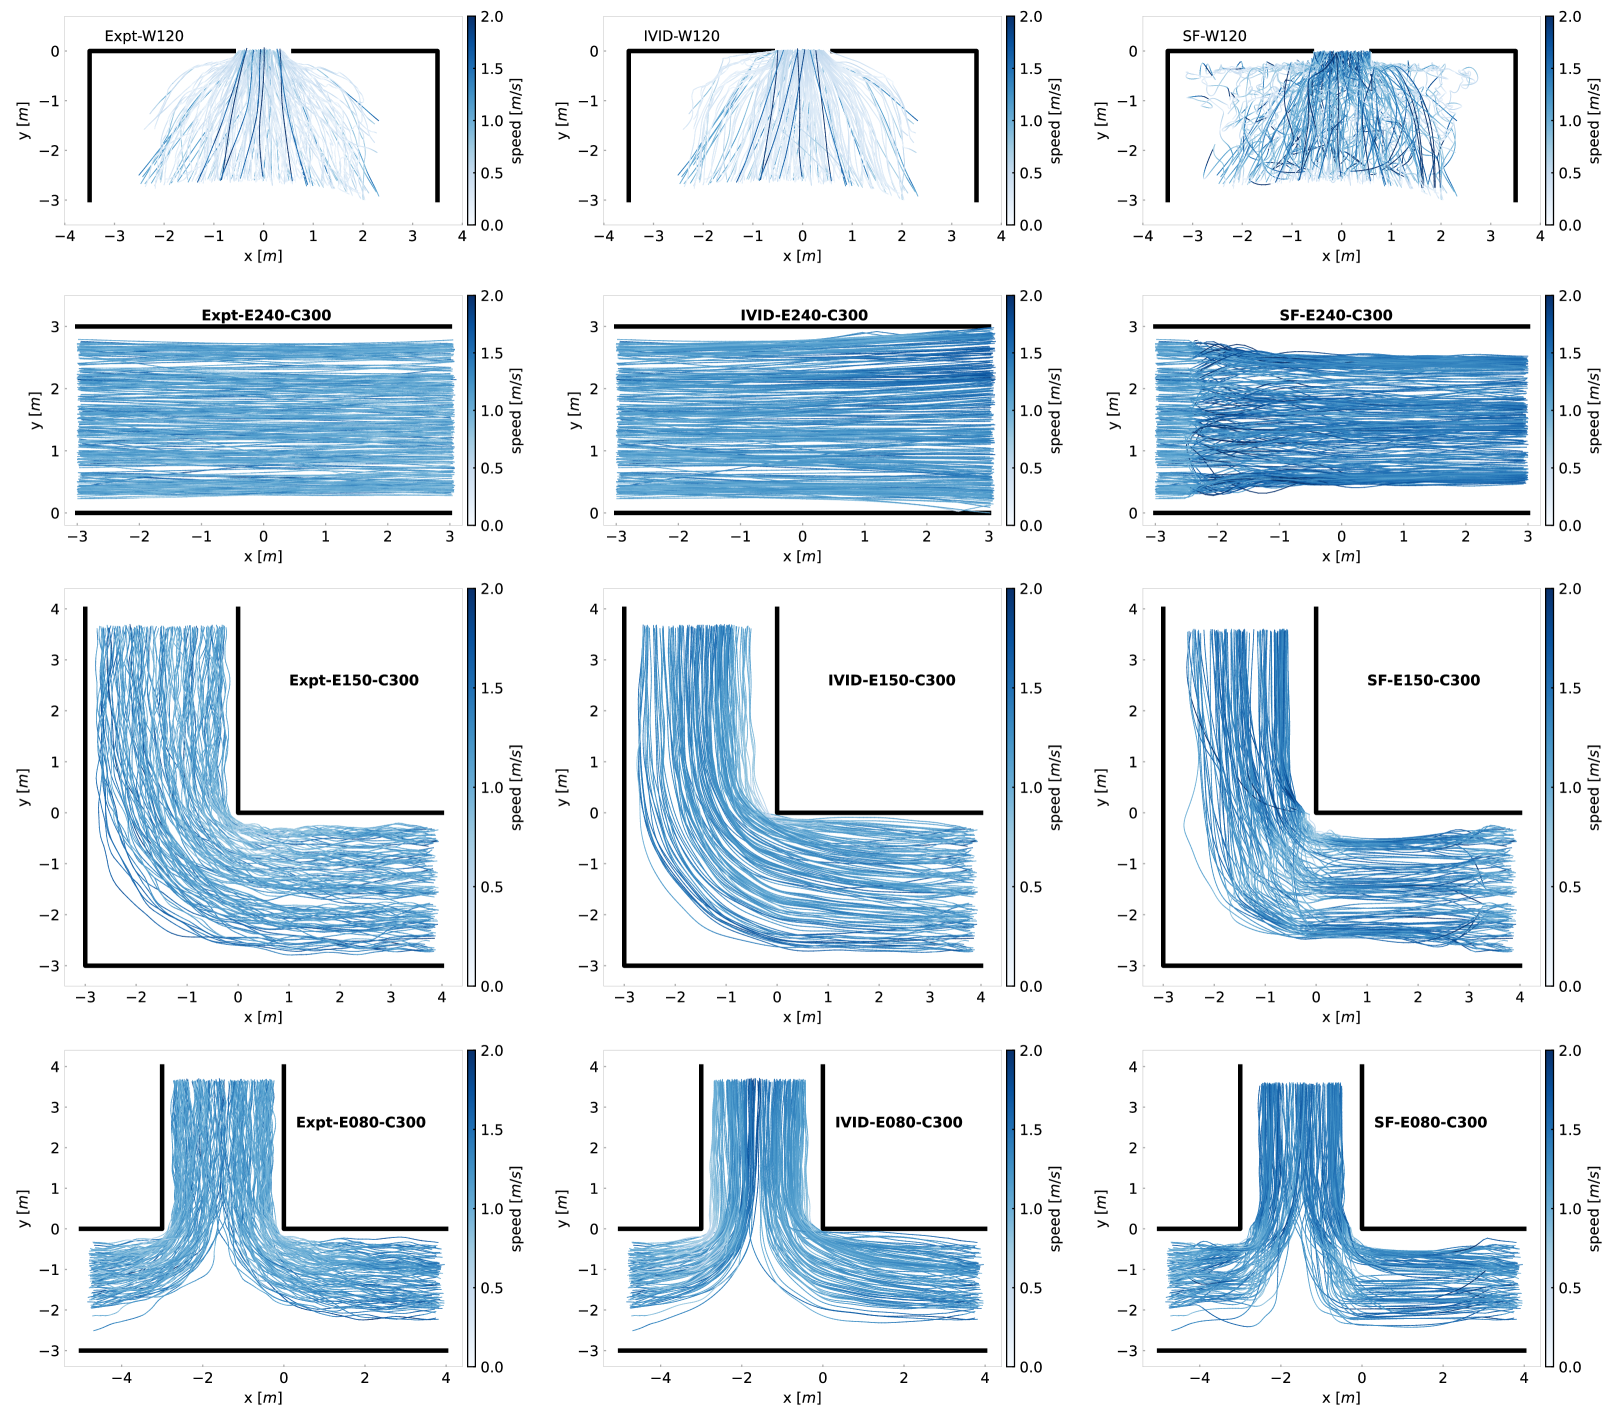
Trajectories. The trajectories from the controlled experiments, as well as simulations of the proposed IVID model and the SF model [1], for bottleneck, corridor, corner and T-junction scenarios are presented in Fig. 7. Due to space limitations, one testing scenario for each geometry is included. The trajectory comparison reveals that our IVID model significantly outperforms the SF model in terms of trajectory shape similarity and speed alignment. The trajectories generated by the IVID model closely align with those from the controlled experiments in both trajectory shape and speed magnitude. The pedestrian speeds in the SF model are considerably higher than those observed in both the controlled experiments and the IVID model when the latter two exhibit low speeds.
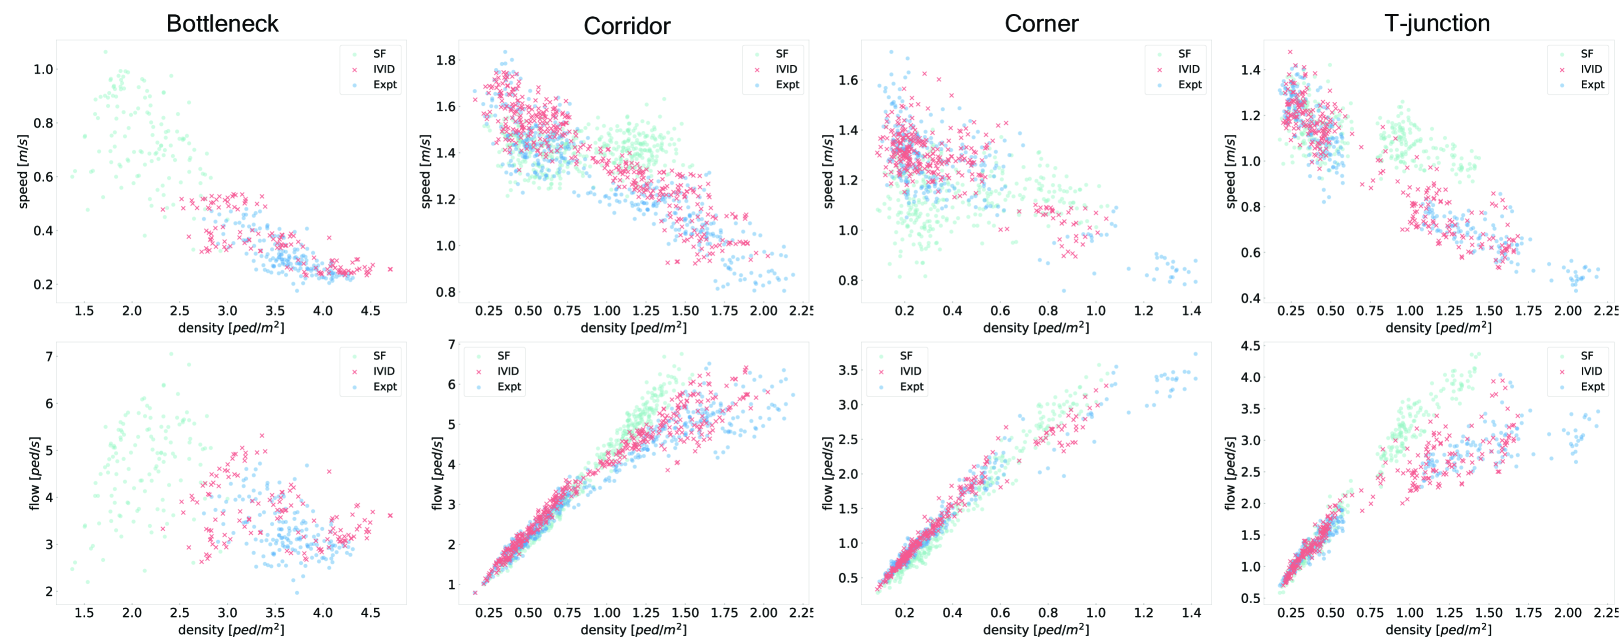
Fundamental diagram. Fundamental diagrams illustrate the relationship between pedestrian flow, speed and density, serving as a widely used evaluation metric [38]. The measurement areas for each scenario are represented by the green dashed rectangular regions in Fig. 5. Fig. 8 presents the fundamental diagrams derived from the controlled experiments, the proposed IVID model and the SF model [1] for bottleneck, corridor, corner and T-junction scenarios. The fundamental diagrams obtained from our model closely resemble those from the controlled experiments and are significantly more aligned with them than those of the SF model, particularly in terms of the density range and the variation of speed with density.
ADE, FDE and TTE. We evaluate the quantitative performance of the proposed IVID model using three metrics: ADE, FDE and TTE, which are introduced in Section 3.2.1. The IVID model is systematically compared with the SF model [1] and the original VID model [21] across bottleneck, corridor, corner and T-junction scenarios, as detailed in Table 2. Each metric value for the IVID model is calculated from all 4×2=8 parameter combinations for and to ensure a comprehensive comparison and robust evaluation of the model’s performance. The results indicate that the proposed IVID model performs well across all four geometries, surpassing the performance of the other two models. Notably, the IVID model significantly outperforms the SF model in ADE and TTE within bottleneck scenarios, while the metric values for the original VID model in bottleneck scenarios are absent due to its inapplicability to this geometry. In corridor, corner and T-junction scenarios, the IVID model and the original VID model demonstrate comparable performance, with the exception that the IVID model exhibits superior FDE in the corner scenario, while the original VID model shows lower TTE in the T-junction scenario. Overall, both the IVID model and the original VID model perform better than the SF model, particularly in terms of TTE.
| Bottleneck | Corridor | Corner | T-junction | ||
|---|---|---|---|---|---|
| ADE | IVID | 0.13 | 0.09 | 0.21 | 0.19 |
| SF | 1.17 | 0.16 | 0.26 | 0.22 | |
| VID | / | 0.10 | 0.24 | 0.17 | |
| FDE | IVID | 0.19 | 0.20 | 0.39 | 0.32 |
| SF | 0.19 | 0.25 | 0.42 | 0.33 | |
| VID | / | 0.25 | 0.49 | 0.29 | |
| TTE | IVID | 1.78 | 0.46 | 1.33 | 1.95 |
| SF | 5.37 | 1.04 | 1.97 | 3.06 | |
| VID | / | 0.47 | 1.08 | 1.23 |
4 Modular Application
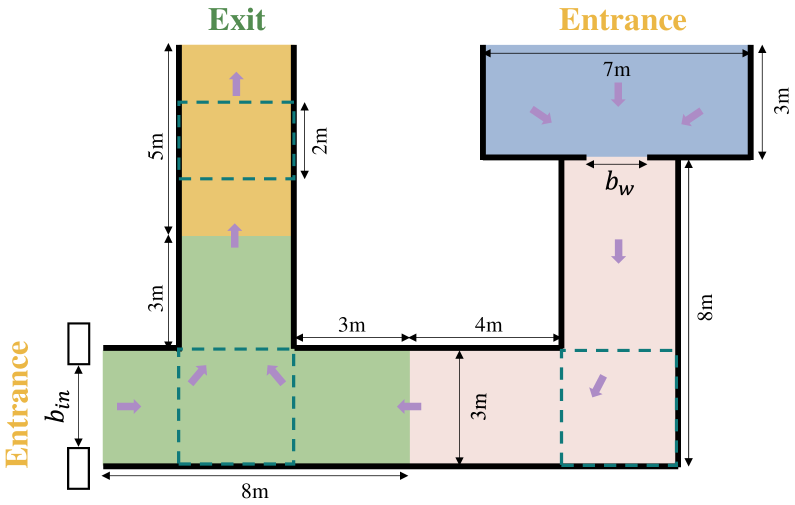
We employ the modular approach outlined in Section 2.2 to implement the IVID model in composite scenarios. We conduct simulations in a composite scenario utilizing the trained IVID model through modular application to assess model performance. This scenario includes a bottleneck, a corner, a T-junction and a corridor, as illustrated in Fig. 9. Pedestrians enter the scenario from either the bottleneck module or the T-junction module and exit through the corridor module. The purple arrows indicate the direction of movement. A total of four simulation runs were conducted by varying the width of the bottleneck exit () and the entrance width of the T-junction (), with the combinations summarized in Table 3. These four - combinations facilitate a range of pedestrian densities within the simulation, from low to high. To enhance the realism of pedestrian entry into the simulation scenario, the timing of pedestrians entering the bottleneck module and the T-junction module, as well as their initial motion states during the first 8 time steps (lookback window), are consistent with the corresponding controlled experiments. For instance, the initial motion states of pedestrians entering the complex scenario W120-E050 correspond to those from the bottleneck scenario W120 and the T-junction scenario E050-C300 in the controlled experiments. Additionally, we conducted simulations using the SF model [1] in the same scenario for model performance comparison.
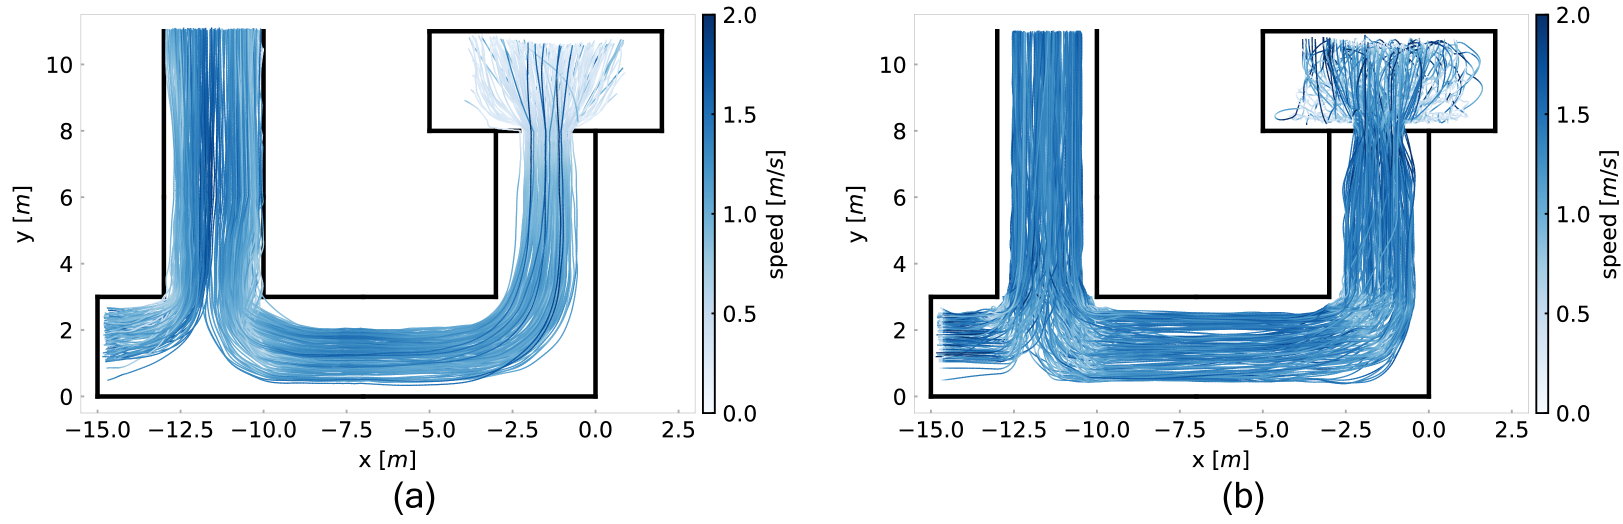
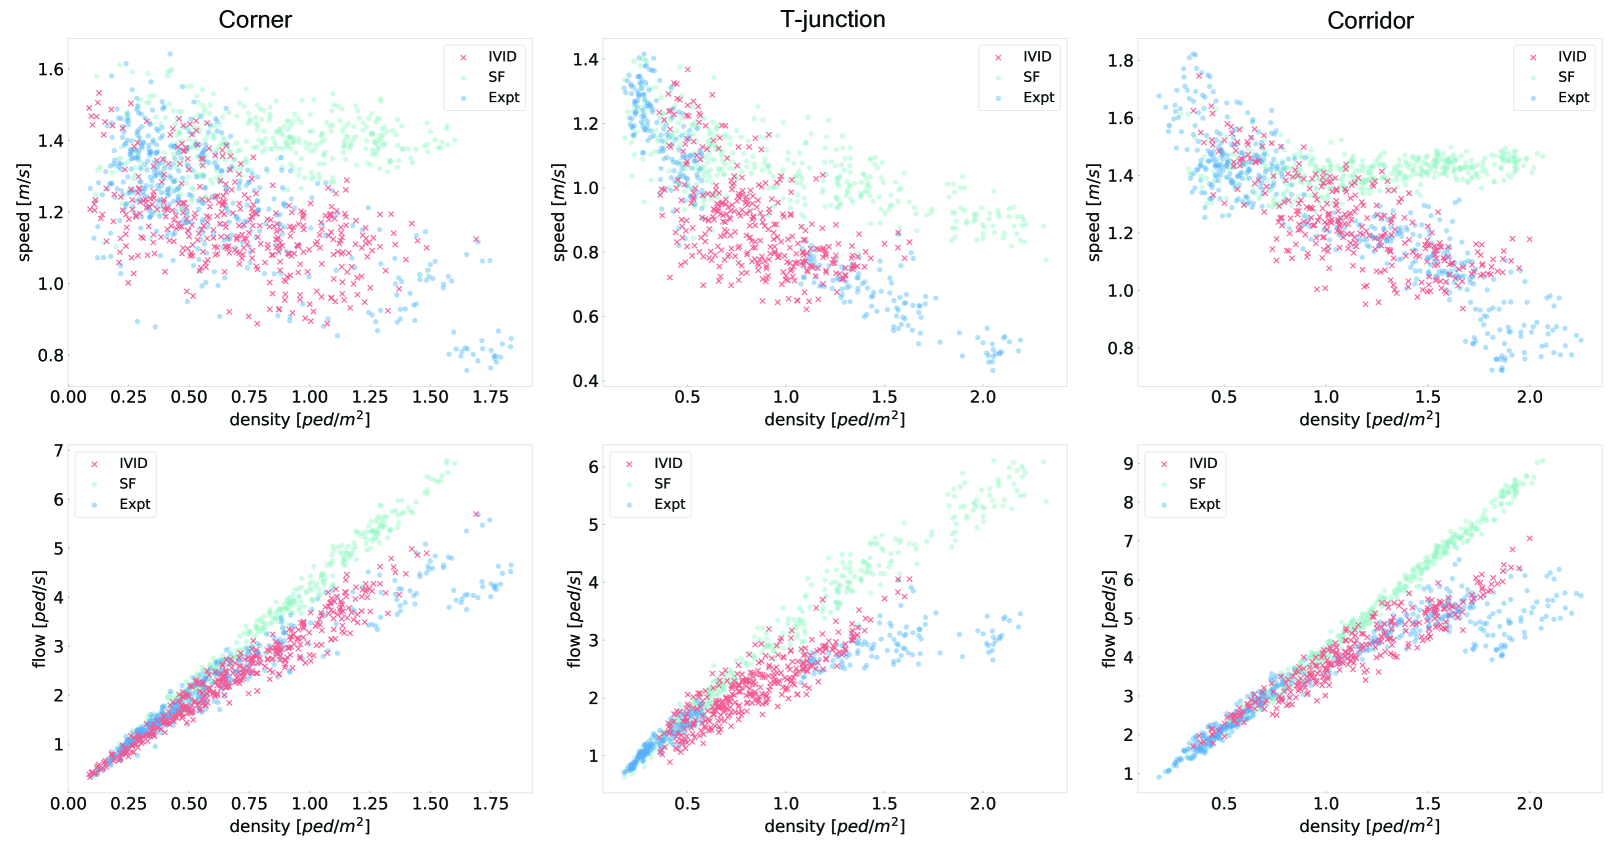
Fig. 10 presents the simulation trajectories for scenario W160-E080, utilizing both our IVID model and the SF model [1]. The simulation trajectories from our IVID model align well with real-world patterns, characterized by reasonable trajectory shapes and variations in speed. Specifically, as pedestrians exit the bottleneck and enter the corner, their speed gradually increases to a stable level due to the widening of the corridor. The speed of pedestrians at the turn is lower than that in the straight corridor. These observations indicate that our model effectively captures the mechanisms underlying changes in pedestrian velocity. To facilitate a more intuitive comparison of model performance, we calculate the fundamental diagrams from these simulated trajectories. Specifically, we compute and compare the fundamental diagrams from the corner, T-junction and corridor modules with those obtained from controlled experiments in these geometries. The measurement areas are represented by the green dashed boxes in Fig. 9. The results presented in Fig. 11 demonstrate that our IVID model, through the modular approach, effectively simulates and reproduces pedestrian movement in the composite scenario, significantly outperforming the SF model. Our IVID model successfully captures the relationship between density and both speed and flow, with the generated speed and flow values closely aligning with those from the controlled experiments, showcasing a significant advantage over the SF model across the range of simulated pedestrian densities.
| Name | ||
|---|---|---|
| W120-E050 | 120 | 50 |
| W160-E080 | 160 | 80 |
| W160-E120 | 160 | 120 |
| W220-E150 | 220 | 150 |
5 Discussion
The limited generalizability of current data-driven crowd simulation models highlights a significant limitation, emphasizing the need for the development of models with strong generalizability to improve the practical applications of data-driven approaches. Fundamental modules such as bottlenecks, corridors, corners and T-junctions are commonly encountered in pedestrian movement environments. These modules have garnered extensive research attention in the field of pedestrian and evacuation dynamics, as complex pedestrian movement scenarios predominantly comprise these basic structures. Therefore, establishing a general data-driven model that is adaptable across these fundamental modules holds considerable significance for advancing the application of data-driven crowd simulations. Comparative results demonstrate that our IVID model achieves excellent simulation outcomes across these geometries, indicating the model’s exceptional generalizability.
Bottlenecks constitute one of the most critical fundamental modules in pedestrian dynamics due to their dual role in regulating flow efficiency and posing safety risks. Although our original VID model [21] performs well in corridors, corners and T-junctions, its inapplicability to bottlenecks represents a major limitation. We hypothesize that this limitation arises from the failure of the original visual information extraction method, which is compromised by the frequent backward movement in bottlenecks resulting from high density. Consequently, we adjusted the visual information extraction method and incorporated exit information to enhance the detection of exits. The strong performance of the IVID model in bottleneck scenarios validate our hypothesis and provide evidence of the core importance of visual information.
Developing a data-driven model with high generalizability presents significant challenges, as it requires the accurate capture of the critical common information that guides pedestrians across various geometries and the incorporation of this feature into the model. We argue that this core feature largely lies in visual information, which encompasses the scenario geometry and the pedestrian’s position within the scene. The movement of pedestrians toward the scenario exit can be viewed as a dynamic process that involves repeatedly establishing and updating intermediate targets based on the currently available visual information and planning routes to reach these intermediate targets. The level of decision-making regarding these intermediate targets lies between the operational (e.g., determining movement at the next time step) and tactical (e.g., identifying the exit) levels [39, 40]. In essence, visual information serves as the key common factor enabling pedestrians to navigate effectively in diverse scenarios. Through the inherent perception of visual information, pedestrians can efficiently determine how to navigate turns at corners, identify their temporary target position, and conceive the route to reach that target. The strong generalizability of our visual information-based model indicates its effectiveness in capturing the common factors influencing pedestrian navigation across different geometries, thereby validating the dominant importance of visual information.
Visual information has often been overlooked in previous data-driven models, significantly contributing to their limitations in generalizability [19, 18, 20]. This lack of adaptability hinders the practical application of data-driven models. Our findings provide valuable insights and inspiration for future research aimed at enhancing generalizability through the effective extraction of features.
Upon successfully implementing the data-driven model for simulating crowd movement across various fundamental modules, we intend to use this model to simulate composite scenarios through a modular approach. Previous related research has largely remained at the stage of simulating one basic module [20, 18, 22], and few studies have attempted to successfully apply data-driven models to composite or more complex scenarios. Our successful attempt represents a significant advancement, both in theoretical methods and practical applications. In the absence of real-world pedestrian movement data for the simulated composite scenario, we assess our simulation performance using fundamental diagrams, comparing them with those produced by controlled experiments and the SF model [1]. The results from the modular application of our IVID model in the composite scenario indicate that our model achieves excellent simulation performance, as the fundamental diagrams obtained from our model are highly consistent with those from controlled experiments. This finding underscores the substantial potential of data-driven approaches for modeling more complex real-world scenarios.
It is important to note that while our crowd simulation shares similarities with data-driven pedestrian trajectory prediction, they are fundamentally distinct in nature. The latter is merely one component of the former, and their application contexts differ significantly. Specifically, pedestrian trajectory prediction focuses on forecasting the trajectories of individuals for the next few frames, which can be applied in fields such as autonomous driving to anticipate pedestrian movements and avoid collisions [41, 42]. In contrast, crowd simulation emphasizes the modelling of complete movement process of individuals from their entry into a scene to their exit, typically used in architectural and pedestrian facility design [18, 20]. Crowd simulation generally provides only the trajectories of pedestrians for the initial few frames and employs a rolling forecast approach to simulate their exit from the scene. Thus, the rolling forecast is one of the core processes of crowd simulation and represents a fundamental distinction between pedestrian trajectory prediction and crowd simulation. During the rolling forecast process, trajectory errors can accumulate over time steps. Therefore, achieving low trajectory error accumulation is a more challenging aspect of crowd simulation compared to pedestrian trajectory prediction.
6 Conclusion
In this paper, we establish a superior data-driven crowd simulation model with improved generalizability based on TCN. The model achieves high generalizability through the effective capture of visual information. It is evaluated across four common fundamental modules: bottleneck, corridor, corner and T-junction. The simulation results of the model are compared with those of controlled experiments and the widely used SF model [1]. A series of metrics, including trajectory analysis, fundamental diagrams, and quantitative metrics regarding travel time and distance errors, are employed to systematically evaluate the model’s performance. The results demonstrate that our model effectively captures pedestrian movement mechanisms, accurately reproducing trajectories and fundamental diagrams observed in corresponding controlled experiments, and achieving minimal quantitative errors. Additionally, our model markedly outperforms the SF model in both qualitative and quantitative assessments across all four modules. A modular approach is proposed to apply the model in composite scenarios. The simulation trajectories and fundamental diagrams from the modular application indicate that our model aligns well with real-world patterns and considerably surpasses the SF model in the composite scenario. This successful endeavor represents a significant advancement, as few studies have achieved similar results. It also highlights the substantial potential of data-driven approaches for modeling more complex real-world scenarios.
The limitation of this research lies in the model’s requirement for the first eight frames (lookback window) of trajectory data, which may cause inconvenience for practical applications. Future research could explore more efficient and user-friendly neural network architectures. We emphasize the critical importance of effectively and accurately extracting influential features in data-driven models, and we hope that our work could provide inspiration for future related research. Our findings indicate that data-driven approaches possess significant potential through effective feature extraction. Therefore, we advocate for further investigations into this topic to advance data-driven crowd simulation.
References
- [1] D. Helbing, I. Farkas, T. Vicsek, Simulating dynamical features of escape panic, Nature 407 (6803) (2000) 487–490.
- [2] A. Varas, M. Cornejo, D. Mainemer, B. Toledo, J. Rogan, V. Muñoz, J. Valdivia, Cellular automaton model for evacuation process with obstacles, Physica A: Statistical Mechanics and its Applications 382 (2) (2007) 631–642.
- [3] P. Fiorini, Z. Shiller, Motion planning in dynamic environments using velocity obstacles, The International Journal of Robotics Research 17 (7) (1998) 760–772.
- [4] J. van den Berg, M. Lin, D. Manocha, Reciprocal velocity obstacles for real-time multi-agent navigation, in: 2008 IEEE International Conference on Robotics and Automation, 2008, pp. 1928–1935.
- [5] B. Steffen, A. Seyfried, Modeling of pedestrian movement around 90 and 180 degree bends (2009). arXiv:0912.0610.
- [6] J. Ma, W. Song, J. Zhang, S. Lo, G. Liao, k-nearest-neighbor interaction induced self-organized pedestrian counter flow, Physica A: Statistical Mechanics and its Applications 389 (10) (2010) 2101–2117.
- [7] W. Zeng, P. Chen, H. Nakamura, M. Iryo-Asano, Application of social force model to pedestrian behavior analysis at signalized crosswalk, Transportation Research Part C: Emerging Technologies 40 (2014) 143–159.
- [8] W. Zeng, P. Chen, G. Yu, Y. Wang, Specification and calibration of a microscopic model for pedestrian dynamic simulation at signalized intersections: A hybrid approach, Transportation Research Part C: Emerging Technologies 80 (2017) 37–70.
- [9] W. Xie, E. W. M. Lee, T. Li, M. Shi, R. Cao, Y. Zhang, A study of group effects in pedestrian crowd evacuation: Experiments, modelling and simulation, Safety Science 133 (2021) 105029.
- [10] W. Xie, E. W. M. Lee, Y. Y. Lee, Self-organisation phenomena in pedestrian counter flows and its modelling, Safety Science 155 (2022) 105875.
- [11] J. Lee, T. Kim, J. Chung, J. Kim, Modeling lane formation in pedestrian counter flow and its effect on capacity, KSCE Journal of Civil Engineering 20 (3) (2016) 1099–1108, publisher Copyright: © 2016, Korean Society of Civil Engineers and Springer-Verlag Berlin Heidelberg.
- [12] D. Helbing, I. J. Farkas, P. Molnar, T. Vicsek, Simulation of pedestrian crowds in normal and evacuation situations, Pedestrian and evacuation dynamics 21 (2) (2002) 21–58.
- [13] X. Song, K. Chen, X. Li, J. Sun, B. Hou, Y. Cui, B. Zhang, G. Xiong, Z. Wang, Pedestrian trajectory prediction based on deep convolutional lstm network, IEEE Transactions on Intelligent Transportation Systems 22 (6) (2021) 3285–3302.
- [14] Y. Ma, E. W. Lee, Z. Hu, M. Shi, R. K. Yuen, An intelligence-based approach for prediction of microscopic pedestrian walking behavior, IEEE Transactions on Intelligent Transportation Systems 20 (10) (2019) 3964–3980.
- [15] J. Ma, W. guo Song, Z. ming Fang, S. ming Lo, G. xuan Liao, Experimental study on microscopic moving characteristics of pedestrians in built corridor based on digital image processing, Building and Environment 45 (10) (2010) 2160–2169.
- [16] X. Liu, W. Song, J. Zhang, Extraction and quantitative analysis of microscopic evacuation characteristics based on digital image processing, Physica A: Statistical Mechanics and its Applications 388 (13) (2009) 2717–2726.
- [17] M. Boltes, A. Seyfried, Collecting pedestrian trajectories, Neurocomputing 100 (2013) 127–133, special issue: Behaviours in video.
- [18] Y. Ma, E. W. M. Lee, R. K. K. Yuen, An artificial intelligence-based approach for simulating pedestrian movement, IEEE Transactions on Intelligent Transportation Systems 17 (11) (2016) 3159–3170.
- [19] X. Zhao, L. Xia, J. Zhang, W. Song, Artificial neural network based modeling on unidirectional and bidirectional pedestrian flow at straight corridors, Physica A: Statistical Mechanics and its Applications 547 (2020) 123825.
- [20] X. Zhao, J. Zhang, W. Song, A radar-nearest-neighbor based data-driven approach for crowd simulation, Transportation Research Part C: Emerging Technologies 129 (2021) 103260.
- [21] X. Liang, E. W. M. Lee, Visual-information-driven model for crowd simulation using temporal convolutional network, IEEE Transactions on Intelligent Transportation Systems 25 (9) (2024) 12297–12314.
- [22] N. Jiang, L. Yang, R. K. K. Yuen, C. Zhai, Modeling the pedestrian flow before bottleneck through learning-based method, IEEE Transactions on Intelligent Transportation Systems 24 (7) (2023) 7035–7047.
- [23] H. Li, Z. Liu, B. Zhou, Modeling analysis of t-shaped crowd flow based on artificial neural network, in: CIBDA 2022; 3rd International Conference on Computer Information and Big Data Applications, 2022, pp. 1–5.
- [24] N. Jiang, E. W. M. Lee, L. Yang, R. K. K. Yuen, C. Zhai, A deep-learning-based approach for simulating pedestrian turning flow, Expert Systems with Applications 262 (2025) 125706.
- [25] R. Bastien, P. Romanczuk, A model of collective behavior based purely on vision, Science Advances 6 (6) (2020) eaay0792.
- [26] G. Courtine, M. Schieppati, Human walking along a curved path. i. body trajectory, segment orientation and the effect of vision, European Journal of Neuroscience 18 (1) (2003) 177–190.
- [27] J. Ma, W. Song, Z. Fang, S. Lo, G. Liao, Experimental study on microscopic moving characteristics of pedestrians in built corridor based on digital image processing, Building and Environment 45 (10) (2010) 2160–2169.
- [28] D. Yanagisawa, A. Kimura, A. Tomoeda, R. Nishi, Y. Suma, K. Ohtsuka, K. Nishinari, Introduction of frictional and turning function for pedestrian outflow with an obstacle, Physical Review E 80 (3) (sep 2009).
- [29] D. Helbing, Traffic and related self-driven many-particle systems, Rev. Mod. Phys. 73 (2001) 1067–1141.
- [30] W. Xie, E. W. M. Lee, Y. Y. Lee, Simulation of spontaneous leader–follower behaviour in crowd evacuation, Automation in Construction 134 (2022) 104100.
- [31] J. Wąs, B. Gudowski, P. J. Matuszyk, Social distances model of pedestrian dynamics, in: S. El Yacoubi, B. Chopard, S. Bandini (Eds.), Cellular Automata, Springer Berlin Heidelberg, Berlin, Heidelberg, 2006, pp. 492–501.
- [32] S. Bai, J. Z. Kolter, V. Koltun, An empirical evaluation of generic convolutional and recurrent networks for sequence modeling, arXiv preprint arXiv:1803.01271 (2018).
- [33] T. Salimans, D. P. Kingma, Weight normalization: A simple reparameterization to accelerate training of deep neural networks, Advances in neural information processing systems 29 (2016).
- [34] V. Nair, G. E. Hinton, Rectified linear units improve restricted boltzmann machines, in: Icml, 2010.
- [35] N. Srivastava, G. Hinton, A. Krizhevsky, I. Sutskever, R. Salakhutdinov, Dropout: a simple way to prevent neural networks from overfitting, The journal of machine learning research 15 (1) (2014) 1929–1958.
- [36] D. P. Kingma, J. Ba, Adam: A method for stochastic optimization (2017). arXiv:1412.6980.
- [37] M. Chraibi, M. Freialdenhoven, A. Schadschneider, A. Seyfried, Modeling the desired direction in a force-based model for pedestrian dynamics, in: V. V. Kozlov, A. P. Buslaev, A. S. Bugaev, M. V. Yashina, A. Schadschneider, M. Schreckenberg (Eds.), Traffic and Granular Flow ’11, Springer Berlin Heidelberg, Berlin, Heidelberg, 2013, pp. 263–275.
- [38] J. Zhang, W. Klingsch, A. Schadschneider, A. Seyfried, Transitions in pedestrian fundamental diagrams of straight corridors and t-junctions, Journal of Statistical Mechanics: Theory and Experiment 2011 (06) (2011) P06004.
- [39] S. Hoogendoorn, P. Bovy, Pedestrian route-choice and activity scheduling theory and models, Transportation Research Part B: Methodological 38 (2) (2004) 169–190.
- [40] M. Haghani, M. Sarvi, Pedestrian crowd tactical-level decision making during emergency evacuations, Journal of Advanced Transportation 50 (8) (2016) 1870–1895.
- [41] Z. Fu, K. Jiang, C. Xie, Y. Xu, J. Huang, D. Yang, Summary and reflections on pedestrian trajectory prediction in the field of autonomous driving, IEEE Transactions on Intelligent Vehicles (2024) 1–33.
- [42] A. Alahi, K. Goel, V. Ramanathan, A. Robicquet, L. Fei-Fei, S. Savarese, Social lstm: Human trajectory prediction in crowded spaces, in: 2016 IEEE Conference on Computer Vision and Pattern Recognition (CVPR), 2016, pp. 961–971.