2025 \Received\Accepted
Galaxy : centre — Galaxy : structure — ISM : clouds — ISM : molecules — ISM : kinematics and dynamics
The Galactic-Centre Arms inferred from ACES (ALMA CMZ Exploration Survey)
Abstract
Analyzing longitude-velocity diagrams (LVDs) in the CS ()and H13CN molecular lines from the internal release data of the ALMA Central-Molecular-Zone Exploration Survey (ACES) and in the 13CO line from the Nobeyama Galactic Center (GC) survey, we identify six GC arms as prominent straight LV ridges. In addition to the currently known Arms I to IV, we identify a new inner arm, Arm V, and further highlight the circumnuclear disc (CND) as Arm VI. Integrated intensity maps of the arm on the sky suggest that most of the Arms compose ring-like structures inclined from the Galactic plane. We determine the radii (curvatures) of the arms using the velocity gradient () method, assuming that the arms are rotating in circular orbits at a constant velocity of km s-1. We show that Arms I and II compose the main ring structure of the CMZ with radii –120 pc; Arm III is a dense arm 42 pc from the GC; Arm IV is a clear and narrow arm 20 pc from the GC; and Arm V is a faint, long arm of 8.2 pc radius. We show that the circumnuclear disc (CND) comprises the sixth arm, Arm VI, of radius pc associated with bifurcated spiral fins. We also discuss the association of 20- and 50-km s-1clouds with these arms. The radii of the arms fall on an empirical relation for (Arm I) to 6 (VI), suggesting discrete rings or a logarithmic spiral with pitch angle . The vertical full extent of the arm increases with radius and is represented by pc. The tilt angle of the arms from the Galactic plane, or the warping, increases rapidly toward the GC.
1 Introduction
Because we see the Galactic Central Molecular Zone (CMZ) edge-on, its true 3D structure is challenging to decipher and remains substantially uncertain (Morris & Serabyn, 1996; Henshaw et al., 2016; Sofue, 2022; Henshaw et al., 2023). Kinematic analysis of longitude-velocity diagrams (LVDs), assuming Galactic rotation, offers one way to help resolve line-of-sight degeneracy (Bally et al., 1987, 1988; Sofue, 1995, 2022; Oka et al., 1998; Tsuboi et al., 1999; Kruijssen et al., 2015; Henshaw et al., 2016, 2023). Here, we exploit the special behavior of a rotating arm or a ring in the longitude-velocity diagram (LVD), which makes the LV ridge appear sharpest near its intersection with the rotation axis at . The absorption of line emission against the background continuum helps to distinguish the far and near sides of clouds relative to Sgr A∗ (Sawada et al., 2004; Yan et al., 2017; Sofue, 2022).
The coherent ridges on the LVD suggest that the CMZ is structured into multiple arms. The densest and most prominent LV ridge seen in the 13CO line is called Arm I, the second is Arm II, and further arms (III and IV) have been proposed (Sofue, 1995). There seems to be consensus that Arms I and II compose a ring structure of radius -120 pc (the "120 pc ring") (Sofue, 1995; Oka et al., 1998; Tokuyama et al., 2019; Henshaw et al., 2016, 2023), which is understood as due to a large-scale accretion of gas from the outer Galactic disc (Molinari et al., 2011; Kim & Stone, 2012; Kruijssen et al., 2015; Krumholz & Kruijssen, 2015; Krumholz et al., 2017; Ridley et al., 2017; Sormani et al., 2019, 2020; Tress et al., 2020).
However, the more internal structure of molecular gas within the CMZ inside 120 pc ring appears to have not yet been fully explored but is believed to consist of a continuous disc, arm/rings or a hole (empty space), or a combination of these. Among these, the arm/ring structure can be most easily recognized using high-resolution molecular line mapping data, while the other structures may be obtained as the residual. For the purpose to map arms/rings of molecular gas, we analyze the data cubes observed with the Nobeyama 45-m telescope in the 13CO line, ASTE (Atacama Submm Telescope Experiments) 10-m telescope in HCN (), and ALMA (Atacama Large Millimeter/submillimeter Array) in the course of the large project ACES (ALMA CMZ Exploration Survey) in CS () and H13CN lines (ALMA Program, 2021.1.00172.L. PI: S. Longmore et al. in preparation). Thanks to the high spatial resolution offered by ALMA, we can much improve arm-identification at the very center inside .
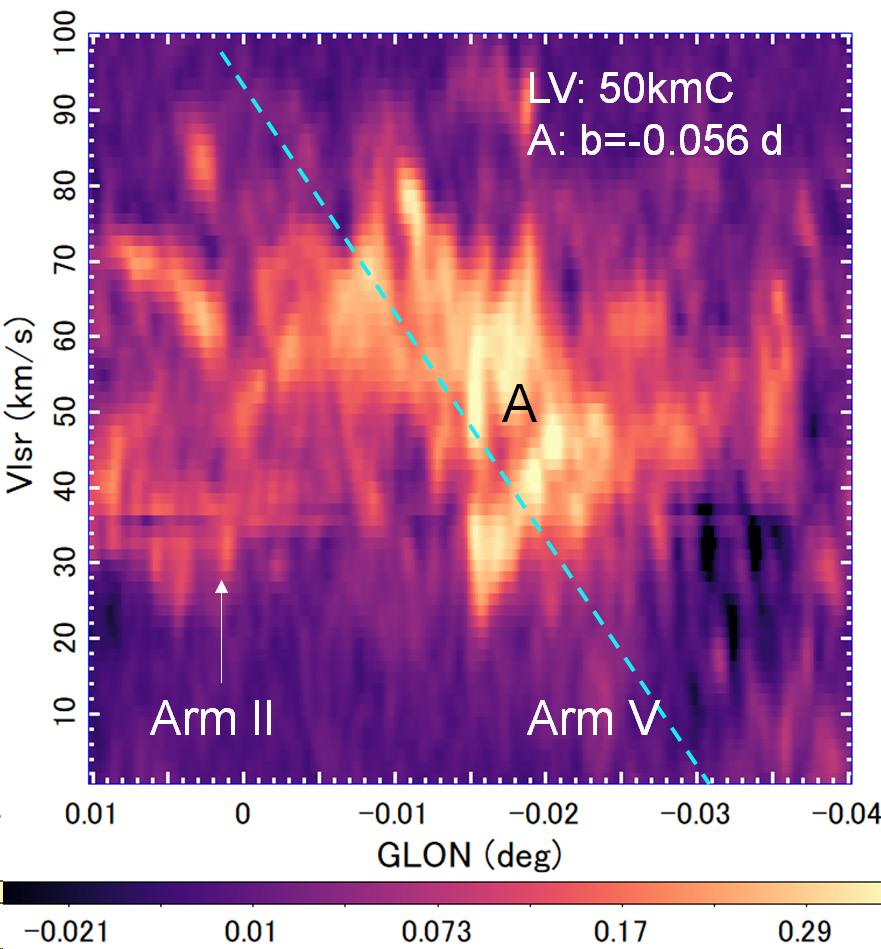
The region around Sgr A∗ contains many well-known molecular clouds including the 50-km s-1 cloud (hereafter 50kmC) and 20-km s-1 cloud (20kmC) (Genzel et al., 1990; Tsuboi et al., 2009; Takekawa et al., 2017a), high-velocity compact clouds (HVCCs) (Oka et al., 1999; Iwata et al., 2023), the circumnuclear disk (CND) (Wright et al., 2001; Tsuboi et al., 2018), and the mini-spirals around Sgr A∗(Tsuboi et al., 2017). We try to understand these innermost structures under a unified view of a molecular disc with arms/rings rapidly rotating in deep gravitational potential which reaches the specific kinetic energies of erg g-1 at –150 km s-1.
In this study, we combine the data of the 13CO and HCN ()in a single dish with the interferometric mosaics of ACES in CS ()and H13CN in to determine the internal kinematic structure of the CMZ by constraining the radii and vertical extents of the arms/rings present within pc. This will help us visualize the gaseous structure in the circum-nuclear region, which is essential to carry out the 3D modeling of the CMZ.
We adopted a solar galactocentric distance kpc, close to the recent measurement (Gravity Collaboration et al., 2019), for convenience to compare with the other works. The coordinates of Sgr A∗ is taken to be , and the LSR (Local Standard of Rest) velocity is assumed to be km s-1.
2 Data and analysis
2.1 Single-dish data
We used the archival data cube of the 13CO line at 110.27 GHz taken from the CMZ survey obtained using the Nobeyama 45-m telescope (Tokuyama et al., 2019). The data cube had sampling grids of with an effective resolution of which yielded an rms noise of K in brightness temperature, . We also used an archival data cube of the HCN () line emission at 354.5 GHz from the GC survey with the ASTE 10-m telescope (Tanaka et al., 2018), which had ( km s-1) grids with an effective angular resolution of and rms noise of 0.14 K in .
2.2 ACES
The molecular-line cubes from ALMA used in this work were taken from the internal release version of the 12m+7m+TP (total power)-mode data from the ALMA cycle 8 Large Program "ALMA Central Molecular Zone Exploration Survey" (ACES, 2021.1.00172.L; Longmore et al. in preparation). ACES observed the CMZ in ALMA Band 3, covering a frequency range of 86 - 101 GHz across six spectral windows of varying spectral resolution and bandwidth.
The ALMA pipeline calibrated measurement sets were produced using CASA 6.4.1.12, and all of the 12m and 7m data were re-imaged using CASA 6.4.3-2. In general the imaging parameters were the same as those used by the pipeline to produce the delivered data, but there were instances where parameters were changed, in particular to fix divergent channels, and to undo size mitigation performed by the default pipeline parameters.
We also found that the ALMA pipeline often did not perform optimally when identifying the line-free channels in the data, resulting in residual continuum emission after performing the continuum subtraction. The pipeline also used a polynomial fit order of 1, which often resulted in poor baselines after continuum subtraction, particularly in the narrow spectral windows which are often filled with broad line emission. To fix these issues, we first re-ran the continuum subtraction using a fit order of 0, and then additionally used statcont (Sánchez-Monge et al., 2018) to remove the residual continuum emission. After re-imaging and subtracting the continuum, we combined the 12m, 7m, and TP data using the feather task in CASA. We first combined the 7m and TP cubes, then combine this 7m+TP cube with the 12m data.
The ACES coverage is split into 45 individual sub-mosaics, each with approximately 150 pointings. For each line/SPW, we used the radio-beam and reproject Python packages to convolve all sub-mosaics to a common beam, and then project on to the full ACES footprint. The resulting cubes provide a contiguous mosaic of the CMZ.
We used the cubes in the CS ()line at a frequency 97.9810 GHz with FWHM angular resolution of the synthesized beam and rms noise of 0.0038 Jy beam-1(0.10 K) with velocity channel increment of 1.45 km s-1, and H13CN line at 86.3399 GHz with resolution and rms noise 0.0046 Jy beam-1 (0.10 K) with a velocity channel increment 0.88 km s-1. The intensity scales are Jy beam-1 (1 Jy beam-1 and 22.2 K in brightness temperature at 98 and 86 GHz, respectively).
The cubes cover the CMZ at and , and velocity ranges were km s-1 and km s-1, respectively, with spatial and velocity grids of ( km s-1). We further cut out a more interior region at and for a detailed analysis of the circum-nuclear region centered on Sgr A∗.
2.3 Definition and identification of the Arms
The goal of this paper is to identify spiral arms, rings, and/or segments thereof (hereafter "arms") in the CMZ that rotate within the Galactic gravitational potential, and to quantify their galacto-central radii or curvatures. An "arm" is defined here by a tilted ridge on the LVD that extends straightly for km s-1, indicating a coherent ring-like structure rotating at –150 km s-1.
We used the 13CO line from the single dish to trace the arms and extended structure in the entire CMZ. The lines CS () and H13CN from the ALMA cubes were chosen to trace the innermost arms, which are supposed to consist of relatively denser molecular gas (Shirley, 2015), for a complementary analysis to the 13CO line from the single dish.
To identify the arms, we exploit a special property of the LVD that, due to the degeneracy of the radial velocity, the arms appear clearest and brightest near their intersection with the axis of rotation at . Although some arms overlap at , they can be distinguished from one another because their ridges run at different tilt angles (Sofue, 2006). Moreover, fortunately, noncircular motions overlap in most spiral arms, which yields displacements of from zero near , so in most cases the degeneracy is resolved, or the LV ridges do not overlap at the intersection point.
Note that there are four ways to display LVD as follows.
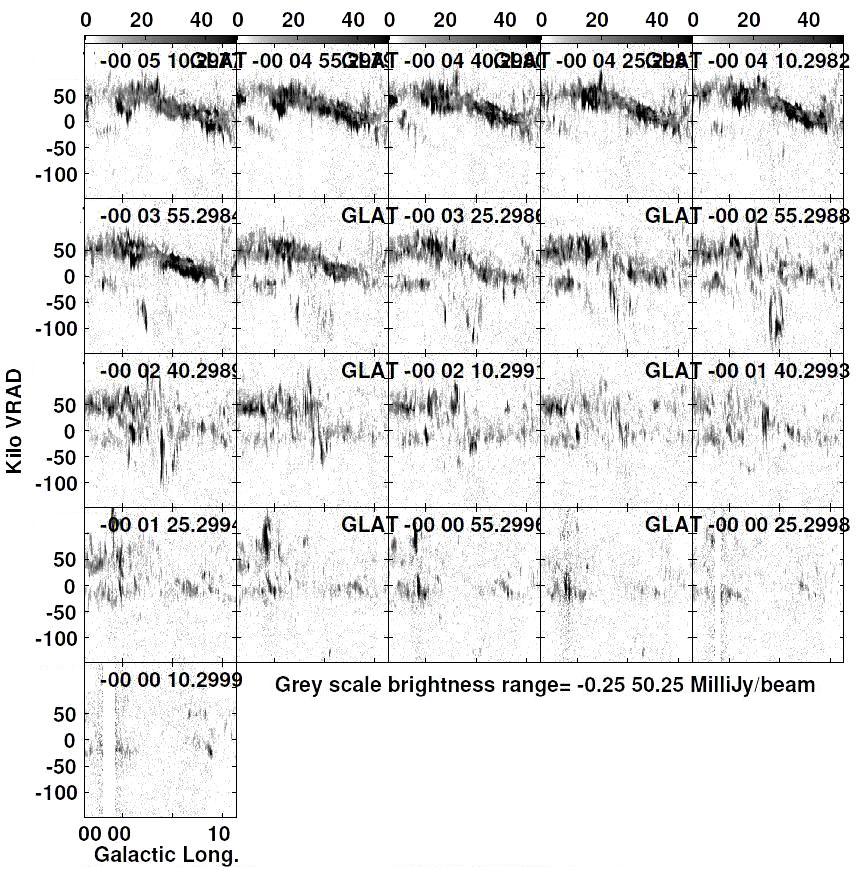
Type 1: channel LVD at every latitude as one channel of the cube;
Type 2: total average over all latitudes;
Type 3: average over selected latitudes; and
Type 4 LVD: maximum intensity (peak ) across latitudes.
They are all used in this work depending on the purpose of each figure.
However, especially in the central region, the LV arms are often buried in bright extended features. In order to abstract such buried arms by subtracting more extended structures, we apply the IMSHIFT relieving technique described in Appendix A. This method is particularly useful for the single-dish data with lower angular resolution.
By tracing the tilted LVD ridge (LVR), we measure the longitudinal velocity gradient , which is related to the radius or curvature of the arm as explained in detail in Section 4.1. For identifying a spiral arm or a ring, this method is more sensitive and accurate than measuring the terminal velocity ends at the farthest longitudes because the inherent width and velocity dispersion make it difficult to define the exact terminal longitude and velocity.
2.4 LVD "Arms"
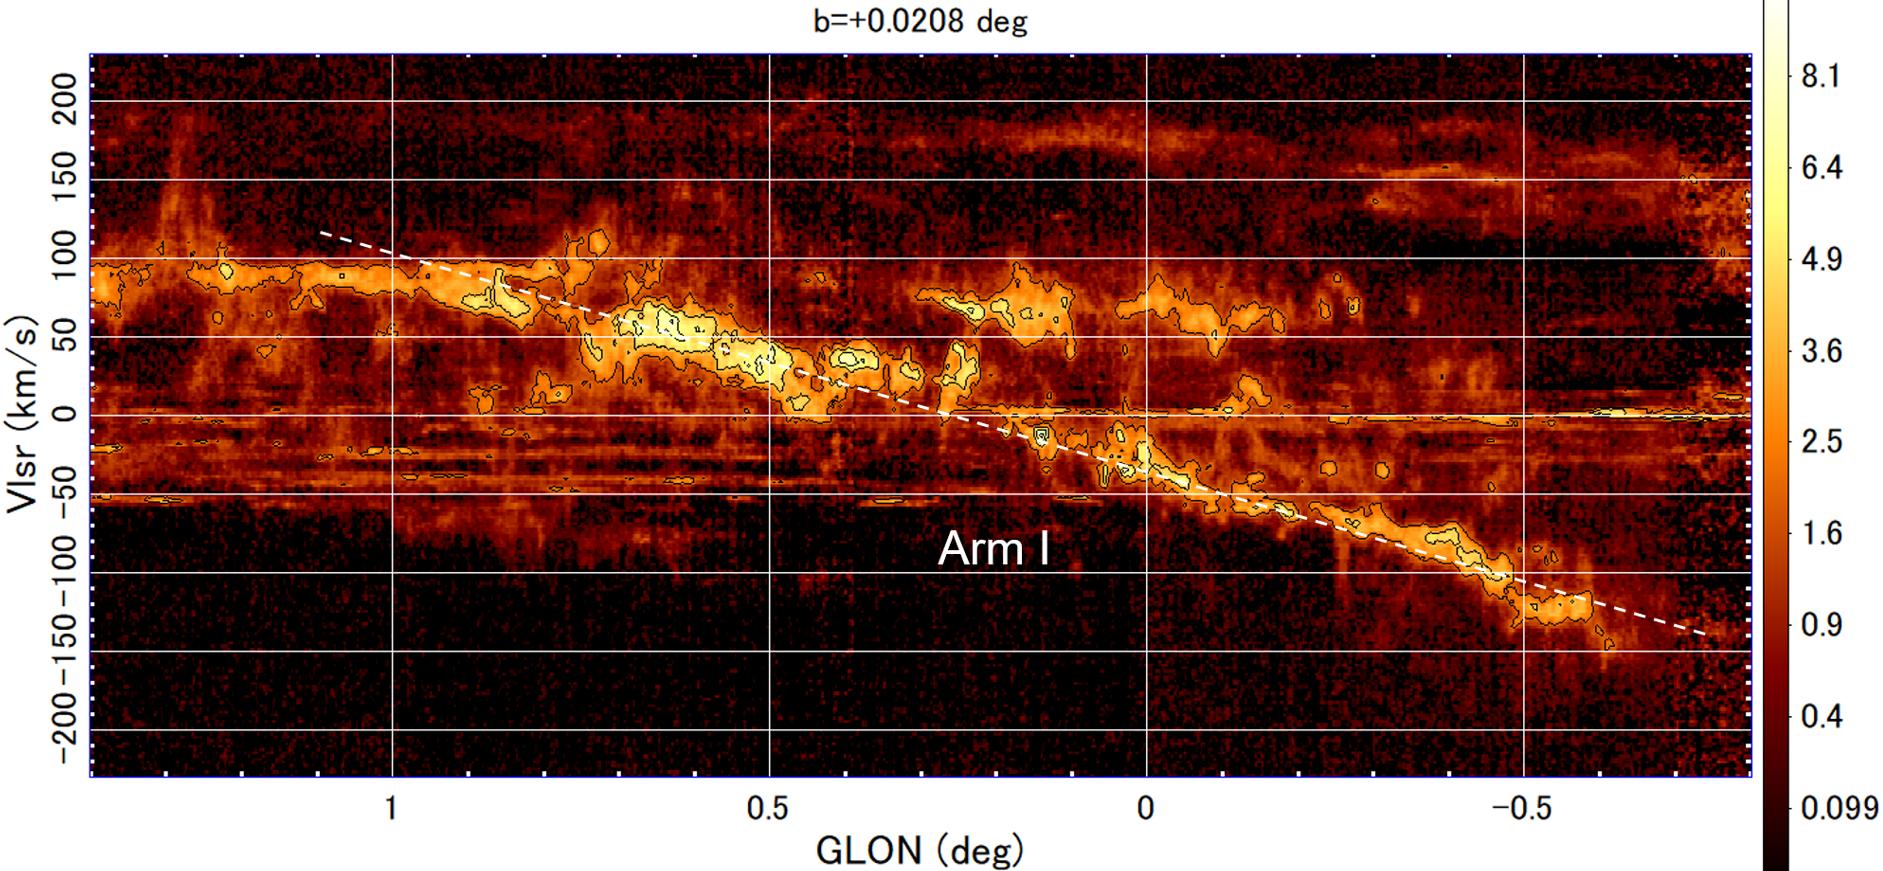
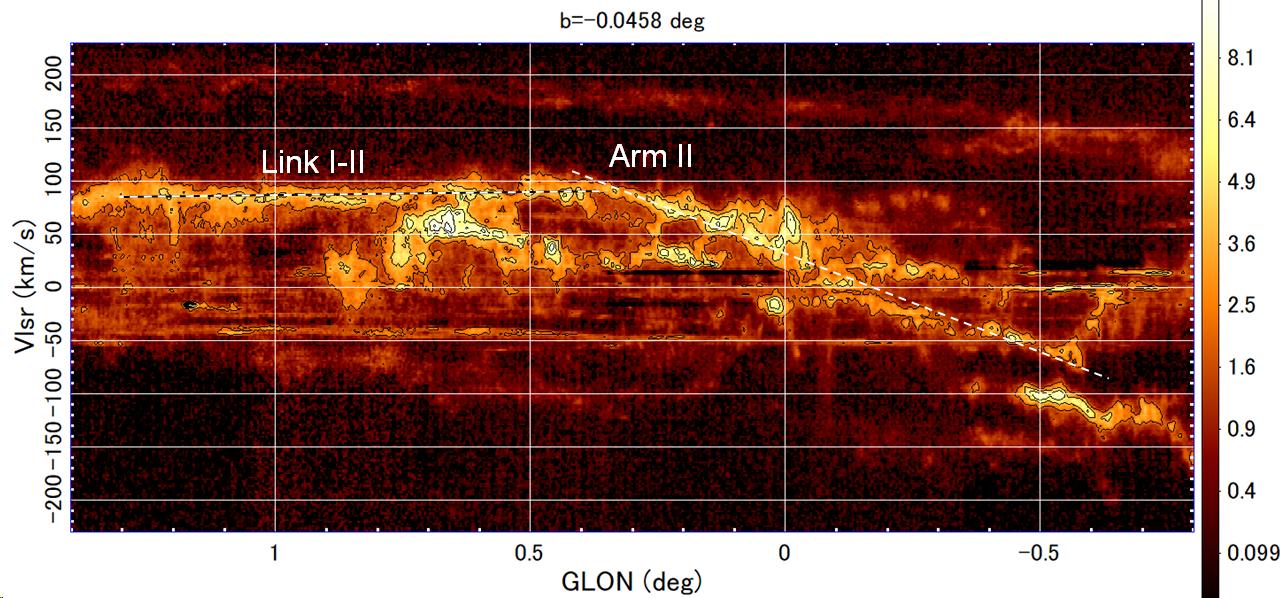
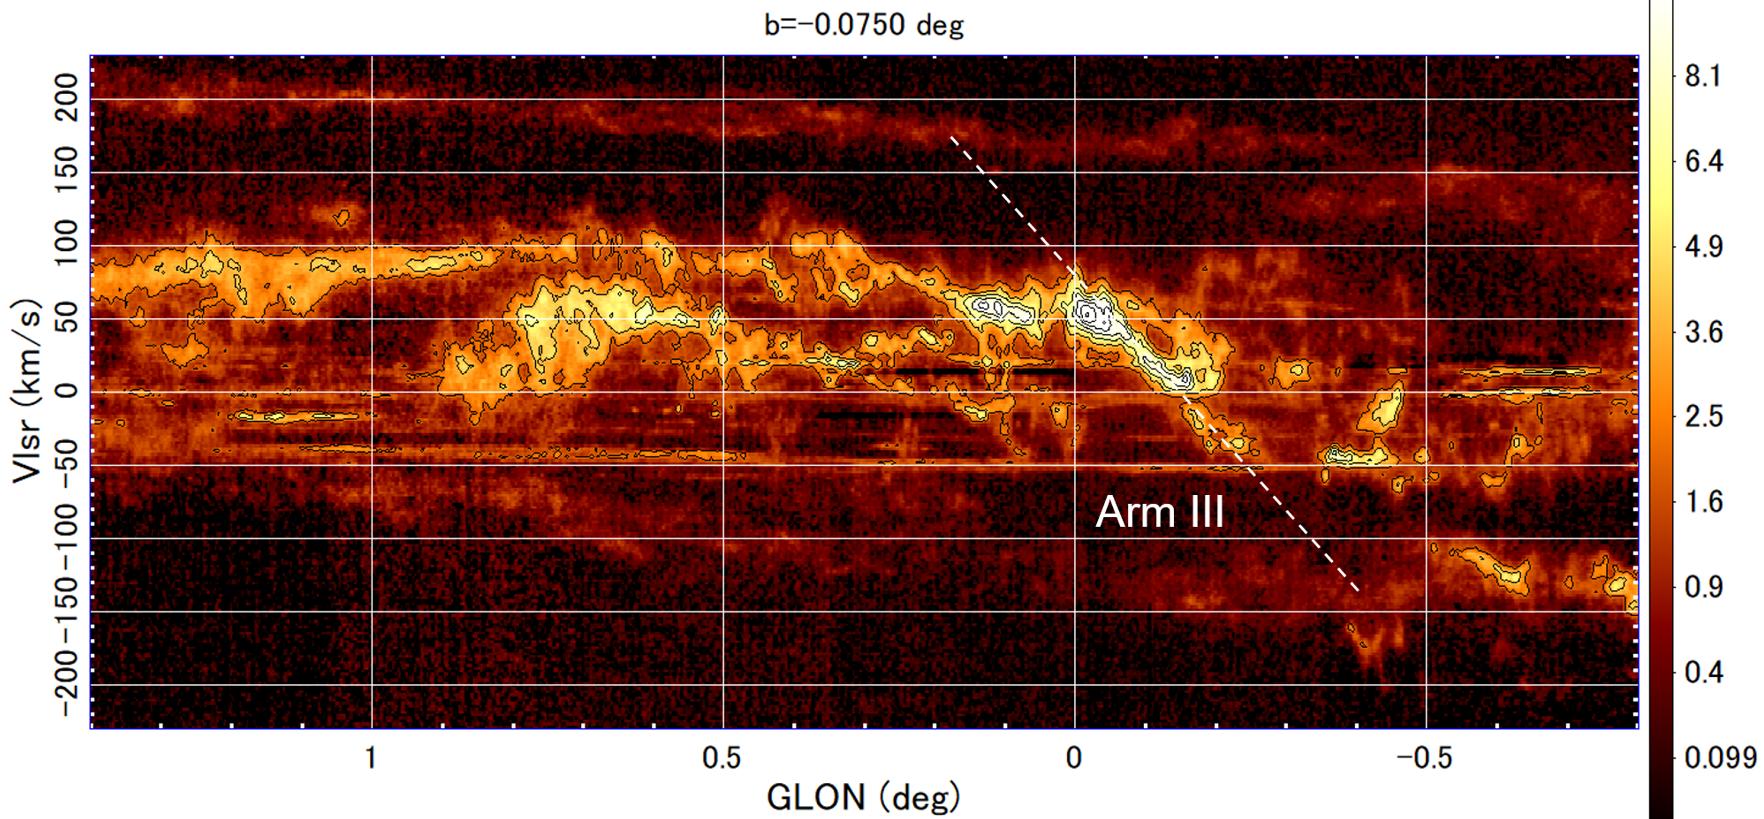
We search for arms in all channels of the cubes as LV ridges with extents over +/- 100 km/s. In figures 3 to 6 we show the LVDs at representative latitudes of the thus recognized GC Arms in the 13CO line from Nobeyama 45 m, HCN () from ASTE 10 m, and CS () and H13CN from ALMA. Details of the data are shown in individual panels of the figures and captions. The identified arms are marked by the white dashed lines or arrows with the corresponding names.
Arms are often too thin and faint to be recognized on a single LVD or on an averaged LVD. In order to convincingly trace such arms in more detail, we also use channel LVDs as presented in Appendix B.
Arm I: LVD (Type 1): 13CO : 45m
Arm II; LVD (Type 1); 13CO ; 45m
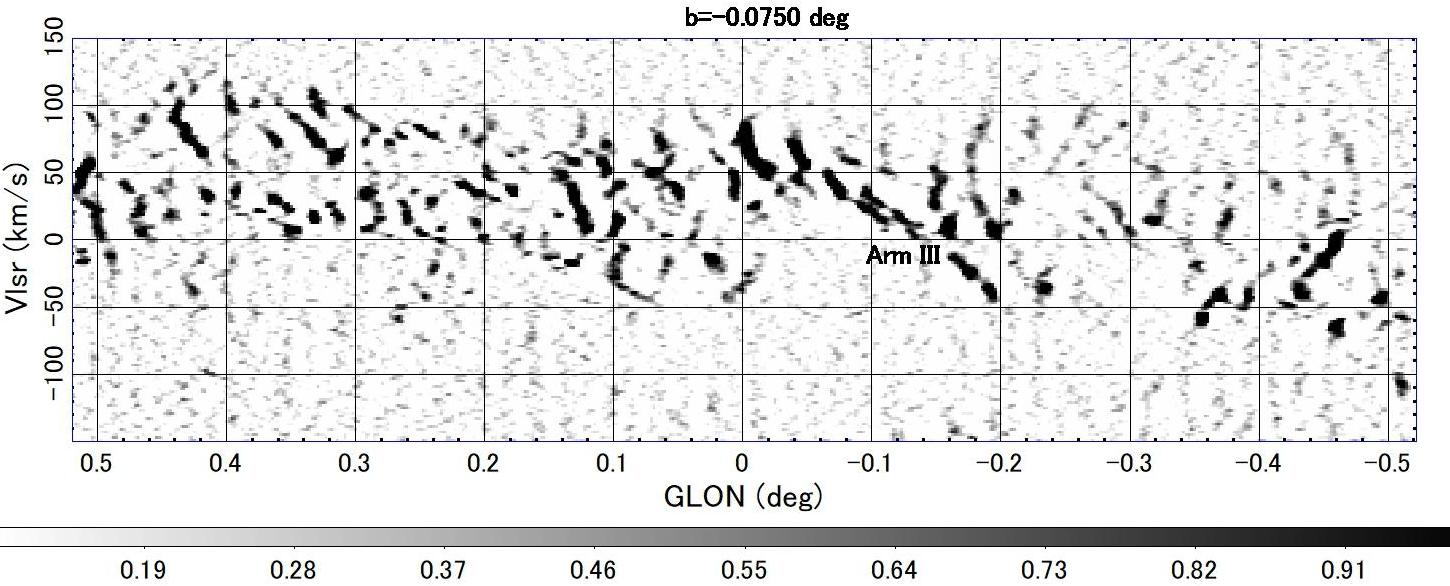
Arm III; LVD (Type 1); 13CO ; 45m
45m, Relief LVD (Type 1), 13CO
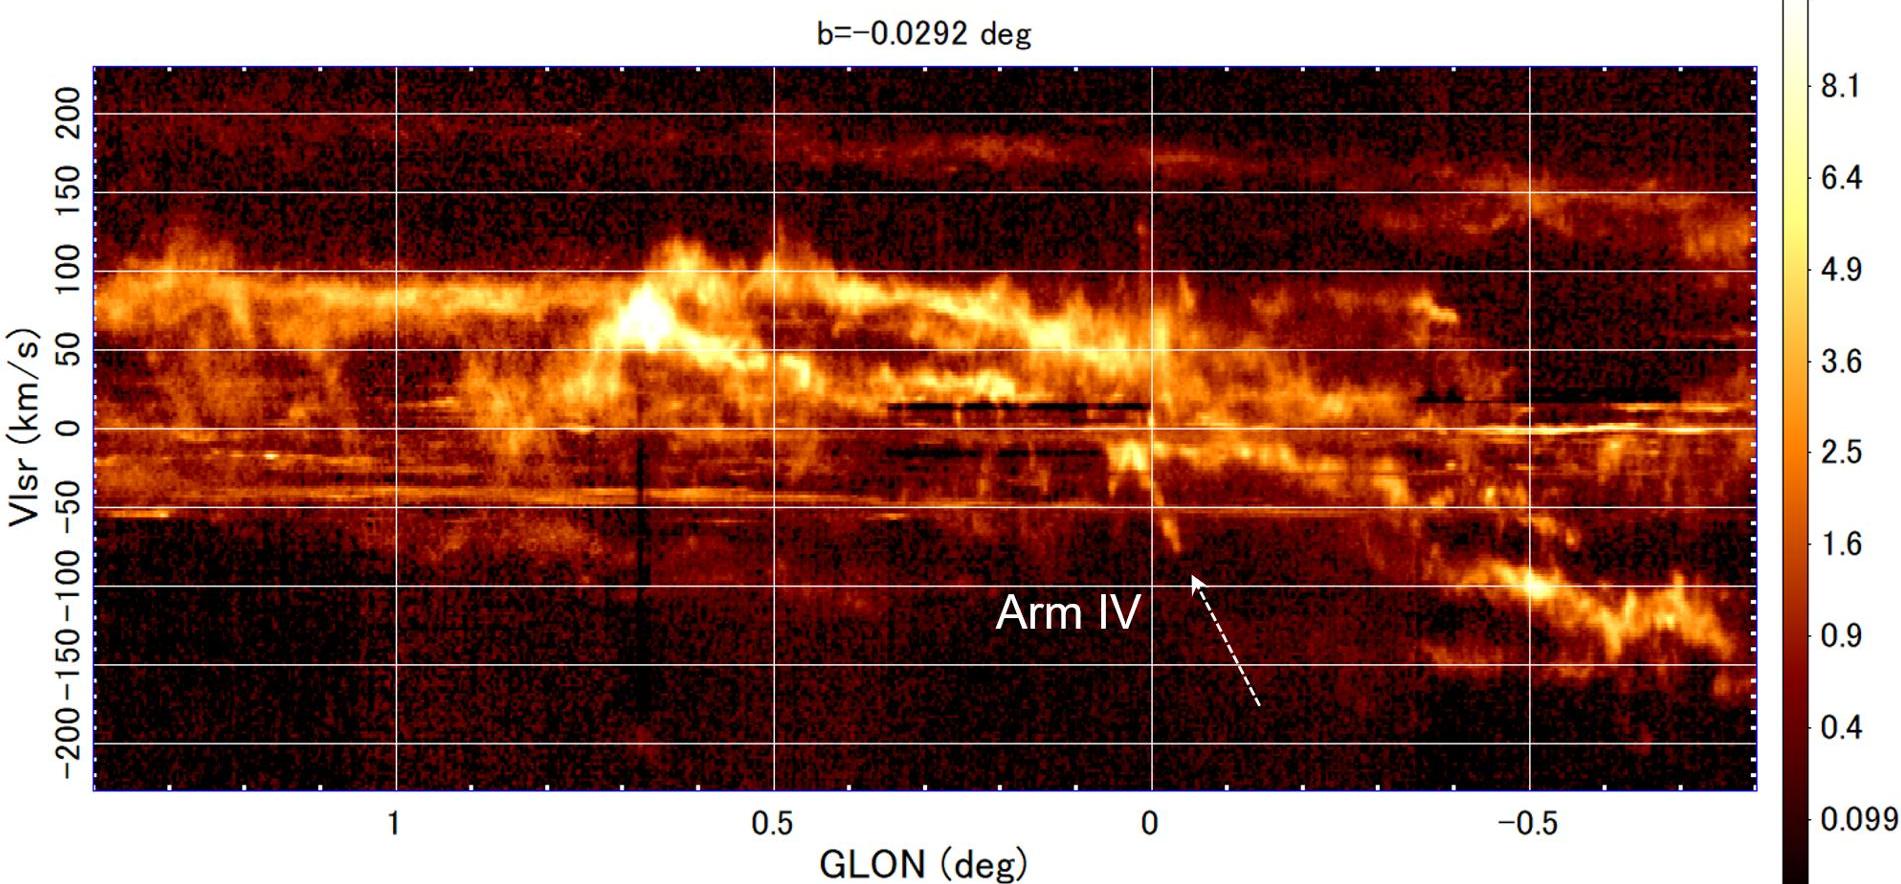
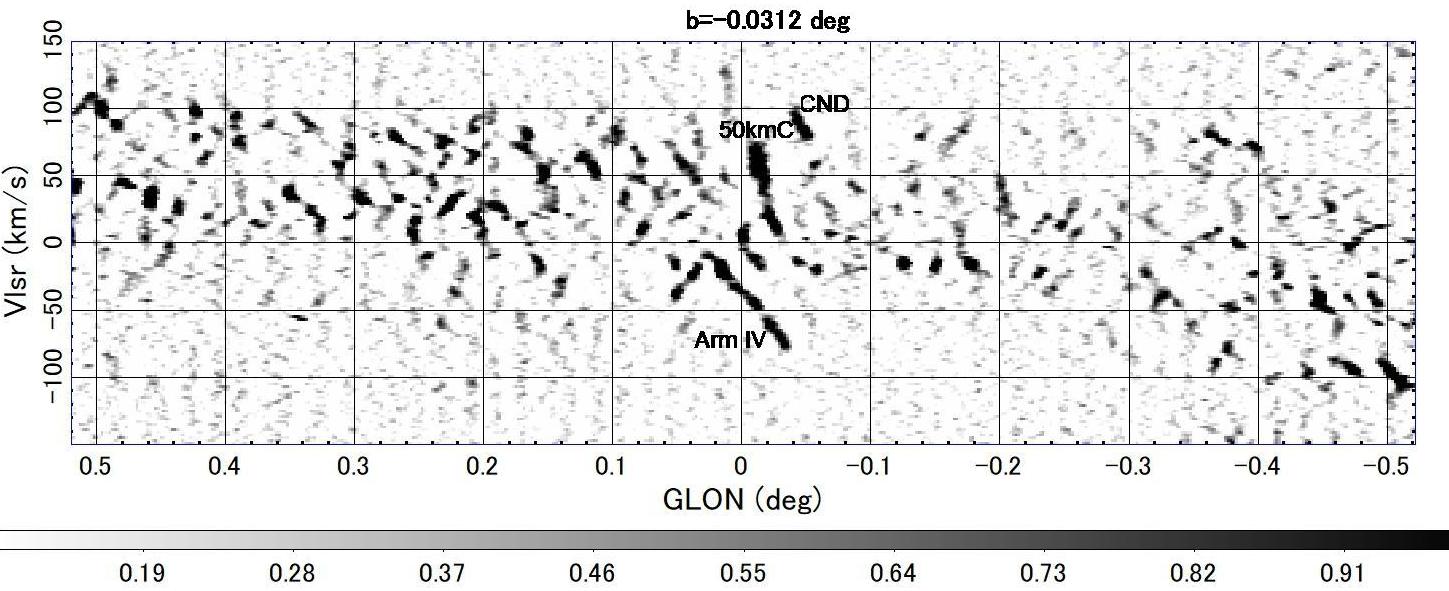
Arm IV; LVD (Type 1); 13CO ; 45m
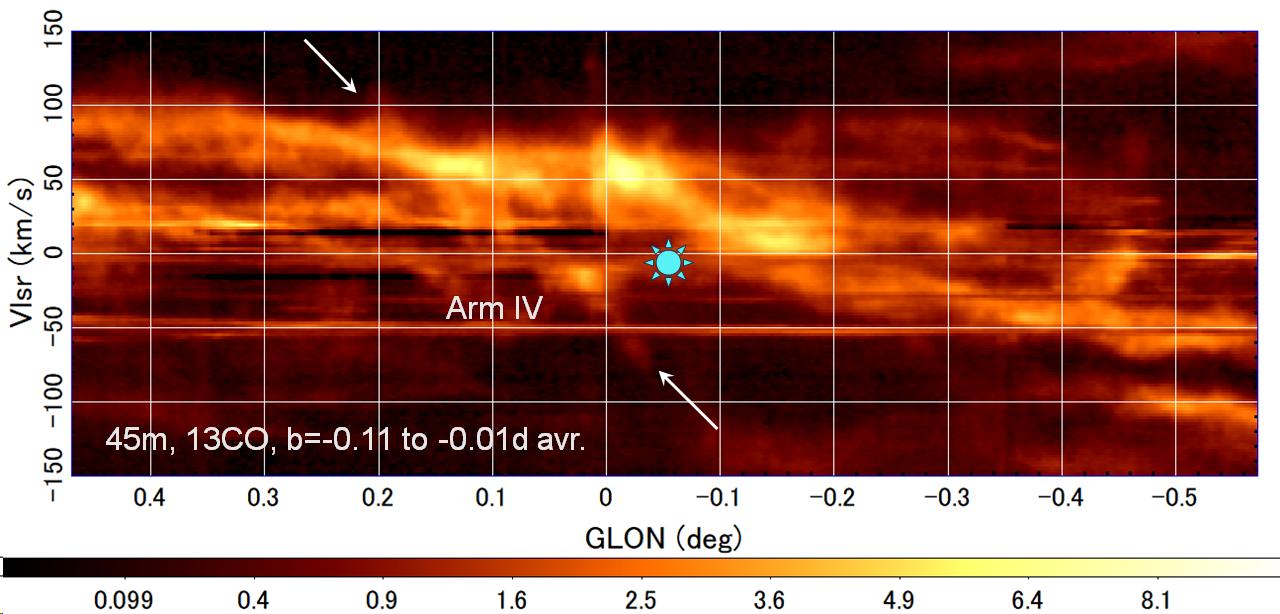
Arm IV; 13CO ; LVD (Type 3) Avr. to ; 45m
Arm IV; 13CO ; 45m Relief LVD (Type 1)
Arm V; LVD (Type 1) at ; 13CO ; 45m Relief
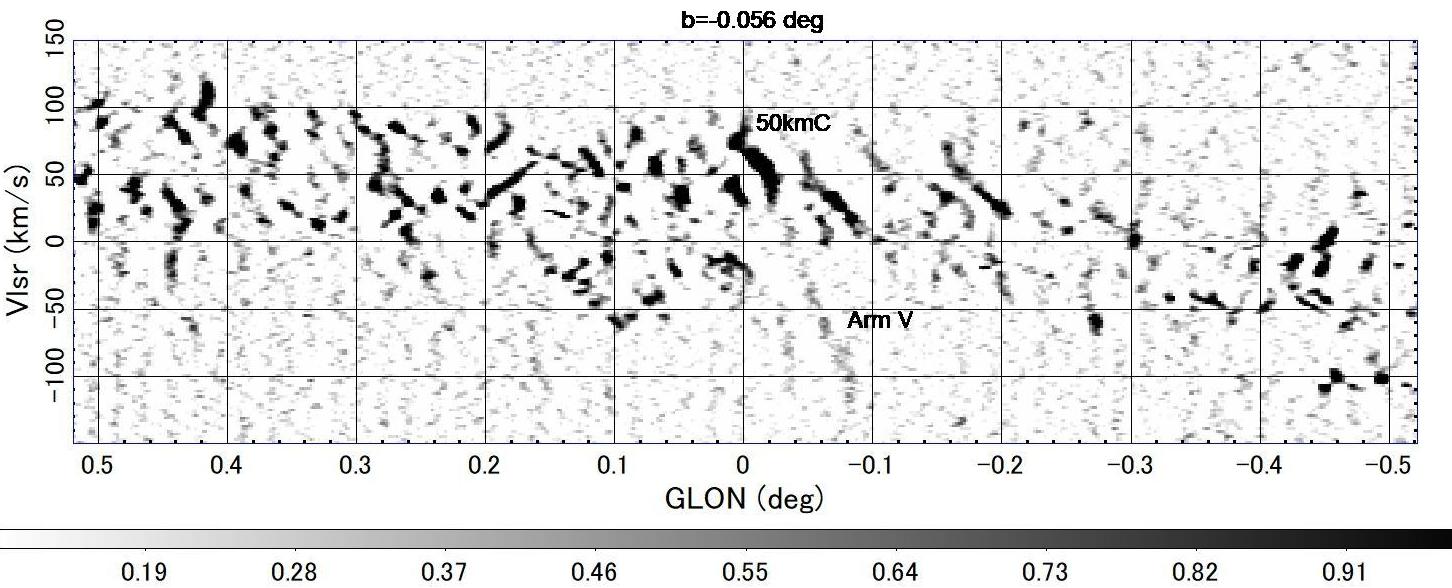
Arm IV & V; LVD (Type 2) avr. to ; 13CO ; 45m Relief
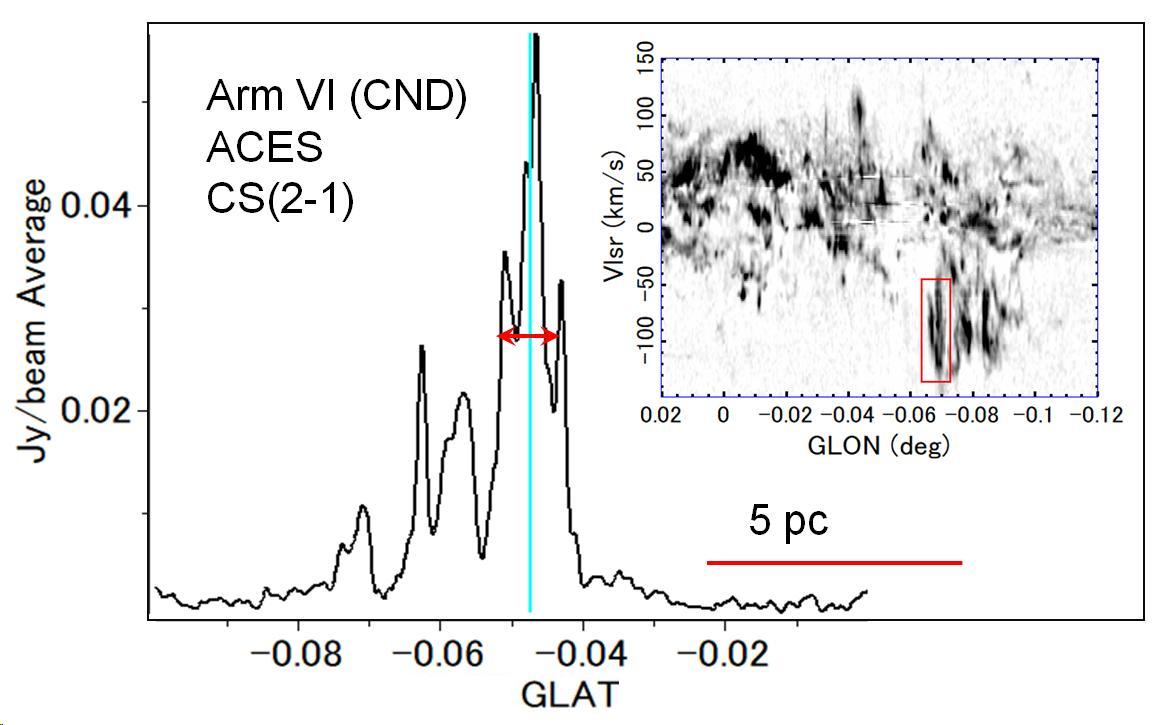
Arm V; LVD (Type 3) avr. ; CS (); ACES
Arm VI = CND
LVD (Type 1) Relief ; 13CO Nobeyama 45m
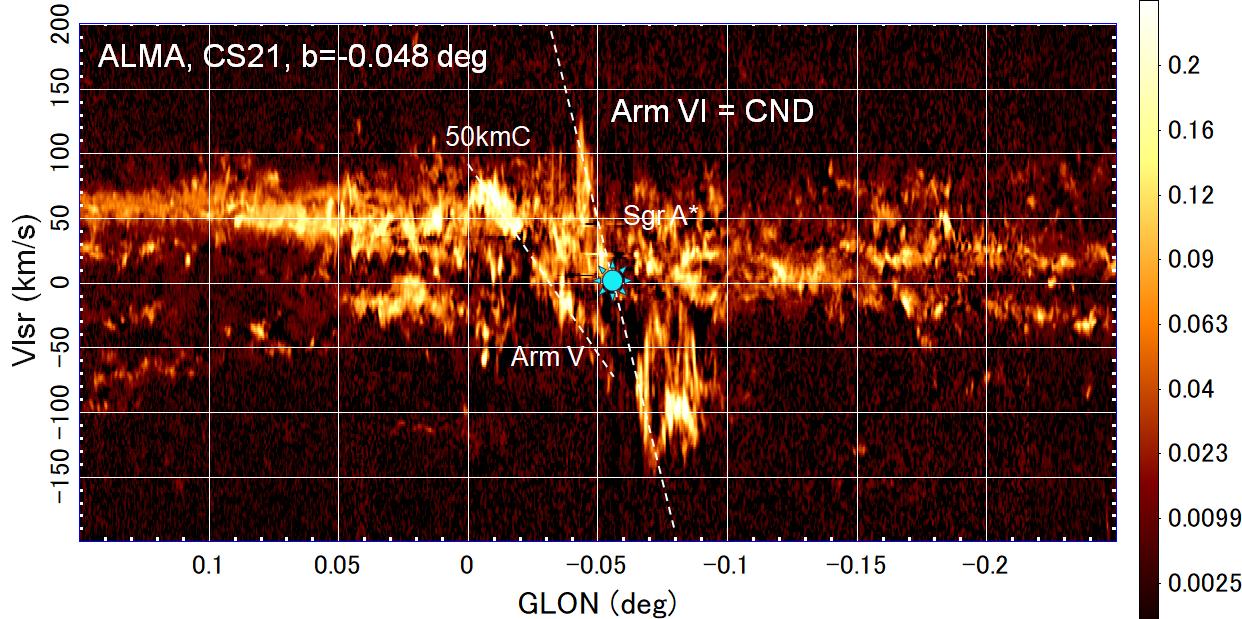
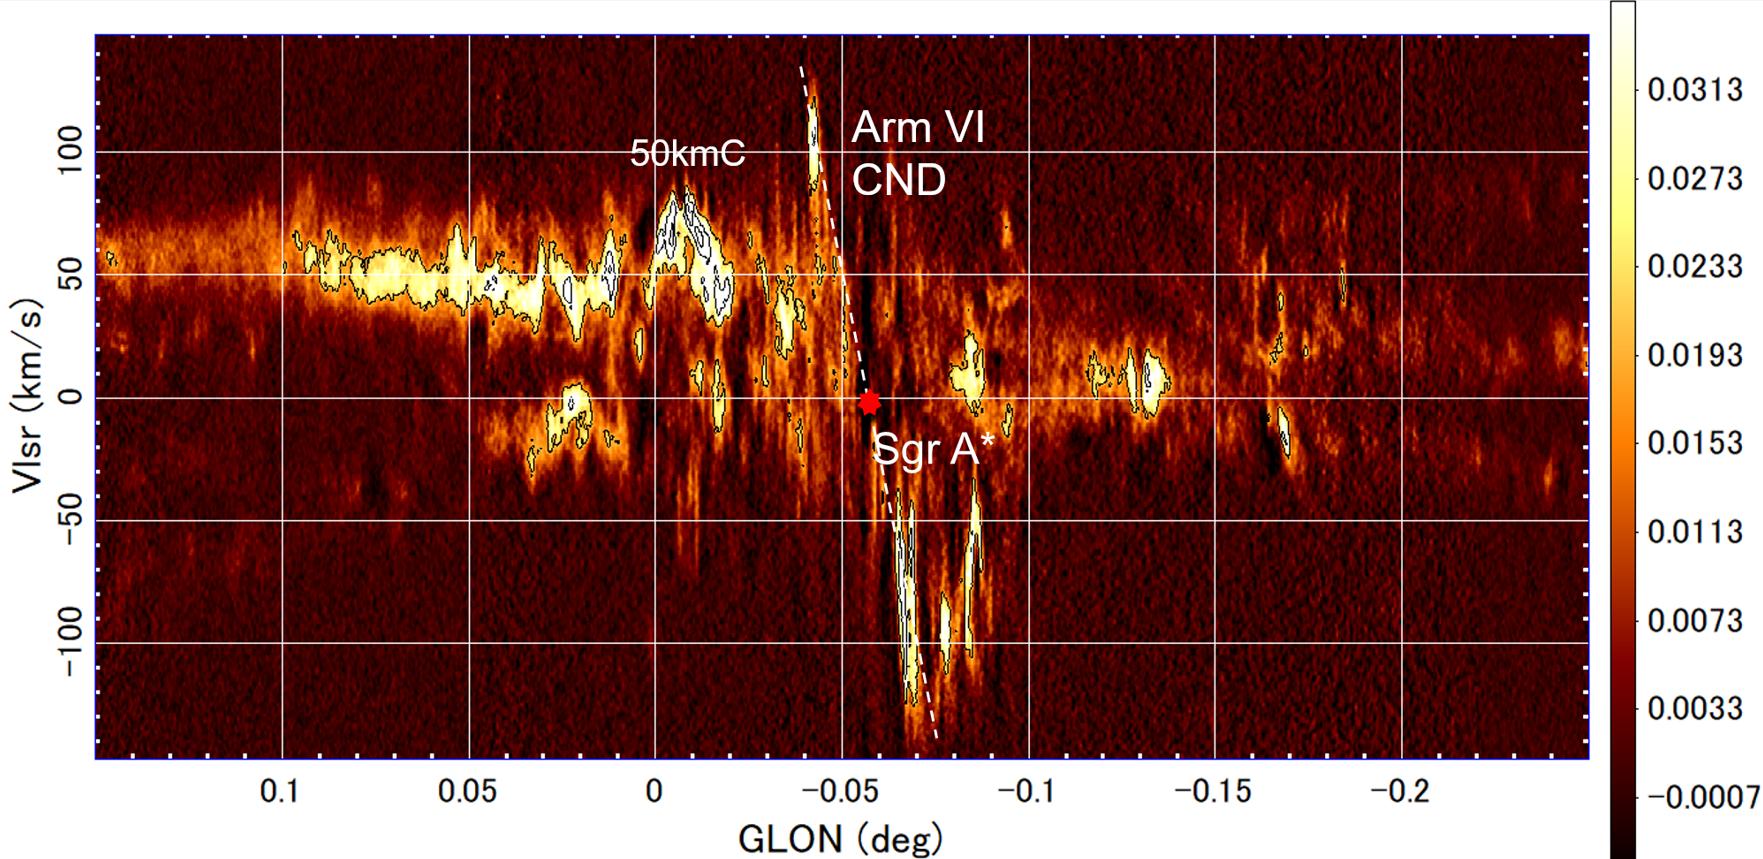
LVD (Type 1) ; CS () ACES
LVD (Type 3) Avr. channels; H13CN ACES
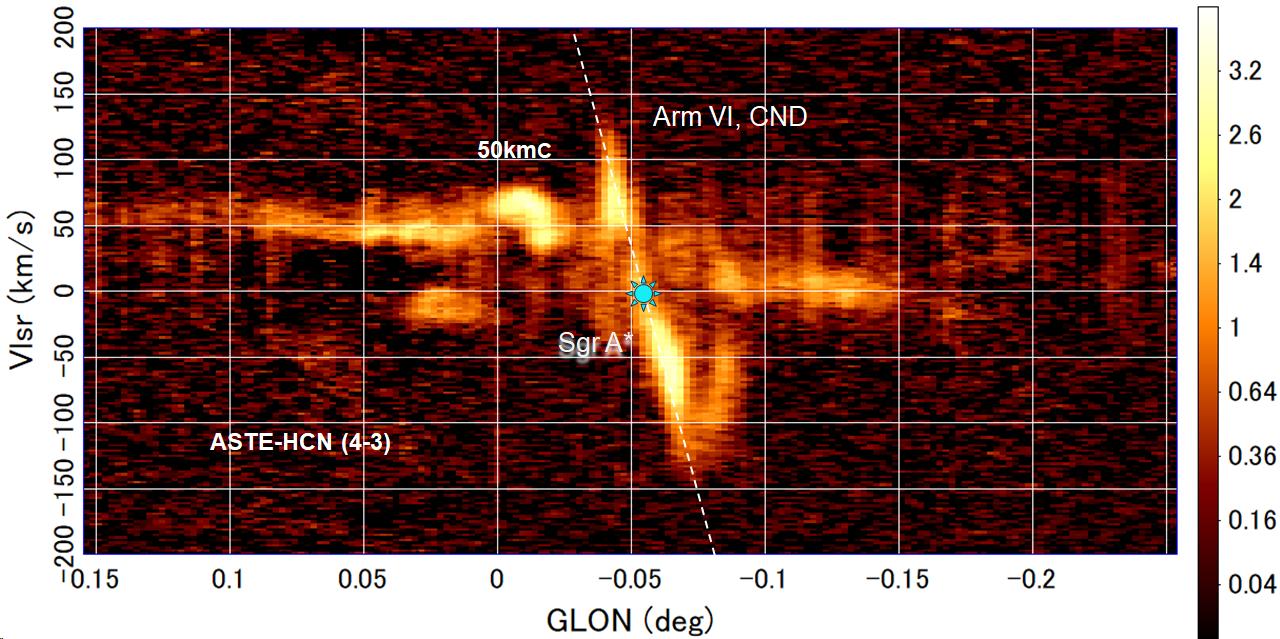
LVD (Type 2) Avr. all; Non relief; HCN () ASTE 10m
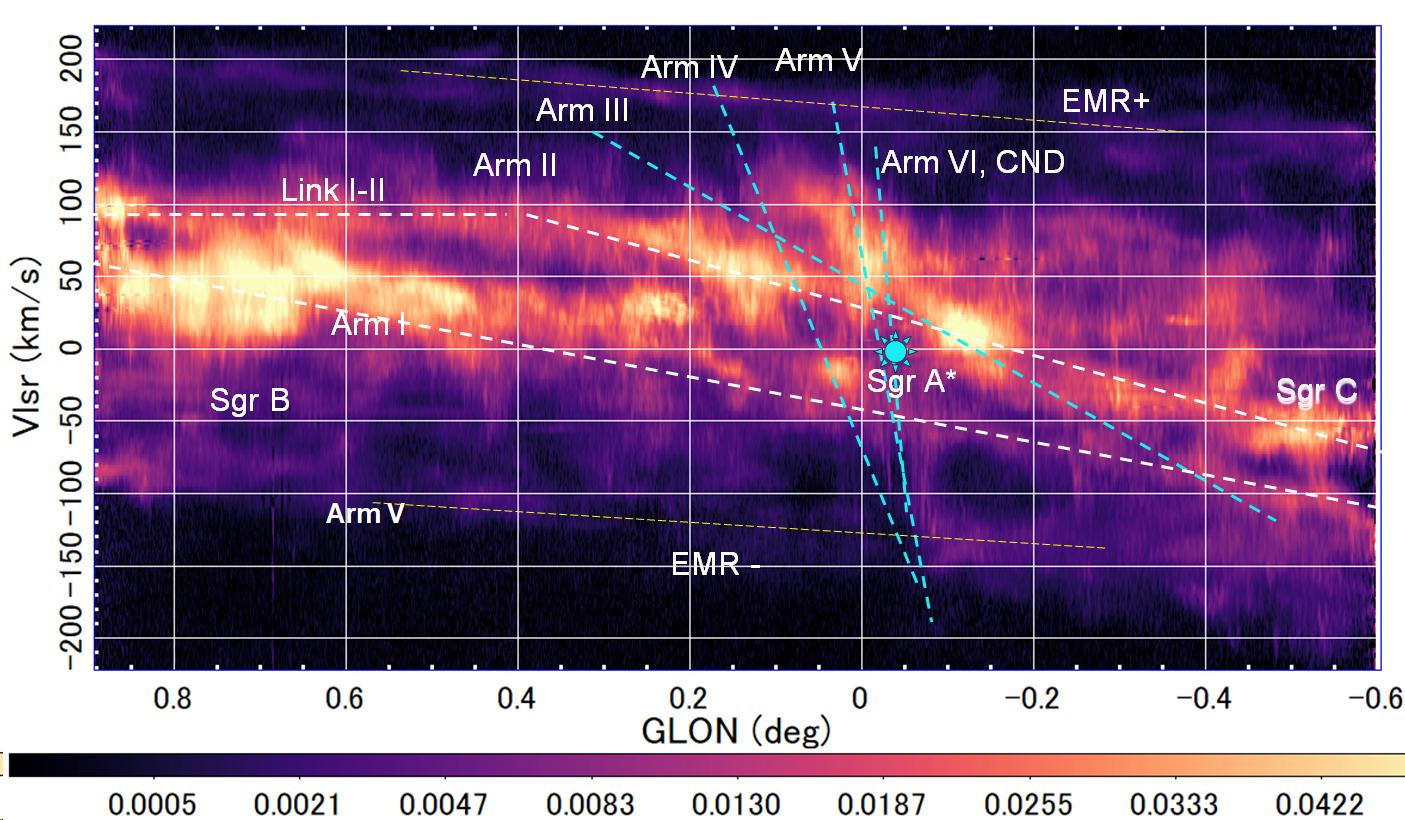
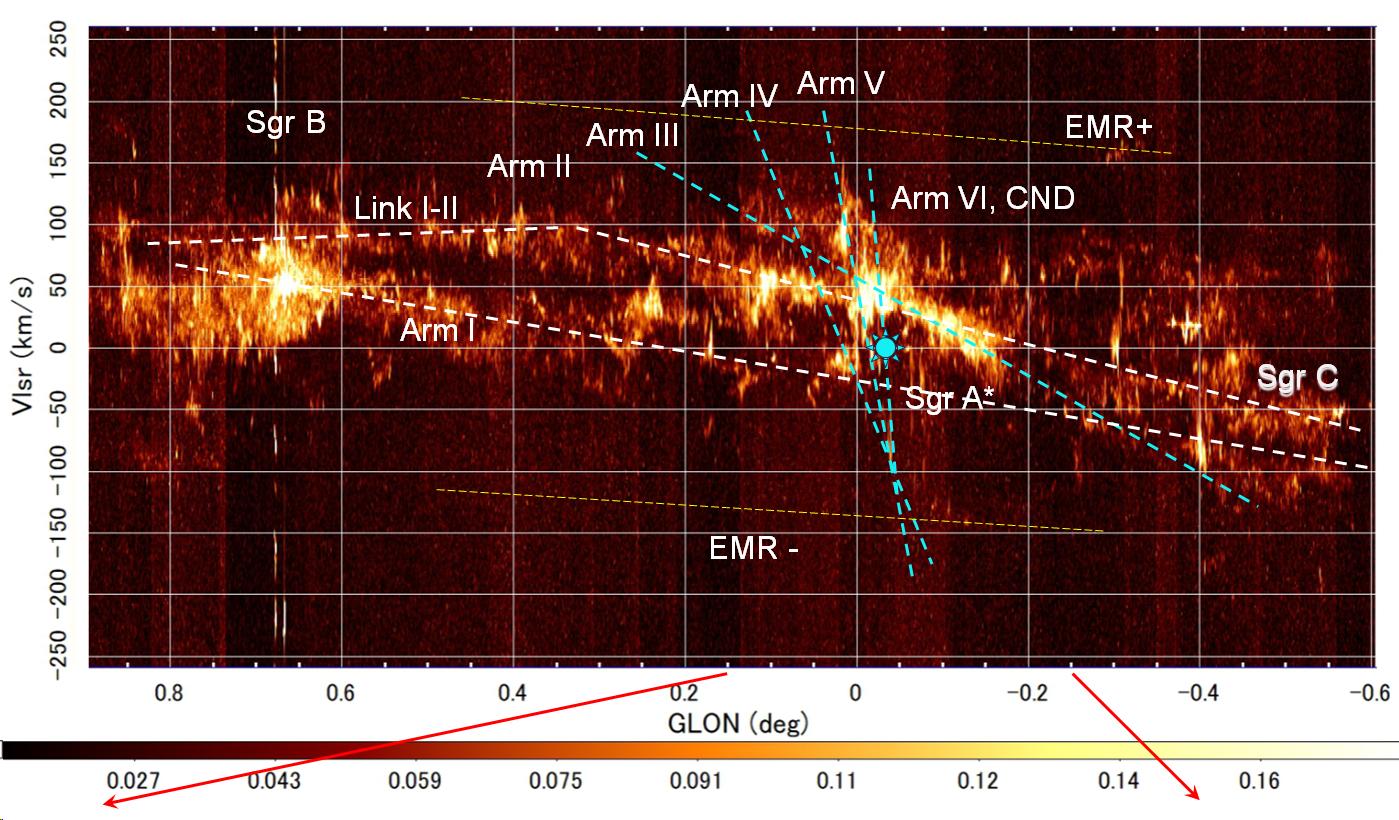
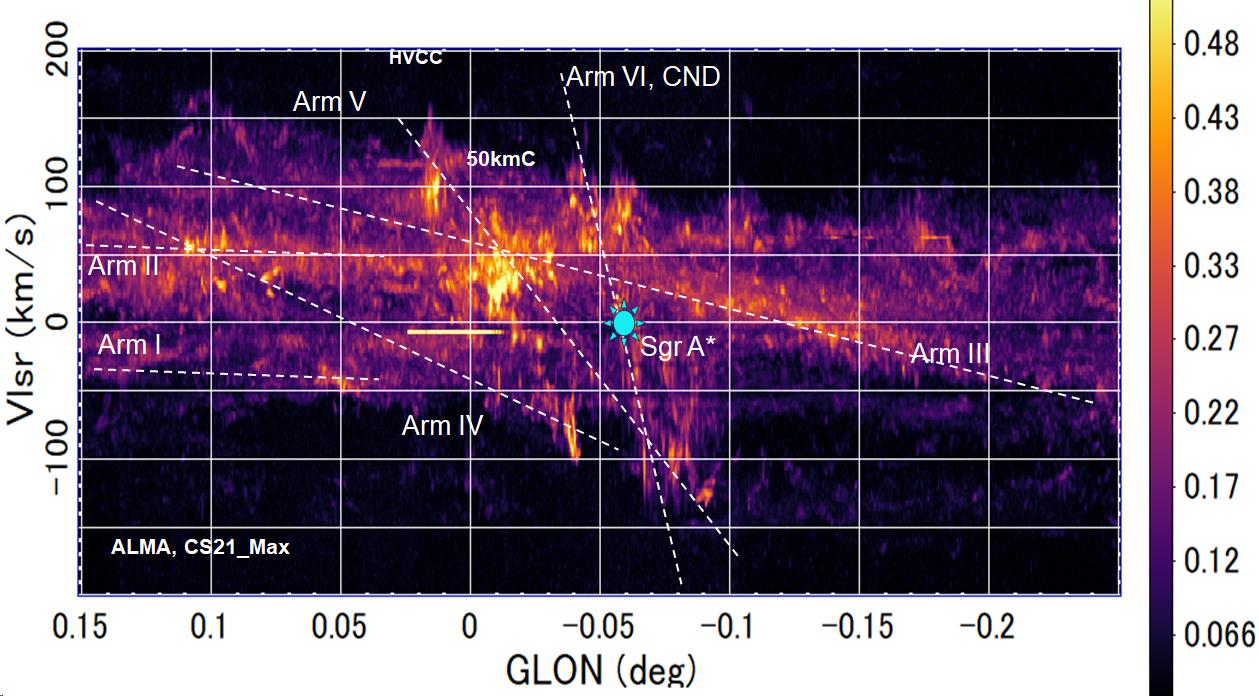
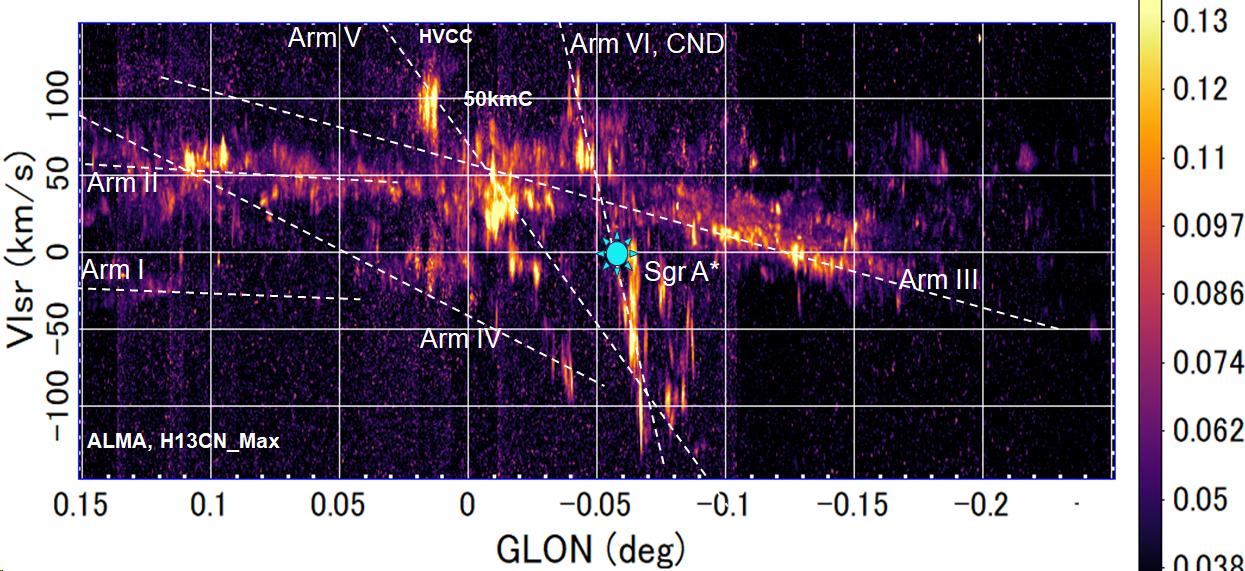
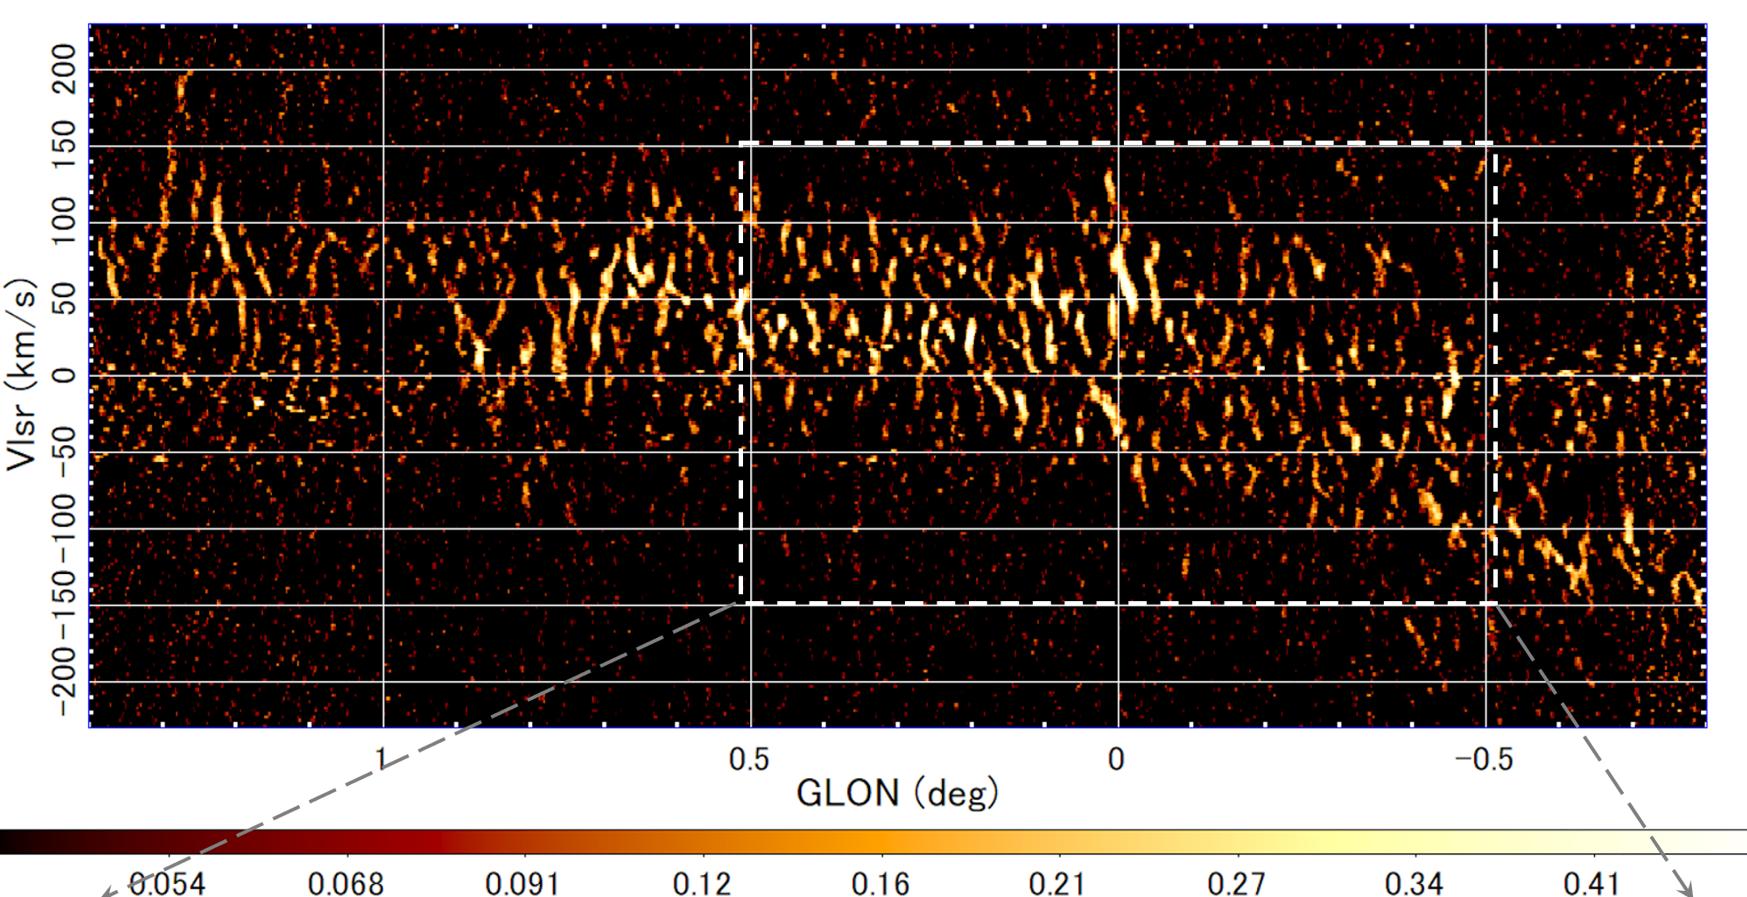
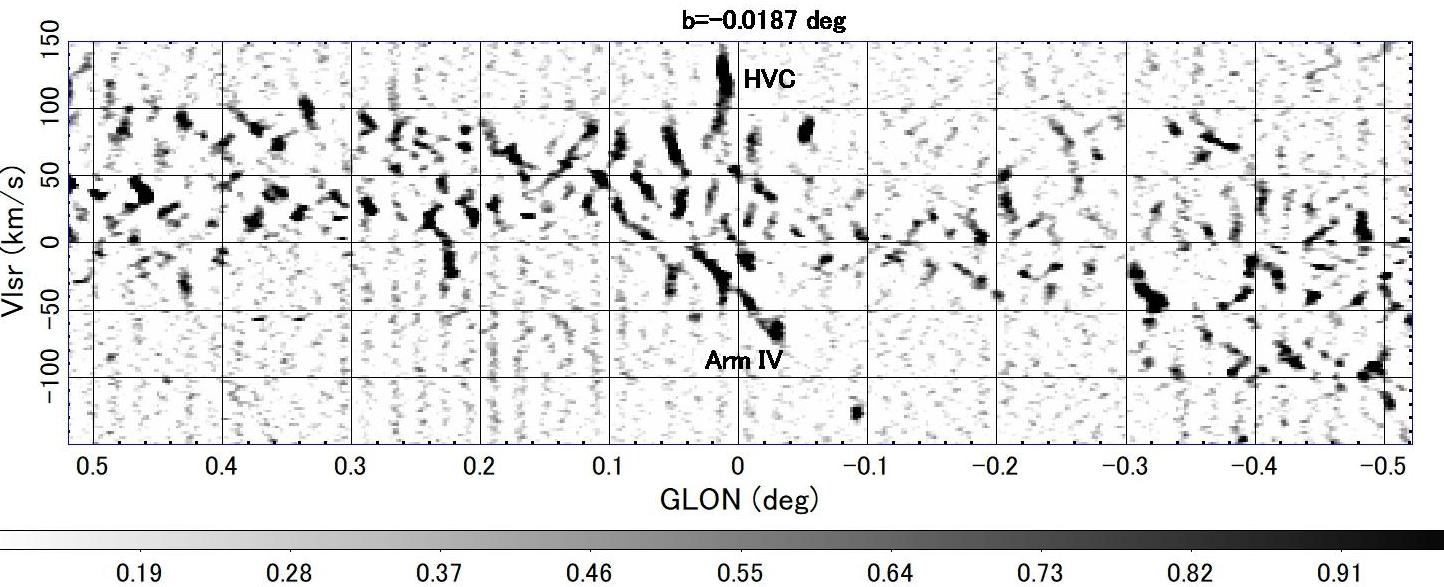
In figure 7 we summarize all arms identified by dashed lines superposed on the maximum intensity LVD of ALMA in the whole area mapped by ACES in CS ()from to . The middle and bottom panels show the same in CS () and H13CN , but for the central region from to , and to . These LVDs were made by creating maximum intensity projections along the latitude axis of the cubes using the spectral-cube Python package.
All Arms I to VI; LVDs ACES ( to )
CS () LVD (Type 2) Mean
CS () LVD (Type 4) Max in to
CS (), LVD (Type 4) Max
H13CN , LVD (Type 4) Max
2.5 Vertical profiles of the Arms
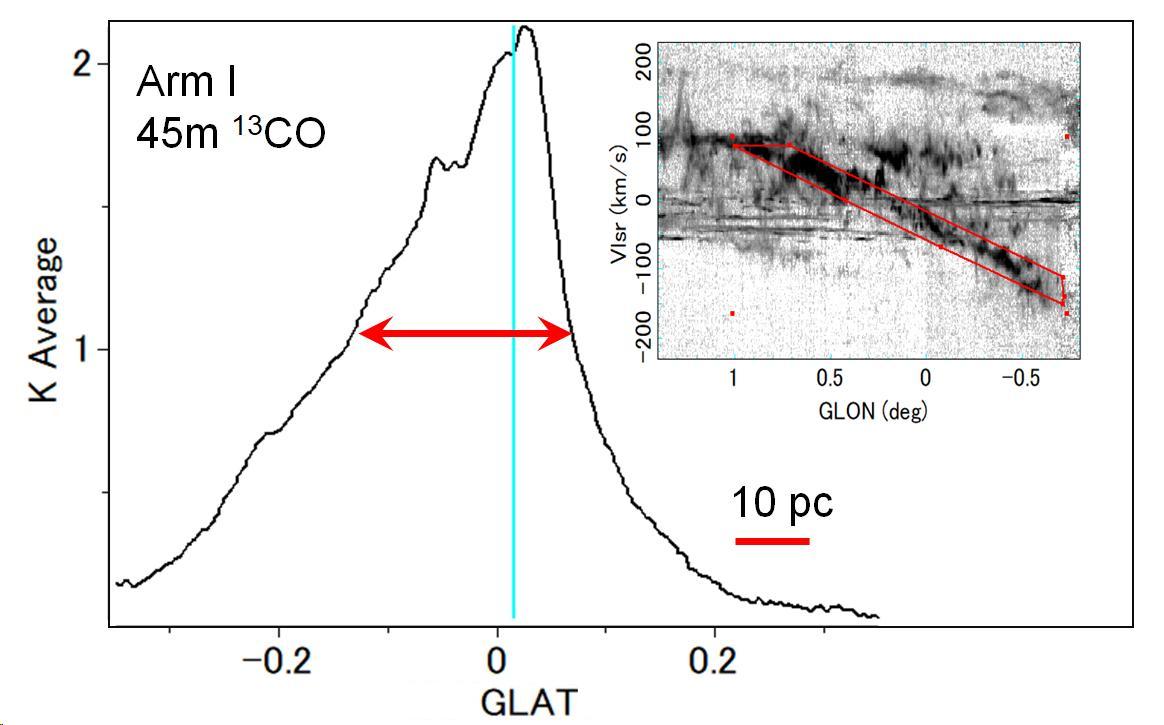
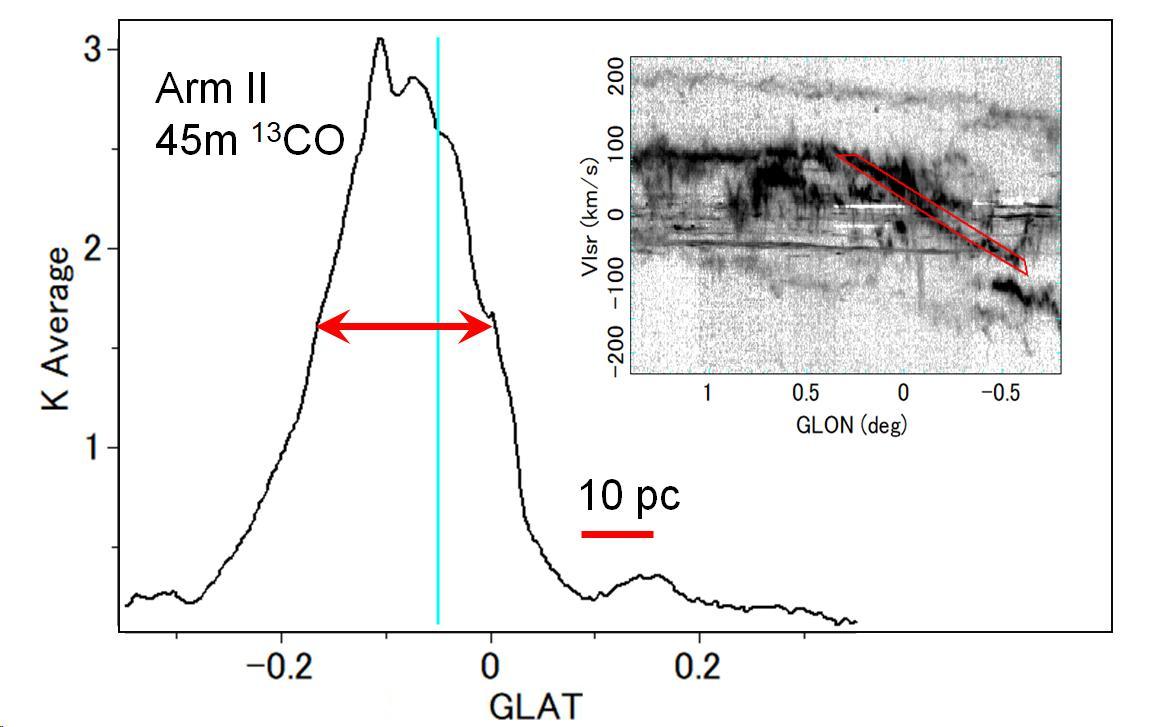
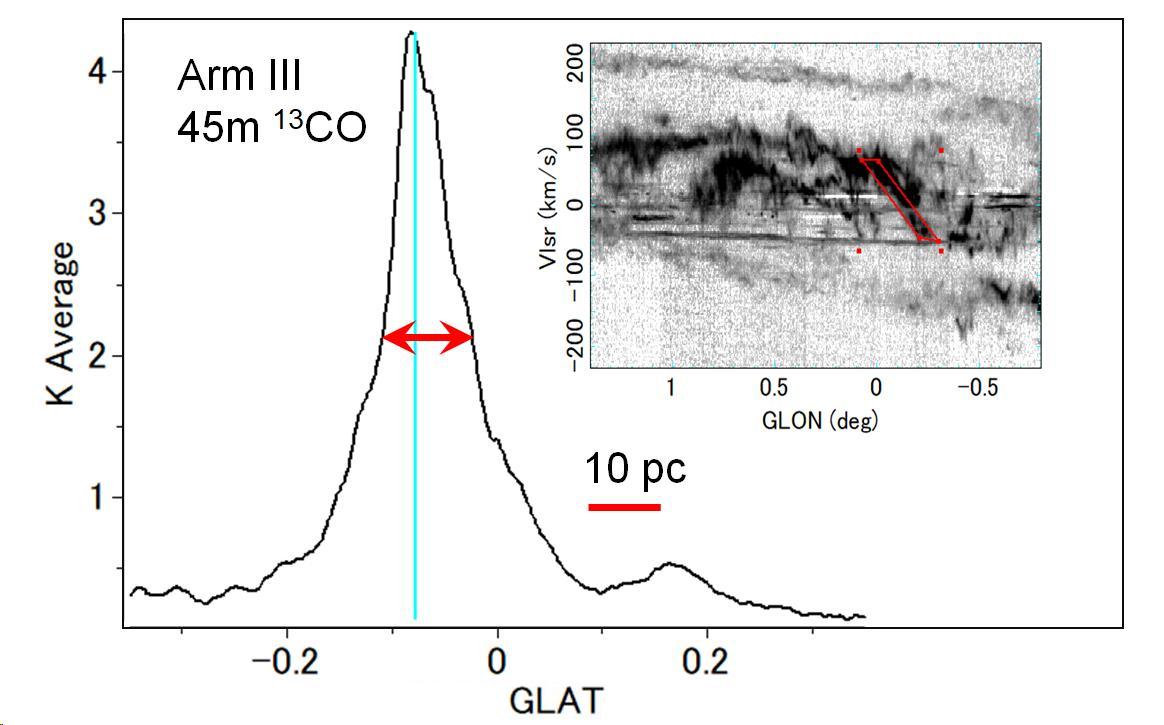
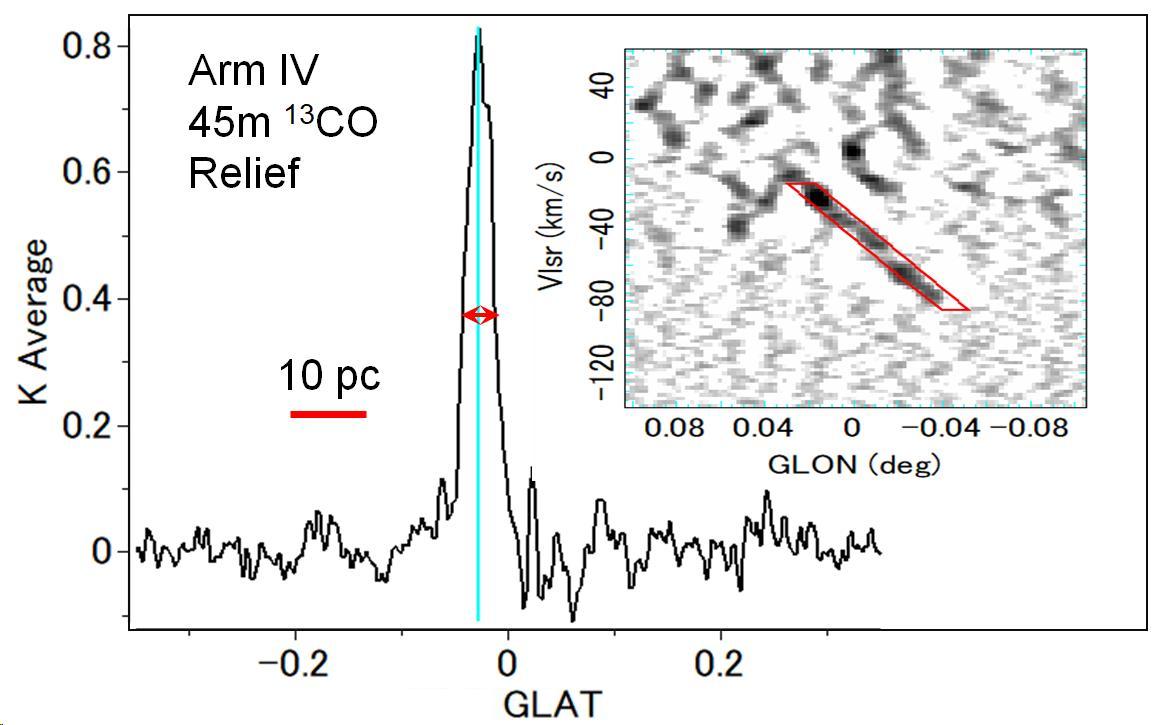
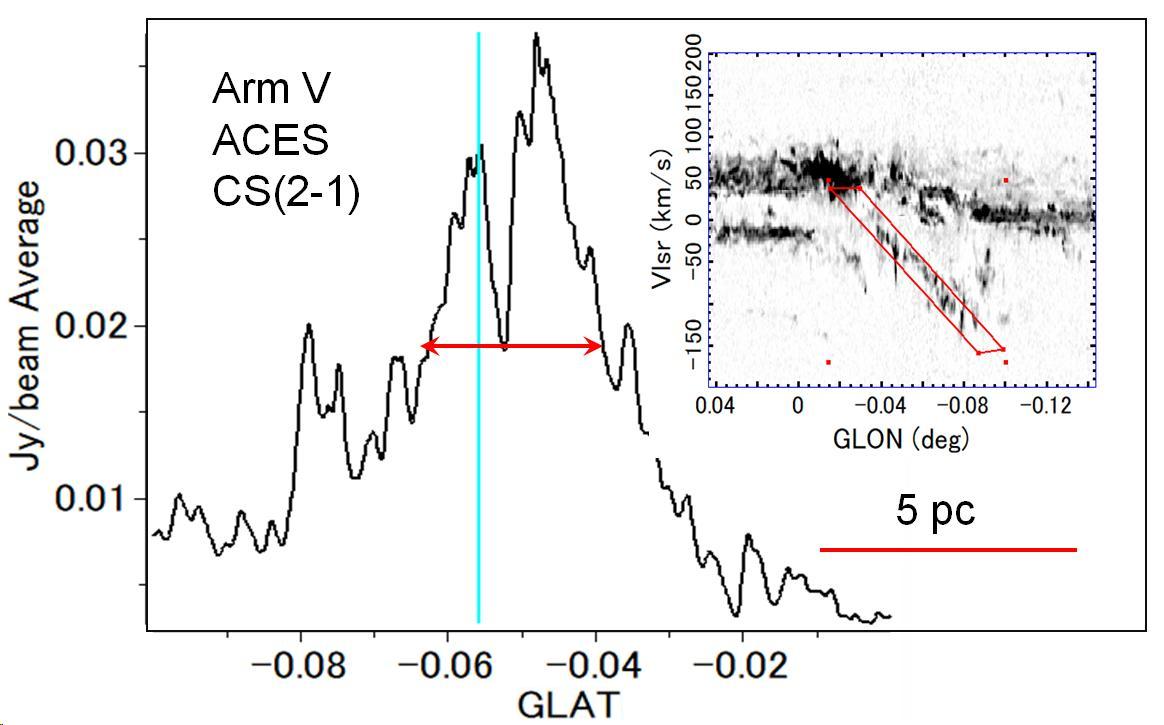
Figure 8 shows the latitudinal intensity profiles of the arms averaged along the LV ridges of the individual arms inside the red boxes, as shown in the LVD inserted in each panel. We then measure the full width at half maximum (FWHM) of the profile, as indicated by the red arrow, and define the width as the "full vertical extent " of the arm, where is the scale height of the disc. The bottom-right insertion explains the procedure for obtaining the latitudinal profile of an arm.
The full-width vertical extents of the arms are thus obtained to be pc for Arm I, pc for Arm II; to 5.7 pc for Arm III in 13CO and CS () respectively; pc for Arm IV; to 3.3 pc for Arm V in 13CO and CS (); and pc for Arm VI (CND). We find that the vertical extent of the arms decreases from Arm I to VI, which will be discussed in section 4.1. The derived quantities are listed in Table 1.

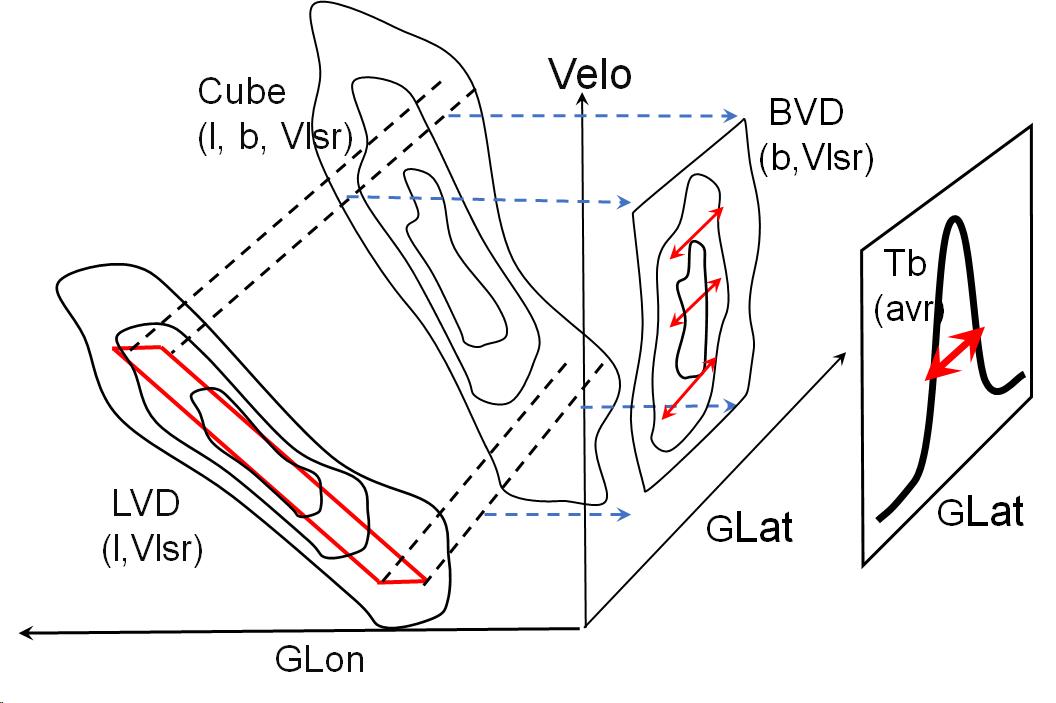
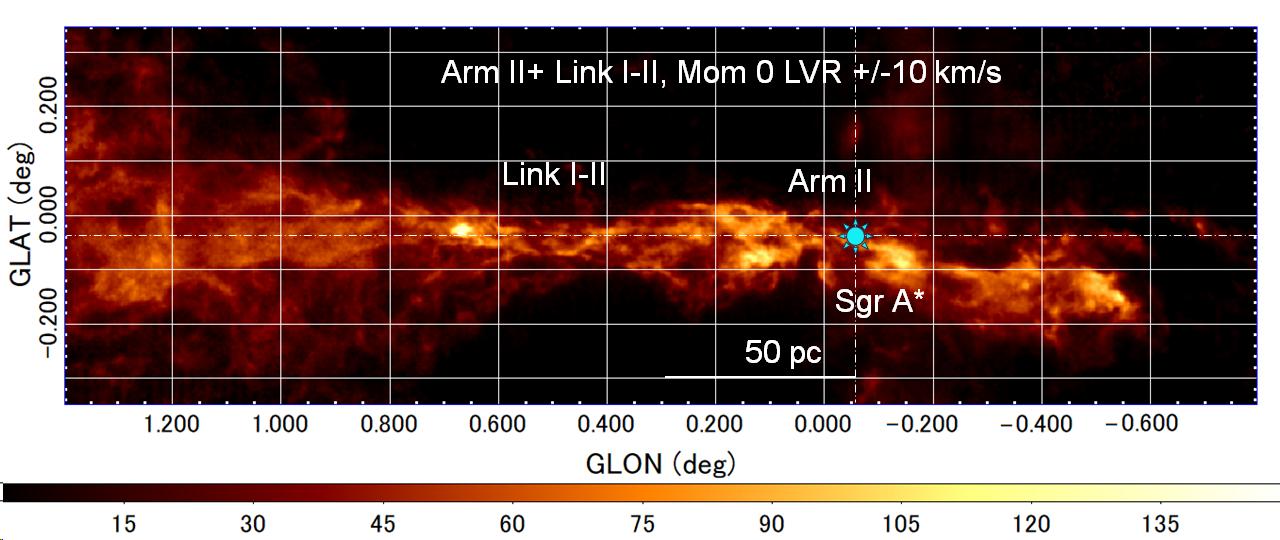
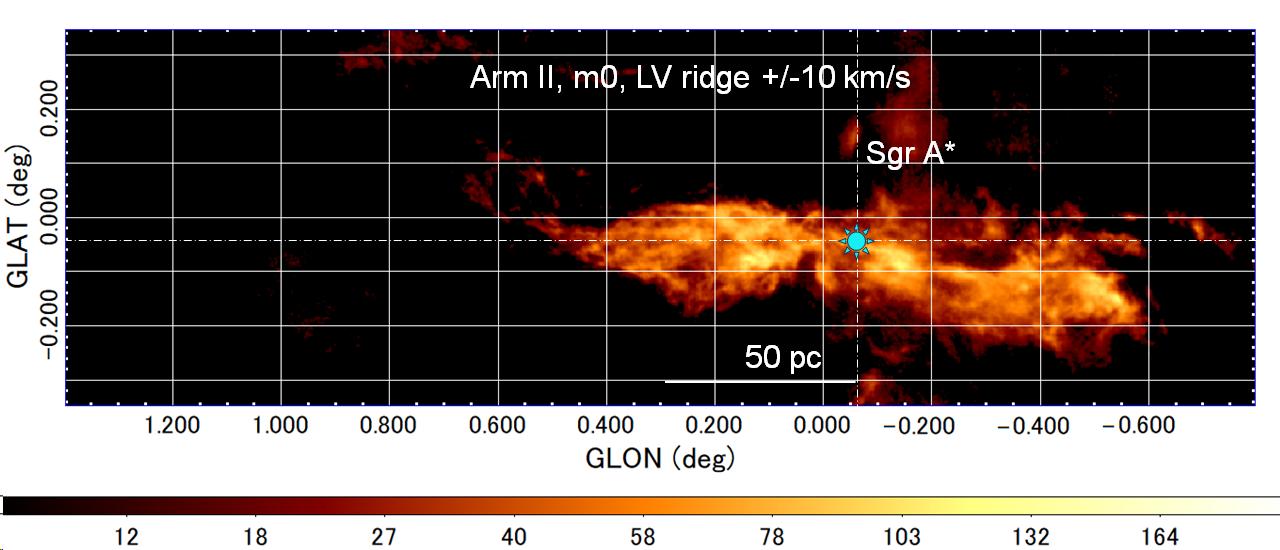
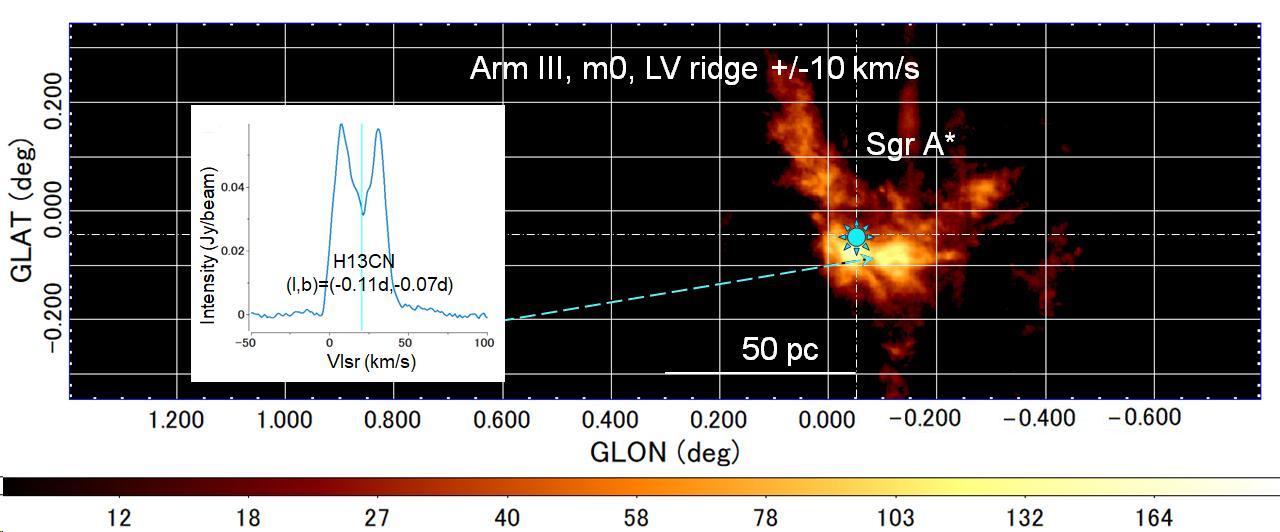
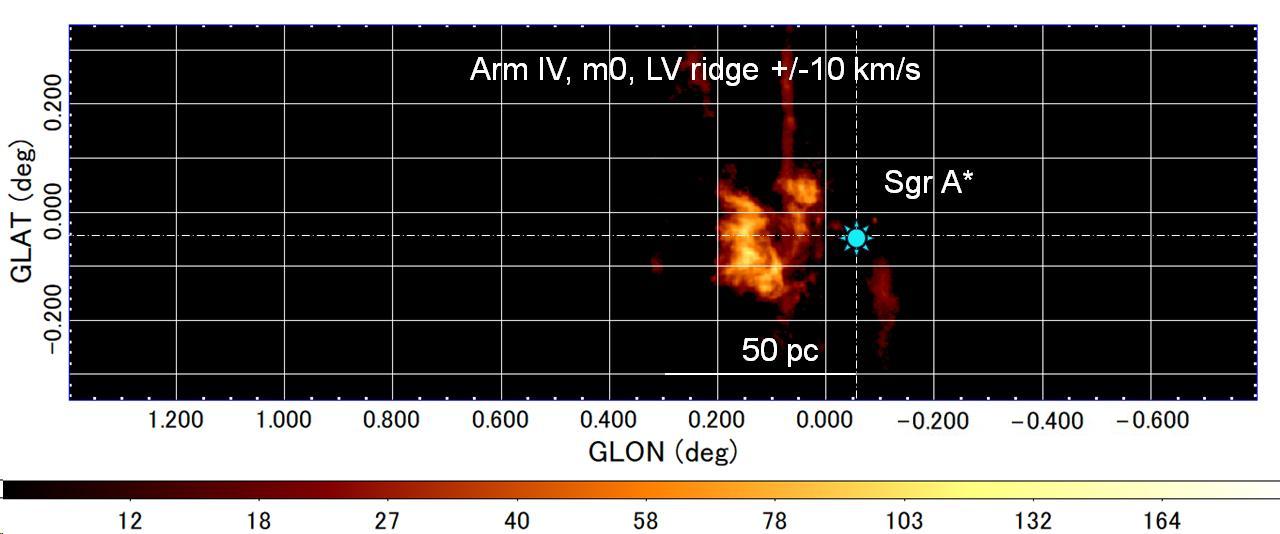
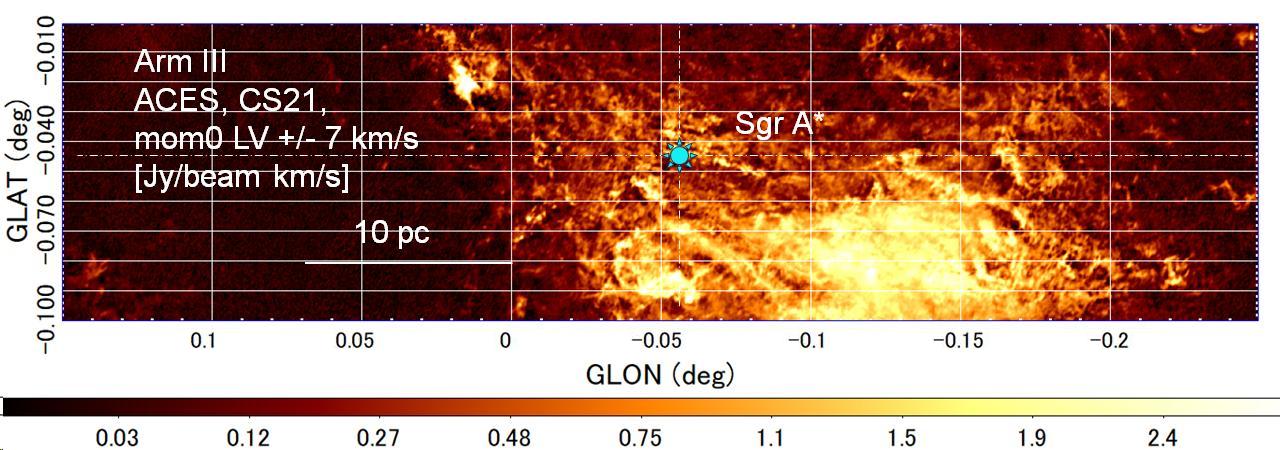
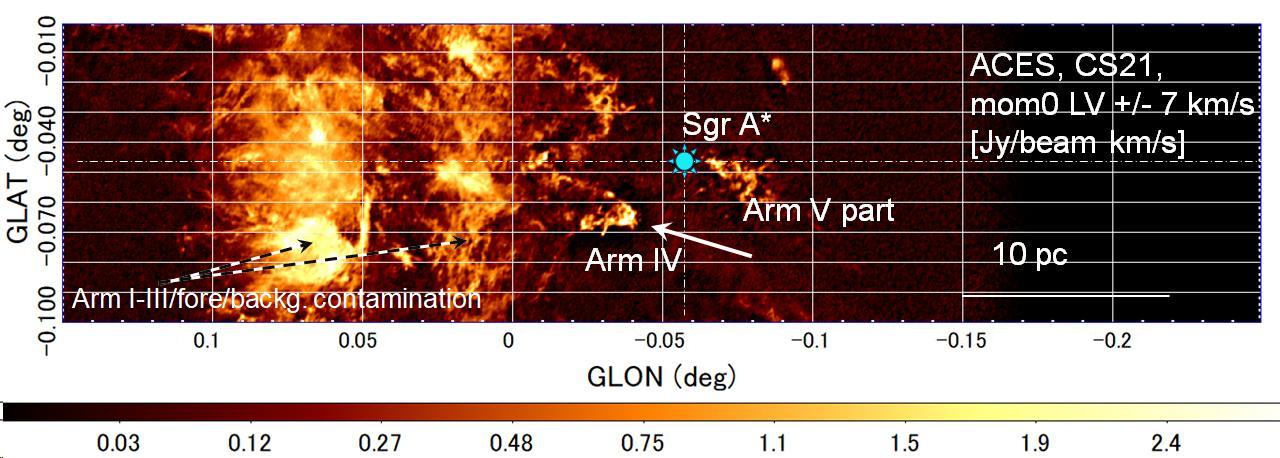
2.6 Arms on the sky (moment 0 maps along LV ridges): The LV-masking method
We then produce integrated intensity maps (moment 0) around the LV ridges of Arm I to VI (CND) indicated by the dashed lines in the LVDs in figures 3 to 7. We produce these maps by using a "masked cube" created by convolving the original cube with a cube of the same size (masking cube) representing a Gaussian function, or the "LV-masking function",
| (1) |
Here, represents of the LV ridge at longitude , and is expressed by a linear or a bent-linear (curved) function of to represent the dashed line of each arm in figures 3 to 7. So, in most cases
| (2) |
where and and are taken to be constants, and were measured along each of the dashed lines in figure 3 to 7. The velocity half width was estimated to be and 7.5 km s-1for 13CO and CS (), respectively, using LVDs around the clearest parts of Arms I to III (figures 3 to 3), and Arms IV and V (figures 4 and 5).
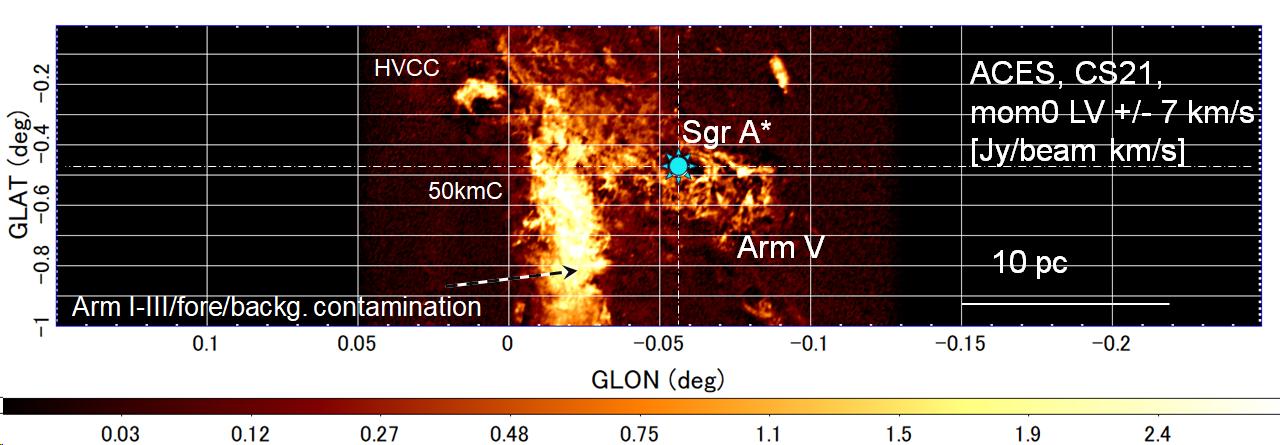
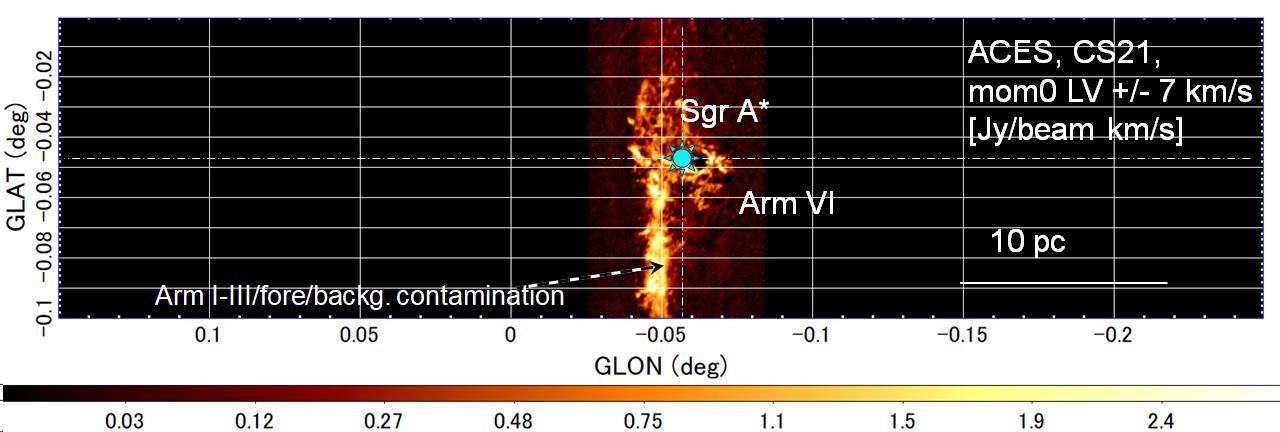
The moment 0 maps obtained along LVR from the 45 m telescope in 13CO and from ALMA in CS ()and H13CN are shown in figures 9 and 10, respectively. The vertical broad and bright bands in the maps of Arms IV to VI from ALMA are contaminations of the local disc and the "fore-/background CMZ" including a part of Arms I and II.
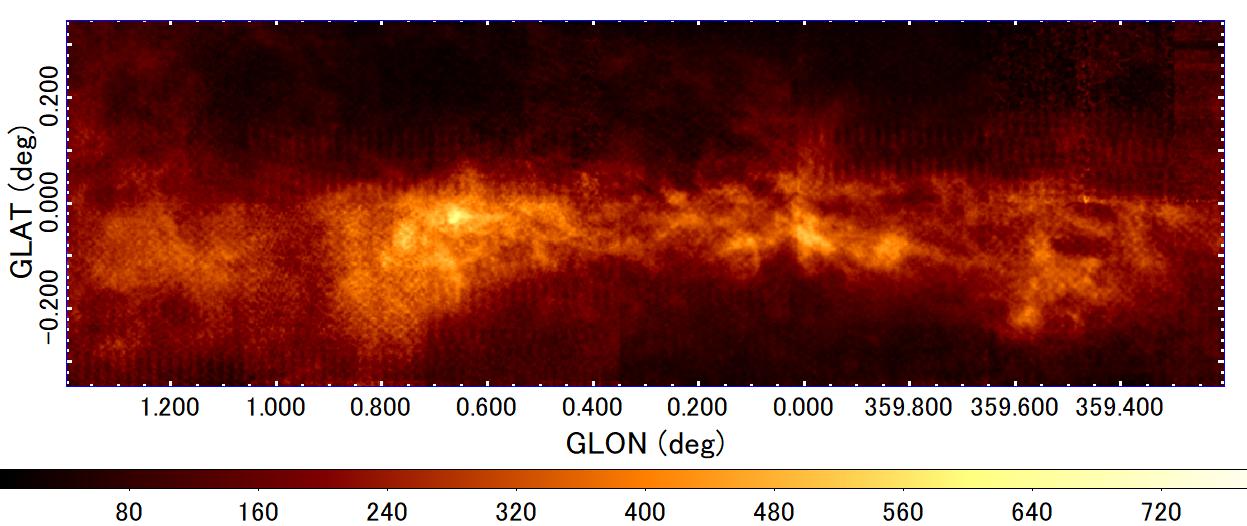
(T) Moment 0, total intensity integrated from to 230 km s-1, 13CO , 45m
LV-masked ( km s-1) moment 0 ; 13CO ; 45m
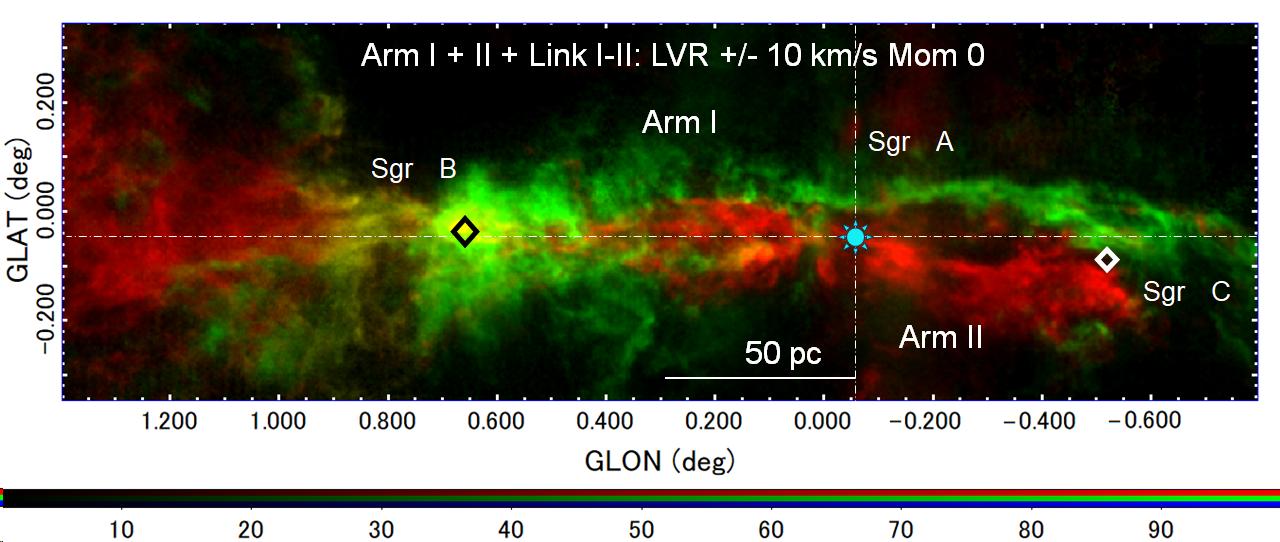
(A) Arm I+II+Link (B) Arm I
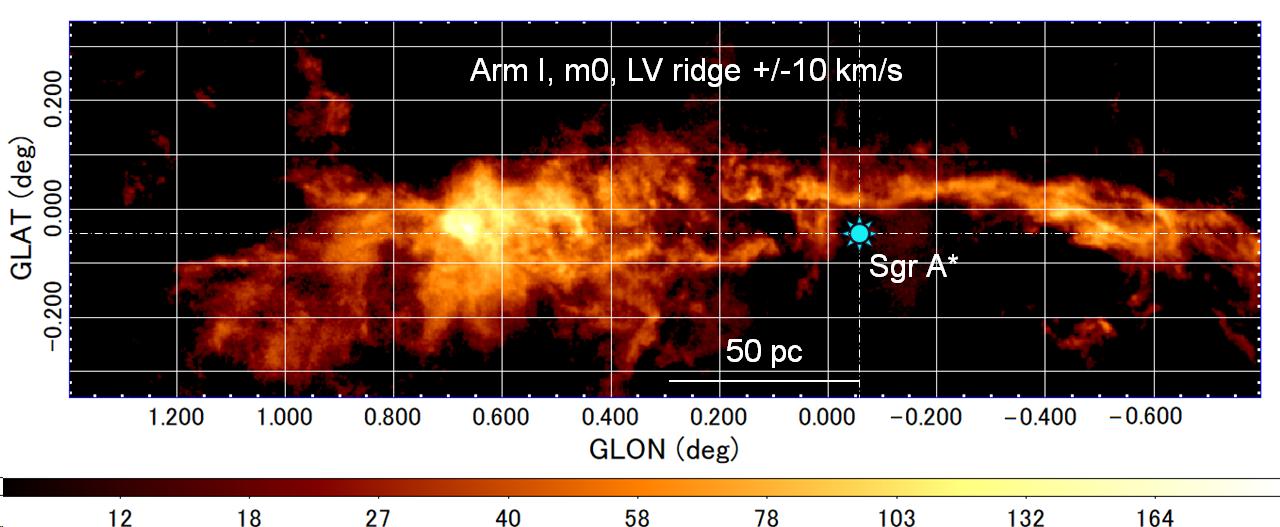
(C) Arm II+Link I-II (D) Arm II
(E) Arm III (F) Arm IV
(T) Moment 0, Total integ from -222 to 222 km s-1, CS (); ACES
Moment 0; LV-masking ( km s-1)
(A) Arm III
(B) Arm IV
(C) Arm V
(D) Arm VI = CND
3 Galactic-Center Arms
The so far identified Arms I to VI are summarized in the LVD of figure 7 by the dashed lines. In this section, we describe the individual arms based on the LVDs as well as the LV-masked moment 0 maps. We highlight the inner Arms III and IV, and report the exixtence of a new arm, which we name Arm V. We further identify an even inner arm, naming it Arm VI, which is an alternate view of the circumnuclear disk (CND) (Wright et al., 2001; Tsuboi et al., 2018). We also discuss the mini-spirals around Sgr A∗(Tsuboi et al., 2017), which we consider to be the innermost family of the arms, and thus the name Arm VII.
3.1 Arm I
Arm I, or the Sgr-B Arm, appears as the most prominent LV ridge of the CMZ, and is considered to be a spiral arm or a ring on the nearer side of Sgr A∗, the Milky Way’s nucleus. Moment 0 maps of this arm shown in panels (A) and (B) of figure 9 reveal a long and sharp arm tailing from the Sgr B cloud complex. Active star-forming regions Sgr B1 and B2 are located in this arm (Sofue, 1995, 2022; Oka et al., 1998; Tokuyama et al., 2019; Henshaw et al., 2016, 2023).
3.2 Arm II
Arm II, or the Sgr-C Arm, is the second-brightest arm associated with Sgr C, and is rotating on the far side of Sgr A. Arms I and II are linked by a horizontal LV belt (Link I-II), as indicated by the dashed line in figure 7.
Link I-II appears to be connected to the more outer disc at velocities at km s-1, which may suggest a gaseous arm connecting the CMZ and the Galactic disc. However, we do not discuss this feature in this paper, because it is far outside the ACES field.
In panel (C) of figure 9 we show a moment 0 map integrated along the bent LVR Arm II and Link I-II (figure 3). This map indicates that Arm II is tailing from Sgr C and extends nearly symmetrically to Arm I from Sgr B, and extends further to the west along the horizontal LVR Link I-II beyond the edge of Arm II. Panel (D) presents a part of Arm II in the moment 0 map traced by the tilted straight LVR alone.
The molecular gas mass of the CMZ is shared mostly by these two main Arms I and II as discussed below in section (4.5). The two arms have been proposed to compose the main 120-pc ring (Sofue, 1995) of the CMZ, and have been extensively studied in order to derive the 3D structure of the CMZ (Molinari et al., 2011; Kruijssen et al., 2015; Henshaw et al., 2016; Tokuyama et al., 2019; Sofue, 2022). It is further suggested that the Arms are related to the outer star formation region Sgr E () and the supernova remnants Sgr D (), drawing a double infinity () in the sky (Sofue, 2022). However, the degenerate Arms I and II are resolved in the LV space, and the masked moment 0 map (figure 9) shows a simple tilted ring.
3.3 Arm III
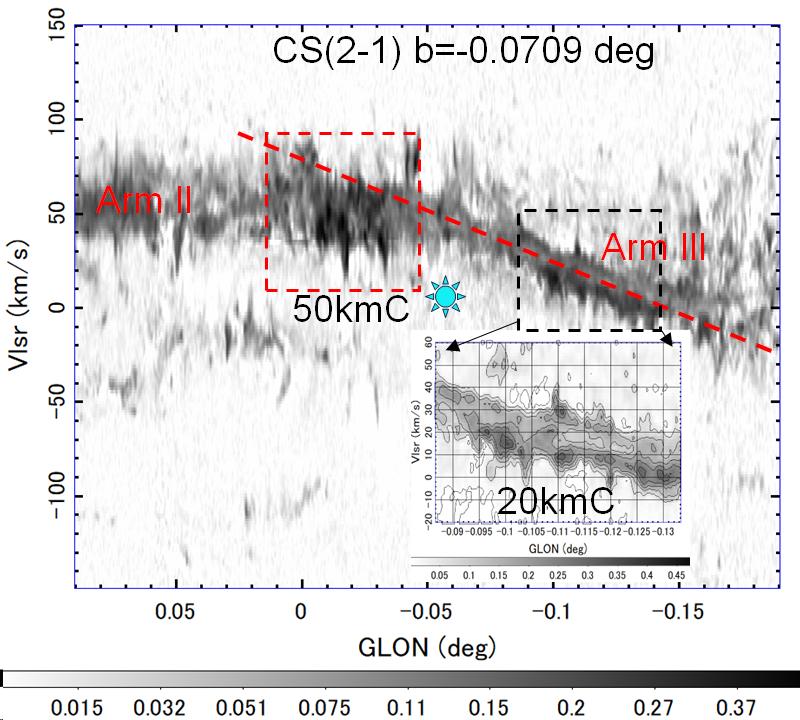
Arm III has not been studied in detail so far in spite of its high brightness. It is visible in 13CO in the LVD in figure 3 and in the moment 0 maps in figures 9 and 10. The LV ridge of this arm is composed of two parallel stripes in H13CN and HCN () lines. The line spectrum shows a clear center velocity absorption along this arm as shown by an insertion in panel E of figure 9. The absorption belt along Arm III will be discussed in some detail later in subsection 5.3.
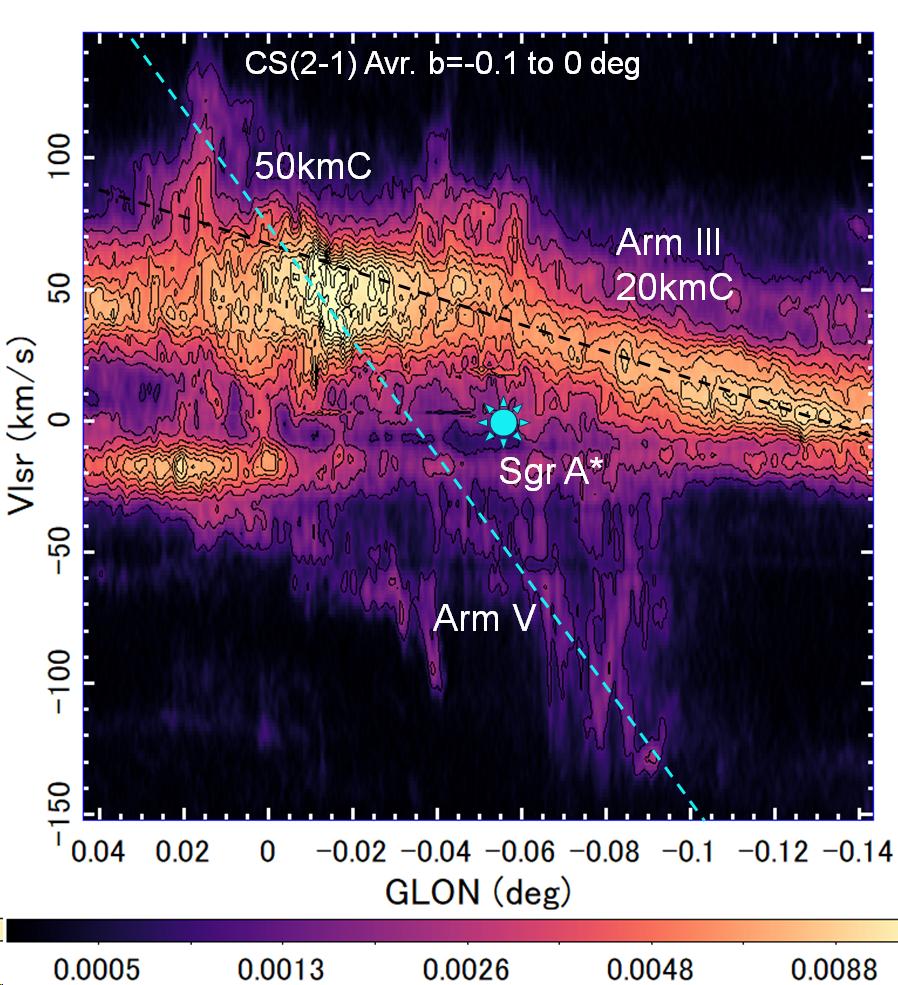
This arm seems to consist of the GMC M-0.13-0.08 (20kmC) (see Takekawa et al. (2017a)). The moment 0 map in figure 3 shows a rather short arm in the sky, being led by a bright clump of 20kmC. If 20kmC is physically associated with Arm III, its 3D position can be determined kinematically, as will be done in Section 4.1. Thereby, we assume that Arm III is in front of Sgr A∗, following the face-on geometry proposed by Takekawa et al. (2017a).
However, it has also been suggested that there is a physical contact between the +20-km s-1 cloud and the CND (Takekawa et al., 2017a). If this is the case, a different view is required, and Arm III may be redefined as a long bright ridge only in negative , extending to . Another concern is its possible relationship with the 50kmC: as shown in the relieved LVD in figure 3, the 50kmC is located in the increasing-longitude extension of Arm III. In this paper, we examine another possibility that 50kmC is related to Arm V not only for the position LV, but also for the large value close to that of Arm V and the large velocity width (section 5.3.
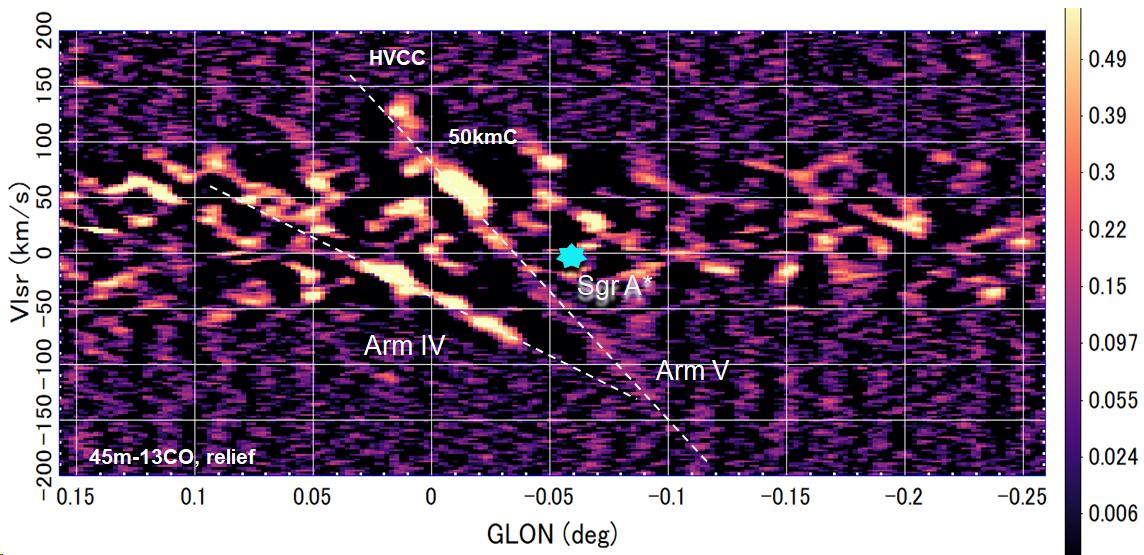
3.4 Arm IV
Arm IV is the arm most clearly visible in the relieved 13CO LVD at negative as shown in the lower panel of figure 4. Its positive- extension is visible in the original LVD as indicated in the middle panel of this figure, but is strongly disturbed by the contamination from Arms I and II as well as the extended CMZ emission.
This arm can be clearly traced on the LVD in figure 4, and is also visible in the moment 0 map in CS () from ACES. The arm runs westward from and ends at .
A part of this arm has been identified as the "C1" clump at , which shows intense CS emission (Oka et al., 2011).
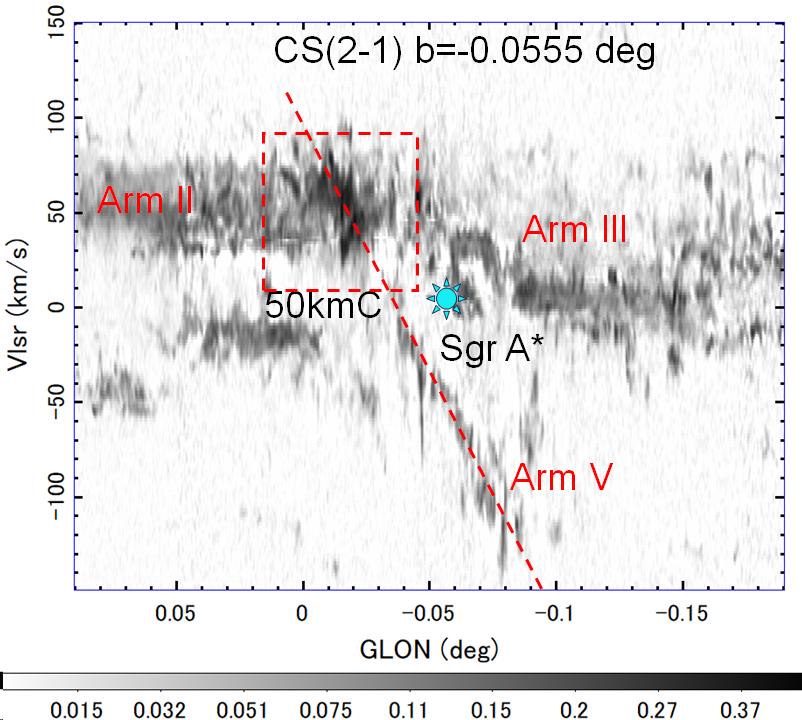
3.5 Arm V
Arm V is a straight and long LV ridge composed of a low-brightness stripe that extends from to , as shown in Figure 5. In the moment 0 map in CS () (figures 10 (C)), Arm V runs at position angle , and is approximately fitted by an ellipse of axial ratio , or inclination angle of (tilt angle ). The 50kmC is located on the positive-velocity extension of Arm V in the LVD, and the velocity gradient is about equal to that of Arm V (see Section 5.3).
Arm VI (CND); Mom. 0; LV-masking km s-1;
CS (); ACES

H13CN ; ACES
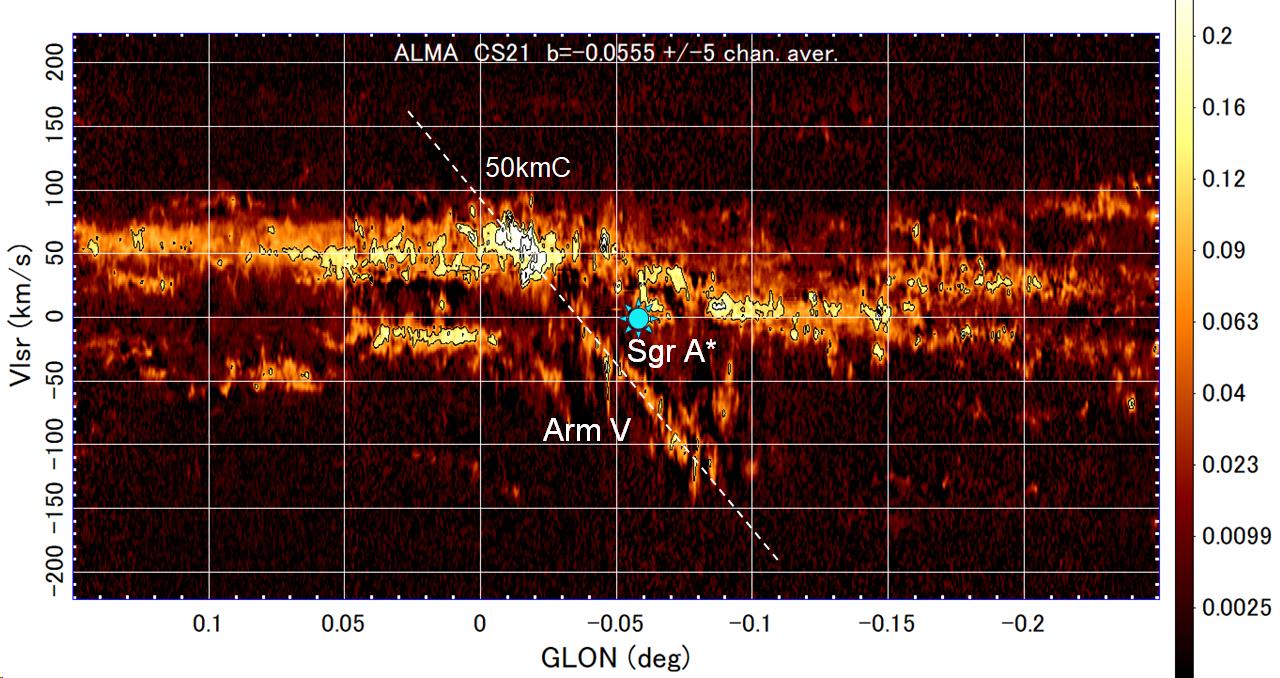
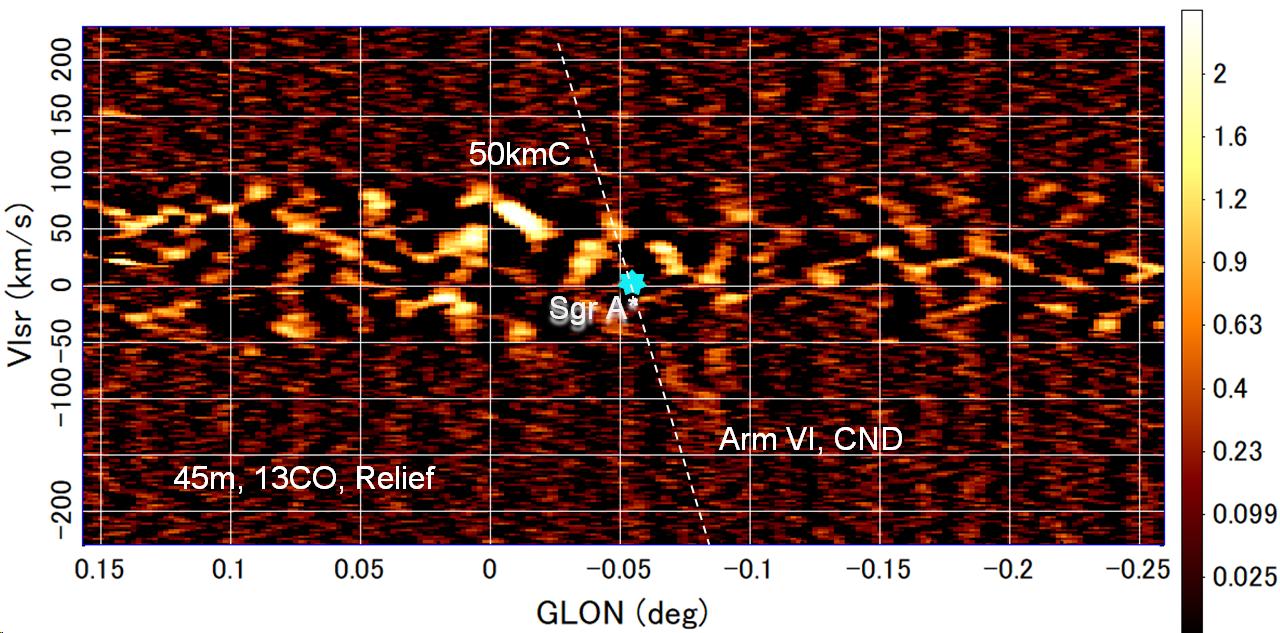
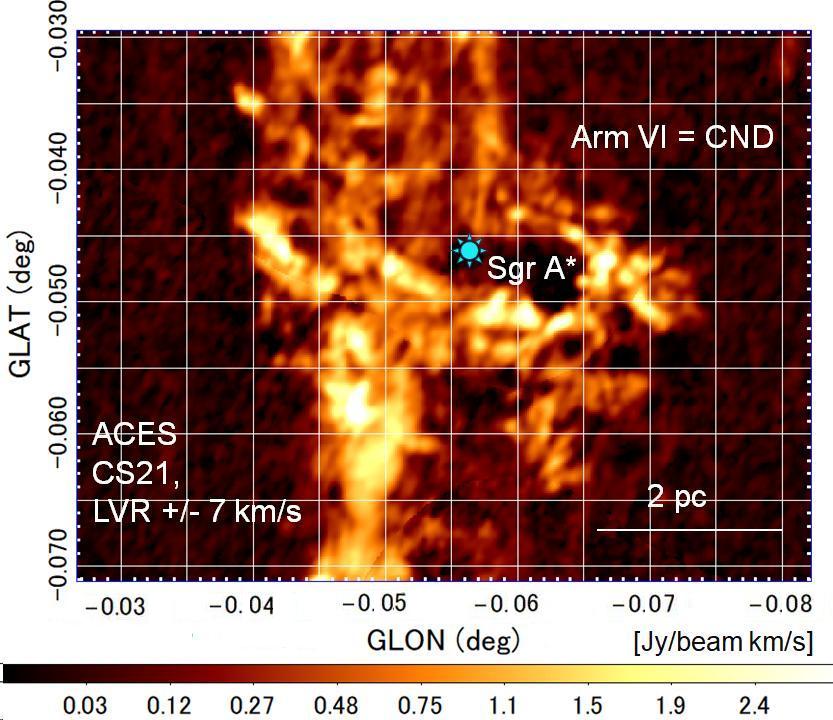
3.6 Arm VI – CND –
The CND (Wright et al., 2001; Montero-Castaño et al., 2009; Mart´ın et al., 2012; Feldmeier et al., 2014; Mills et al., 2017; Tsuboi et al., 2018; Hsieh et al., 2021) is recognized in the CS () and H13CN -lines in the LVDs in figure 6 as a bright highly tilted ridge extending from to indicating a rotating ring. We call this ring Arm VI, which is equivalent to CND.
We stress that the arm is barely visible on the 13CO line, becoming clearer on the LVDs of CS (), H13CN , and HCN (). This demonstrates that the molecular gas in the CND (Arm VI) is much denser and warmer compared to the general CMZ clouds such as in Arms I and II. The LV ridge exhibits a double-peaked rotating ring structure whose central part is missing. A curved spur is extending from the negative-velocity end of Arm VI, indicating that the arm is associated with a high-velocity noncircular flow.
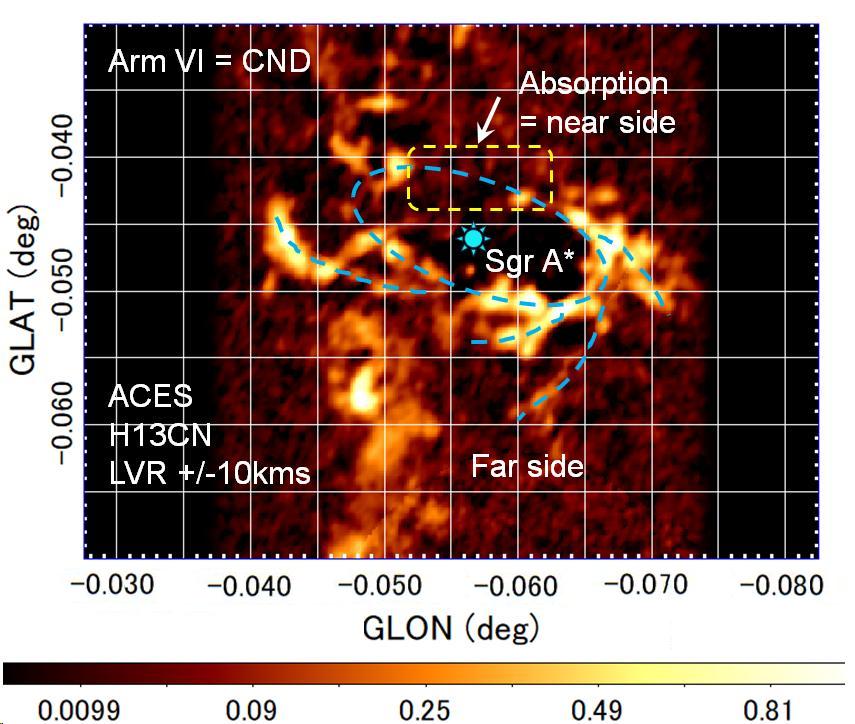
Figure 11 shows moment 0 maps of Arm VI in CS () and H13CN as integrated within and km s-1from the LV ridge (LVR), respectively, which agree well with the map of CS using ALMA by Tsuboi et al. (2018). The figure exhibits an elongated ellipse centered on Sgr A∗ as marked by the dashed line in the bottom panel of figure 11, which has an axial ratio of at position angle of the major axis of PA. If it is a circular ring, the inclination angle is (tilt angle ). Several spiral arms and fins are bifurcating from the ring, trailing in the sense of counter-clockwise rotation in the figure (on the sky).
The positive latitude side of the ring (northern wing) is missing (figure 11, bottom panel), although it is visible in the warm H2 (2.4-m) emission (Feldmeier et al., 2014; Mills et al., 2017). The difference in the characteristic of the emissions in millimeters and m may be attributed to the absorption of the continuum emission of Sgr A by the CS and H13CN molecules. In contrast, the negative-latitude side (southern wing) draws a nearly perfect ellipse, indicating that there is no absorption. This suggests that the northern wing of the ring is in front of Sgr A and the southern half is beyond it. This is consistent with the counterclockwise rotation of the disc seen from below the Galactic plane. There is a hole in the center of the ring coinciding with Sgr A∗, which is due to the absence of molecular gas around the minispirals at high temperature and due to absorption of Sgr A’s continuum emission.
3.7 Arm VII – Minispirals –
The minispirals are composed of ionized gas (Tsuboi et al., 2017) and are not detected in the present data. They rotate around Sgr A∗ in elliptical orbits of radius pc and inclination () (Zhao et al., 2009), and therefore have a vertical extent pc. Interestingly, they are on a natural extension of the radius-vertical extent and radius-inclination relationships among the arms as discussed in Section 4.2. Although they are outside our direct analysis based on molecular line observations, we here suggest that the minispirals be interpreted as the innermost family of the arms of the CMZ and call them Arm VII.
3.8 Fine LV stripes
Besides the large-scale, grand-designed arm structures that trace the tilted LV ridges spanning km s-1like Arms I to VI, there are numerous fine stripes composed of shorter (–30 km s-1) vertical LV ridges ( –30 km s-1) seen in the relieved LVDs from the 45 m telescope (Appendix A, figure 18) and those in the ACES LVDs at higher resolution with km s-1(figure 7). They are mostly individual molecular clouds not resolved in the longitude direction, indicating that the CMZ contains numerous clouds with sizes smaller than the beam width, pc, and velocity dispersions of –30 km s-1).
We point out that some of such LV ridges (individual clouds) are inclined in the same sense as that caused by the Galactic rotation, but generally with tilt angles steeper than those of the main Arms I and II. This suggests that some of the LV ridges, except for the innermost LV ridges discussed in the next section, represent individual clouds locally rotating more rapidly than the disc’s rotation due to self-contraction with the cloud’s angular momentum being conserved.
4 Arm radius and vertical extent
4.1 Radii of GC Arms using method
Here we introduce three observable quantities to describe the identified arms on the LVD: (1) Velocity gradient (slope) of the LV ridge, (2) velocity intersection of the ridge at the longitude of Sgr A∗ at , and (3) peri-/apocentric longitude offset from Sgr A∗, at which the motion of gas becomes perpendicular to the line of sight so that km s-1. Table 1 lists the values of and measured by fitting by the eyes to the corresponding LV ridges in the LV plane.
If we assume that an extended object is rotating around a certain center in an edge-on disc, the curvature of the flow line, , is related to the velocity gradient by
| (3) |
where km s-1 is the rotation velocity. If we assume that the flow is circular around Sgr A∗, the radius is equal to the galactocentric distance .
The error in the curvature propagates from that in the measurement of , which is about . Therefore, the error in the curvatures / radii of the arms determined in this paper is a factor of mostly attributed to the accuracy of the assumed rotation velocity.
Note that this method measures the local curvature of the streamlines for a given flow velocity. Even if the flow is not circular, e.g., elliptical, hyperbolic, etc., it gives the local streamline curvature. It works even if the flow is overlapped by radial expansion or contraction, because near the rotation axis with and being the expanding/contracting velocity of the disc (arm) and Galacto-centric longitude, respectively. This method measures the curvature of the streamline, but not the curvature of the density distribution, such as a filament or arm that may be inclined at an angle to the streamline in the case of galactic shock waves.
In the case of Arm IV, for example, we measure the velocity gradient to be 200 km s-1per in LVDs, resulting in pc, assuming and . The rotation period is then Myr.
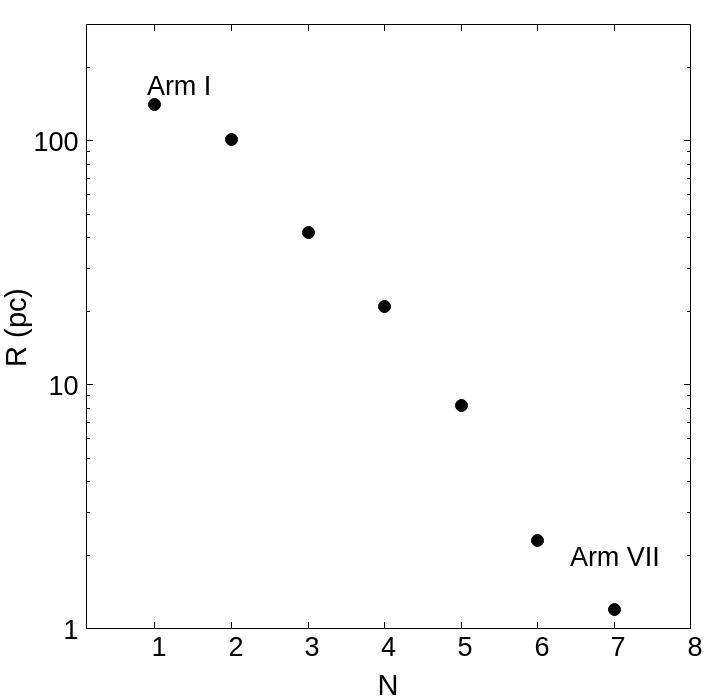
Table 1 lists the estimated values of and for the identified arms obtained for kpc and km s-1. In the top panel of figure 12 we show the "arm-radius relation", or a plot of radii against arm number I to VII, where Arm VII represents the minispirals as discussed in the later section. The plot is approximately fitted by
| (4) |
(I, II, …, VII) within an error of factor , where pc. This shows that the existence of the arms is discrete, and that the ratio between the radii of two neighboring arms/rings is , suggesting a Bode’s law-like arm structure. Alternatively, it may be attributed to a logarithmic spiral with pitch angle of .
| Arm | Arm volume ratio ♮♮ | |||||||
| (km s-1deg-1) | (deg) | (km s-1)# | (pc) | (Myr) | (pc) | (deg) | VolN/Vol | |
| Arm I | 150. | 141. | 5.9 | 26 | 4 | For I+II = 120-pc ring | ||
| Arm II | 212. | 101. | 4.2 | 20 | =1.0 | |||
| Arm III | 507. | 42. | 1.7 | 4.7 | ||||
| Arm IV | 1020. | 21. | 0.86 | 3.6 | ||||
| Arm V | 2600. | 8.2 | 0.34 | 3.1 | 21 | |||
| Arm VI (CND) | 9300. | 0 | 0 | 2.3† | 0.1 | 1.4 | 29 | |
| Arm VII (Minispirals)‡ | – | – |
♮ Inclination angle is assumed to be (tilt ange ), except for Arm VII.
†† for km s-1and kpc.
# is at (Sgr A∗).
The reference center is taken at
Sgr A∗ with .
† Consistent with the current measurement pc (Tsuboi et al., 2018).
‡ Approximate values read on the maps in the literature (Zhao et al., 2009; Tsuboi et al., 2017).
♮♮ The ratio of the volume shared by Arm to that of the 120-pc ring composed of Arms I and II as calculated by Vol.
4.2 Face-on view of GC Arms
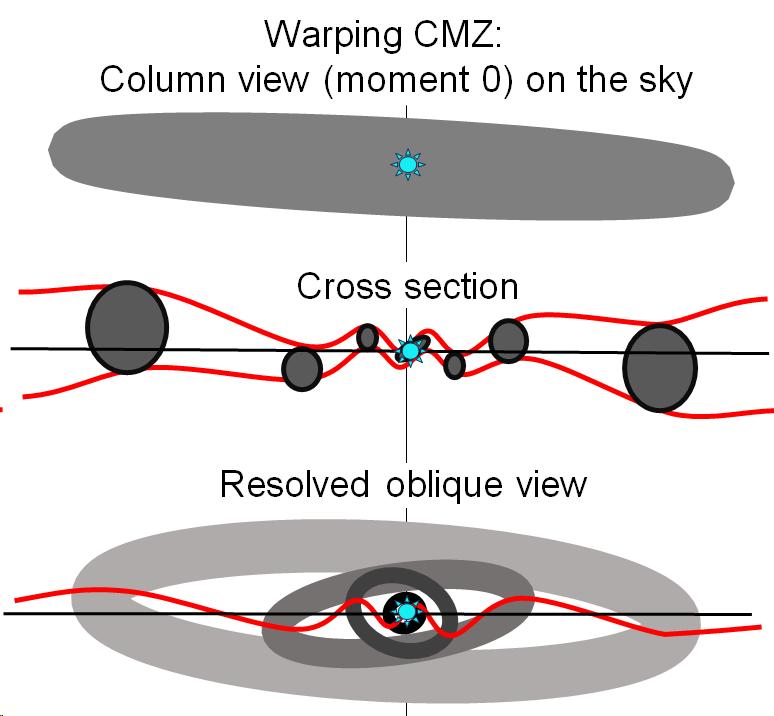
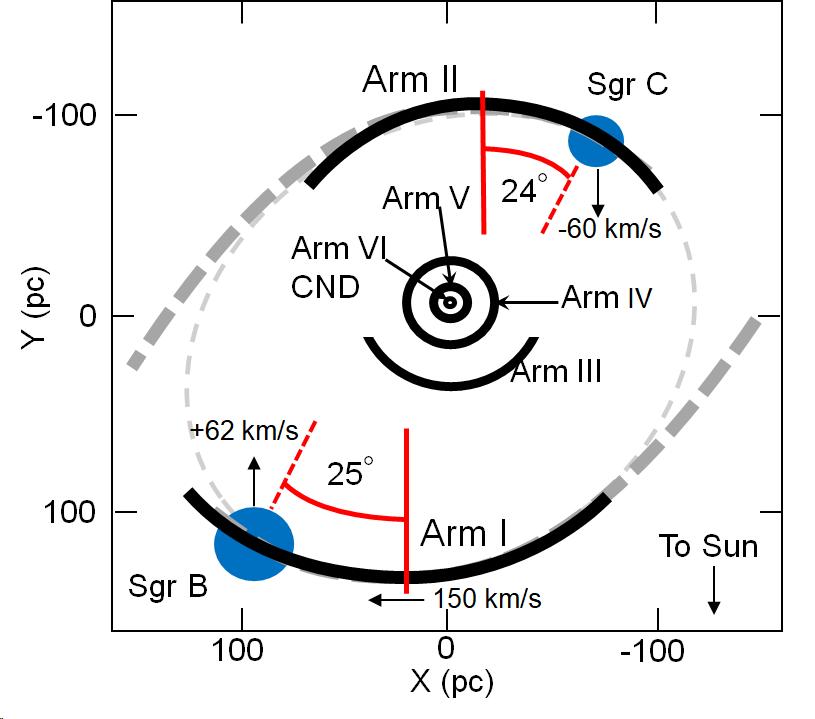
Using the estimated radii of the arms, their orientations in the CMZ are illustrated in figure 13. The top panel shows a schematic sketch of the CMZ projected on the sky, cross section of warping arms, and an oblique view of the resolved arms and rings.
The 2nd panel shows face-on views of the Arms using their calculated radii from the method, where the thick lines show face-on view of the Arms with determined radii. The longitudinal offset of the nodes at km s-1are marked by red lines, and dashed red lines represent position angles of Sgr B and C with respect to the curvature centre. Grey dashed lines illustrate suggested connections to the outer disc (Sawada et al., 2004). Position angles of the associated molecular clouds with respect Sgr A∗ are calculated by ( km s-1).
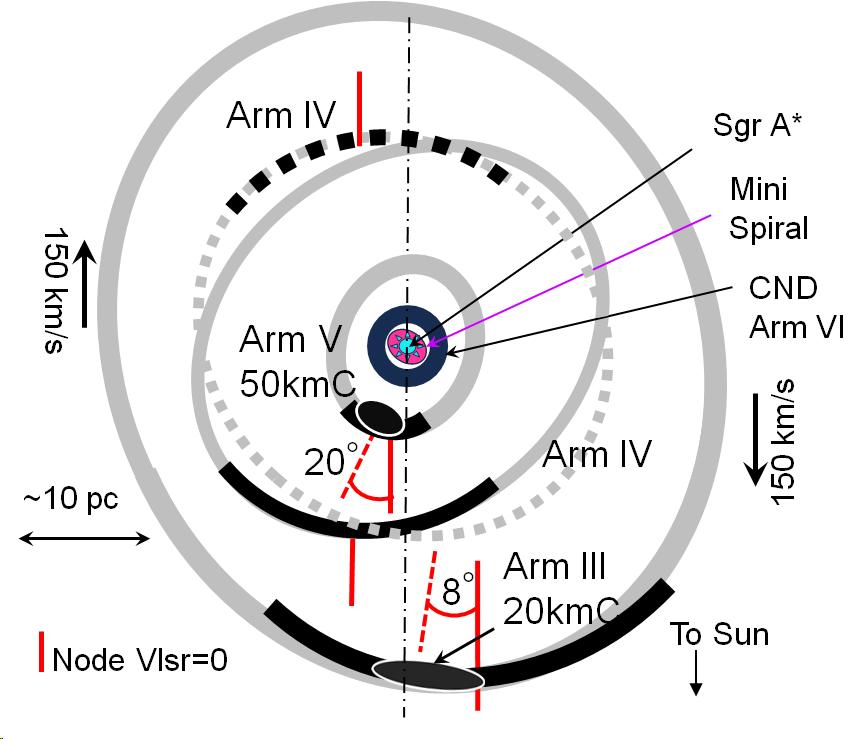
The bottom panel shows the inner arms, where the thick curves represent the measured radii with the curvature centers shifted to the km s-1nodes. Grey ellipses illustrate possible orbits of the arms satisfying the derived radii. The result is globally consistent with the face-on views obtained using the intensity ratio of the CO line emission to OH absorption line (Sawada et al., 2004; Yan et al., 2017).
We have so far assumed that the orbits of the arms are circular around a center at the longitude at which the LV ridge crosses the km s-1line. Although this assumption leads to a reasonable galactocentric distance using the method, to map the arms and clouds more precisely, we need a realistic gravitational potential and a flow line model around Sgr A (e.g. Kruijssen et al. (2015, 2019)), which is, however, beyond the scope of this paper.
4.3 Vertical extent decreasing toward the nucleus
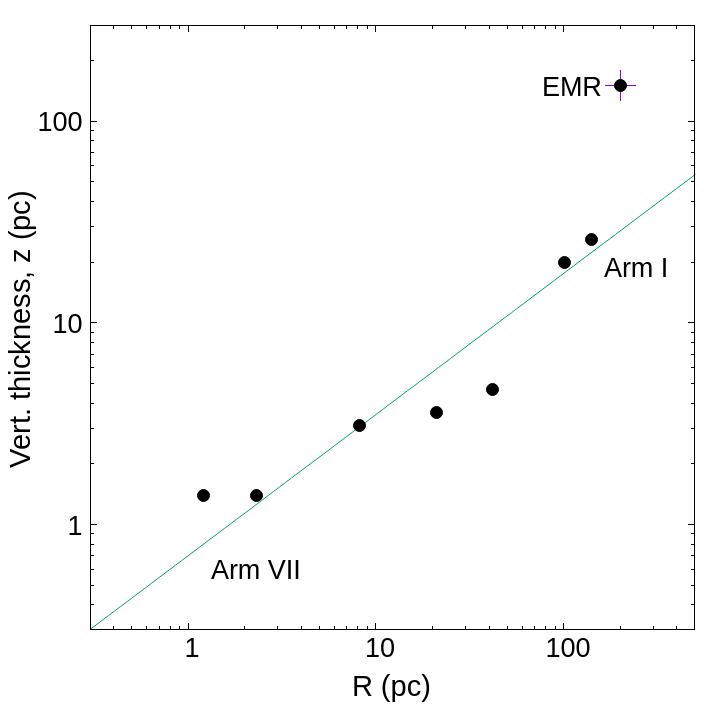
In Section 2.5 we have shown that the vertical extent of the arms increases with the radius . In figure 12 (middle panel) we plot the complete extent of the arms against the radius of the arm . Here, we also plotted the supposed vertical extent of the minispiral (Arm VII) of pc from the literature. In this log-log plot, the extent is approximately expressed by a straight line given by
| (5) |
Since the measured vertical extents of the arms can be considered to represent upper limits of the thickness of the disc, this graph indicates that the thickness of the CMZ disc decreases toward the nucleus. It means that the disc inside Arms I and II becomes thinner from a few pixels to pixels near Sgr A.
However, note that these latitude profiles do not include clouds such as the Sgr B complex in Arm I and 50kmC in Arm V, which extend more vertically than expected from the - relation. This raises the question of whether these clouds are physically associated with the arms and how such vertical protrusions could have formed from the thin arms. Alternatively, such "high-" clouds may manifest large bents (oscillations) of the trajectories or more deviated inclinations of orbits from .
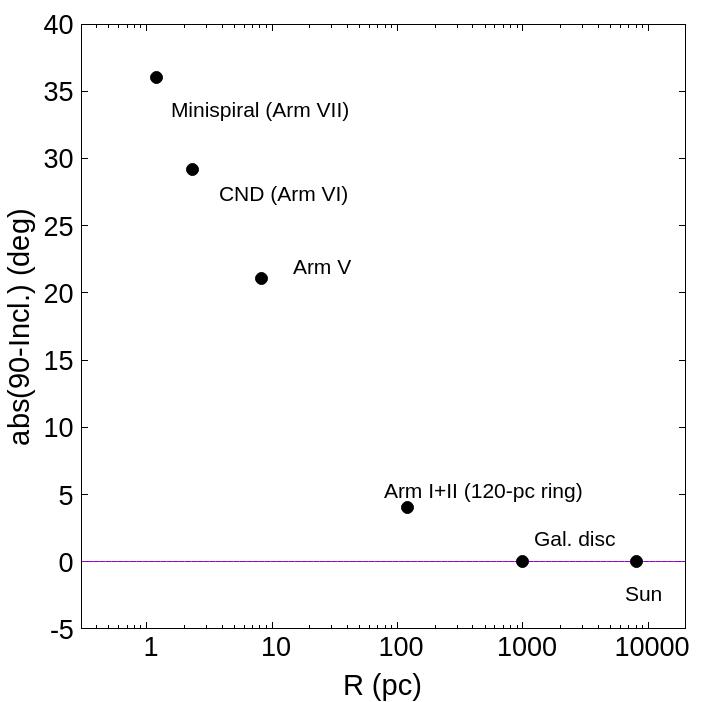
4.4 Tilt angle of disc increasing toward nucleus: Warping CMZ
As shown in the moment-0 maps (figures 9 and 10), the 120-pc ring consisting of Arms I + II, Arm V, and Arm VI (CND) exhibits elliptical structures on the sky, indicating that the rings deviate significantly from the edge-on orientation. Arm III does not appear as a clear ellipse, but its ridge is tilted a few degrees from the horizontal, which may represent a tilt of the ring. Arm IV is too divergent on the moment-0 map to define a corresponding ellipse. The minispiral (Arm VII) is well known for its highly tilted orientation with a ratio of the minor to major axes of .
We then calculate the "tilt angle" of the ring’s rotation axis from the Galaxy’s rotation axis. The inclination is measured using the ratio of the minor and major axes of an ellipse as well as the tilt angle of the major axis of the arms (ellipses) on the sky in the moment-0 maps. Plotting the results in the last panel of figure 12, we see that the tilt angle increases rapidly with decreasing radius towards the nucleus.
This behavior can be explained in terms of the gas accretion caused by the galactic shock wave as follows: The angular momentum of the gas around the rotation axis is effectively transferred by the oval motion in the barred potential, while the perpendicular component of the angular momentum is conserved. This causes a faster loss of than until the radius becomes comparable to the extended, when becomes comparable to , as observed in the central region with Arms V to VII. The magnetic twist mechanism (Shibata & Uchida, 1986) may work similarly, transferring the angular momentum of a rotating gas disc penetrated by a strong vertical magnetic field (Heywood et al., 2022).
4.5 Relationship of the Arms to the general CMZ structure
We next estimate the relative luminosity (mass) of the GC Arms to that of Arms I + II, or the 120-pc ring, using the arm radii in table 1 and their vertical extent . Assuming about the same molecular-line brightness (within an order of magnitude), the relative luminosity of Arm to that of Arm I + II is estimated by
| (6) |
where stands for arm number, I to VII, and the subscript, I+II, stands for averages of the quantities of Arms I and II. We obtain the ratios to be (for Arm I, II); (III); (IV); (V); and (VI).
Arms I and II share most of the mass of the CMZ, composing the 120 pc molecular ring (or the "great ring"). Inside the ring the disc shares only a small portion of the CMZ’s volume due to the decrease both in radius and vertical extent, or Arms III to VI share two orders of magnitudes smaller portions of the entire volume, hence the mass. This is consistent with the low infrared extinction in the nuclear stellar disc (Nogueras-Lara, 2022).
The small volume (mass) of the disc inside Arms I and II means that the inflow from the CMZ ring into the nucleus is extremely slow; in other words, the ring is large enough to supply the inner arms, albeit with very low efficiency.
5 Discussion
5.1 General remarks
Henshaw et al. (2023) published a comprehensive review of recent progress in the study of the 3D molecular gas distribution of the CMZ in the space (see the literature therein). There seems to be a consensus that Arms I and II constitute the main structure of the CMZ, composing a large ring-like structure (the 120-pc ring) of radius -120 pc rotating clockwise around Sgr A∗ as seen from the North Galactic Pole. However, apart from some mentions of the existence of Arms III and IV, there has been no detailed study of the spiral arm or ring structure inside the 120-pc ring. In this paper, we showed that there are many more inner arms, including Arm III and IV of radii and pc, respectively, and Arm V of radius pc, which was identified here for the first time. The innermost structures such as the CND and minispirals can be understood as the systems organized with a unified rule as Arm VI and VII, respectively. The thus identified arms are summarized in figure 13 and table 1.
Since the present analysis focuses on the kinematical and geometrical structure of the CMZ, we have not calculated the density and mass. Therefore, the derived arms/rings appear rather symmetric to Sgr A∗. The highly asymmetric distribution of the mass in both space and velocity known since the 1980’s (Bally et al., 1987, 1988) is somehow suppressed in the present analysis. Converting the cube to the cube for more quantitative modeling of CMZ would be a subject for the future.
Theories and simulations to understand the distribution and motion of molecular gas in the GC have been extensively developed over decades, predicting different types of flow models in the CMZ and circum-nuclear regions (Rodriguez-Fernandez & Combes, 2008; Wada et al., 2011; Kim & Stone, 2012; Krumholz & Kruijssen, 2015; Krumholz et al., 2017; Ridley et al., 2017; Sormani et al., 2019, 2020; Tress et al., 2020): The simulations suggest that symmetric spirals of grand design mimicking Arms I and II are generated as a result of galactic shock waves in a bar potential, carrying the gas to the innermost regions and giving rise to CND and mini-spiral-like structures. However, even if such a mechanism works, the efficiency of inward flow must be extremely low, because the mass ratio between the innermost arms and the entire CMZ is very low, as shown in Table 1. The proposed new view of the innermost spiral structure, including the CND and minispirals (associated with arms VI and VII, respectively), would provide further observational constraints on the model and adds information to a more precise understanding of the CMZ.
Below we discuss some specific topics related to the individual arm structures.
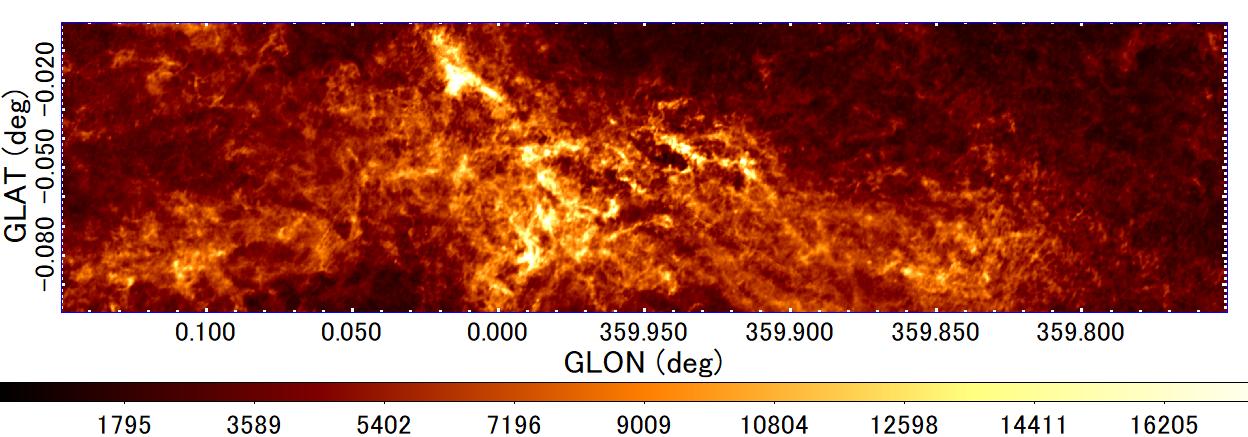
5.2 Comparison with far-infrared dust map
5.2.1 Arm I and II in dust emission
We show in figure 14 a preliminary comparison of the arm structure in the 13CO line with the image of the CMZ in a dust column density map computed from the Herschel HiGAL survey at 70, 160, 250 350 and 500 m. The data set was reprocessed with an algorithm designed to obtain more accurate measurements of cold, dense filamentary structures, densities, and temperatures by improved subtraction of diffuse foreground and background emission. The five Herschel bands were convolved to the resolution Jo of the 500 m SPIRE image and a process based on the CUPID-findback algorithm was repeatedly applied until consecutive iterations differed by less than 5% in all pixels. (See also Etxaluze et al. (2011)). Taking an estimated value for the dust beta of 1.6, we derived a dust temperature map which, combined with the flux map, yielded the dust column density map. Additional details about the method and checks on its reliability are given in Guzmán et al. (2015).
It is clear that the warped dust ring coincides closely with the molecular line ring composed of Arms I and II, where Arm I and II are located on the near and far sides of Sgr A∗, associated with Sgr B and C, respectively. However, note that Arm II near Sgr A in this moment 0 map is contaminated by Arm III associated with the 20kmC which is visible in the FIR map as a short horizontal belt near Sgr A∗. The infinity shape suggested in the integrated intensity maps in molecular lines and dust emission (Molinari et al., 2011) can be traced in the FIR dust map, whereas it does not show up so clearly here in the 13CO map resolved in the ) space.
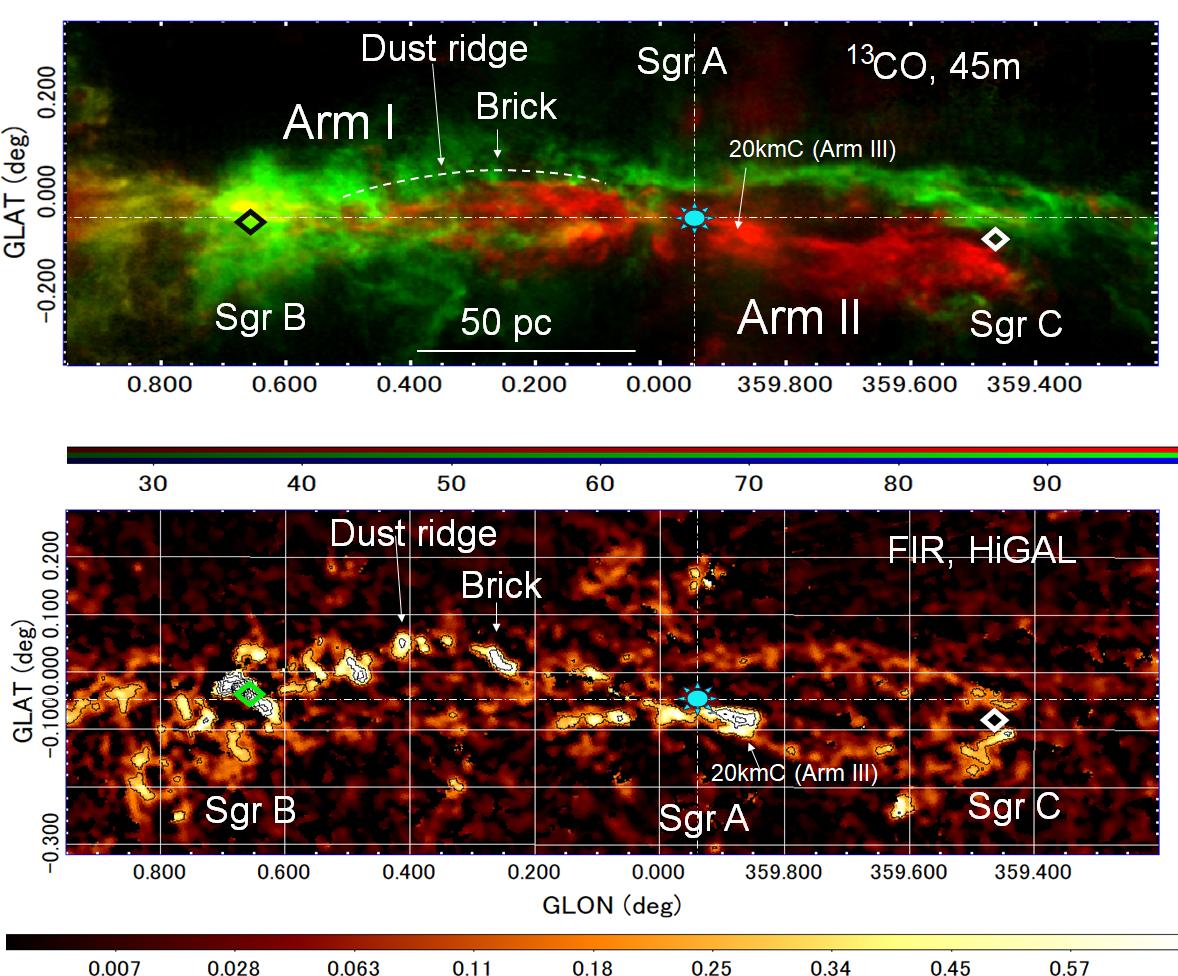
5.2.2 Dust Ridge and the Brick
The positive longitude side of Arm I in the CO line is well correlated with the Dust Ridge composed of a chain of the massive dark cloud "Brick" G+0.0253+0.016 and Clouds b, c, d, e/f in the far infrared emission and absorption (Henshaw et al., 2019; Battersby et al., 2020; Petkova et al., 2023; Ginsburg et al., 2023). However, the Brick in CO in this map shows up only partially, because the radial velocity is about 20 km s-1displaced from the main ridge of Arm I as shown in figure 3 so that the CO-line moment 0 map misses the major part of the cloud.
5.2.3 Other Dust clouds
The dust clouds called "Stone, Straw, and Sticks" draw a horizontal belt around (Battersby et al., 2020) appearing in the moment 0 map of Arm II in figure 9 (panel D). They appear as an LV ridge in figures 3, 3 and 7 (top panel), running from to . Coincidence in the LV plane indicates that the clouds are associated with Arm II. We point out that mid-infrared (4–8 m) images of the GC (Stolovy et al., 2006) reveal no prominent absorption toward these clouds, indicating that they are on the far side of the central bulge, supporting the association with Arm II (far side). On the other hand, the Brick and Dust Ridge exhibit heavy extinction, locating them in the near side, which is consistent with the association with Arm I (near side).
5.3 20- and 50-km s-1 Clouds
The inner region around Sgr A∗ contains two well-known molecular clouds, 20- and 50kmC (Herrnstein & Ho, 2005; Takekawa et al., 2017a; Tsuboi et al., 2009; Uehara et al., 2019). We comment on these clouds, which are visible and resolved in our data.
5.3.1 Line-of-sight locations of 20- and 50kmC
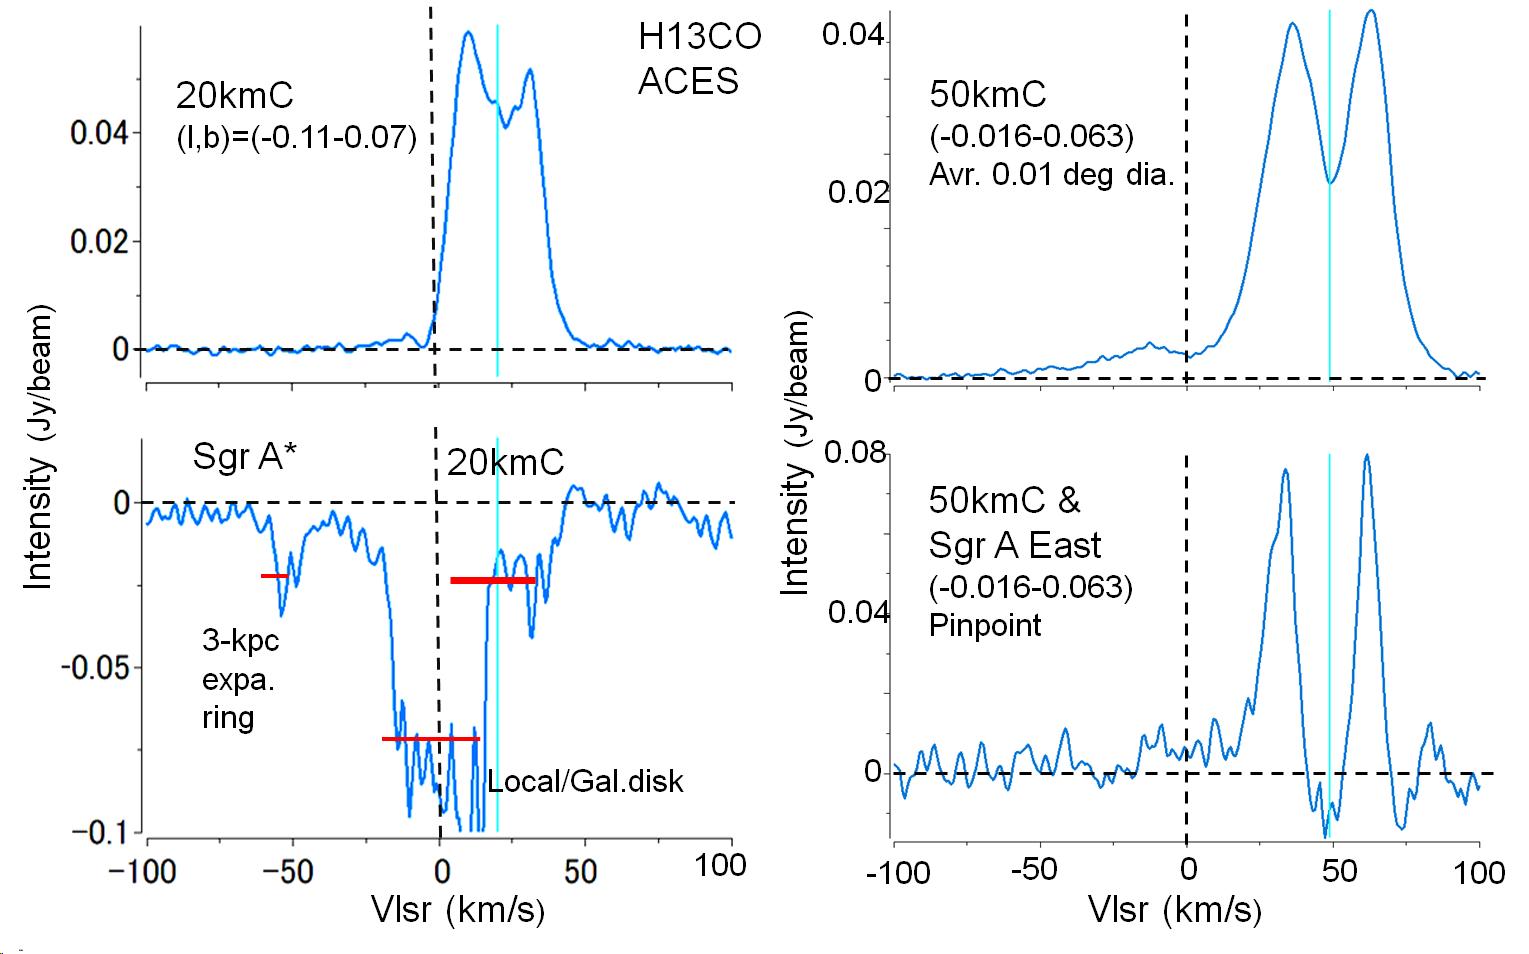
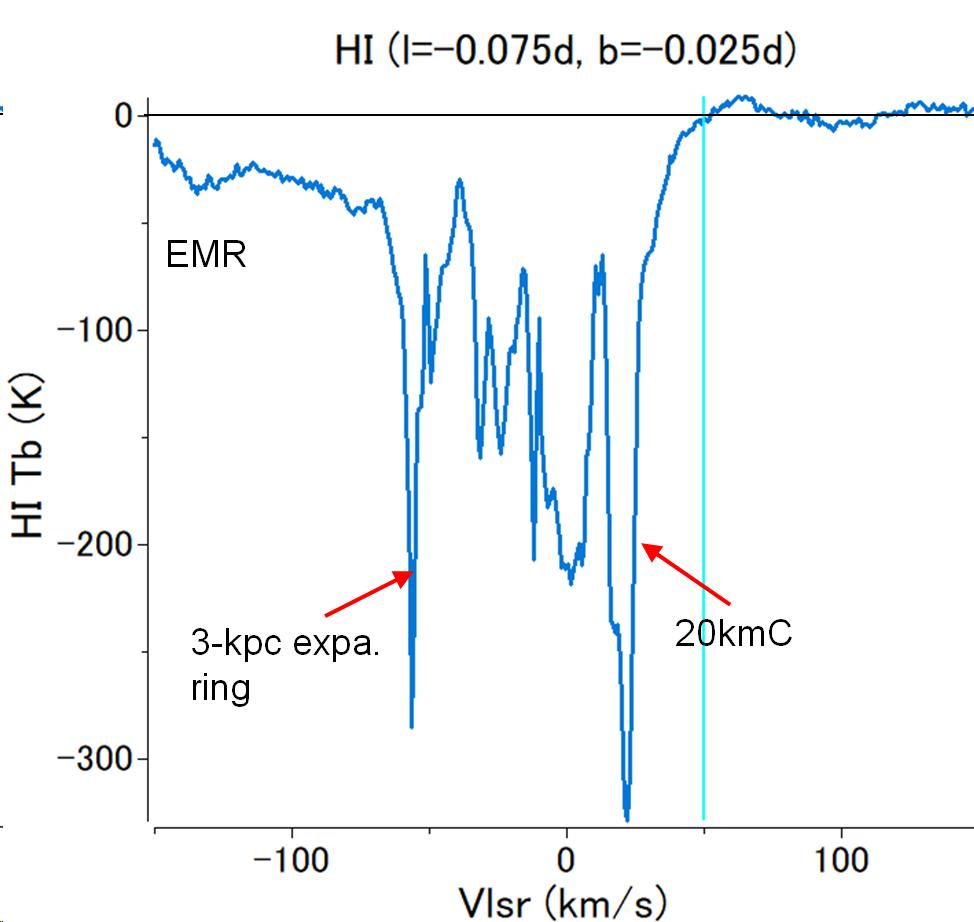
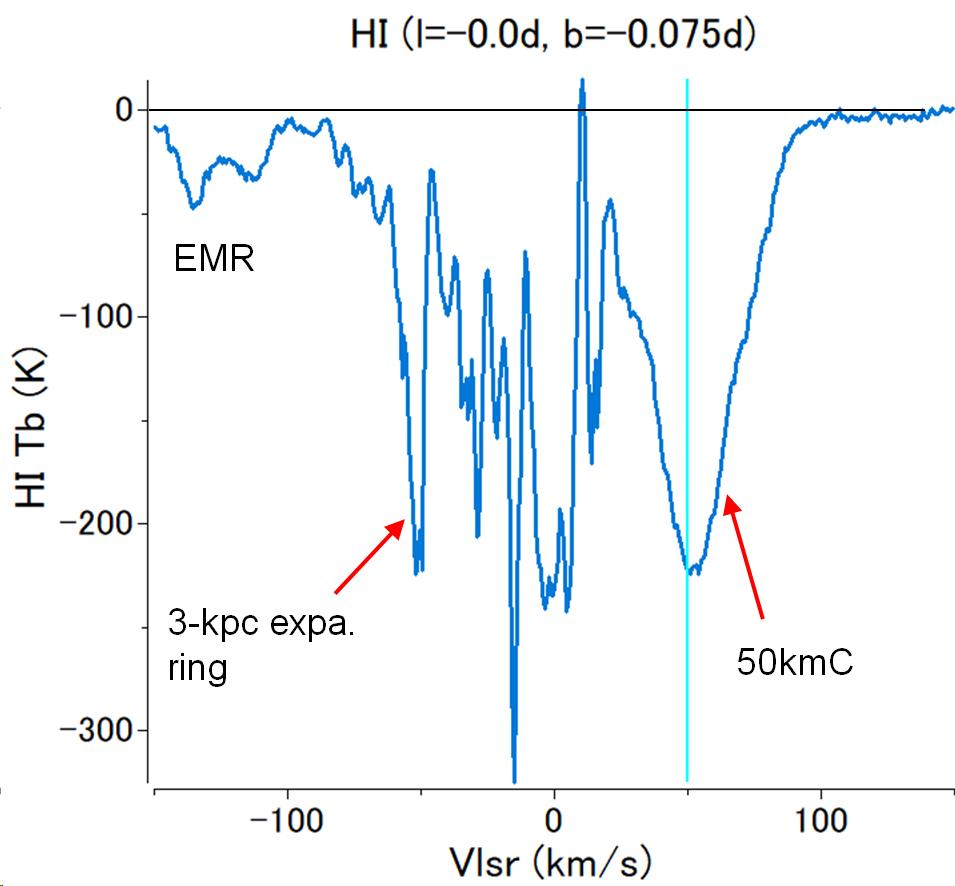
We first consider the line-of-sight locations of the two clouds using absorption profiles of the molecular line spectra shown in figure 15. The 20kmC shows a clear double-horn profile indicative of self-absorption. The pinpoint spectrum on Sgr A∗ exhibits negative intensity absorption, indicating that the continuum emission is absorbed by 20kmC, so that the cloud is on the near side of Sgr A∗. 50kmC also shows double horns toward the edge of Sgr A East, and a pinpoint spectrum exhibits negative intensity absorption. This evidences that the cloud is on the near side of Sgr A East, consistent with the earlier result (Tsuboi et al., 2009).
20kmC 50kmC
H13CN ACES
A B
C D
HI ATCA
E F
E 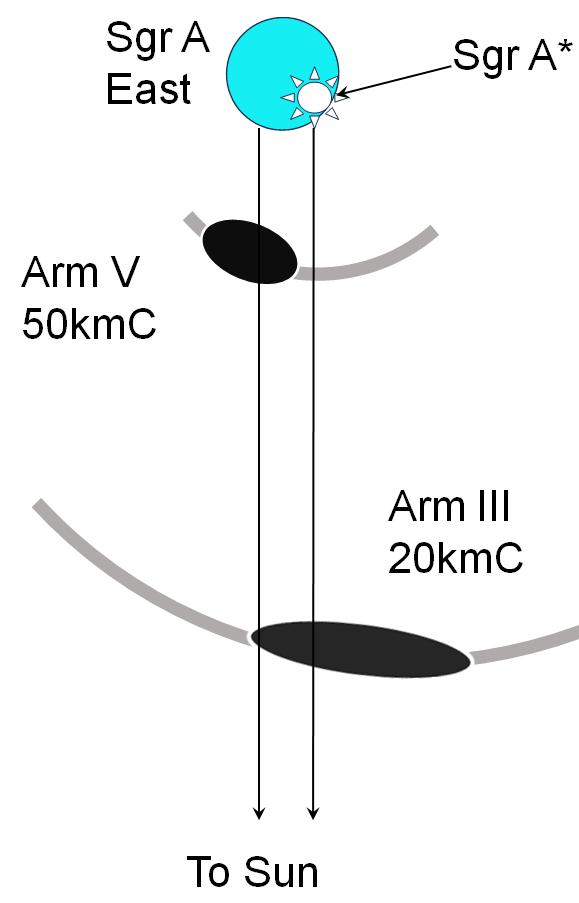
We applied the same method to the HI line using the Australia-Telescope Compact Array (ATCA) survey of the GC (McClure-Griffiths et al., 2012). The bottom panels of figure 15 show the HI-line spectra to 20kmC. Both spectra show deep absorption lines. Note also that 50kmC has a much wider line width.
We have thus proved that radio continuum emission from Sgr A is absorbed by 20- and 50kmC in the molecular and HI lines, and we conclude that the two clouds are on the near side of Sgr A∗. This is consistent with the near side location of the two clouds inferred from the analyses of dust extinction by infrared observations (Nogueras-Lara et al., 2021; Lipman et al., 2024; Walker et al., 2024).
5.3.2 20kmC
In figure 16 we show the LVD around 20- and 50kmC averaged in all the latitude range in the present analysis from to . The middle panel shows an LVD at across the centers of 20- and 50kmC and along Arm III, and the right panel is an LVD at including Arm V.
The 20kmC is aligned along the straight ridge of Arm III, which constitutes the main structure of the arm. There is no clear-cut boundary on either side of the cloud along the LV ridge, and the arm extends continuously toward both sides. This indicates that 20kmC is not an isolated cloud, but is the major part of Arm III.
The LV ridge of Arm III (20kmC) is separated by an absorption belt, which is a 2D view of the double-horn spectra. The double-horn absorption may be attributed to (i) an expanding cylinder (not a shell), (ii) absorption of the background continuum emission, or (iii) self-absorption. The possibility of an expanding cylinder (i) is unlikely considering the formation mechanism. We may also rule out an expanding spherical shell, which postulates an LV ellipse rather than an absorption belt. Absorption of background light (ii) is also unlikely because the region is pc away from Sgr A on the sky where the radio brightness is too low to cause absorption in the molecular line. We may therefore conclude that the feature is due to (iii) self-absorption along the arm.
We may thus conclude that 20kmC is the densest part of Arm III with its 3D center position at (pc). Here, are the Cartesian coordinates with respect to Sgr A∗ with the three axes in the directions toward positive galactic longitude, toward the Sun and toward the North Galactic Pole, respectively.
5.3.3 50kmC
The location of 50kmC is more complicated, because its LV ridge overlaps with Arm II, III, V and the far-side 3-kpc expanding ring (Dame & Thaddeus, 2008), and the proximity in the sky suggests association with Sgr A. Here, we may rule out Arm II and far 3-kpc ring because they are on the opposite side of Sgr A.
Adopting the kinetic energy ( erg), velocity dispersion ( km s-1) and mean gas density ( H2 cm-3) derived by Tsuboi et al. (2009), we estimate the molecular mass to be . This mass is two orders of magnitude smaller than the dynamical mass of for pc, and therefore 50kmC is not an isolated bound "cloud", but is an expanding shell or an arm orbiting (streaming) in the Galactic potential.
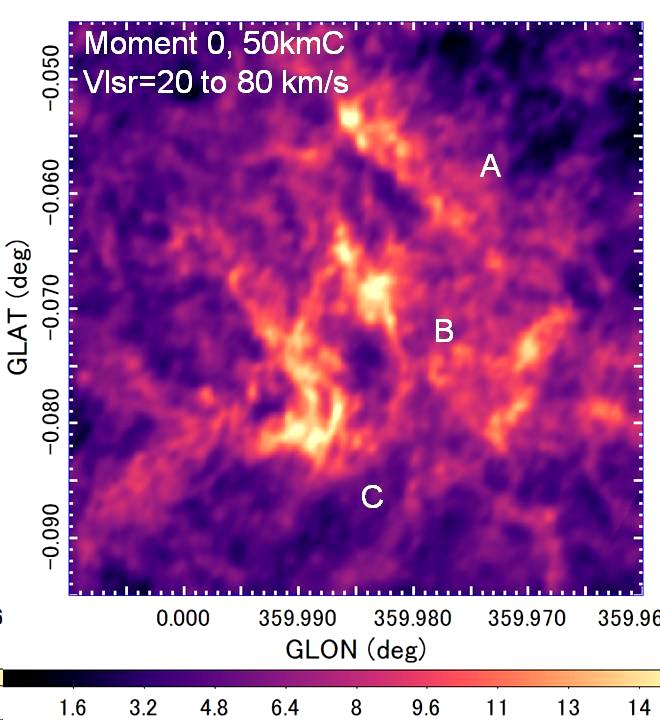
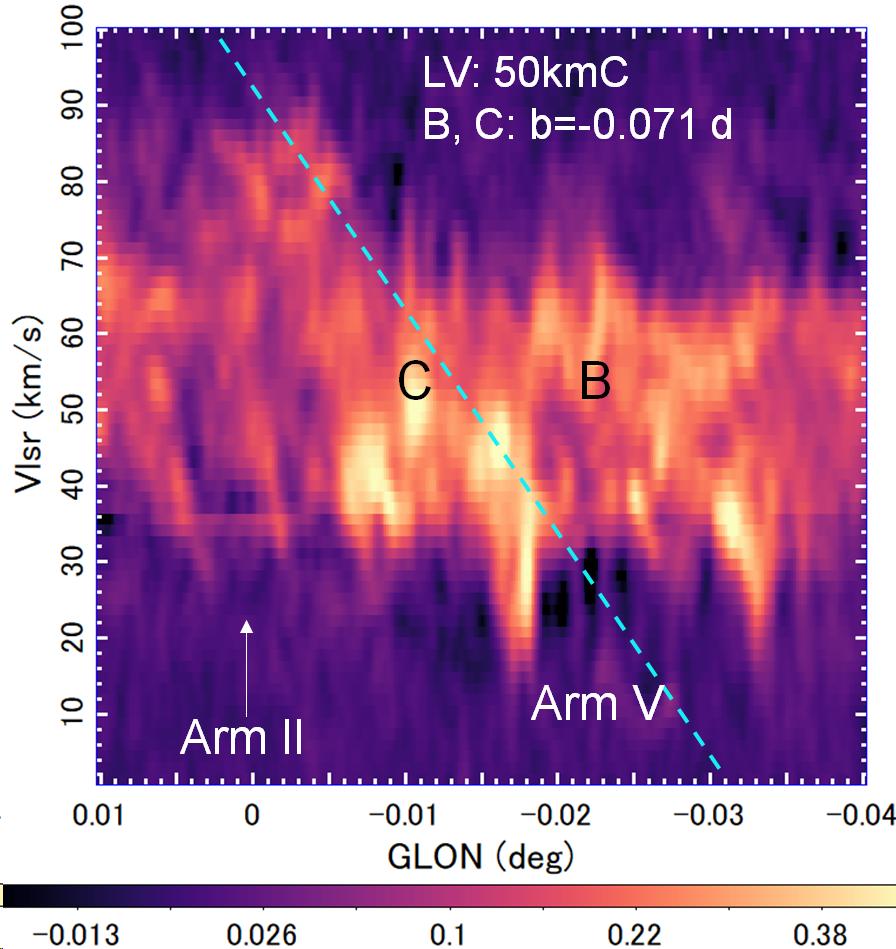
For detailed inspection of kinematics we present CS () LVDs and the moment 0 map in figures 16 and 17. The three components of 50kmC, clump A (northwest), B (center), and C (southeast) (Tsuboi et al., 2009), are resolved and reveal LV ridges coherently inclined with velocity gradients equal to those of Arm V. It is also stressed that the clumps have large velocity widths of –60 km s-1.
As for the location of 50kmC, we consider the following three possibilities:
(i) 50kmC is located near Sgr A because of their proximity on the sky (Tsuboi et al., 2009).
The large velocity width is attributed to the expansion of a supernova remnant.
However, the velocity gradient has not been discussed.
The 3D position of the cloud center with respect to Sgr A∗ is approximately (pc)
(ii) 50kmC is part of Arm V, because the LVD exactly overlaps with Arm V and the velocity gradient is equal to that of Arm V.
Also, the large velocity width is explained by the Galactic rotation.
This model places the cloud center at (pc).
(iii) 50kmC is part of Arm III, because the LVDs approximately overlap with each other.
This assumes (pc).
However, the velocity gradient and the large velocity width are not explained.
We here consider that the second scenario is plausible, but the possibilities of (i) and (iii) cannot be ruled out at this moment.
A B C
A B C
5.4 200-pc EMR
In addition to the main structures of the CMZ such as the GC arms, figures 3 to 7 also exhibit more complicated features surrounding these. One of such features is the expanding molecular ring (EMR) commonly appearing in these LVDs, which are marked in figure 7 by the nearly horizontal dashed lines EMR+ and EMR-. It has long been debated whether the EMR is due to an expanding ring caused by an explosion at the center (Kaifu et al., 1972; Scoville, 1972; Sofue, 2017), or a "parallelogram" due to noncircular gas flow in a bar potential(Binney et al., 1991; Sormani et al., 2015; Tress et al., 2020).
Discussion of these features is beyond the scope of this paper, but we point out that the EMR is fainter than the main Arms I and II by a factor of in the surface brightness of the molecular lines, and the total mass is an order of magnitude smaller than that of the CMZ (Sofue, 2017). Furthermore, the EMR has a large vertical extension above and below the CMZ of pc, which deviates significantly from the vertical extent-radius relation in figure 12. Therefore, in order for the EMR (parallelogram) to act as a mass supplier to the CMZ, the gas transported from the outer Galactic disc with a thickness of –30 pc must first be lifted to that height and then quickly compressed to the CMZ of thickness –20 pc. In this context, it has recently been argued that the western wing of the EMR may be a high-velocity (–200 km s-1) and high-altitude (–60 pc) molecular inflow with a length of pc, which acts to transport the gas into the CMZ (Veena et al., 2024).
6 Summary
Analyzing the molecular line cubes of the Galactic Center taken with the ALMA (CS ()and H13CN ), the Nobeyama 45-m telescope (13CO ) and the ASTE 10-m telescope (HCN ()), we studied the kinematic behavior of the GC Arms I to VI identified in the longitude-velocity diagrams (LVDs). The galactocentric radii of the Arms are determined by the method assuming a flat rotation curve. Applying the LV-masking method, we also obtained moment 0 maps integrated in the velocity range within –10 km s-1from the LV ridges of the Arms. We find that the radius of the th arm is approximately given by pc, suggesting a logarithmic spiral or Bode’s law-like discreteness of the orbits. If we consider the minispirals to constitute Arm VII, the relation holds from (I) to 7 (VII). The vertical full extent of the arms is approximated by pc.
Unifying the derived parameters of the arms and rings, we summarize the results in figure 13 as a schematic view of the warping CMZ: Arms I and II share most of the mass (volume) of CMZ; the inner arms share a few percent of the CMZ mass (volume); hence the accretion is slow; the vertical extent of the disc decreases toward the centre; and the warping amplitude or the arm’s tilt from the galactic plane increases toward the centre.
This paper makes use of the following ALMA data: ADS/JAO.ALMA2021.1.00172.
ALMA is a partnership of ESO (representing its member states), NSF (USA) and NINS (Japan), together with NRC (Canada), NSTC and ASIAA (Taiwan), and KASI (Republic of Korea), in cooperation with the Republic of Chile.
The Joint ALMA Observatory is operated by ESO, AUI/NRAO and NAOJ.
The data analysis in this paper was partially performed at the Astronomical Data Center of the National Astronomical Observatories of Japan.
KK acknowledges the support by JSPS KAKENHI Grant Numbers JP23K20035 and JP24H00004.
C. Battersby gratefully acknowledges funding from National Science Foundation under Award Nos. 2108938, 2206510, and CAREER 2145689, as well as from the National Aeronautics and Space Administration through the Astrophysics Data Analysis Program under Award “3-D MC: Mapping Circumnuclear Molecular Clouds from X-ray to Radio,” Grant No. 80NSSC22K1125.
COOL Research DAO (Chevance et al., 2025) is a Decentralised Autonomous Organisation supporting research in astrophysics aimed at uncovering our cosmic origins.
J.M.D.K. gratefully acknowledges funding from the European Research Council (ERC) under the European Union’s Horizon 2020 research and innovation programme via the ERC Starting Grant MUSTANG (grant agreement number 714907).
KMD acknowledges support from the European Research Council (ERC) Advanced Grant MOPPEX 833460.vii.
L.C., V.M.R. and I.J.-S. acknowledge support from the grant PID2022-136814NB-I00 by the Spanish Ministry of Science, Innovation and Universities/State Agency of Research MICIU/AEI/10.13039/501100011033 and by ERDF, UE.
V.M.R. also acknowledges support from the grant RYC2020-029387-I funded by MICIU/AEI/10.13039/501100011033 and by "ESF, Investing in your future", from the Consejo Superior de Investigaciones Científicas (CSIC) and the Centro de Astrobiología (CAB) through the project 20225AT015 (Proyectos intramurales especiales del CSIC); and from the grant CNS2023-144464 funded by MICIU/AEI/10.13039/501100011033 and by “European Union NextGenerationEU/PRTR”.
I.J.-S. acknowledges support from ERC grant OPENS, GA No. 101125858, funded by the European Union. Views and opinions expressed are however those of the author(s) only and do not necessarily reflect those of the European Union or the European Research Council Executive Agency. Neither the European Union nor the granting authority can be held responsible for them.
P. García is sponsored by the Chinese Academy of Sciences (CAS), through a grant to the CAS South America Center for Astronomy (CASSACA).
R.S.K. thanks the 2024/25 Class of Radcliffe Fellows for highly interesting and stimulating discussions, financial support from the European Research Council via ERC Synergy Grant “ECOGAL” (project ID 855130), the German Excellence Strategy via (EXC 2181 - 390900948) “STRUCTURES”, the German Ministry for Economic Affairs and Climate Action in project “MAINN” (funding ID 50OO2206), Ministry of Science, Research and the Arts of the State of Baden-Württemberg through bwHPC and the German Science Foundation through grants INST 35/1134-1 FUGG and 35/1597-1 FUGG, and also for data storage at SDS@hd funded through grants INST 35/1314-1 FUGG and INST 35/1503-1 FUGG.
D. Riquelme-Vásquez acknowledges the financial support of DIDULS/ULS, through the project PAAI 2023.
J.Wallace gratefully acknowledges funding from National Science Foundation under Award Nos. 2108938 and 2206510.
Data availability
The single-dish data underlying this article are available at https:// www.nro.nao.ac.jp/ nro45mrt/html/ results/data.html. The interferometer data were taken from the internal release version of the 12m+7m+TP (Total Power)-mode data from the ALMA cycle 8 Large Program "ALMA Central Molecular Zone Exploration Survey" (ACES, 2021.1.00172.L).
Conflict of interest
The authors declare that there is no conflict of interest.
References
- Bally et al. (1987) Bally, J., Stark, A. A., Wilson, R. W., et al. 1987, ApJS, 65, 13. doi:10.1086/191217
- Bally et al. (1988) Bally, J., Stark, A. A., Wilson, R. W., et al. 1988, ApJ, 324, 223. doi:10.1086/165891
- Battersby et al. (2020) Battersby, C., Keto, E., Walker, D., et al. 2020, ApJS, 249, 35. doi:10.3847/1538-4365/aba18e
- Binney et al. (1991) Binney J., Gerhard O. E., Stark A. A., Bally J., Uchida K. I., 1991, MNRAS, 252, 210
- Chevance et al. (2025) Chevance M., Kruijssen J. M. D., Longmore S. N., 2025, doi:10.48550/arXiv.2501.13160
- Dame & Thaddeus (2008) Dame, T. M. & Thaddeus, P. 2008, ApJ, 683, L143. doi:10.1086/591669
- Etxaluze et al. (2011) Etxaluze, M., Smith, H. A., Tolls, V., et al. 2011, AJ, 142, 134. doi:10.1088/0004-6256/142/4/134
- Feldmeier et al. (2014) Feldmeier, A., Neumayer, N., Seth, A., et al. 2014, AA, 570, A2. doi:10.1051/0004-6361/201423777
- Genzel et al. (1990) Genzel, R., Stacey, G. J., Harris, A. I., et al. 1990, ApJ, 356, 160. doi:10.1086/168827
- Ginsburg et al. (2024) Ginsburg, A., Bally, J., Barnes, A. T., et al. 2024, ApJ, 968, L11. doi:10.3847/2041-8213/ad47fa
- Ginsburg et al. (2023) Ginsburg, A., Barnes, A. T., Battersby, C. D., et al. 2023, ApJ, 959, 36. doi:10.3847/1538-4357/acfc34
- Ginsburg et al. (2016) Ginsburg, A., Henkel, C., Ao, Y., et al. 2016, AA, 586, A50. doi:10.1051/0004-6361/201526100
- Gravity Collaboration et al. (2019) Gravity Collaboration, Abuter, R., Amorim, A., et al. 2019, AA, 625, L10. doi:10.1051/0004-6361/201935656
- Guzmán et al. (2015) Guzmán, A. E., Sanhueza, P., Contreras, Y., et al. 2015, ApJ, 815, 130. doi:10.1088/0004-637X/815/2/130
- Henshaw et al. (2023) Henshaw, J. D., Barnes, A. T., Battersby, C., et al. 2023, Protostars and Planets VII, 534, 83. doi:10.48550/arXiv.2203.11223
- Henshaw et al. (2019) Henshaw, J. D., Ginsburg, A., Haworth, T. J., et al. 2019, MNRAS, 485, 2457. doi:10.1093/mnras/stz471
- Henshaw et al. (2022) Henshaw, J. D., Krumholz, M. R., Butterfield, N. O., et al. 2022, MNRAS, 509, 4758. doi:10.1093/mnras/stab3039
- Henshaw et al. (2016) Henshaw, J. D., Longmore, S. N., Kruijssen, J. M. D., et al. 2016, MNRAS, 457, 2675.
- Heywood et al. (2022) Heywood, I., Rammala, I., Camilo, F., et al. 2022, ApJ, 925, 165. doi:10.3847/1538-4357/ac449a
- Herrnstein & Ho (2005) Herrnstein, R. M. & Ho, P. T. P. 2005, ApJ, 620, 287. doi:10.1086/426047
- Hsieh et al. (2021) Hsieh, P.-Y., Koch, P. M., Kim, W.-T., et al. 2021, ApJ, 913, 94. doi:10.3847/1538-4357/abf4cd
- Iwata et al. (2023) Iwata, Y., Oka, T., Takekawa, S., et al. 2023, ApJ, 950, 25. doi:10.3847/1538-4357/acc9b0
- Kaifu et al. (1972) Kaifu, N., Kato, T., & Iguchi, T. 1972, Nature Physical Science, 238, 105
- Kim & Stone (2012) Kim, W.-T. & Stone, J. M. 2012, ApJ, 751, 124. doi:10.1088/0004-637X/751/2/124
- Kruijssen et al. (2015) Kruijssen, J. M. D., Dale, J. E., & Longmore, S. N. 2015, MNRAS, 447, 1059. doi:10.1093/mnras/stu2526
- Kruijssen et al. (2019) Kruijssen, J. M. D., Dale, J. E., Longmore, S. N., et al. 2019, MNRAS, 484, 5734. doi:10.1093/mnras/stz381
- Krumholz & Kruijssen (2015) Krumholz, M. R. & Kruijssen, J. M. D. 2015, MNRAS, 453, 739. doi:10.1093/mnras/stv1670
- Krumholz et al. (2017) Krumholz, M. R., Kruijssen, J. M. D., & Crocker, R. M. 2017, MNRAS, 466, 1213. doi:10.1093/mnras/stw3195
- Lipman et al. (2024) Lipman, D., Battersby, C., Walker, D. L., et al. 2024, arXiv:2410.17321. doi:10.48550/arXiv.2410.17321
- Mart´ın et al. (2012) Martín, S., Martín-Pintado, J., Montero-Castaño, M., et al. 2012, AA, 539, A29. doi:10.1051/0004-6361/201117268
- McClure-Griffiths et al. (2012) McClure-Griffiths, N. M., Dickey, J. M., Gaensler, B. M., et al. 2012, ApJS, 199, 12. doi:10.1088/0067-0049/199/1/12
- Mills et al. (2017) Mills, E. A. C., Togi, A., & Kaufman, M. 2017, ApJ, 850, 192. doi:10.3847/1538-4357/aa951f
- Molinari et al. (2011) Molinari, S., Bally, J., Noriega-Crespo, A., et al. 2011, ApJ, 735, L33. doi:10.1088/2041-8205/735/2/L33
- Montero-Castaño et al. (2009) Montero-Castaño, M., Herrnstein, R. M., & Ho, P. T. P. 2009, ApJ, 695, 1477. doi:10.1088/0004-637X/695/2/1477
- Morris & Serabyn (1996) Morris, M. & Serabyn, E. 1996, ARA&A, 34, 645. doi:10.1146/annurev.astro.34.1.645
- Nogueras-Lara et al. (2021) Nogueras-Lara, F., Schödel, R., Neumayer, N., et al. 2021, AA, 647, L6. doi:10.1051/0004-6361/202140554
- Nogueras-Lara (2022) Nogueras-Lara, F. 2022, AA, 668, L8. doi:10.1051/0004-6361/202244934
- Oka et al. (1998) Oka, Tomoharu, Hasegawa, T., Sato, F., et al. 1998, ApJS, 118, 455. doi:10.1086/313138
- Oka et al. (2011) Oka, T., Nagai, M., Kamegai, K., et al. 2011, ApJ, 732, 120. doi:10.1088/0004-637X/732/2/120
- Oka et al. (2022) Oka, T., Uruno, A., Enokiya, R., et al. 2022, ApJS, 261, 13. doi:10.3847/1538-4365/ac6bfc
- Oka et al. (1999) Oka, T., White, G. J., Hasegawa, T., et al. 1999, ApJ, 515, 249. doi:10.1086/307029
- Petkova et al. (2023) Petkova, M. A., Kruijssen, J. M. D., Henshaw, J. D., et al. 2023, MNRAS, 525, 962. doi:10.1093/mnras/stad2344
- Ridley et al. (2017) Ridley, M. G. L., Sormani, M. C., Tre, R. G., et al. 2017, MNRAS, 469, 2251. doi:10.1093/mnras/stx944
- Rodriguez-Fernandez & Combes (2008) Rodriguez-Fernandez, N. J. & Combes, F. 2008, AA, 489, 115. doi:10.1051/0004-6361:200809644
- Sánchez-Monge et al. (2018) Sánchez-Monge, Á., Schilke, P., Ginsburg, A., et al. 2018, AA, 609, A101. doi:10.1051/0004-6361/201730425
- Sawada et al. (2004) Sawada, T., Hasegawa, T., Handa, T., et al. 2004, MNRAS, 349, 1167.
- Scoville (1972) Scoville, N. Z. 1972, ApJ, 175, L127
- Shibata & Uchida (1986) Shibata, K. & Uchida, Y. 1986, PASJ, 38, 631
- Shirley (2015) Shirley, Y. L. 2015, PASP, 127, 299. doi:10.1086/680342
- Sofue (1993) Sofue, Y. 1993, PASP, 105, 308. doi:10.1086/133148
- Sofue (1995) Sofue, Y. 1995, PASJ, 47, 527.
- Sofue (2006) Sofue, Y. 2006, PASJ, 58, 335. doi:10.1093/pasj/58.2.335
- Sofue (2013) Sofue, Y. 2013, PASJ, 65, 118. doi:10.1093/pasj/65.6.118
- Sofue (2017) Sofue, Y. 2017, MNRAS, 470, 1982
- Sofue (2020) Sofue, Y. 2020, MNRAS, 498, 1335. doi:10.1093/mnras/staa2389
- Sofue (2022) Sofue, Y. 2022, MNRAS, 516, 907. doi:10.1093/mnras/stac2243
- Sofue (2024) Sofue, Y. 2024, MNRAS, 532, 4187. doi:10.1093/mnras/stae1724
- Sormani et al. (2015) Sormani, M. C., Binney, J., & Magorrian, J. 2015, MNRAS, 449, 2421. doi:10.1093/mnras/stv441
- Sormani et al. (2019) Sormani, M. C., Tress, R. G., Glover, S. C. O., et al. 2019, MNRAS, 488, 4663.
- Sormani et al. (2020) Sormani, M. C., Tress, R. G., Glover, S. C. O., et al. 2020, MNRAS, 497, 5024. doi:10.1093/mnras/staa1999
- Stolovy et al. (2006) Stolovy, S., Ramirez, S., Arendt, R. G., et al. 2006, Journal of Physics Conference Series, 54, 176. doi:10.1088/1742-6596/54/1/030
- Takekawa et al. (2017b) Takekawa, S., Oka, T., Iwata, Y., et al. 2017b, ApJ, 843, L11. doi:10.3847/2041-8213/aa79ee
- Takekawa et al. (2017a) Takekawa, S., Oka, T., & Tanaka, K. 2017a, ApJ, 834, 121. doi:10.3847/1538-4357/834/2/121
- Tanaka et al. (2018) Tanaka, K., Nagai, M., Kamegai, K., et al. 2018, ApJS, 236, 40. doi:10.3847/1538-4365/aab9a5
- Tokuyama et al. (2019) Tokuyama, S., Oka, T., Takekawa, S., et al. 2019, PASJ, 71, S19. doi:10.1093/pasj/psy150
- Tress et al. (2020) Tress, R. G., Sormani, M. C., Glover, S. C. O., et al. 2020, MNRAS, 499, 4455. doi:10.1093/mnras/staa3120
- Tsuboi et al. (1999) Tsuboi, M., Handa, T., & Ukita, N. 1999, ApJS, 120, 1. doi:10.1086/313165
- Tsuboi et al. (2017) Tsuboi, M., Kitamura, Y., Uehara, K., et al. 2017, ApJ, 842, 94. doi:10.3847/1538-4357/aa74e3
- Tsuboi et al. (2018) Tsuboi, M., Kitamura, Y., Uehara, K., et al. 2018, PASJ, 70, 85. doi:10.1093/pasj/psy080
- Tsuboi et al. (2009) Tsuboi, M., Miyazaki, A., & Okumura, S. K. 2009, PASJ, 61, 29. doi:10.1093/pasj/61.1.29
- Tsuboi et al. (2015) Tsuboi, M., Miyazaki, A., & Uehara, K. 2015, PASJ, 67, 109. doi:10.1093/pasj/psv076
- Uehara et al. (2019) Uehara, K., Tsuboi, M., Kitamura, Y., et al. 2019, ApJ, 872, 121. doi:10.3847/1538-4357/aafee7
- Veena et al. (2024) Veena, V. S., Kim, W.-J., Sánchez-Monge, Á., et al. 2024, AA, 689, A121. doi:10.1051/0004-6361/202450902
- Wada et al. (2011) Wada, K., Baba, J., & Saitoh, T. R. 2011, ApJ, 735, 1. doi:10.1088/0004-637X/735/1/1
- Walker et al. (2021) Walker, D. L., Longmore, S. N., Bally, J., et al. 2021, MNRAS, 503, 77. doi:10.1093/mnras/stab415
- Wright et al. (2001) Wright, M. C. H., Coil, A. L., McGary, R. S., et al. 2001, ApJ, 551, 254. doi:10.1086/320089
- Yan et al. (2017) Yan, Q.-Z., Walsh, A. J., Dawson, J. R., et al. 2017, MNRAS, 471, 2523. doi:10.1093/mnras/stx1724
- Walker et al. (2024) Walker, D. L., Battersby, C., Lipman, D., et al. 2024, arXiv:2410.17320. doi:10.48550/arXiv.2410.17320
- Zhao et al. (2009) Zhao, J.-H., Morris, M. R., Goss, W. M., et al. 2009, ApJ, 699, 186. doi:10.1088/0004-637X/699/1/186
Appendix A IMSHIFT-relieving method
In order to abstract tilted LV stripes representing rotating arms in the CMZ using single dish observations, we apply the IMSHIFT relieving technique, which is a modification of the "background-filtering" (BGF) (pressing) method (Sofue, 1993). This method subtracts extended components with scale sizes greater than a threshold value (here 5 pixels) in one direction (here in galactic longitude), so that it enhances oblique and vertical LV stripes. This method, therefore, suppresses the horizontal LV stripes (contamination) due to the fore- and background Galactic disc. We confirmed that there are no significant differences in the results when the relieving size is from to 10 pix. Figure 18 shows an example of relieved LVD averaged in in the whole CMZ in 13CO line, and the bottom panel is enlargement in the central region at a fixed latitude.
The method consists of the following procedure. Let the original map represents intensity distribution . The relieved intensity is defined by
| (7) |
where and . We then replace the pixel values to zero, if . In the present analysis, we adopt a relieving size of pc in the longitude direction. However, the following point may be kept in mind when using it: The method suppresses structures wider than the threshold width, the obtained LVDs are not useful to discuss large-scale arms and rings, particularly in the outer CMZ.
45-m 13CO , Relieved LVD, Avr.
45-m 13CO LVD chan. Relief
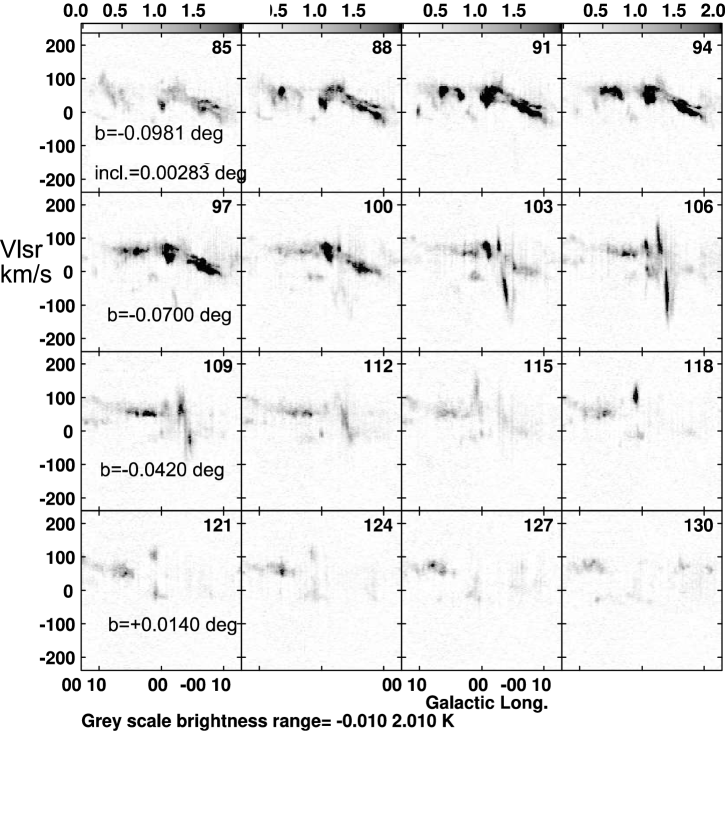
Appendix B Channel LVDs
We present latitudinal channel maps of LVDs of the central region in the H13CN line from ASTE 10-m in the top panel of figure 19 in order to present high-density LV arms. The 2nd and bottom panels show CS () and H13CN -line channel LVDs from ACES of the central region at higher resolutions, respectively. These figures along with the original cubes were used to find and identify an arm as a straight LV ridge extending over km s-1, and to confirm that the arm is not artifact specific to a certain channel, but is a real object by comparing the feature with those continuously appearing in the neighboring multiple channels.
ASTE 10m HCN ()
ALMA CS ()
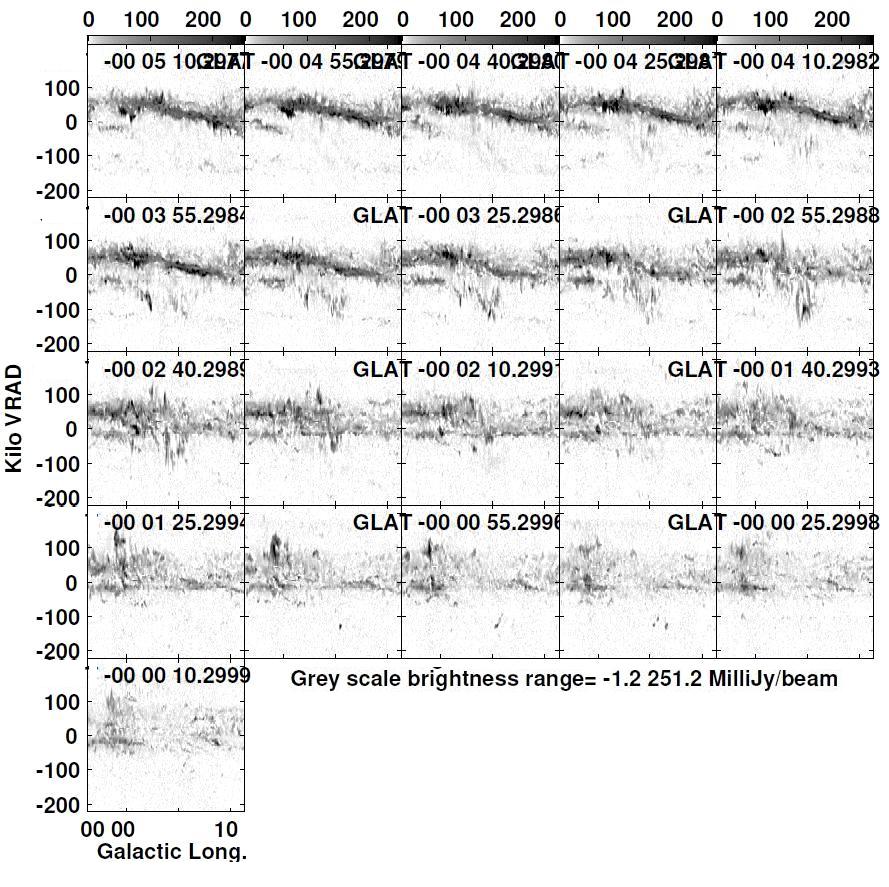
ALMA H13CN