The persistent shift in spin-down rate following the largest Crab pulsar glitch rules out external torque variations due to starquakes
Abstract
It was previously believed that, the long-term persistent increase in the spin-down rate of the Crab pulsar following a glitch is direct evidence of a starquake-induced glitch or at least related to a starquake. Using radio data covering 1710 days following the 2017 glitch, we obtain an extreme persistent increase of the spin-down rate, which allows to test two prevailing models related to starquake through an interrelation analysis between glitch size (the amplitude of the frequency step at a glitch) and persistent increase in the spin-down rate of the star. Our results do not support the hypothesis that glitches induce the external torque variation of the Crab pulsar, which may indicate no occurrence of starquake during the Crab pulsar glitch. This can explain why no changes in the radio and X-ray flux, pulse profile and spectrum of the Crab pulsar have been observed. We also suggest an internal mechanism due to superfluidity as an explanation for the long-term persistent shift in spin-down rate of the Crab pulsar following the relatively large glitches.
1 Introduction
Pulsars are generally extremely stable rotators and show regular spin-down trends. However, the steady spin-down of many young pulsars is occasionally interrupted by the so-called glitch phenomenon, which corresponds to increases in rotational frequency and spin down rate of pulsars, followed by a recovery process to a new spin down rate within timescales of tens to hundreds of days 111The recovery timescale(s) can be found at the URL https://www.atnf.csiro.au/people/pulsar/psrcat/glitchTbl.html.. The fractional glitch size, defined as , is in the range , where is the pulsar rotation rate, is the step increase in rotational frequency. Similarly, the fractional increase in spin down rate, , ranges from to , is the pulsar spin down rate, is the step increase in pulsar spin down rate, generally, . Although nowadays there were a few sporadic cases possibly related to glitch activity, for example, the 2016 December glitch of the Vela pulsar (2018Natur.556..219P), the 2007 glitch of the high magnetic field pulsar J1119-6127 (2015MNRAS.449..933A) and the 2022 glitch of PSR J0742-2822 (2024arXiv241217766Z), no robust evidence for permanent surface changes on neutron stars has been found in rotation-powered pulsars (RPPs). As of this writing, 682 glitches have been observed in 229 pulsars, among which are the prolific Crab pulsar and Vela pulsar 222https://www.jb.man.ac.uk/pulsar/glitches/gTable.html (2022MNRAS.510.4049B)..
Theoretically, there is currently no conclusive result on the physical origin of the glitch phenomenon, but two models are highly proposed, the starquake model (1969Natur.223..597R; 1971AnPhy..66..816B; 2014MNRAS.443.2705Z; 2018MNRAS.476.3303L; 2020MNRAS.491.1064G; 2021A&A...654A..47R; 2021MNRAS.500.5336W; 2023MNRAS.523.3967L) and the superfluid model (1969Natur.224..673B; 1975Natur.256...25A; 1984ApJ...276..325A; 1999PhRvL..83.3362L).
In the starquake model, a glitch occurs when the accumulated stress of the material in the solid crust reaches its critical stress during the long-term spin down process of the pulsar (1969Natur.223..597R). The critical stress is determined by the strength of the crustal material. On the basis of current neutron star models, starquake mechanism would lead to spin-ups of the magnitude observed in the Crab pulsar every few years, i.e., , but the Vela quake of such magnitude may be repeated for several hundred years (1971AnPhy..66..816B; 1972NPhS..235...43P).
For the superfluid model, the interior superfluid component of the neutron star (NS) rotates faster than the crystalline crust, the angular momentum of the interior superfluid component is contained in an array of superfluid vortices, and it decreases its rotation rate through vortex outward migration. Glitches arise from an exchange of angular momentum between the superfluid component of the star and the crystalline crust (1969Natur.224..673B; 1975Natur.256...25A; 2022ApJ...939....7H). The following recovery process represents the response of vortex creep to glitch-induced rotation changes. During the steady state, when no glitch occurs, vortices do not migrate, which is called pinned to the crustal lattice sites, whereas the glitch process corresponds to vortices unpin from the pinning site. Because the recovery to pre-glitch spin-down state in Vela-like pulsars has been successfully described in the vortex creep model developed by Alpar et al. (1984ApJ...276..325A), currently the vortex model was thought to be the standard picture for pulsar glitches. Typically, Vela pulsar glitch includes several rapid exponential components in the spin down rate (the timescales range from days to tens of days) and a long-term linear increase in the spin-down rate (1990Natur.345..416F; 1993ApJ...409..345A; 2018IAUS..337..197M). In the vortex creep picture, weakly pinned regions have linear dynamical responses to crustal rotational changes and contribute the observed exponential recoveries in the spin-down rate, while the strongly pinned region has a non-linear dynamical response that results in a long-term linear increase in spin-down rate, as observed in Vela and other young pulsars (1993ApJ...409..345A).
However, the post-glitch behavior in the Crab pulsar was quite different from that of the Vela pulsar. Large glitches in the Crab pulsar never recovered to the pre-glitch spin down rate (1992ApJ...390L..21L). Three glitches in 1975 (MJD 42447.26(4)), 1989 (MJD 47767.504(3)), and 2011 (MJD 55875.5(1)) are classic events that will be called “isolated” glitches in the next section. The post-glitch spin down rate of the Crab pulsar decreases rapidly within about 100 days after each glitch, and then it continues to increase in a quasi-exponential way toward a new stable value on a timescale of around 320 days (see Eq.(6) and figure in 2015MNRAS.446..857L). The difference between the new stable state and the pre-glitch one represents a permanent increase in spin-down rate of the star (persistent shift, , hereafter). Meanwhile, by enough time after the glitch, the pulsar was spinning slower than the expected rates had the glitches not occurred, called frequency deffcits that was illustrated in figure 1 in 1992ApJ...390L..21L.
Owing to these post-glitch behaviors, the starquake is believed to be needed for the explanation of glitches in the Crab pulsar. The persistent shift might be explained by allowing changes in NS interior structure or surroundings of the NS (1992ApJ...390L..21L; 1996ApJ...459..706A) due to starquake. There are two kinds of models accounting for persistent shift, global starquake (1969Natur.223..597R) or starquake-triggered decoupling of a portion of the stars superfluid interior from external torque (1993ApJ...409..345A; 1996ApJ...459..706A). The former means that global starquake could decrease the moment of inertia (MOI) directly or the crust cracking due to either superffuid or spin-down stresses brings about a motion of the crustal plates toward the rotational axis of the star, producing a corresponding decrease in the moment of inertia (2018MNRAS.473..621A). The latter revealed that the so-called newly formed depletion region in the “vortex capacitor” model also results in a permanent decrease in the effective NS MOI that the external torque acts on (1996ApJ...459..706A). Although these models are constructed through essentially structural readjustment of the star to get a higher spin-down rate of NS, a decrease in NS MOI solely through structural readjustment cannot produce both the persistent shift and the frequency deficit observed in the Crab pulsar simultaneously (1992ApJ...390L..21L; 1997ApJ...478L..91L). As decrease in NS MOI will increase the spin-down rate, but angular momentum conservation would require the star to spin more rapidly than had the glitch not occurred. This is obviously contrary to the observations of frequency deficits (1992ApJ...390L..21L): the persistent shifts in the spin-down rate following the 1975 and 1989 Crab glitches eventually caused the star to spin less rapidly than had the glitch not occurred (1997ApJ...478L..91L).
Based on the above considerations, some models regarding an increased external torque seem promising to account for persistent shift. Ruderman proposed that, NS crust cracking leads to “plate tectonic” activity (1991ApJ...366..261R). Link et al. therefore argued that, forces exerted by pinned vortices on the crust would move crustal plates toward the equator, thus the magnetic dipole moment of the star becomes more misaligned with respect to the rotation axis, resulting in an increase in the external torque (1992ApJ...390L..21L). Using the persistent shift accumulated during 23 years (between 1969 and 1992), Link & Epstein estimated that, the magnetic inclination angle should have increased by about 1/70 rad during the entire about 1000 years lifetime of the Crab pulsar. In 1998, Link et al. proposed another possibility within starquake scenario. They proposed that, a starquake perturbs the star’s mass distribution due to a propagation of the surface material to higher latitudes along possible faults, producing a misalignment of the angular momentum and spin axes. Subsequently, damped precession to a new rotational state increases the angle between the rotation and magnetic axes that results in an additional torque (1998ApJ...508..838L).
The above two models are apparently related to starquake. In this work, we try to test them through the observed persistent shifts of the Crab pulsar. Our basic idea is presented here. Lyne et al. pointed out that, the absolute value of persistent shift following relatively large glitch in the Crab pulsar is approximately proportional to the glitch size (2015MNRAS.446..857L). The Crab pulsar experienced its largest glitch ever observed in 2017, with and (2018MNRAS.478.3832S). This large glitch is followed by several small glitches (2022MNRAS.510.4049B). After all these years, all the post-glitch transient components in pulsar spin frequency and spin down rate have decayed, therefore, we have a chance to measure its persistent shift and reanalyze the relation for the Crab pulsar. We derive their expected relation(s) based on the two models respectively (1991ApJ...366..261R; 1992ApJ...390L..21L; 1998ApJ...508..838L; 2000ASSL..254...95E). Comparing the predications based on the models with measured results based on observed data including the 2017 glitch, we test if the persistent shift is caused by starquake induced external torque variation.
This manuscript is organized as follows. We first measure the persistent shift caused by the 2017 Crab pulsar glitch in Section 2. In Section LABEL:sec3, we statistically reanalyze the 11 shift values of 30 glitch events for over 50 years. We give a new fitting function of relation and calculate the significance level of deviations from linear correlation as proposed by Lyne et al. (2015MNRAS.446..857L) for the large Crab pulsar glitch in 2017. In Section LABEL:sec4, we apply the prevailing models based on external torque variations to derive the model predicted relations and compare the theoretical expectations with our data fittings in Section 3. Finally, conclusions and discussions are presented in Section LABEL:sec5.
2 The spin-down offset following Crab glitches within the year 2017 and 2019
Currently, 30 glitches have been observed from the Crab pulsar between 1968 and 2024 (2022MNRAS.510.4049B). However, ever since the first discovery of persistent shift following Crab pulsar glitch in 1975 (1977AJ.....82..309G; 1981A&AS...44....1L), only ten persistent shifts have been measured, they are summarized in Lyne et al. (2014MNRAS.440.2755E; 2015MNRAS.446..857L). The reason for the relatively small number of persistent shift values is that, the glitches whose persistent shift can be measured should be isolated, namely, each having no other detectable glitches within 800 days before or 1200 days after the epoch of the glitch. Unfortunately, the post-glitch relaxation process is often contaminated by the occurrence of nearby glitches. Only five out of 30 are isolated or relatively isolated glitch events. The persistent shifts after these five glitches are notable and explicit, as shown in Figure 3 and Table 3 in 2015MNRAS.446..857L. As for the other five persistent shift values, they correspond to the cumulative effects of two or three neighboring glitches, the shift of the individual glitch is unknown. For example, the persistent shift value of corresponds to the cumulative effect of the two glitches on MJD 50260.031(4) and MJD 50458.94(3) (2015MNRAS.446..857L).
The 2017 November (MJD 58064.555) glitch is discovered to have the largest size in the Crab pulsar to date (2018MNRAS.478.3832S) and should display the largest persistent shift value according to the linear fitting to relation in 2015MNRAS.446..857L. However, measurement of its persistent shift is obscured by the occurrence of the following three much smaller glitches in about 600 days, namely, 2018 March (MJD 58237.357 (2020MNRAS.491.3182B)), 2018 November (MJD 58470.7, (2022MNRAS.510.4049B)) and 2019 July (MJD 58687.565, (2021MNRAS.505L...6S)) glitches. So we can only obtain the persistent shift value that corresponds to the cumulative effect of the above four glitches.
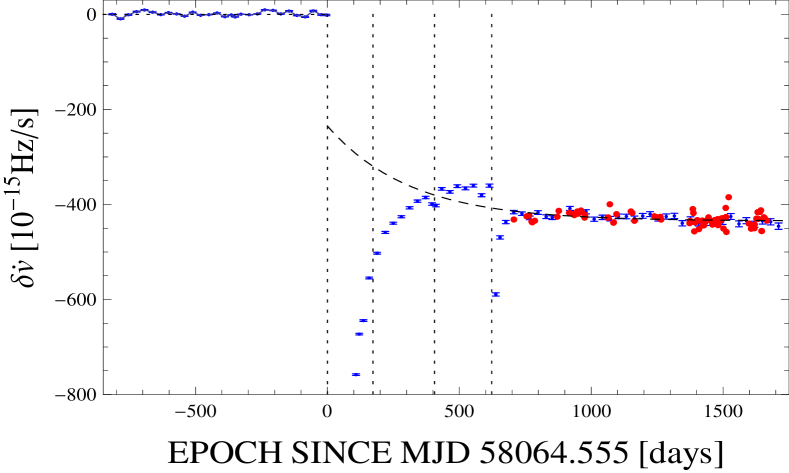
Our procedure is as follows. Firstly, we obtain the frequency derivative values of the Crab pulsar. The data are collected from the Jodrell Bank Crab pulsar monthly ephemeris 333https://www.jb.man.ac.uk/pulsar/crab.html (2022MNRAS.510.4049B). We have acquired the frequency derivative data ranging from MJD 57249 to MJD 59775, where the first point is over 800 days preceding the glitch on MJD 58064.555. Totally, 93 values of are included in this analysis, 29 ones preceding this glitch and 64 ones after the glitch. Secondly, variation in long-term rotation frequency with time is characterized as a Taylor series of frequency derivative of the form
| (1) |
where , , and represent the first, the second, and the third derivatives of rotation frequency respectively, is the residual in rotation frequency, is the reference time. We here prefer to focus on the characteristics of the frequency derivatives over time. So, likewise, the variation in long-term spin down rate with time can be expressed in the form
| (2) |
where denotes frequency derivative residual. In our case, the term including in Eq.(2) could be neglected, as is much too small and we are discussing the short-term spin down rate behavior around the glitch (several years after the glitch). Therefore, fitting the linear portion in Eq.(2) to the 29 before the glitch on MJD 58064.555 as a function of time with Eq.(2), the corresponding slope is and the spin down rate at the glitch epoch is , where . Thirdly, subtracting the straight line in Eq.(2) from the above 93 results in the derivative residuals,, shown as blue dots in Fig.1. Our Fig.1 is similar to Fig.3 in 2015MNRAS.446..857L and Fig.1 in 2017A&A...597L...9V in terms of processing methodology. Note that we have also determined a series of values from fits to 5-20-day data sets of Nanshan telescope using TEMPO2 (2006MNRAS.369..655H), we then derived the corresponding and plotted them as red points in Fig.1 for comparison. The Nanshan data span from MJD 58771.5 to MJD 59731.3. The trends of the blue and red dots are consistent.
After completing the procedures outlined above, we can finally measure the persistent shift value. On the one hand, as we can see from Fig.1, the recovery process of the glitch on MJD 58064.555 is interrupted by the three nearby glitches, so we can only measure the cumulative effect of the four glitches. On the other hand, as stated in paragraph 5 in Section 1 and the first paragraph of this section, this glitch is not isolated, so following this glitch can not be fully fitted by the exponential decaying function in Eq.(6) in 2015MNRAS.446..857L in principle. However, the persistent shift can be determined by calculating the limit, . This hence implies that the exponential decay would be fitted to the data points when the recovery time is long enough. In our case, fitting the data ranging from MJD 58832 to MJD 59775 with , we have and when is taken as proposed in 2015MNRAS.446..857L. Interestingly, the timescale determined by fitting the last points is almost consistent with the time scale derived from from those isolated events presented in 2015MNRAS.446..857L. Thus, the fitting function is compared with the preglitch value, shown in Fig.1, to obtain the largest persistent shift so far, . Although the result is contributed by all 4 glitches, the glitch occurred in November 2017 contributed the most since its glitch size amounts to of the cumulated glitch sizes of the 4 glitches, therefore, can be viewed as the upper limit of the persistent shift caused by the November 2017 glitch. We also noticed that, when comparing the three glitches following the November 2017 glitch with previous Crab pulsar glitches, the total glitch size of the three glitches is similar to that of the two successive glitches on MJD 50260.031 and 50458.94 (see our Table 1). If we regard the three glitches after November 2017 glitch and the two successive glitches on MJD 50260.031 and 50458.94 as equivalent in terms of persistent shift, by subtracting the cumulated persistent shift of the latter, we get the lower limit of persistent shift of the 2017 November glitch to be . We present all the 11 persistent shifts in Table 1 together with previously measured shifts.
| Glitch | MJD | Glitch Size | Persistent Shift |
|---|---|---|---|
| Date | Hz | () | |
| 1975 February | 42447.26(4) | 1.08(1) | |
| 1989 August | 47767.504(3) | 2.43(1) | |
| 1996 June | 50260.031(4) | 0.953(4) | |
| 1997 January | 50458.94(3) | 0.18(1) | |
| 1999 October | 51452.02(1) | 0.20(1) | |
| 2000 July | 51740.656(2) | 0.75(1) | |
| 2000 September | 51804.75(2) | 0.105(3) | |
| 2001 June | 52084.072(1) | 0.675(3) | |
| 2001 October | 52146.7580(3) | 0.265(1) | |
| 2002 August | 52498.257(2) | 0.101(2) | |
| 2002 September | 52587.20(1) | 0.050(3) | |
| 2004 March | 53067.0780(2) | 6.37(2) | |
| 2004 September | 53254.109(2) | 0.145(3) | |
| 2004 November | 53331.17(1) | 0.08(1) | |
| 2006 August | 53970.1900(3) | 0.65(1) | |
| 2011 November | 55875.5(1) | 1.18(2) | |
| 2017 March | 57839.8(1) | 0.067(2) | |
| 2017 November | 58064.555(3) | 15.491(3) | |
| 2018 March | 58237.357(5) | 0.121(7) | |
| 2018 November | 58470.7(2) | 0.070(8) | |
| 2019 July | 58687.565(4) | 0.938(4) |
Note. — The first 10 sets in this table is derived from (2014MNRAS.440.2755E; 2015MNRAS.446..857L). The glitch data during 2017-2019 are taken from (2018MNRAS.478.3832S; 2020MNRAS.491.3182B; 2021MNRAS.505L...6S; 2022MNRAS.510.4049B). Incorporates the persistent shift of the previous glitch. Incorporates the persistent shifts of the previous two glitches. Incorporates the persistent shifts of the previous three glitches.