Robust Flower Cluster Matching Using The Unscented Transform
Abstract
Monitoring flowers over time is essential for precision robotic pollination in agriculture. To accomplish this, a continuous spatial-temporal observation of plant growth can be done using stationary RGB-D cameras. However, image registration becomes a serious challenge due to changes in the visual appearance of the plant caused by the pollination process and occlusions from growth and camera angles. Plants flower in a manner that produces distinct clusters on branches. This paper presents a method for matching flower clusters using descriptors generated from RGB-D data and considers allowing for spatial uncertainty within the cluster. The proposed approach leverages the Unscented Transform to efficiently estimate plant descriptor uncertainty tolerances, enabling a robust image-registration process despite temporal changes. The Unscented Transform is used to handle the nonlinear transformations by propagating the uncertainty of flower positions to determine the variations in the descriptor domain. A Monte Carlo simulation is used to validate the Unscented Transform results, confirming our method’s effectiveness for flower cluster matching. Therefore, it can facilitate improved robotics pollination in dynamic environments.
I Introduction
Although global agriculture relies heavily on pollination, evidence has shown that the population of natural pollinators is decreasing, raising concerns about food and the economy [1]. In response to these concerns, advancements in automation in agriculture allow farmers to increase crop yields, reduce labor costs, and benefit from diversifying farming systems [2]. The development of these systems is often developed in more structured and controlled environments such as greenhouses [3]. Automation requires data collection and feedback to overcome challenges associated with agricultural tasks in precision robotics. Continuous monitoring of crops and the registration of multiple sensor data over time are necessary for computer vision to accurately track plant development and health. In precision operations such as [4, 5, 6], the detection of flower centers as targets is needed to assist in the agricultural task of pollination. Computer vision in robotics often uses stereo vision for these precision robotic agriculture tasks, which require the use of the robot arm to interact with the target [7].
There are challenges to flower detection, such as camera view obstruction and crop occlusions caused by crop manipulation [8]. Manipulation of branches for operations causes the branch to sway, resulting in movement of the targeted points. This is shown by simulating the physical properties of a branch of a tree for manipulation use [9]. This results in a visual change, making the registration of the flower cluster harder in addition to the already existing sensor noise. Spatial information can be simplified to a descriptor that is useful in defining the cluster.
In this paper, the challenges of flower cluster re-identification are addressed. Plant growth and interactions with robot manipulators introduce visual changes captured by vision sensors. Our approach simplifies flower clusters into a two-dimensional descriptor and employs the Unscented Transform to propagate descriptor uncertainty. To validate this method, Monte Carlo is applicable in the estimation of nonlinear statistical data [10, 11]. Although often used as a tolerance estimation for mechanical design, the theoretical method can also be applied to any statistical analysis. The formulation of Monte Carlo relies on the Law of Large Numbers, and convergence accuracy depends on the size of the random variables. For matching, the Mahalanobis distance is used alongside the chi-squared distribution to detect outliers [12].
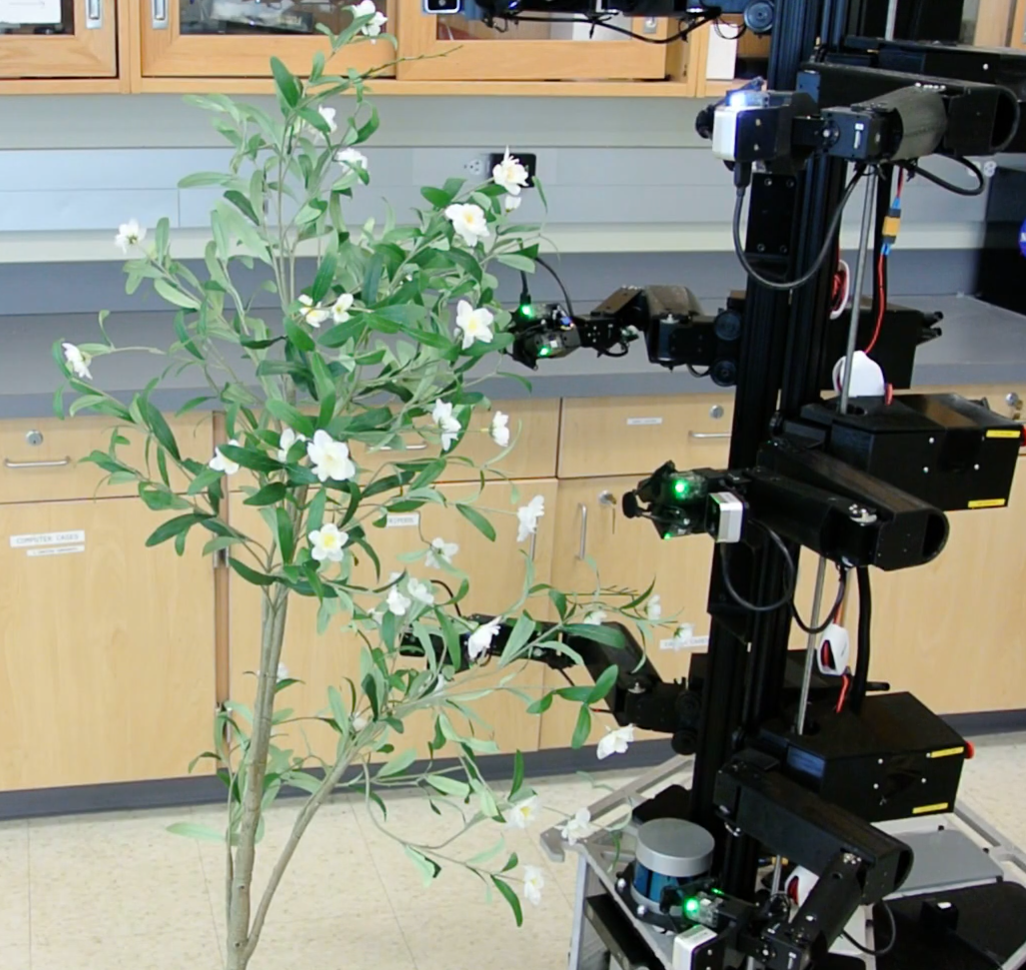
The main contribution of this research is a novel method for generating cluster descriptors and using the Unscented Transform for feasible real-time flower cluster matching, despite plant growth and structural changes, validated using a Monte Carlo simulations. It addresses descriptor nonlinearity and estimates flower locations, which can be applied in precision agriculture tasks like harvesting, pollination, and growth monitoring, and extends to landmark-based localization. An example of such applications is shown in Fig. 1.
II Related Works
In the field of precision agriculture, a multitude of work has investigated the monitoring of crop fields. These methods employ the use of aerial vehicles and ground vehicles. UAVs offer high-resolution imagery, enabling the extraction of visual data necessary to assess crop health through computer vision and artificial intelligence. The use of multi-rotor and fixed-wing UAVs facilitates faster and more cost-effective monitoring over large areas, providing higher spatial and temporal resolution compared to satellite imagery [13]. UGVs and mobile robots are often found in fields. Robotic systems are often tested for agricultural harvesting applications when equipped with RGB-D cameras and computer vision systems [14]. Technological advancements assist the developments of these methods in the field of computer science, which allow the detection and classification of objects.
The challenge of data association across multiple images has been in multiple studies. The applications of these techniques tend to address the global view of crops. While several computer vision methods like SIFT or ORB can be used to identify flower clusters, there are challenges due to similar features and appearances, occlusions, lighting, and variability due to growth. The works of [15] proposed a novel method that addresses registration issues under large visual changes by exploiting geometrical information. Geometric information is used to create a descriptor that is scale-invariant and uniquely describes the set of points. In other works [16], an optimized SIFT algorithm is used to stitch high-resolution farmland aerial images by feature points and filtering the mismatches. These methods allow faster and more reliable agricultural monitoring.
The work of [17] addresses the high-level language of the earlier literature [18, 19] and simplifies the literature to make the use of the Unscented Transform accessible. The Unscented Transform approximates a Gaussian distribution after a non-linear Transform. In the context of an Unscented Transform, there is a lot of existing literature on non-linear state estimation. Often, the Unscented Transform is used in the form of the Unscented Kalman Filter (UKF), which was developed to achieve better results compared to the Extended Kalman Filter (EKF) [20]. In a case study for attitude estimation, it was found that UKF was more robust in terms of bias and scale factors of the Inertial Measurement Unit (IMU) compared to the EKF [21].
III Methodology
III-A Objective Statement
The objective of this study is to develop a flower cluster descriptor that accounts for variations due to growth and manipulation. By leveraging the Unscented Transform, the proposed approach enhances the consistency of cluster re-identification. Additionally, an evaluation metric is established to determine the accuracy and reliability of the descriptors.
III-B Assumptions and Overview
This section describes the approach used to simulate flower clusters, design the Unscented Transform, and establish the evaluation metric. The simulation process models realistic possible states of the flower due to the growth and manipulation of its branches. The Unscented Transform is designed to handle the nonlinear transform of the cluster descriptors. Finally, an evaluation metric is established to determine the accuracy and robustness. The following assumptions were made regarding simulation, testing, and data collection:
-
•
The number of flowers in a cluster ranges from 3 to 6.
-
•
The plant has displacements due to growth and manipulation that are reasonable (i.e., displacements between 0.01 to 0.05 meters)
-
•
The flowers in the cluster remain detected after growth and manipulation
-
•
An artificial bramble plant with a single cluster with manual manipulation to simulate movement and growth is evaluated.
The development of the Monte Carlo simulation was necessary to validate the use of the Unscented Transform to propagate the nonlinearity of the descriptor. Monte Carlo Simulation produces descriptors of multiple random variations of an initial position to simulate the uncertainty of flower locations in the cluster. By sampling the sigma points, the Unscented Transform captures the nonlinear transform of the positions to descriptors accounting for the propagation of nonlinear descriptor function. The covariances of both Monte Carlo and Unscented Transform are then evaluated using Frobenius Norm. The effectiveness of the matching is determined by evaluating the Mahalanobis Distance to its chi-square distribution.
III-C Extracting Position And Calculating Descriptor
The setup includes a robotic manipulator equipped with an eye-in-hand configuration. The manipulator arm performs pollination by gently rubbing its end-effector against the flower. This process is repeated multiple times, during which positional information of the flower cluster is collected.
The sequence of images is captured as . Corresponding depth images are gathered, along with camera poses representing 3D transformation matrices.
The Grounding DINO [22] model for detecting the pixel coordinates of the flowers within the image frame , conditioned upon a text prompt .
| (1) |
where denotes the number of flowers detected in the given sequence frame . The camera intrinsic parameters and depth image lift the 2D pixel coordinates to 3D coordinates .
| (2) |
where, represent homogeneous form of , is depth values extracted at the pixel coordinates , and represents L2 norm. Note that is the depth along the ray (not along the z-axis of the camera coordinate frame), necessitating the normalization factor.
Finally, the 3D flower coordinates are transformed into the world coordinate frame. This is necessary to ensure a consistent flower position across the frames while the camera moves.
| (3) |
where represents 3D flower coordinates in the world coordinate frame.
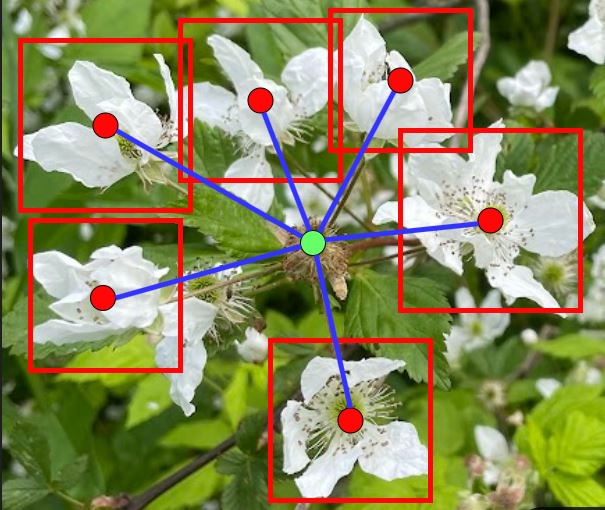
The flower coordinates in the cluster are then used to generate the descriptors as seen in Fig. 2. Descriptors are designed to be less sensitive to the changes in the growth of the plants and additional flowers. To achieve this, the descriptor is based on the spread of data relative to the centroid of the cluster. The first descriptor is inertia, and the second descriptor is the average distance of the flowers’ centers to the cluster’s centroid [23].
| (4) |
| (5) |
In these equations, is the number of flowers, is the index of the flower, denotes the positions of the bounding box centers of the detected flowers, and is the centroid of the cluster. By relating the descriptor to the centroid of the cluster, sensitivity is reduced.
III-D Monte Carlo Simulation
The purpose of a Monte Carlo is to help analyze how the noise on the positioning of each flower affects the computed descriptors of the flower positions. The simulation parameters are defined by the number of flowers in the cluster, the expected camera noise, and the displacement of flower center positions due to the detection process. In this case, the setup includes three flowers with an initial noise level of 0.01 meters, chosen to reflect real collected data. To ensure a robust analysis for Monte Carlo to be good, a larger amount of samples are needed, therefore, the number of the cluster that was to be simulated was 10,000 iterations. To better understand the impact of noise, the analysis was extended to cover a range of 0.01 to 0.05 meters, representing realistic displacement caused by plant movement, pollination, and natural growth.
A fixed seed is used to maintain reproducibility. Utilizing Matlab’s rand function, the initial 3D positions of points representing the flower center are generated about the world frame with uniform distribution. Gaussian noise is added to the generated initial positions by using Matlab’s randn function to simulate the uncertainty in the measurement of the positions. The perturbed positions are then processed through a descriptor function based on the centroid, converting them into a descriptor including the inertia and average distance of points to the centroid. The descriptors of the perturbed positions are then logged and evaluated. The covariance matrix and mean of the computed descriptors are calculated, providing insight into the effects of the perturbations of the descriptors.
III-E Unscented Transform
In the context of this work, the Unscented Transform is used to handle the non-linear transformations inherent in descriptor calculations. The UT propagates sigma points through a non-linear function, and the selection of sigma points is controlled by scaling parameters[18, 17, 24, 19]:
-
•
: Controls the spread of the sigma points, typically ranging from to 1. Smaller values result in a tighter distribution, while larger values produce a wider spread.
-
•
: Incorporates prior knowledge of the distribution. For a Gaussian prior, is optimal.
-
•
: Typically set to 0, as recommended in [18].
-
•
: A scaling parameter derived from and , which influences the sigma points’ placement.
-
•
and : Weights used to compute the transformed mean and covariance, respectively.
-
•
: The length of the state vector
| (6) |
| (7) |
| (8) |
| (9) |
The sigma point matrix is an matrix of sigma points, where each column represents a sigma point:
| (10) |
The Unscented Transformed initializes the positions of the 3D points as its prior mean, denoted as , and then the covariance, denoted as , the noise variance. The square root operation of is performed using the Cholesky decomposition. Sigma points are then generated and propagated through the nonlinear descriptor function. Then, the mean and the covariance of the propagated sigma points can be computed.
III-F Evaluation Methods and Determination of Matching
In this section, the various methods of evaluation used to validate the use of the Unscented Transform are presented. These methods include the use of Frobenius Norm, Mahalanobis distance, Chi-Square Distribution, and an additional condition padding for matching criteria.
Frobenius Norm is used as a metric to determine the differences between two matrices. In the context of using the Monte Carlo to validate the Unscented Transform, the Frobenius Norm is used as a method to evaluate the similarity of the two covariance matrices of the descriptor. This is done by taking the square root of the difference, denoted as between the two covariance matrices, resulting in a single numerical value representing the matrix difference in terms of a magnitude denoted by . The Frobenius norm of a Matrix A is defined as:
| (11) |
Where represents the elements of Matrix A, and and denote the number of rows and columns, respectively.
The Mahalanobis distance determines the correlation of a point to a distribution. The Unscented Transform measures the relative distances to the overall mean of the multivariate descriptors. The equation is defined with representing the Mahalanobis distance, as the descriptor vector, as the mean vector of the Unscented Transform, as the inverse of the covariance matrix, and as the transpose.
| (12) |
The Mahalanobis distance was selected to define a threshold for multidimensional variables by measuring their ”closeness” to the overall mean of the multivariate descriptors. It follows a chi-square distribution with degrees of freedom and is used to identify outliers based on a predefined threshold. This threshold, determined by the inverse chi-square function, assesses whether a descriptor point belongs to the multivariate normal distribution at a given confidence level , where represents the degrees of freedom.
| (13) |
If , then the point would be considered an outlier for the given confidence level.
Padding was evaluated to determine its impact on the number of matches. Adding padding on the covariances along the diagonal elements increases the uncertainty of the state estimation. This leads to more matches to accommodate for the higher variations in the data. However, on the contrary, it could lead to increased false detections.
Matching criteria were established to determine whether a flower cluster corresponds to a given descriptor. A cluster is considered a match if the Mahalanobis distance satisfies , ensuring that the descriptor is not classified as an outlier. To further enhance matching, an additional condition is imposed to verify that the number of flowers assigned to the descriptor, , matches the number of flowers in the cluster being evaluated. If both criteria are met, then the cluster being evaluated will be considered a match. The constraints are designed to help maintain the robustness of the matching process.
IV Experiments and Results
IV-A Experimental Setup and data collection
The testing workspace includes a Universal Robots UR5 Robot Arm Manipulator equipped with an Intel RealSense camera. Intel RealSense D405 RGB-D camera was used to collect Dataset 1, and D435 was used to collect Dataset 2. These cameras are mounted on the end effector. The PC has a 12-core CPU with 32GB Ram, and the pose estimation was completed on a server running an RTX 3070 Ti GPU and 64GB of Ram, both on Linux 22.04.
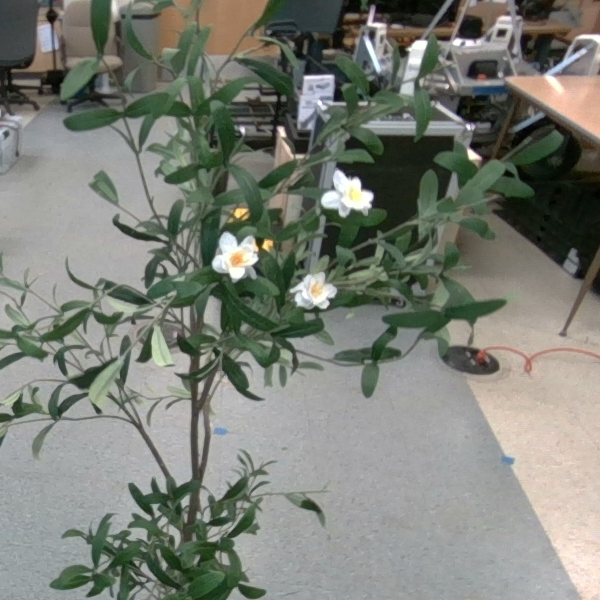
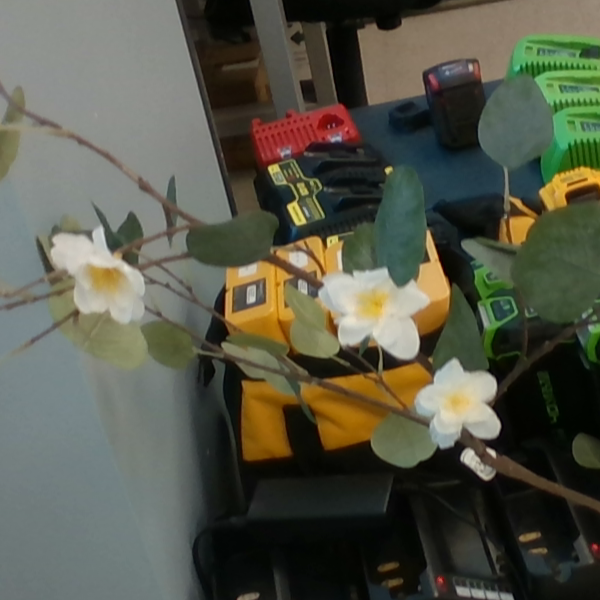
An artificial bramble plant was constructed with a single cluster of flowers attached to facilitate algorithm testing beyond the natural flowering season. A data set was collected for a flower cluster of three for about 400 frames. An additional one was collected with more frames. The two data sets differ, with one pollinating and the other with a static camera.
The simulation was performed on a PC with the AMD Ryzen 7 5800H, 8 cores, and 16GB Ram on Microsoft Windows 11 Pro OS. Matlab was used to process the simulation with the Statistics and Machine Learning Toolbox.
IV-B Evaluation Results
| Noise | Frobenius Norm | Percentage Outlier |
|---|---|---|
| 0.01 | 5.01 | |
| 0.02 | 4.93 | |
| 0.03 | 4.83 | |
| 0.04 | 4.75 | |
| 0.05 | 4.65 |
Table I presents the impact of increasing noise levels (0.01 to 0.05 meters) on the Unscented Transform when applied to a cluster of three flowers. A total of 10,000 trials were conducted, where initial positions were perturbed within this range. The chi-square threshold was set at 2.45 for a 95% confidence level with two degrees of freedom. These perturbations were incorporated into the Unscented Transform for covariance estimation.
The covariance of the simulated descriptors was compared to that of the Unscented Transform using the Frobenius norm, revealing strong similarity, with a slight increase in difference as perturbations grew stronger. The effect of these perturbations on the number of outliers was also analyzed. The chi-square threshold remained constant at a 95% confidence level for two dimensions. Results indicate that the Unscented Transform remains effective across the tested range, with higher noise levels causing a gradual decrease in outliers. It’s important to note that the number of outliers is directly related by the set confidence level as it determines the threshold .
| Padding (0.005) | Noise | Correct Match | False Positive (Avg) |
|---|---|---|---|
| w/o Padding | 0.01 | 8820 | 736.1542 |
| w/ Padding | 0.015 | 9420 | 797.0514 |
Table II presents the findings on the effect of padding on the covariance of the Unscented Transform. An initial noise level of 0.01 meters and a padding value of 0.005 meters were used. The objective of the analysis was to determine whether padding could improve the number of correct matches.
The simulation results indicate that padding is effective in increasing the number of correct matches. Specifically, adding 0.005 meters of padding to the covariance of the Unscented Transform led to an increase of 600 correct matches while also introducing an average of 60.9 more false matches per correct match. This improvement comes with a trade-off where the padding increases correct matching, it also increases the number of false matches.
IV-C Real Data Results
Two different flower cluster configurations were designed and attached onto the artificial bramble plant. A dataset of each flower cluster configurations were collected. Having two different cluster datasets allows the observation of the effectiveness of the Unscented Transform and its application in matching. The datasets are pruned before logging to ensure data quality. Specifically, only entries where the number of 3D positions matches the number of flowers are retained. Mismatches are discarded, and the data entry is removed. Fig. 3 presents the positions of the flowers in the respective Datasets. Dataset 1 Fig. 3(a) contained 5,076 images, while Dataset 2 Fig. 3(b) had 431 images. After applying the pruning criteria, the usable amounts were reduced to 4,954 images for Dataset 1 and 277 images for Dataset 2.
| Estimated Noise | Correct Match | Extra Matches (Avg) |
|---|---|---|
| 0.01 | 4950/4954 | 4949 |
To evaluate the effectiveness for matching of a flower cluster across different frames and translations, the results show matches at the corresponding index and subsequent indexes reported as many additional matches as there are frames. Table III suggests that the Unscented Transform effectively sets the tolerances for matching. This is supported by the fact that clusters of the 4954 frames correctly matched 4950 of the frames. Additionally, each frame the clusters matched every other 4949 frames as well. Only 4 of the frames failed to match at the index, and additional matches indicate minimal error. The results validate the use of the Unscented Transform as a reliable method of establishing a matching tolerance for consistent cluster re-identification.
| Estimated Noise | Matches | Extra Matches (Avg) |
| 0.01 | 13/277 | 12.9531 |
To assess the uniqueness of the descriptors for matching within the generated tolerances, two different cluster datasets were used. Dataset 1 served as the reference flower cluster for matching, while Dataset 2 contained the flower cluster observed by the robot. Table IV presents the results of applying the Unscented Transform tolerances from Dataset 1 to Dataset 2. Only 13 out of 277 frames in Dataset 2 matched the tolerance criteria established by the Unscented Transform for the descriptors of the cluster in Dataset 1. Additionally, for each of these 13 matched frames, the same descriptor also matched 276 other frames within Dataset 2. This suggests that, within Dataset 2, the descriptor tolerances are not significantly unique enough to differentiate the matched clusters from the remaining frames, indicating a high similarity among the flower clusters in Dataset 2 when compared to itself.
V Conclusion and Future Works
V-A Conclusion
In this paper, the novel approach of using the Unscented Transform for cluster descriptor matching tolerance estimation is presented as a reliable method in re-identifying flower clusters with growth and movement. The method presented utilizes a descriptor that describes the points relative to the cluster’s centroid. Utilizing the Unscented Transform to handle the nonlinear transformations of the descriptor, a tolerance can be determined for cluster re-identification. The experiments show that the computed covariance and mean are close to that of a Monte Carlo simulation. Additionally, the test with real datasets allowed the successful re-identification of the cluster with minimal errors. This suggests that the approach is robust and reliable under different conditions involved with the precision agricultural processes and the plant’s natural growth. This work plays an important role in precision agriculture applications in reducing redundant processes and requiring continuous plant monitoring.
V-B Future Works
Further research is needed to enhance the accuracy of plant monitoring and re-identification. The challenge of plant re-identification arises from the similarities in shape and color, as well as temporal changes and occlusions. Improving cluster identification is crucial to account for plant growth. This can be achieved by treating flowers on the same branch as part of a single cluster using skeleton models of the tree or applying the K-means algorithm to increase clustering consistency. Although YOLO (You Only Look Once) models were not utilized due to poorly trained weights, they offer a viable alternative to Grounding DINO for real-time applications with lower computational demands. Additionally, descriptors can be refined to incorporate more distinctive values for cluster representation, which may help reduce false positives in matching. However, this approach could also increase sensitivity to noise, potentially preventing matches even when the same cluster is present. Improving these methods will contribute to improved accuracy in plant monitoring and precision agriculture, supporting automation efforts in the field.
ACKNOWLEDGMENT
The authors acknowledge Uthman Olawoye for his guidance on the Unscented Transform and the Interactive Robotics Lab for providing the artificial plant. Additionally, the authors acknowledge the use of ChatGPT solely for grammar revisions.
References
- [1] S. G. Potts, H. T. Ngo, J. C. Biesmeijer, T. D. Breeze, L. V. Dicks, L. A. Garibaldi, R. Hill, J. Settele, and A. Vanbergen, “The assessment report of the intergovernmental science-policy platform on biodiversity and ecosystem services on pollinators, pollination and food production,” 2016.
- [2] J. Lowenberg-DeBoer, I. Y. Huang, V. Grigoriadis, and S. Blackmore, “Economics of robots and automation in field crop production,” Precision Agriculture, vol. 21, no. 2, pp. 278–299, 2020.
- [3] Y. Edan, S. Han, and N. Kondo, “Automation in agriculture,” Springer handbook of automation, pp. 1095–1128, 2009.
- [4] N. Ohi, K. Lassak, R. Watson, J. Strader, Y. Du, C. Yang, G. Hedrick, J. Nguyen, S. Harper, D. Reynolds, et al., “Design of an autonomous precision pollination robot,” in 2018 IEEE/RSJ international conference on intelligent robots and systems (IROS), pp. 7711–7718, IEEE, 2018.
- [5] T. Smith, M. Rijal, C. Tatsch, R. M. Butts, J. Beard, R. T. Cook, A. Chu, J. Gross, and Y. Gu, “Design of stickbug: a six-armed precision pollination robot,” arXiv preprint arXiv:2404.03489, 2024.
- [6] L. Droukas, Z. Doulgeri, N. L. Tsakiridis, D. Triantafyllou, I. Kleitsiotis, I. Mariolis, D. Giakoumis, D. Tzovaras, D. Kateris, and D. Bochtis, “A survey of robotic harvesting systems and enabling technologies,” Journal of Intelligent & Robotic Systems, vol. 107, no. 2, p. 21, 2023.
- [7] M.-S. Wang et al., “3d object pose estimation using stereo vision for object manipulation system,” in 2017 International Conference on Applied System Innovation (ICASI), pp. 1532–1535, IEEE, 2017.
- [8] H. Chandel and S. Vatta, “Occlusion detection and handling: a review,” International Journal of Computer Applications, vol. 120, no. 10, 2015.
- [9] J. Jacob, T. Bandyopadhyay, J. Williams, P. Borges, and F. Ramos, “Learning to simulate tree-branch dynamics for manipulation,” IEEE Robotics and Automation Letters, 2024.
- [10] F. James, “Monte carlo theory and practice,” Reports on progress in Physics, vol. 43, no. 9, p. 1145, 1980.
- [11] N. Metropolis and S. Ulam, “The monte carlo method,” Journal of the American statistical association, vol. 44, no. 247, pp. 335–341, 1949.
- [12] Y. Gu, J. N. Gross, M. B. Rhudy, and K. Lassak, “A fault-tolerant multiple sensor fusion approach applied to uav attitude estimation,” International Journal of Aerospace Engineering, vol. 2016, no. 1, p. 6217428, 2016.
- [13] J. Cuaran and J. Leon, “Crop monitoring using unmanned aerial vehicles: A review,” Agricultural Reviews, vol. 42, no. 2, pp. 121–132, 2021.
- [14] L. F. Oliveira, M. F. Silva, and A. P. Moreira, “Agricultural robotics: A state of the art survey,” in 23rd international conference series on climbing and walking robots and the support technologies for mobile MachinesAt: Moscow, Russian federation, pp. 279–286, 2020.
- [15] N. Chebrolu, T. Läbe, and C. Stachniss, “Robust long-term registration of uav images of crop fields for precision agriculture,” IEEE Robotics and Automation Letters, vol. 3, no. 4, pp. 3097–3104, 2018.
- [16] Y. Liu, M. He, Y. Wang, Y. Sun, and X. Gao, “Farmland aerial images fast-stitching method and application based on improved sift algorithm,” IEEE Access, vol. 10, pp. 95411–95424, 2022.
- [17] M. Rhudy and Y. Gu, “Understanding nonlinear kalman filters, part ii: an implementation guide,” Interactive Robotics Letters, vol. 1, no. 1, pp. 1–18, 2013.
- [18] S. J. Julier and J. K. Uhlmann, “New extension of the kalman filter to nonlinear systems,” in Signal processing, sensor fusion, and target recognition VI, vol. 3068, pp. 182–193, Spie, 1997.
- [19] R. Van Der Merwe, E. A. Wan, S. Julier, et al., “Sigma-point kalman filters for nonlinear estimation and sensor-fusion: Applications to integrated navigation,” in Proceedings of the AIAA guidance, navigation & control conference, vol. 3, p. 08, Providence, RI Providence, RI, 2004.
- [20] E. A. Wan and R. Van Der Merwe, “The unscented kalman filter for nonlinear estimation,” in Proceedings of the IEEE 2000 adaptive systems for signal processing, communications, and control symposium (Cat. No. 00EX373), pp. 153–158, Ieee, 2000.
- [21] M. Rhudy, Y. Gu, J. Gross, S. Gururajan, and M. R. Napolitano, “Sensitivity analysis of extended and unscented kalman filters for attitude estimation,” Journal of Aerospace Information Systems, vol. 10, no. 3, pp. 131–143, 2013.
- [22] S. Liu, Z. Zeng, T. Ren, F. Li, H. Zhang, J. Yang, Q. Jiang, C. Li, J. Yang, H. Su, et al., “Grounding dino: Marrying dino with grounded pre-training for open-set object detection,” in European Conference on Computer Vision, pp. 38–55, Springer, 2025.
- [23] A. W. Edwards and L. L. Cavalli-Sforza, “A method for cluster analysis,” Biometrics, pp. 362–375, 1965.
- [24] E. A. Wan and R. Van Der Merwe, “The unscented kalman filter,” Kalman filtering and neural networks, pp. 221–280, 2001.