Every Nearby Energetic Pulsar Is Surrounded by a Region of Inhibited Diffusion
Abstract
The H.E.S.S. telescope has recently detected the total electron-plus-positron () flux up to 40 TeV, finding it to be a featureless and steeply-falling power-law above 1 TeV. This result is in stark tension with standard one-zone models of pulsar injection and diffusion, which predict a hard-spectrum signal above 10 TeV. We model the local pulsar population, and find 20 sources that would each individually overproduce the H.E.S.S. flux in a one-zone diffusion model. We conclude that every energetic pulsar younger than 500 kyr must be surrounded by a region of inhibited diffusion (e.g., a supernova remnant, pulsar wind nebula, or TeV halo) that prevents the transport of these to Earth. Because the high-electron density in these regions produces bright synchrotron and inverse-Compton emission, we conclude that all nearby pulsars are detectable as (potentially unassociated) radio, x-ray or -ray sources.
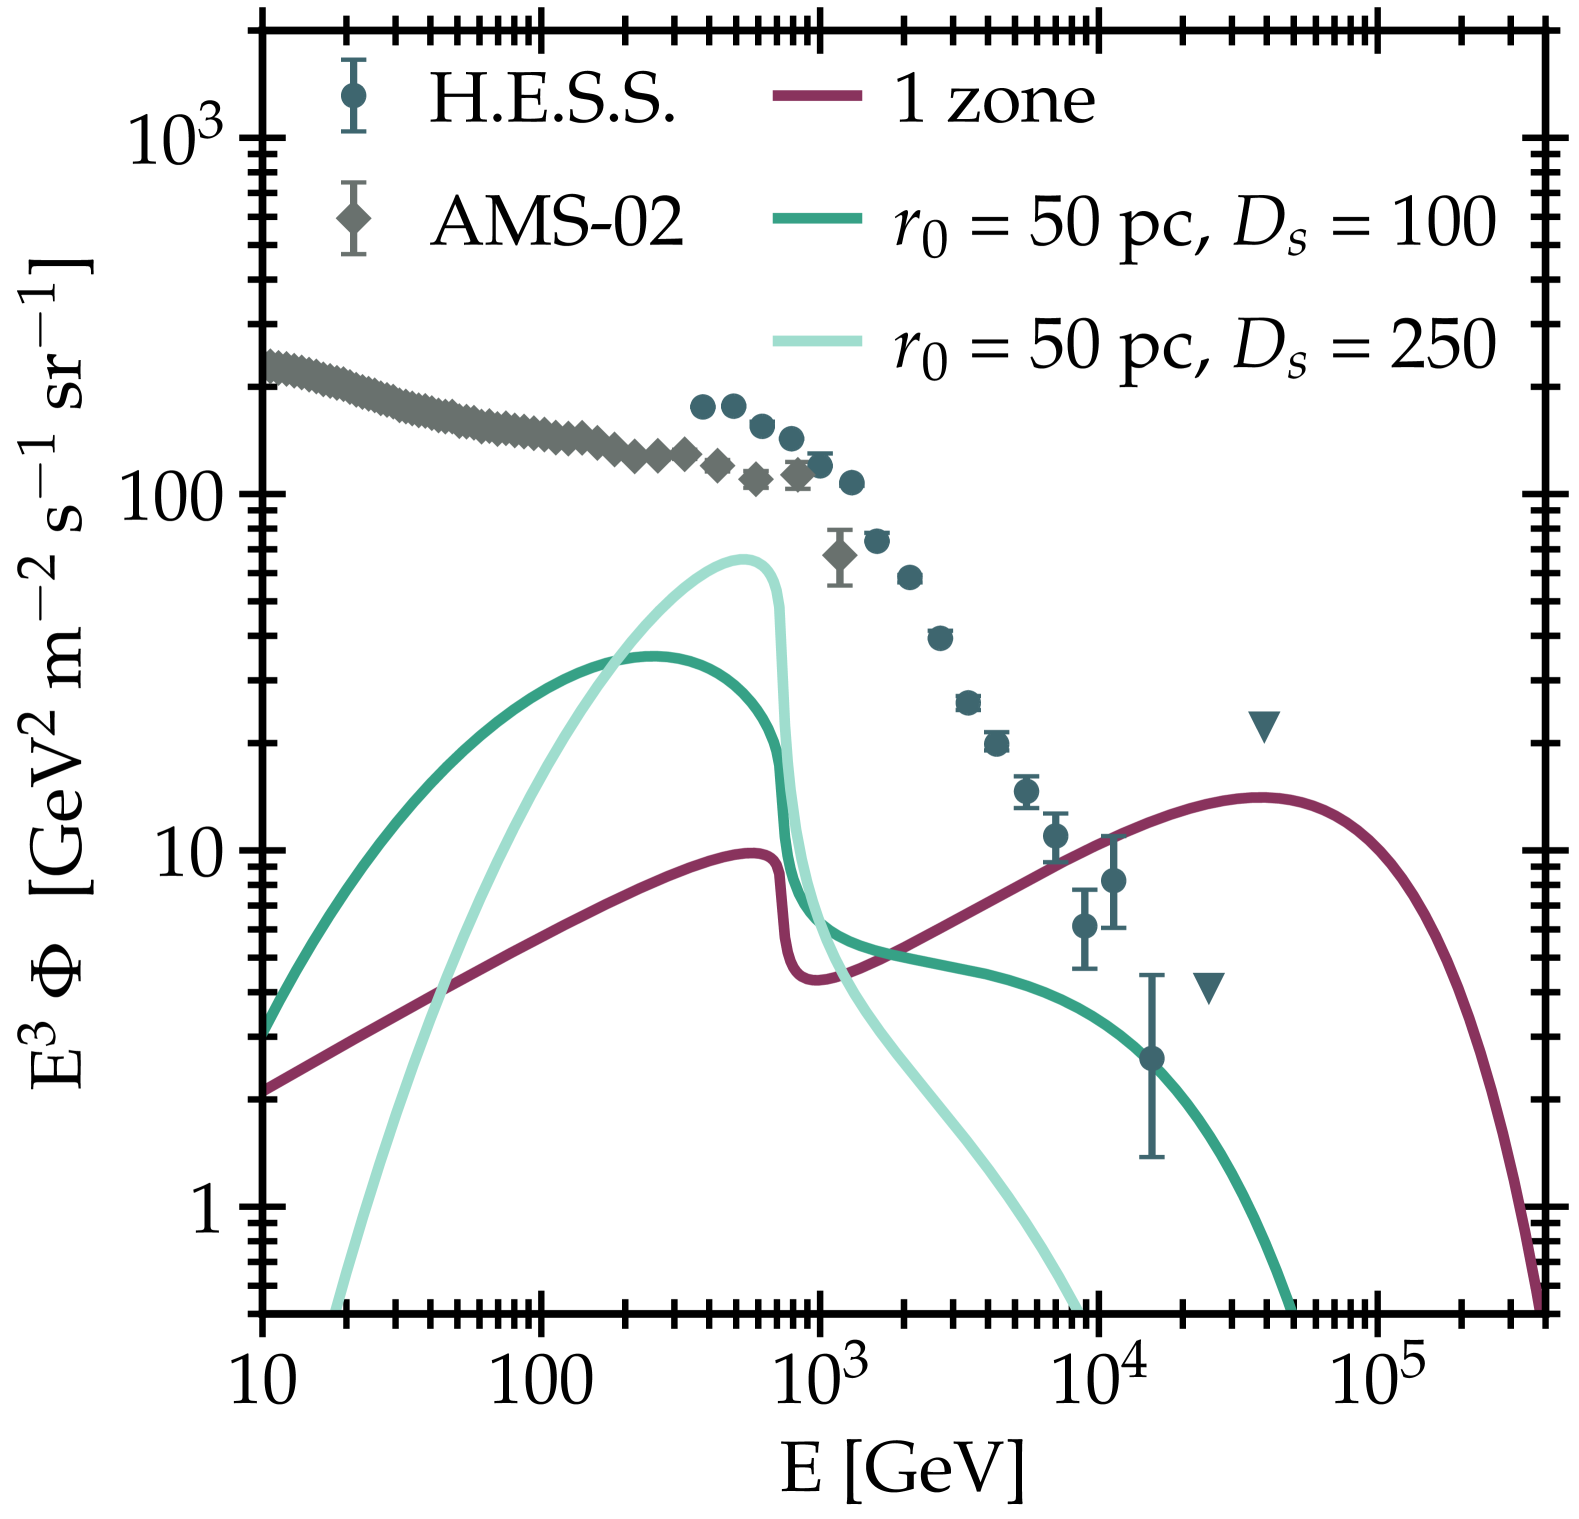
Observations by the High-Energy Stereoscopic System (H.E.S.S.) have recently extended our detection of the combined electron-plus-positron (hereafter, ) flux up to an energy of 40 TeV. The flux has a sharp break at an energy of 1 TeV, above which the emission is characterized by a smooth and rapidly falling power-law, with [1].
This observation strongly constrains the production and propagation of pairs from pulsars, which have long been considered to provide the dominant contribution to the local positron flux measured by PAMELA [2] and AMS-02 [3, 4] between 10–300 GeV [5, 6, 7, 8, 9, 10, 11, 12]. As shown in Figure 1, the spectrum from nearby pulsars in a standard one-zone model has two components. The first is the steep rise at low energies that corresponds to electrons with cooling timescales () longer than the pulsar age (. This component has a cutoff produced by the cooling of very high-energy electrons to a critical energy where = . The second, high-energy, component stems from recently produced that propagate to Earth before cooling. The relative energy-flux of each feature depends on the pulsar age, spindown time, injection spectrum, and distance, but are roughly similar.
By normalizing the GeV flux from pulsars to AMS-02 data, we can predict the H.E.S.S. TeV flux. The soft spectrum of the H.E.S.S. data then strongly constrains some convolution of the TeV injection rate from pulsars or the propagation of these pairs to Earth. Such a constraint has previously been applied to argue that propagation must be inhibited near bright pulsars such as Vela and Geminga [13, 14, 15, 16, 17, 18, 19, 20].
In this letter we significantly extend this result to prove that diffusion must be inhibited around every pulsar (seen or unseen) that is either powerful enough, or close enough, to contribute to the high-energy flux at Earth. Moreover, our analysis can be applied to any ensemble of pulsars that combine to contribute to the rising AMS-02 positron flux, regardless of their individual contributions. The argument proceeds as follows:
- (1)
-
(2)
Young pulsars produce most of their while rapidly spinning down soon after they are born [6]. However, the observation of bright TeV halos around Geminga and Monogem with -rays exceeding 50 TeV [26] establishes two key facts: (1) there is no a sharp cutoff in the pulsar injection at a few TeV, as up to 100 TeV are needed to produce the -ray spectra, and (2) this acceleration must continue to late times, as these pairs cool in 10 kyr. Recent HAWC, LHAASO, and H.E.S.S. measurements of TeV halos confirm that this phenomenon is generic, and not isolated to Geminga and Monogem [27, 28, 29, 30].
-
(3)
In one-zone diffusion models, from sources within (1 kpc) of Earth can efficiently reach Earth before cooling, producing a bright 10 TeV flux with a total power that is a few percent the peak pulsar power near the cutoff produced by cooling [19]. For many nearby pulsars, this flux will overproduce the H.E.S.S. data.
-
(4)
One method for decreasing the flux at Earth would be to produce a bubble of locally inhibited diffusion surrounding the solar position [22]. However, this provides a poor fit to the data for several reasons: (1) strongly inhibited diffusion near the Sun will prevent all from reaching the Earth, at odds with H.E.S.S. data [31], (2) a change in local diffusion will produce a common spectral cutoff that equally applies to all sources, producing a common spectral bump and fall-off (see Fig. 1) that does not fit the smooth power-law observed by H.E.S.S., (3) there are no known sources that could produce locally inhibited diffusion, while TeV halo observations indicate that many pulsars inhibit diffusion locally, (4) if locally inhibited regions of diffusion were common far from sources, it would significantly affect GeV secondary-to-primary ratios, significantly altering fits to AMS-02 data [9].
Based on these lines of evidence, there is only one remaining solution. Every pulsar that produces high-energy pairs must also produce a significant region of low-diffusion, which prevents these pairs from leaking into the interstellar medium (ISM) unperturbed. The origin of the inhibited diffusion is unclear, as both supernova remnants (SNR) and pulsar wind nebulae (PWNe) have long been assumed to inhibit diffusion in regions surrounding very young (50 kyr) pulsars [32, 33, 34]. However, by comparing current H.E.S.S. constraints against the ATNF pulsar catalog [35, 36], we can confirm that these inhibited diffusion regions continue to at least 500 kyr, meaning that inhibited diffusion (most likely due to TeV halos) remains ubiquitous among middle-aged pulsars. Notably, these results are supported by -ray observations of middle-aged pulsars, which often show evidence of inhibited diffusion by factors of 100–1000 on scales of 25–50 pc [26].
The ubiquity of inhibited diffusion around pulsars allows us to make a second strong claim — all sufficiently nearby and energetic pulsars (very roughly within 0.5 kpc for a 300 kyr pulsar) have either already been detected — or should very soon be detected as extended sources. The inhibition of diffusion means that any sufficiently nearby and young pulsar will produce bright TeV -ray emission independent of its beam orientation. The only caveats to this analysis are: (1) extremely dim pulsars whose TeV falls outside the normal pulsar population, (2) pulsars in regions of the sky that have not currently been covered by TeV instruments (primarily in the southern hemisphere), and (3) bright radio/TeV sources that are known, but not currently associated with pulsar activity.
Diffusion Models.— We calculate the flux from each individual pulsar using both one-zone and two-zone analytic diffusion models [5, 9, 37, 19]. Given a distance from the pulsar to Earth and a pulsar age , the flux is given by:
| (1) |
where is the source term of injected normalized to the current spindown power of the pulsar, is a term describing diffusion, () are the current (initial) energy of an that was injected time ago, which are related through . The factor denotes the energy losses of during propagation, given by:
| (2) |
where accounts for the magnetic field and interstellar radiation field that control the rate of synchrotron radiation and inverse-Compton scattering (see e.g. [9, 38]), respectively. We follow the analytic method in Ref. [38] with the ISRF model from Ref. [39]. We note that this analytic model neglects the stochastic nature of energy losses and approximates them as a continuous process; when the spectral shape of the pulsar is important (e.g. in searches for spectral features from pulsars in the data), this analytic model is insufficient, see Ref. [38]. However, this has negligible effects on our analysis, which gets its maximum constraining power well-above the spectral feature produced by cooling.
The source term, , is given by
| (3) |
where is the pulsar’s efficiency of converting its spindown luminosity into pairs, with:
| (4) |
where is the initial pulsar luminosity, the spindown time scale, and is the braking index for a dipole.
The injection spectrum is:
| (5) |
where is the spectral index and is the cutoff energy for the accelerated by the pulsar. The integral over time in Eq. 1 accounts for the continuous injection of pairs by the pulsar.
| (6) |
where the diffusion distance scale, , is given by:
| (7) | ||||
and we set the diffusion coefficient to be equal to an energy scaling of the diffusion constant , through:
| (8) |
In the two-zone diffusion model, diffusion is inhibited in a region around the pulsar, such that the diffusion constant in the inner zone is suppressed with respect to the standard interstellar diffusion constant , i.e., , and becomes [37, 19]
| (9) |
where the factor in the integrand for the one-zone diffusion model is
| (10) |
and has the analytic solution given in Eq. 6. In the two-zone diffusion model, where , this becomes
| (11) | ||||
The factors and are defined as
| (12) | ||||
and
| (13) |
where and . Note that for one-zone diffusion, , and . The diffusion distance in each zone is expressed in terms of , which is related to , i.e. the suppressed diffusion constant, in Eq. 7.
For standard diffusion in the interstellar medium, we choose cm2/s at an energy of 1 GeV with a diffusion index of [40, 41]. For two-zone diffusion, we set the size of the inner diffusion zone to pc and test a suppression factor . We consider two cases, where and 250, while . Note that the size of the diffusion zone and the suppression factor are degenerate (when energy losses are neglected) via:
| (14) |
where is the average distance an travels in a time given a diffusion coefficient (see Eq. 8) when energy losses are negligible. The time that the spend around the pulsar determines how much the high-energy portion of the flux is suppressed.
Pulsar Model.— We use the ATNF pulsar catalogue (version 2.6.0) that includes all known pulsars [35, 36], and select every pulsar with age and distance estimates indicating it is closer than 1.5 kpc and younger than 1 Myr. For our simulations, we use a generic pulsar model that we employ throughout our analysis. While in reality, each pulsar is expected to have different parameters that govern injection and diffusion (such as initial spindown luminosity, braking index, injection spectrum), our results are consistent across a wide-variety of ATNF pulsars, and thus changes in single systems do not significantly affect our results. We loosely base our generic pulsar model on Geminga [9], which stands as the best-measured middle-aged pulsar. For the pulsar injection spectrum, we use Eq. 5 with and TeV. In Eq. 4, we set the initial spindown luminosity to erg/s [21] and use a spindown timescale of kyr [22], with a default efficiency of . We evaluate the contribution from our model pulsar system on a grid of ages that spans 5 kyr–1 Myr with a step size of 5 kyr and distances that span 100–1500 pc with a step size of 50 pc. We compare these gridded results to our population of ATNF systems.
Results and Discussion.— In Fig. 1, we compare the H.E.S.S. flux (dark blue) [1] with the spectrum of our generic pulsar model at an age of 500 kyr and distance of 150 pc. The standard one-zone model (violet) has a high-energy flux that significantly exceeds the H.E.S.S. data. In comparison, the dark (light) green spectrum represents a two-zone diffusion model where diffusion is suppressed by a factor of 100 (250) in a 50 pc region around the pulsar. These models produce TeV fluxes consistent with the data.
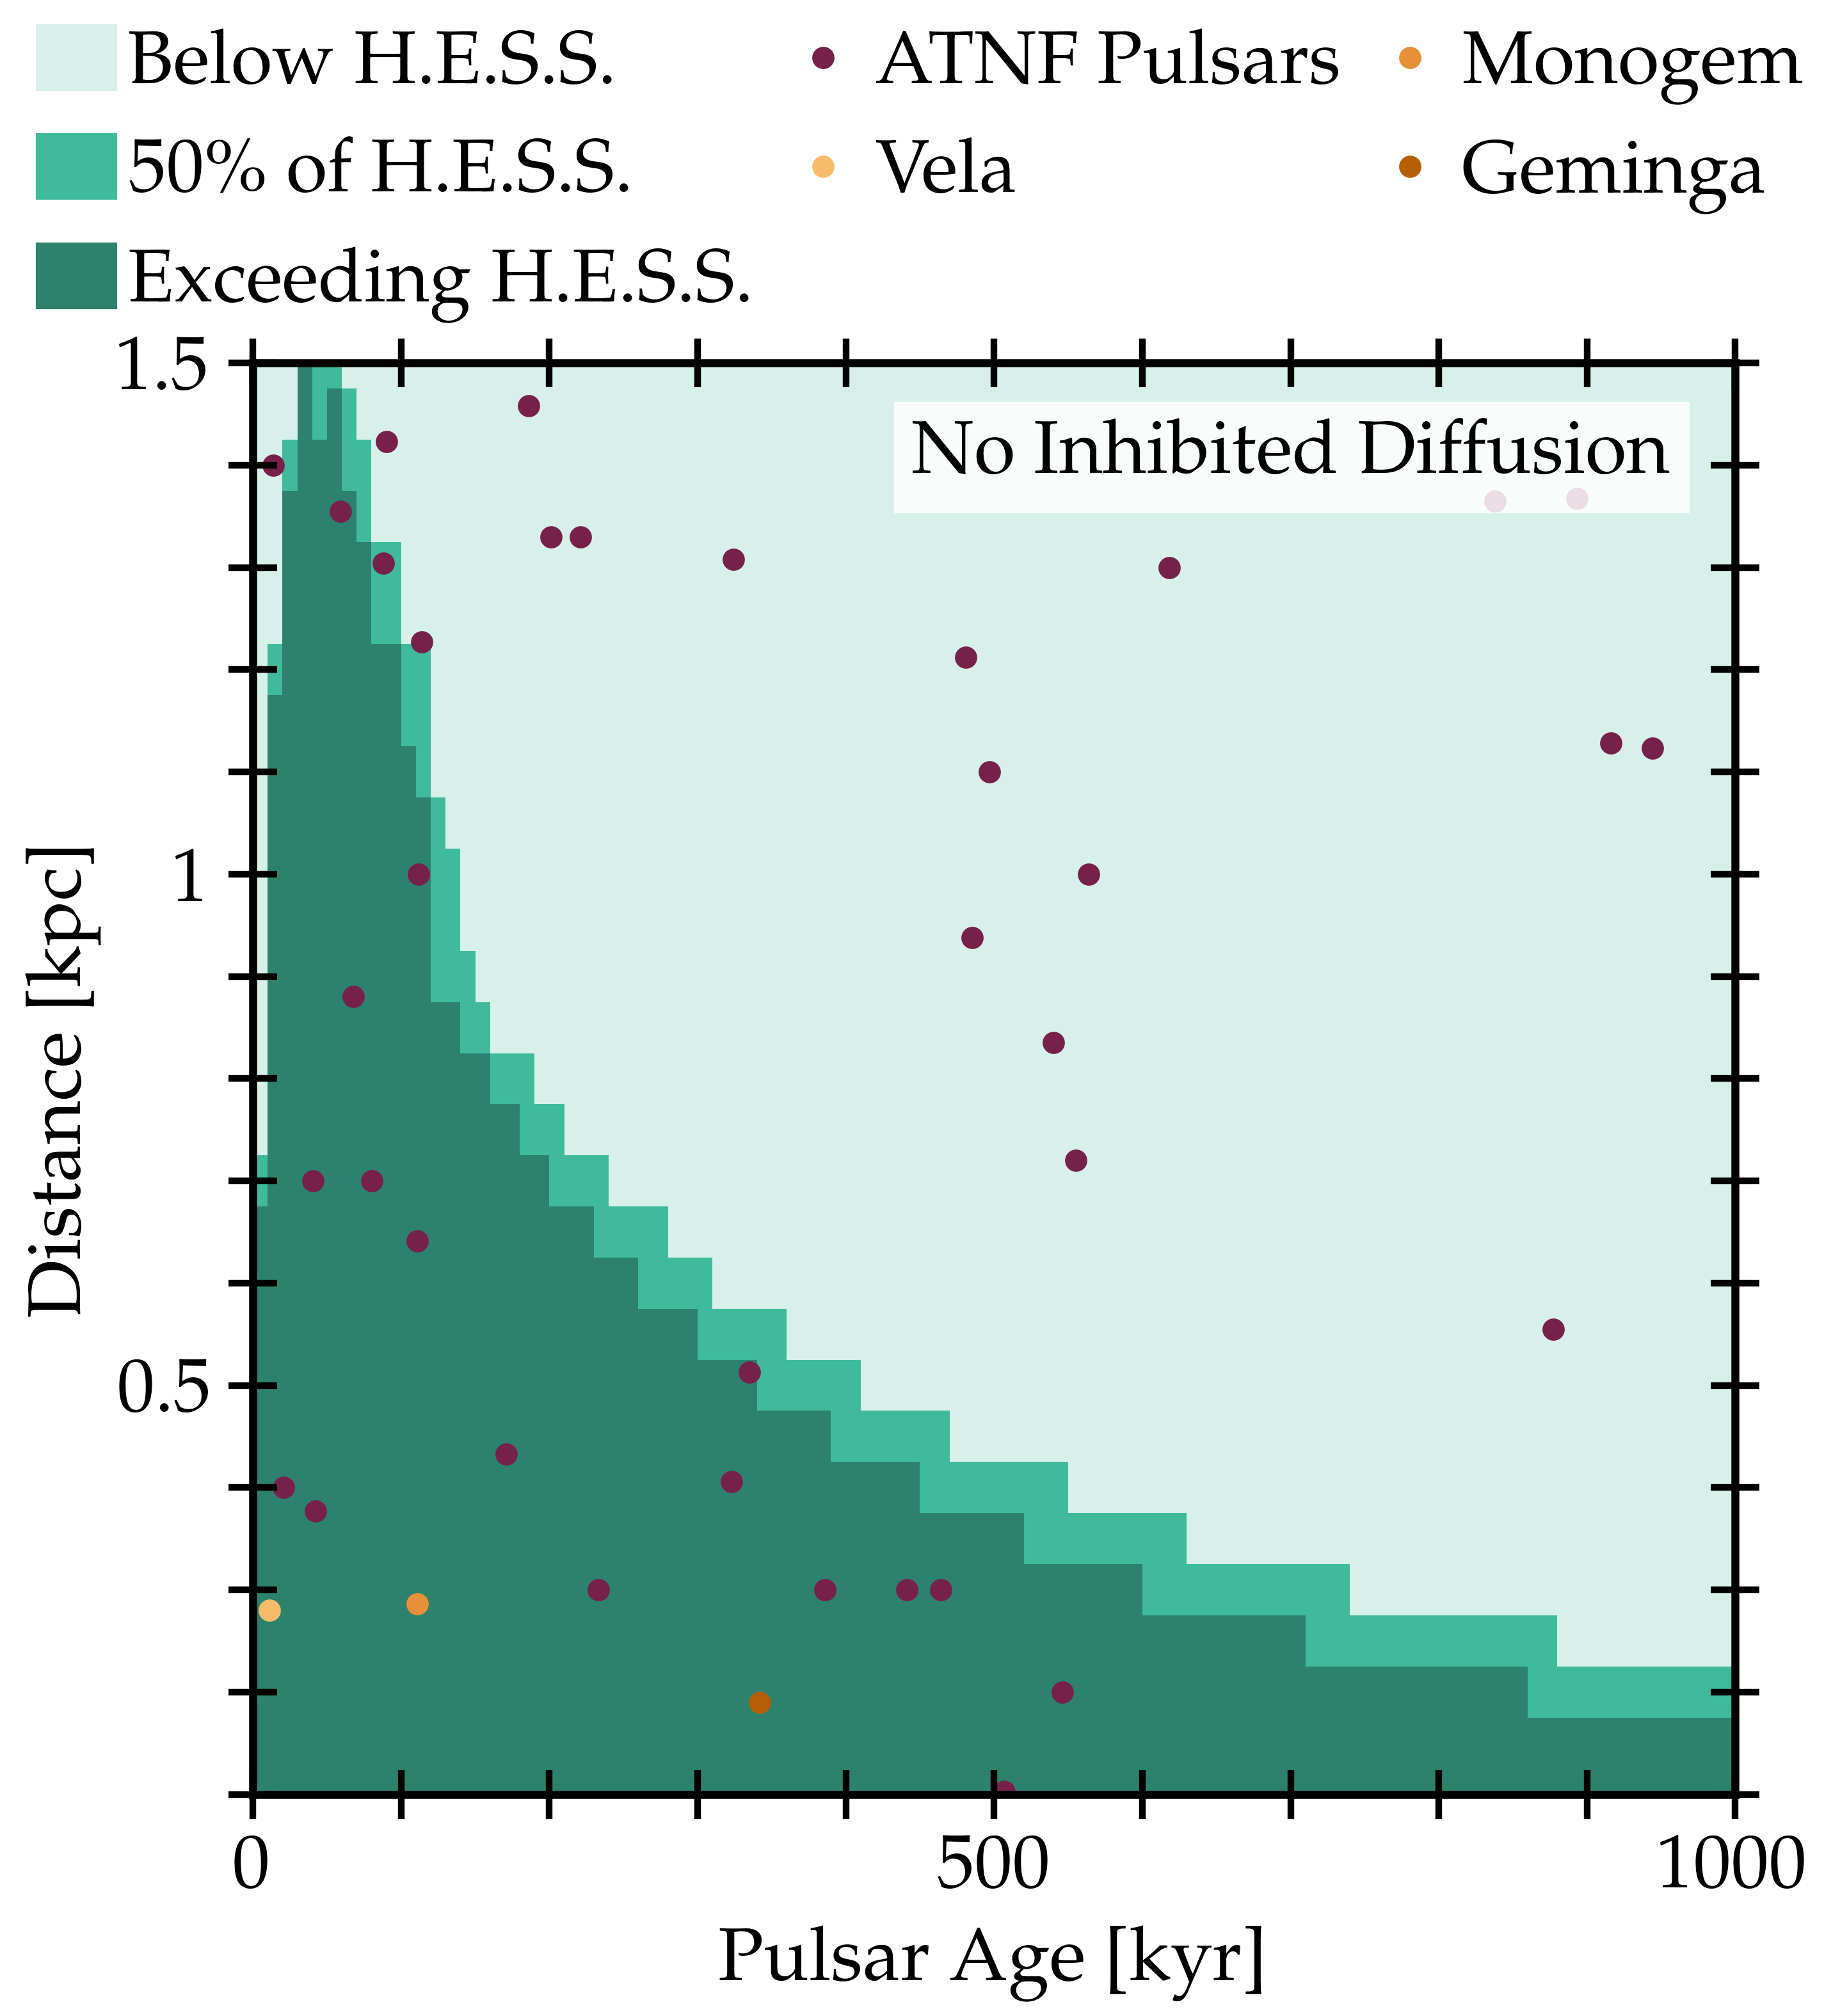
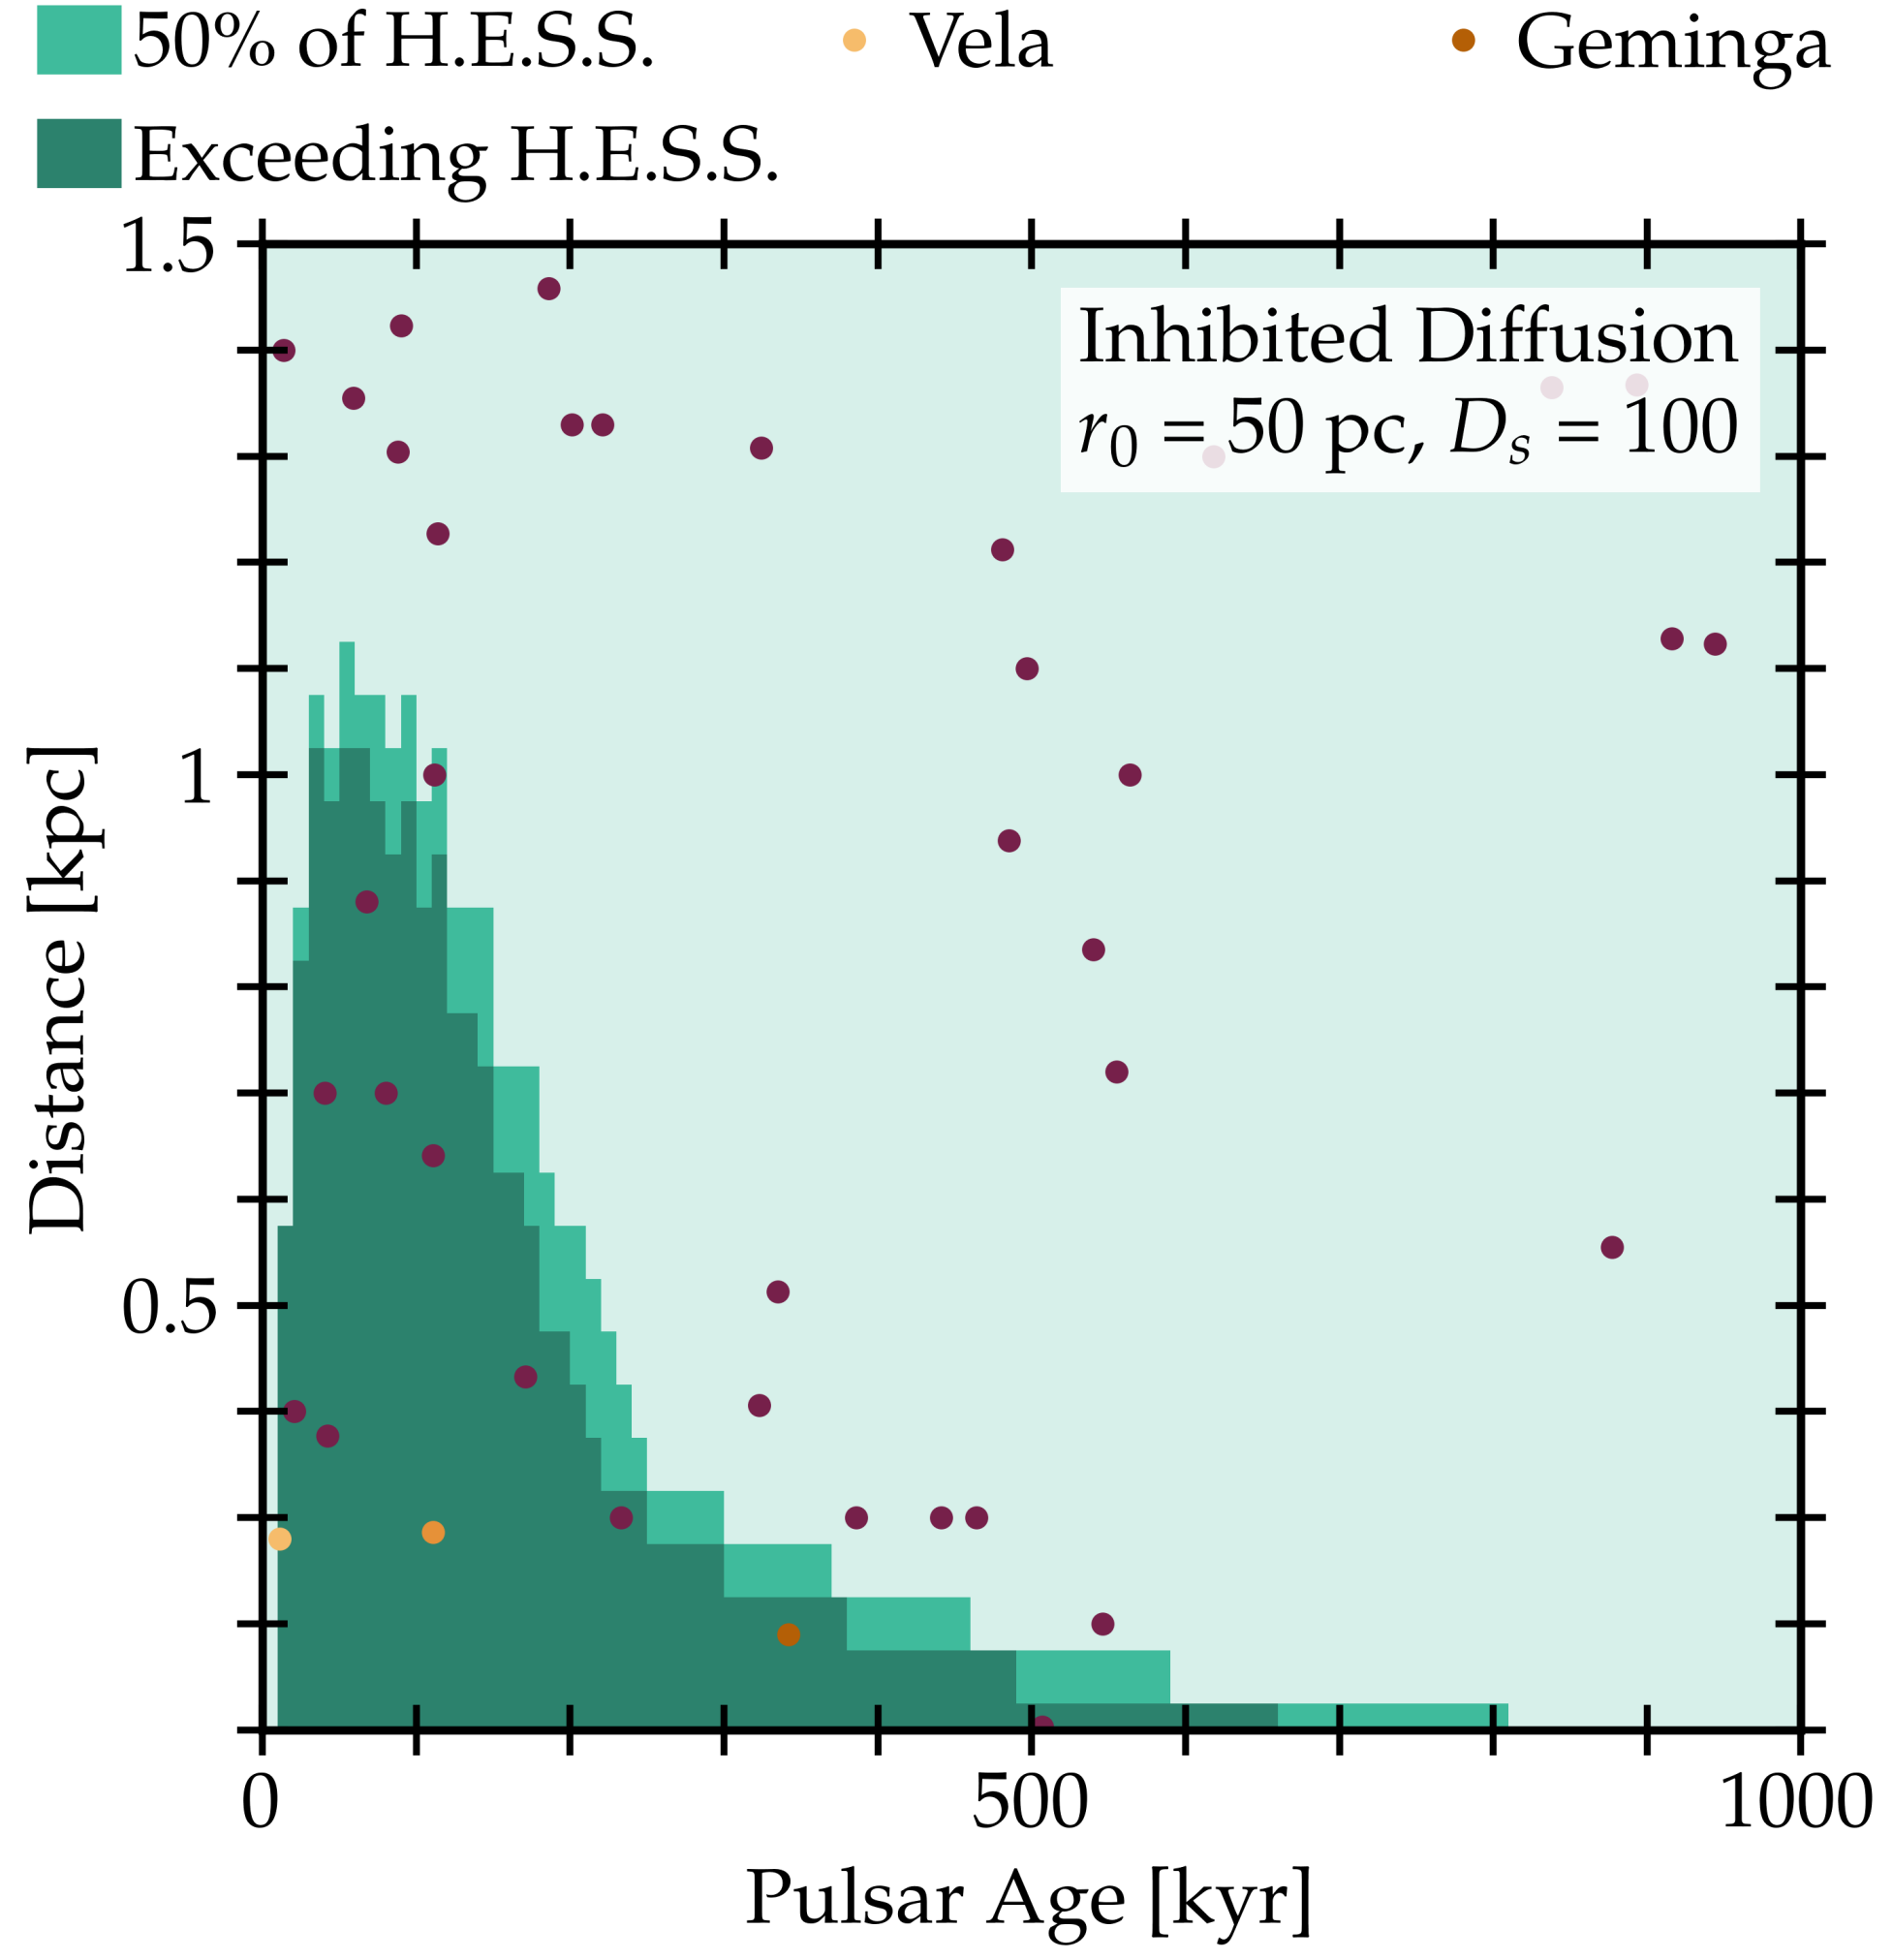
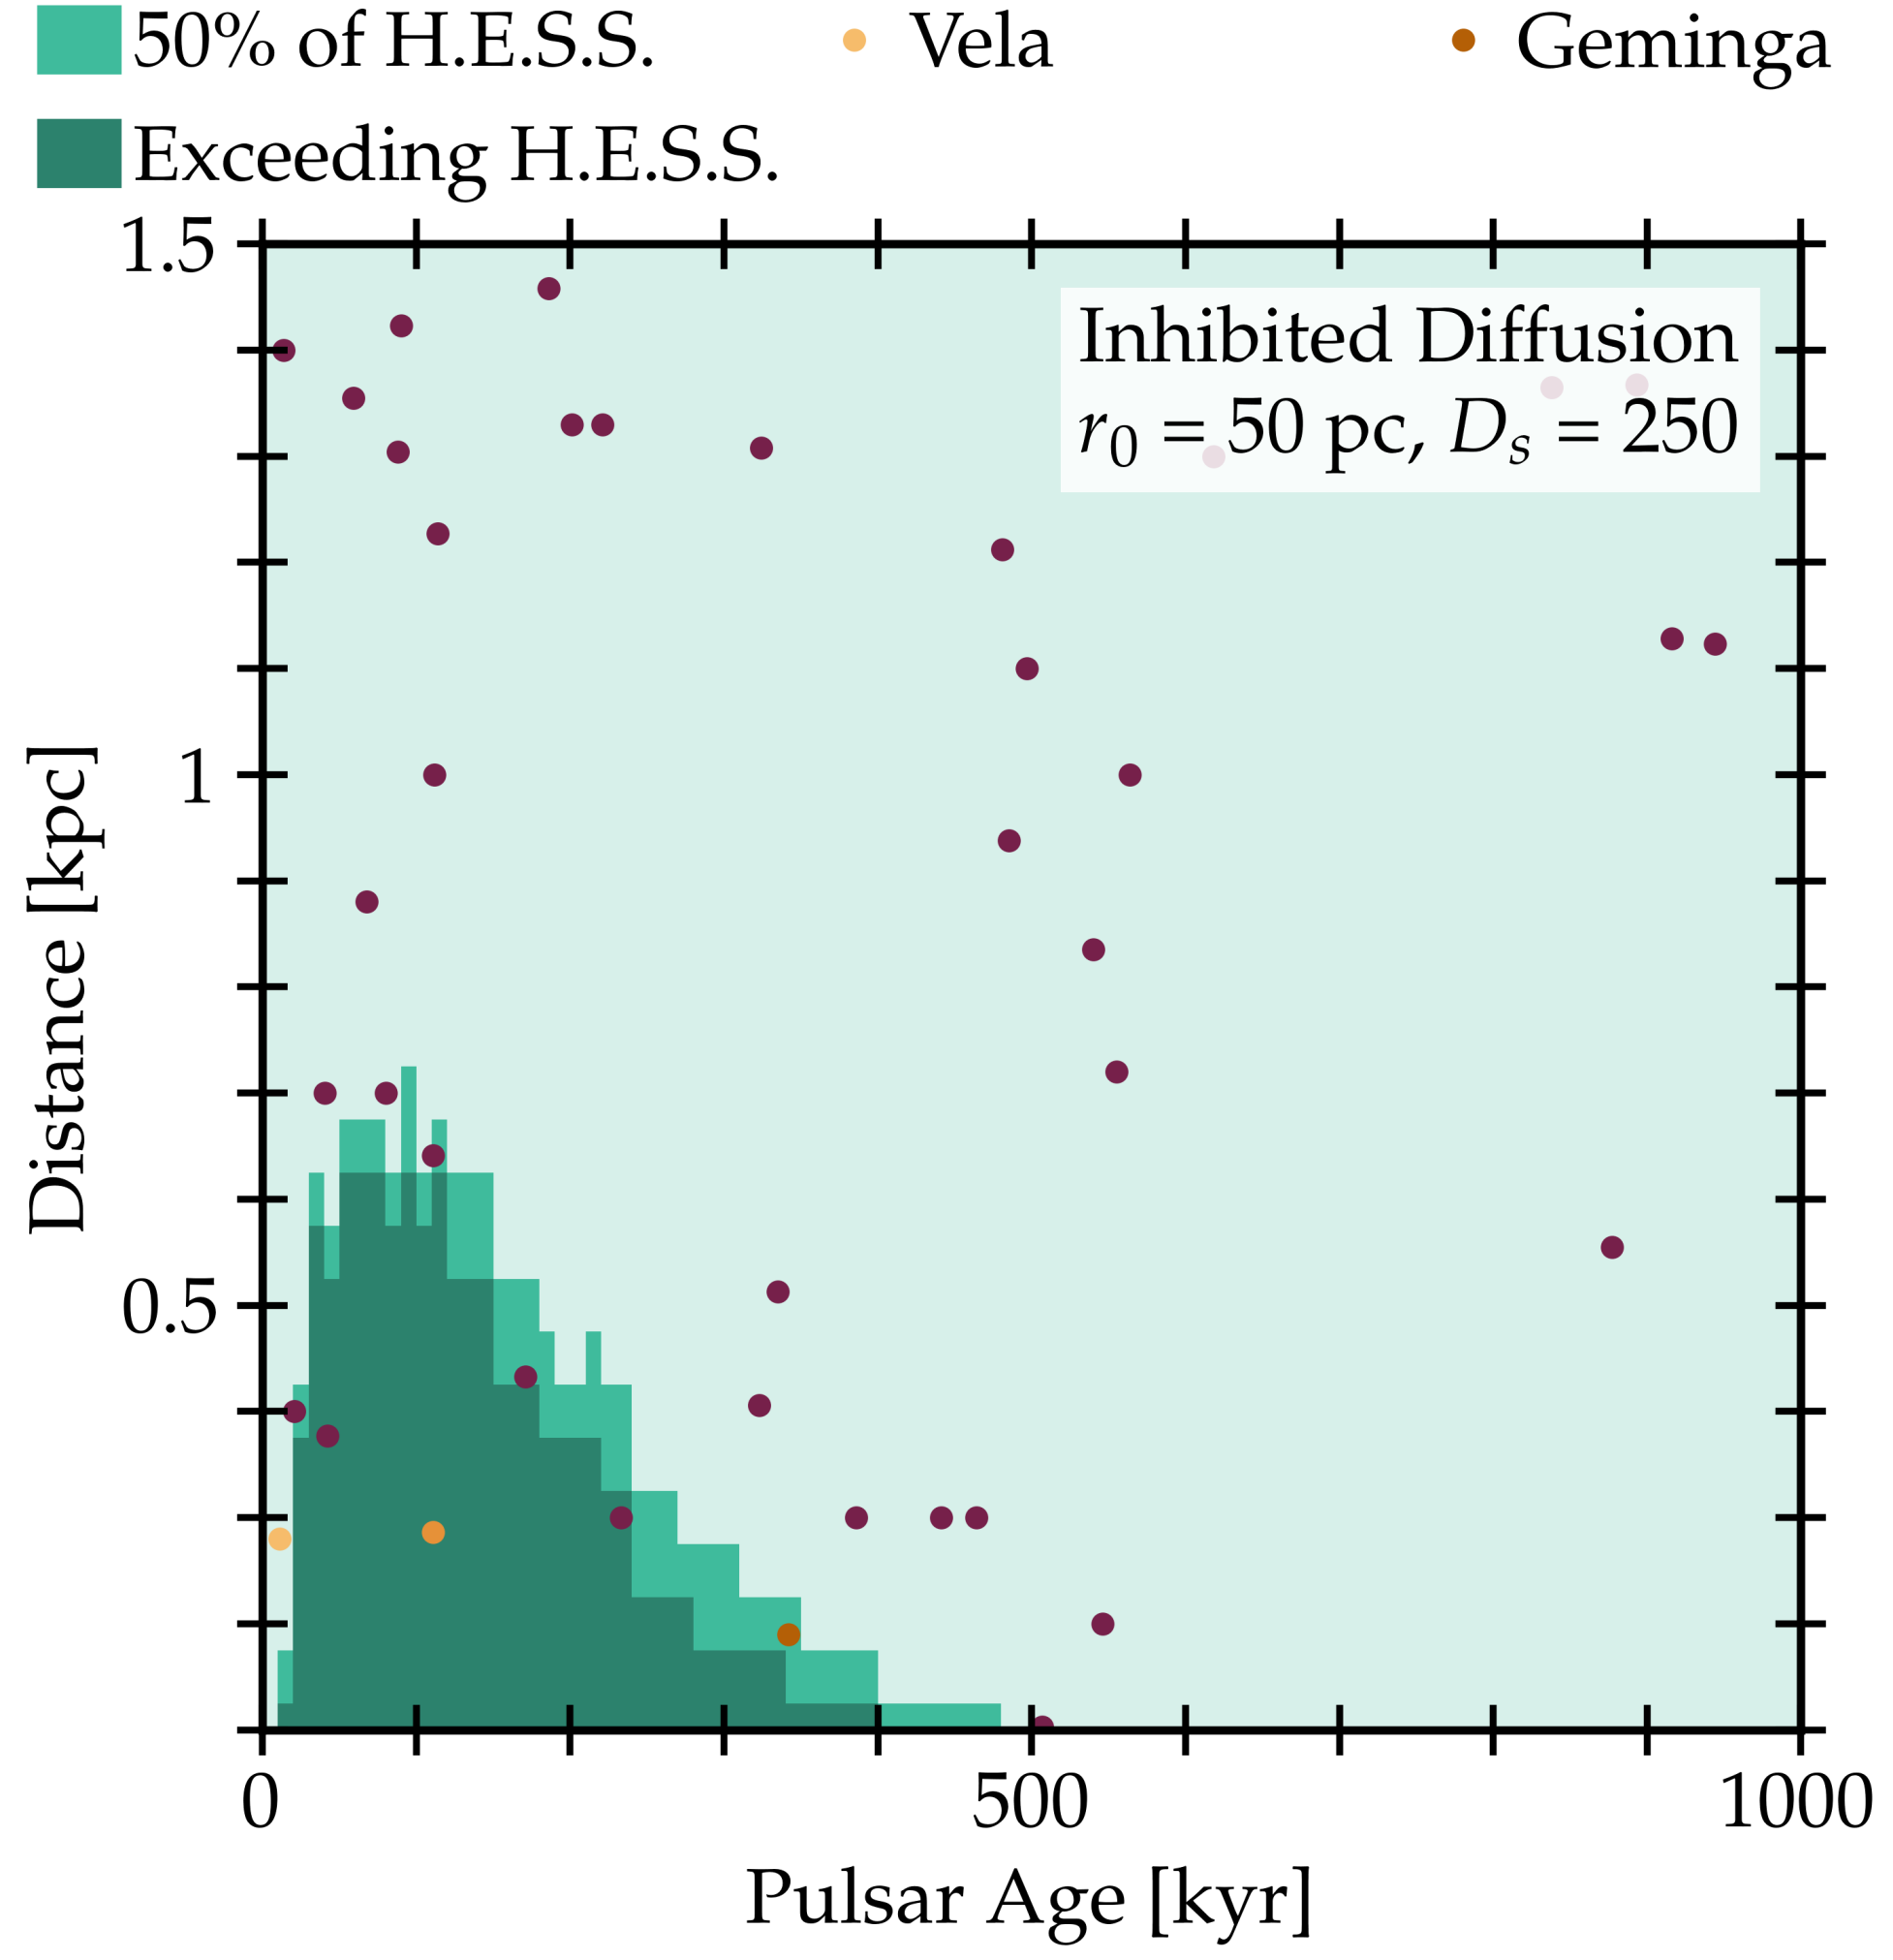
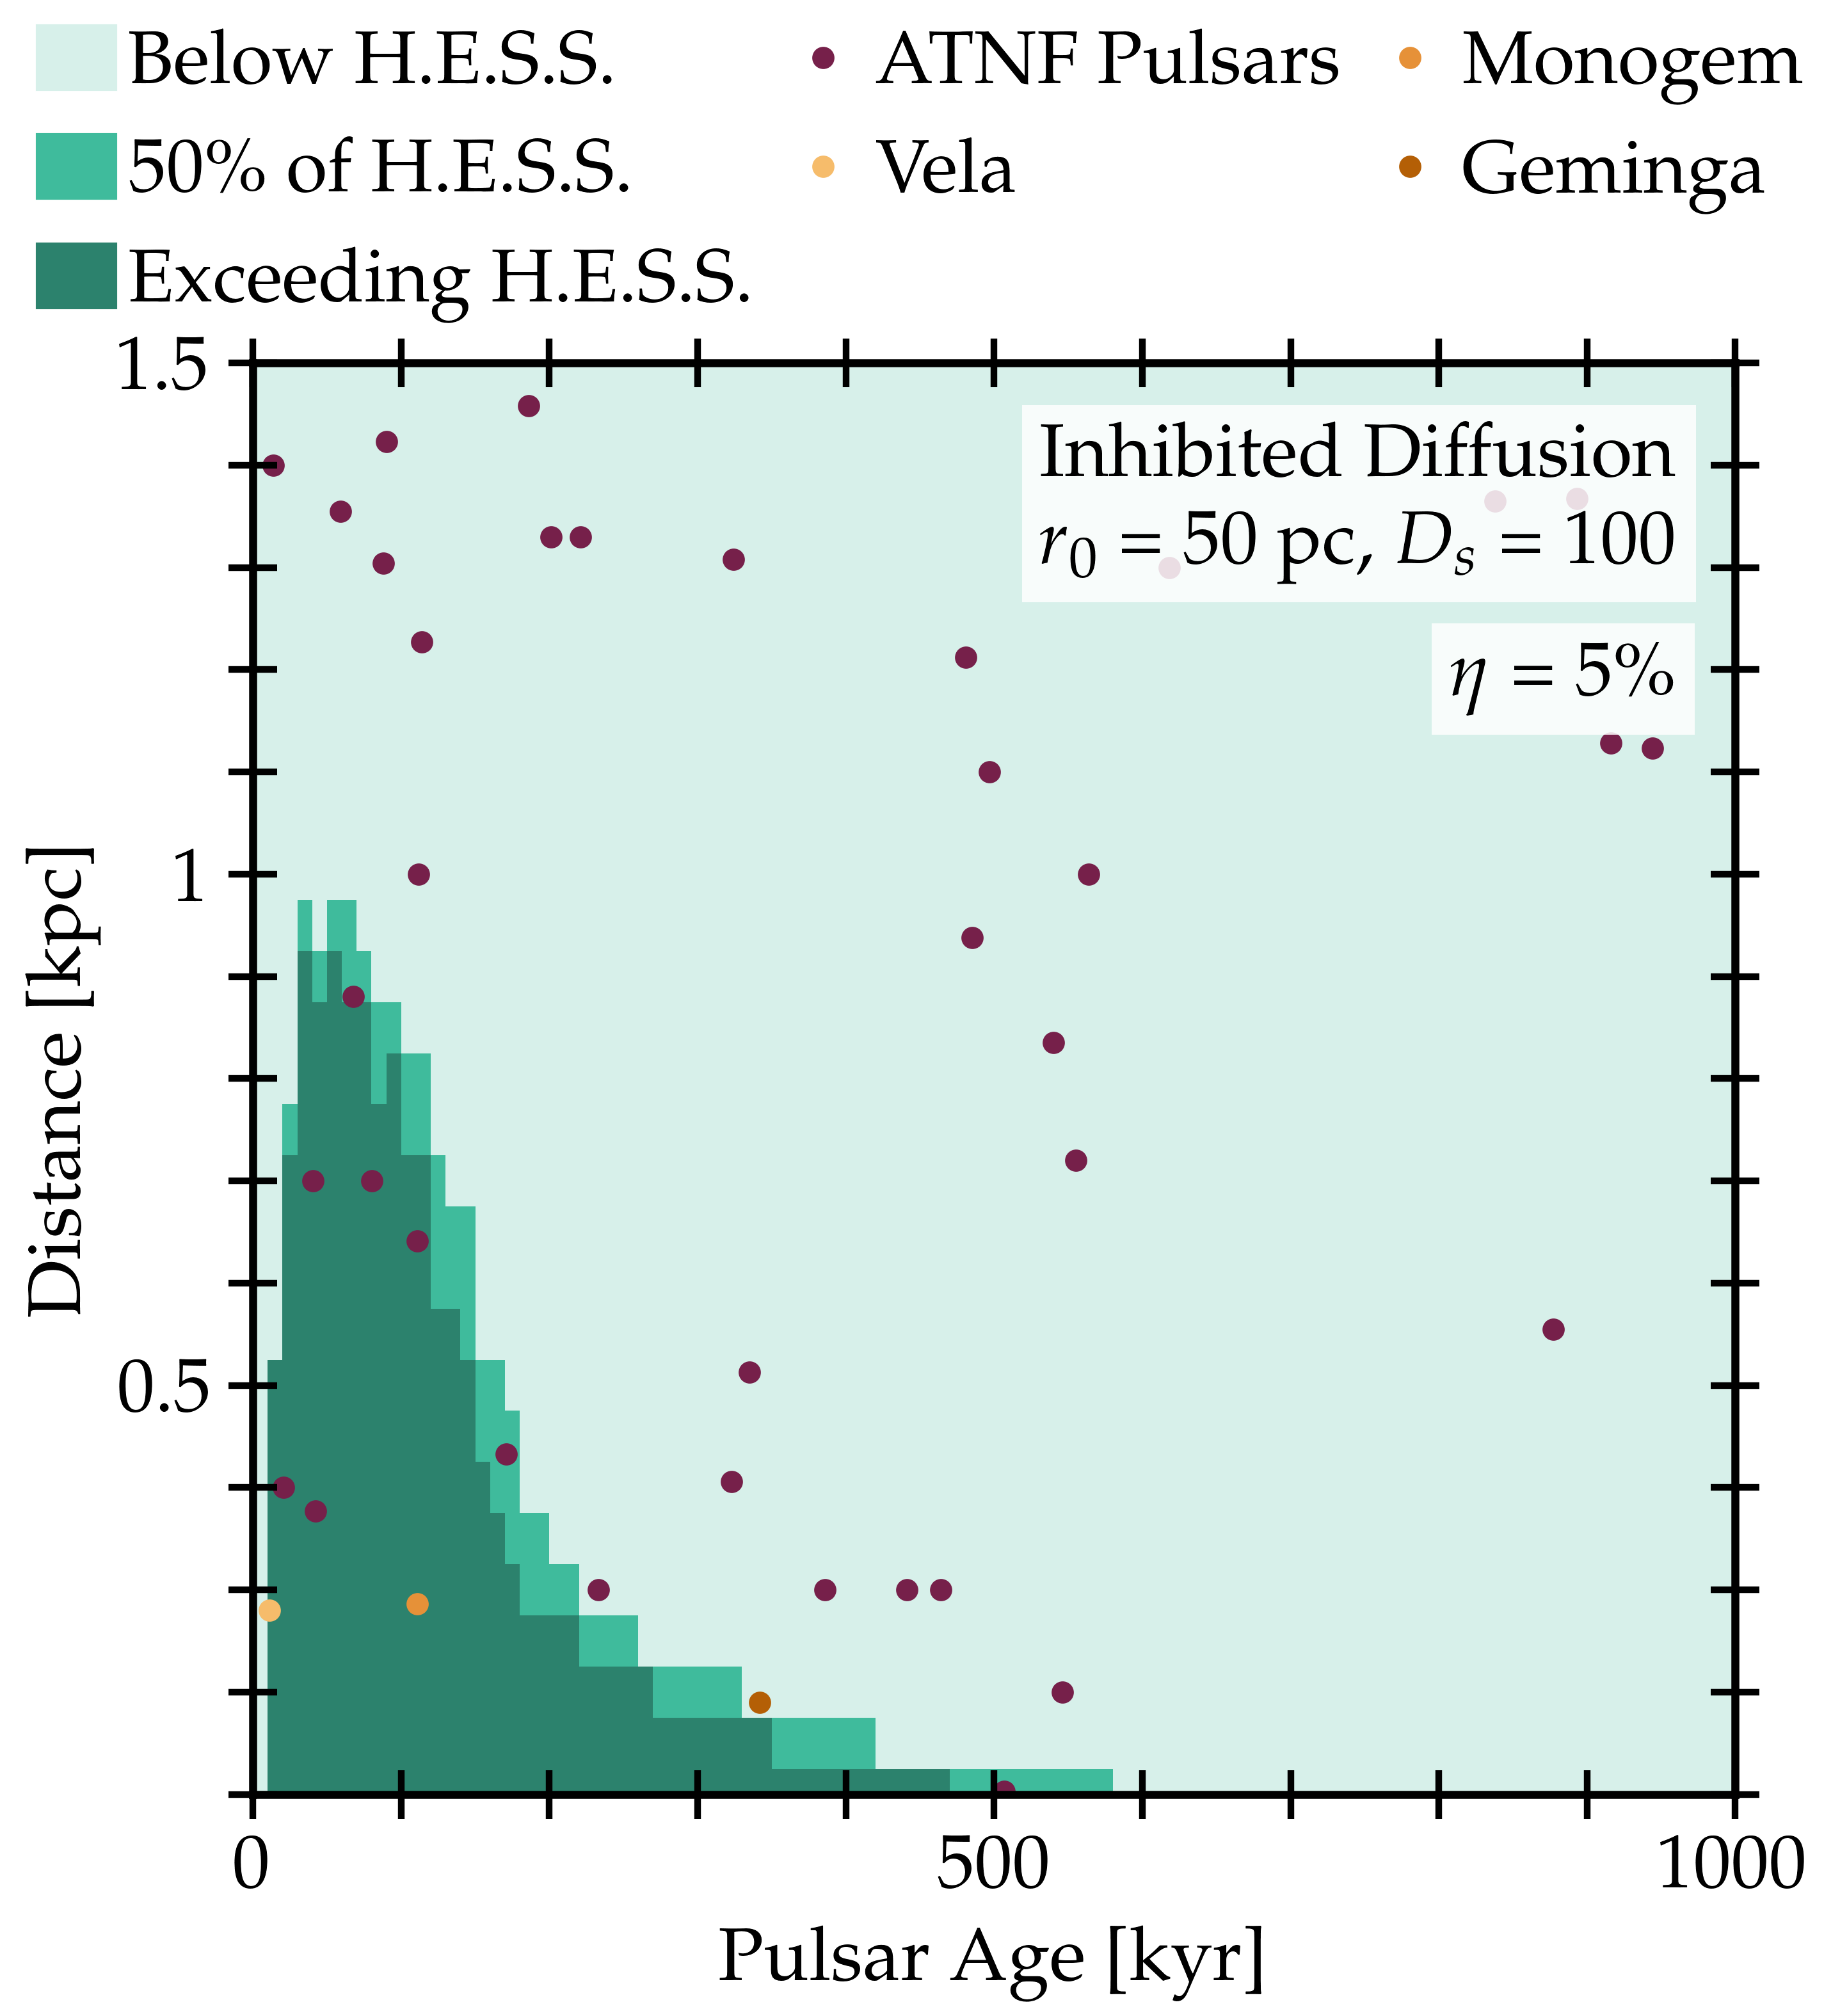
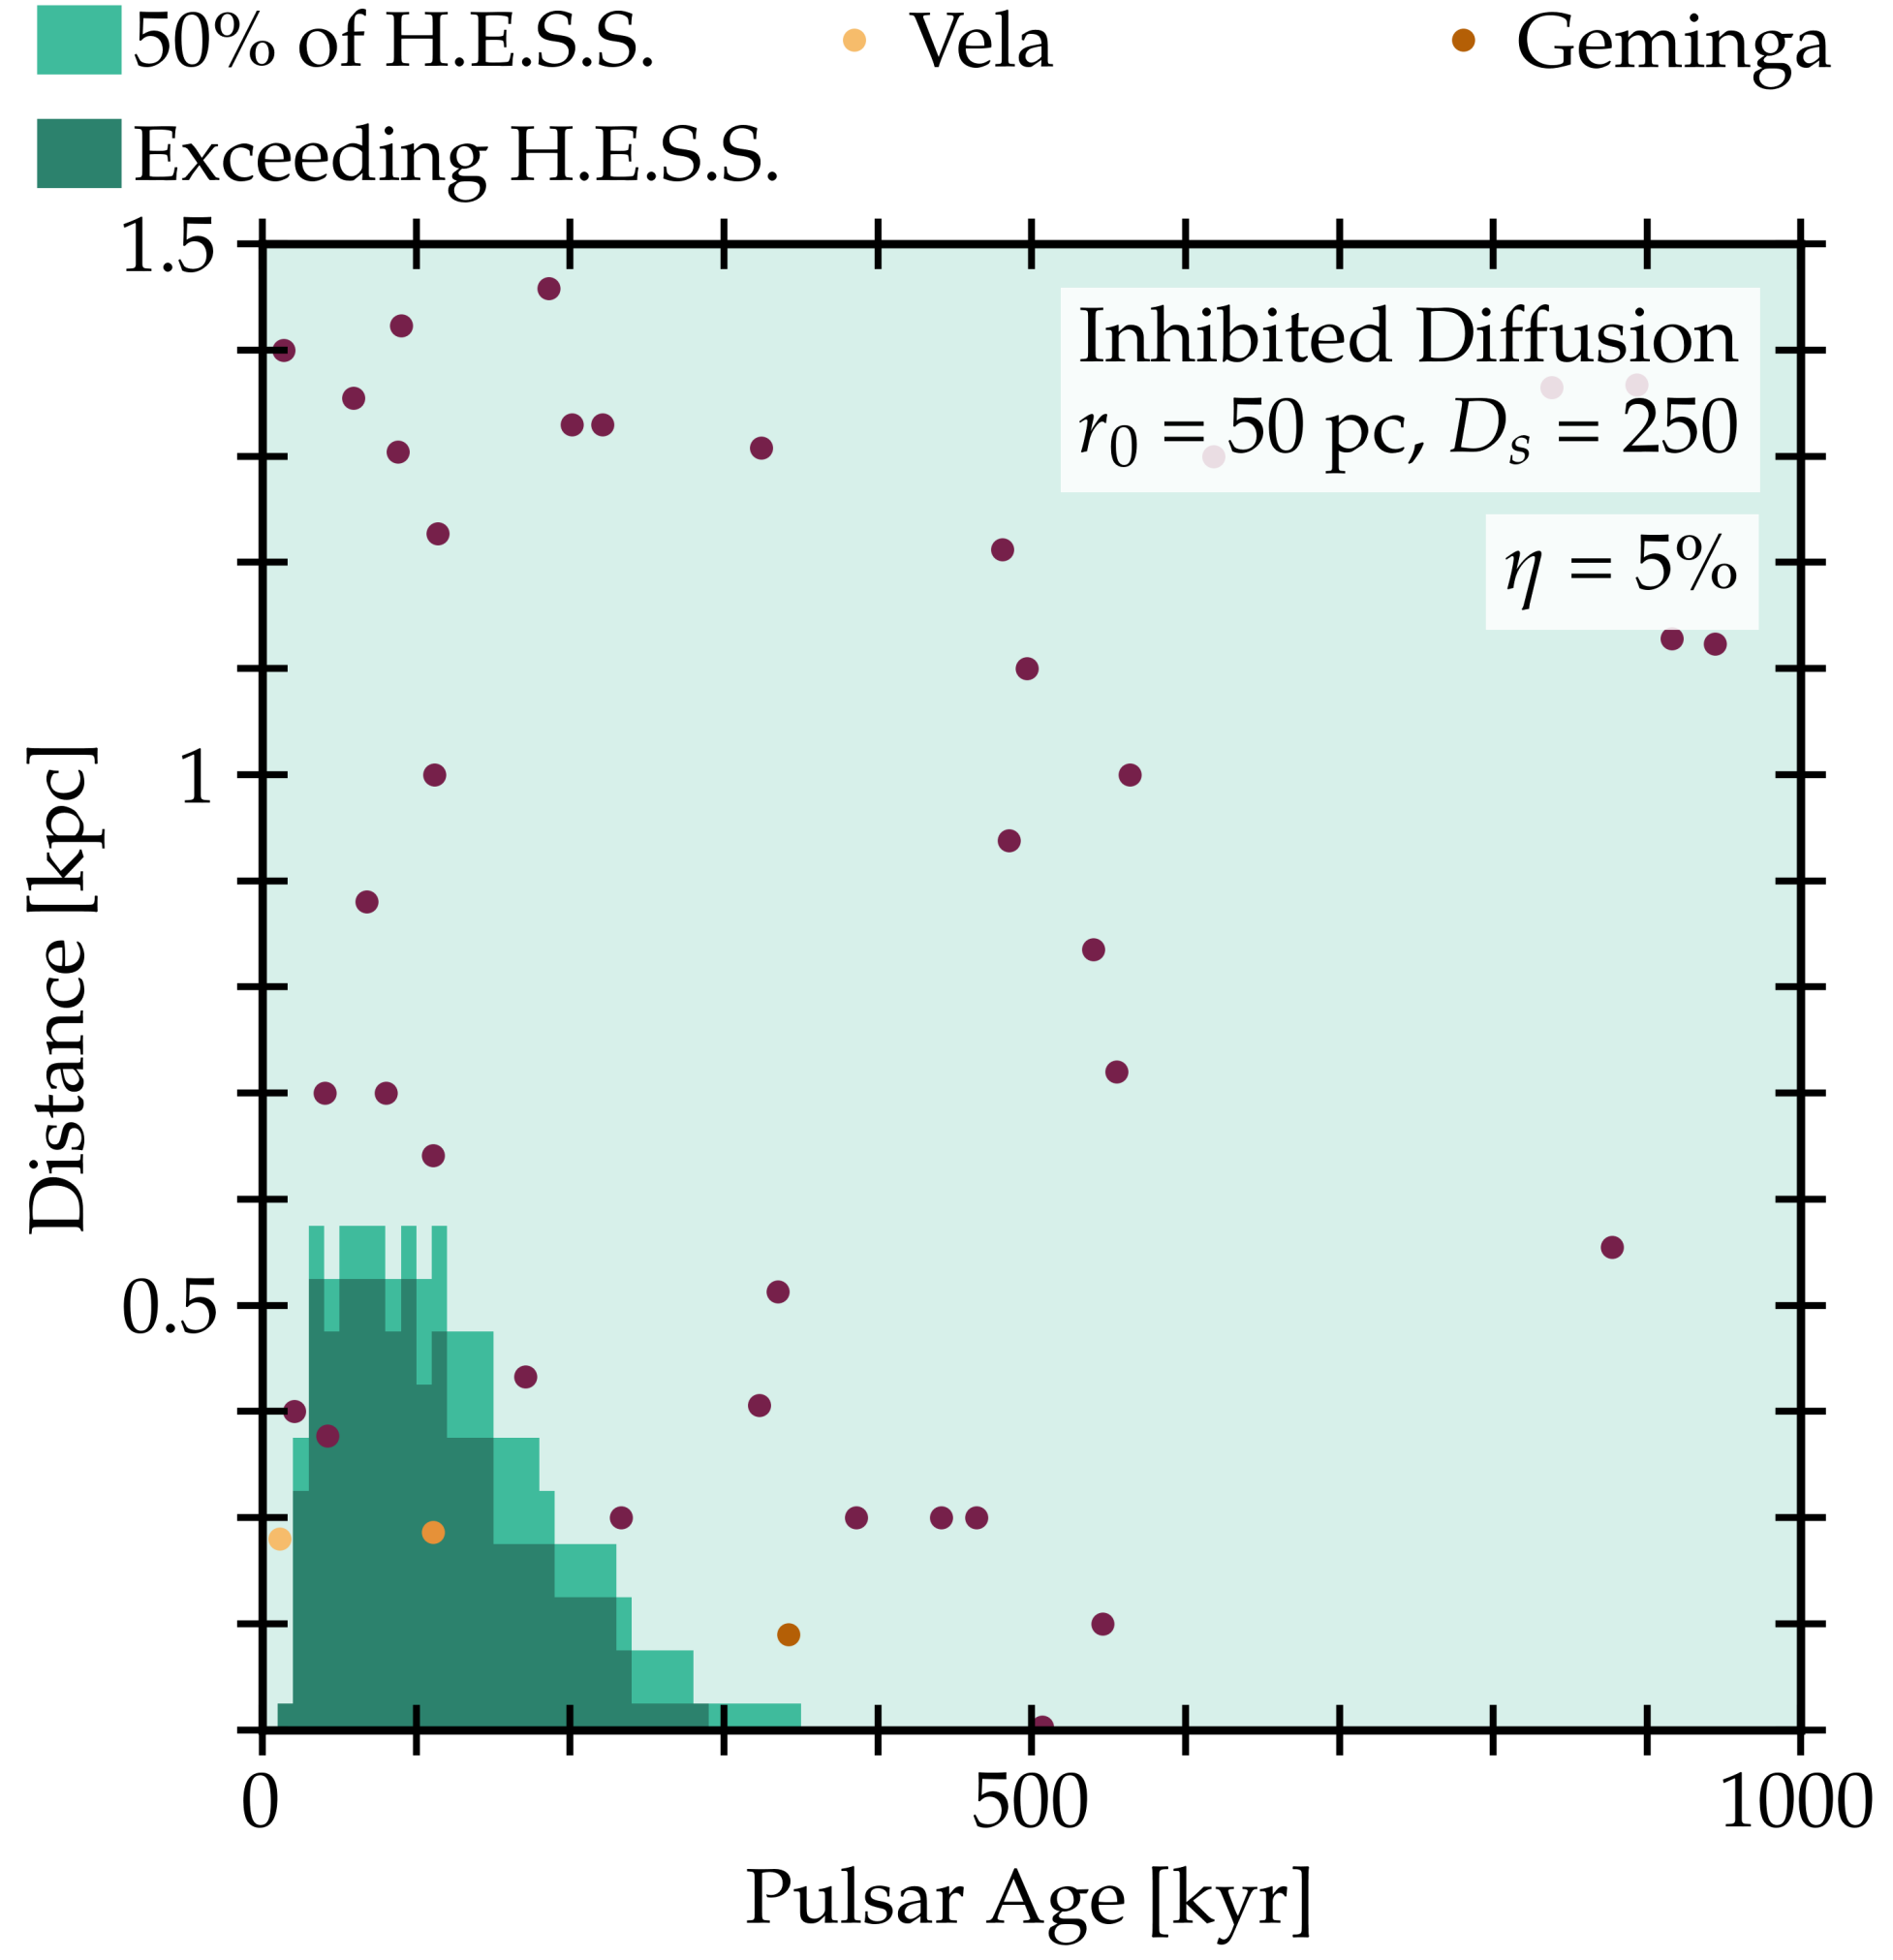
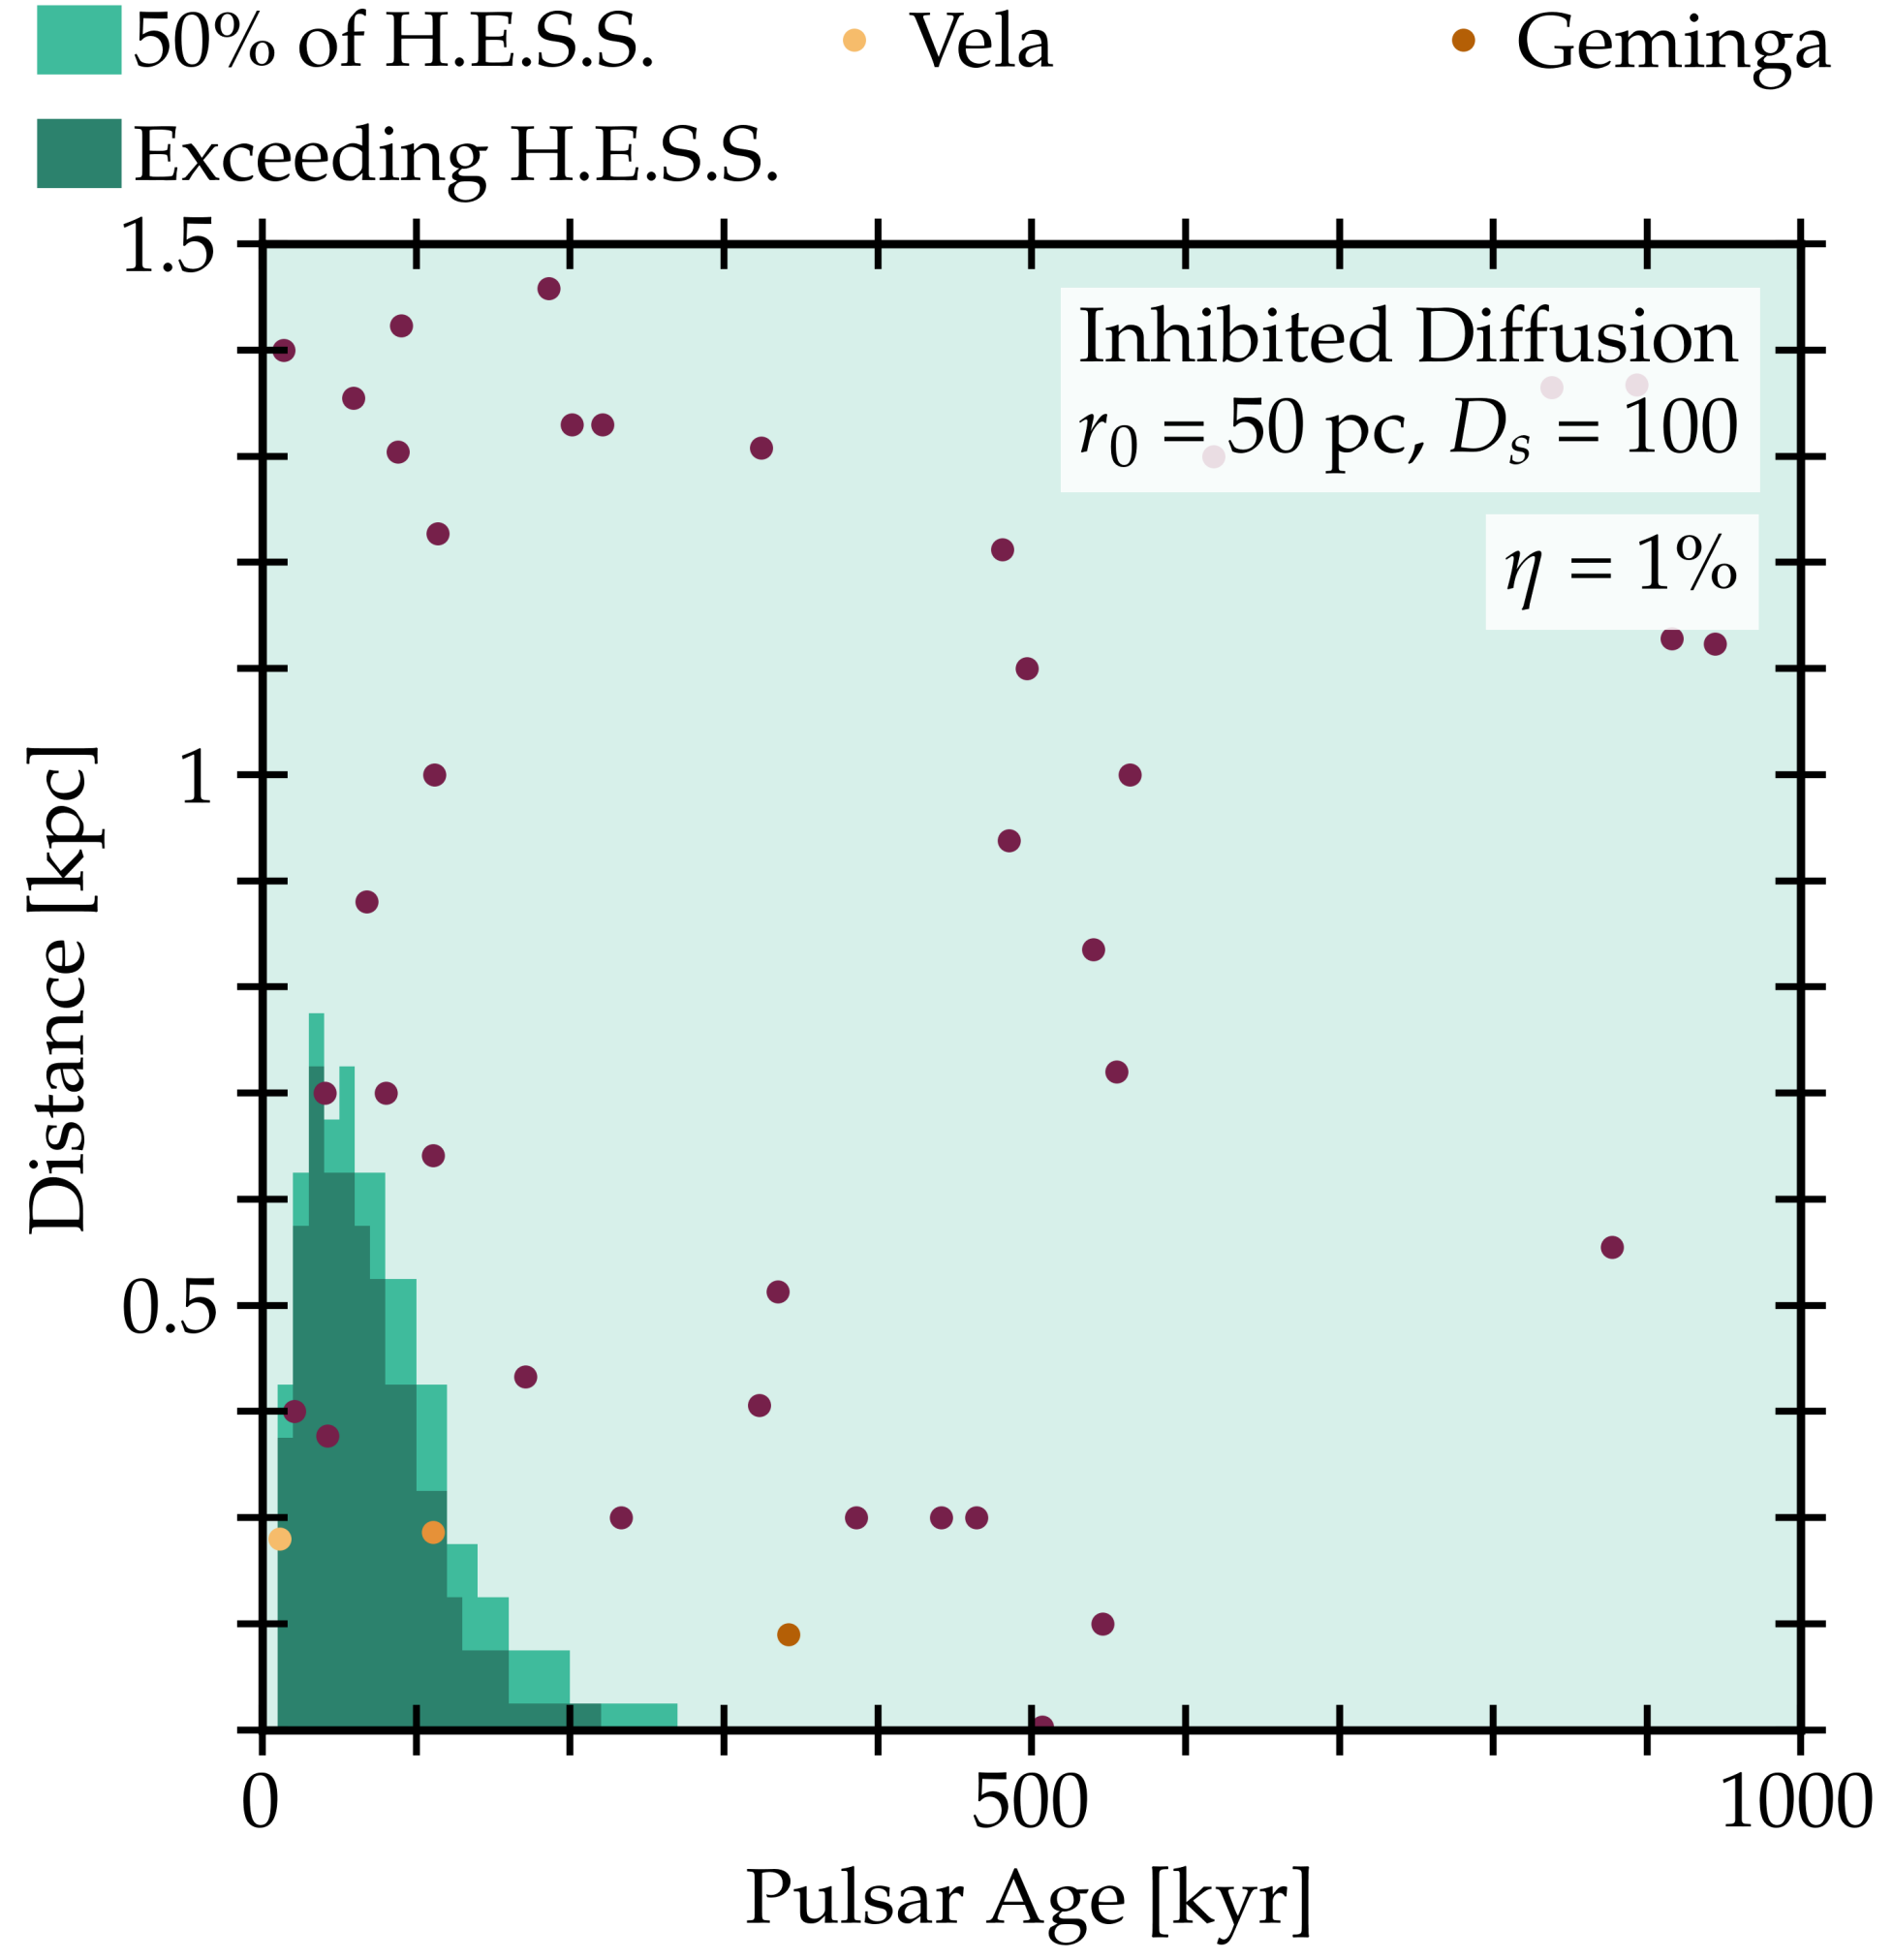
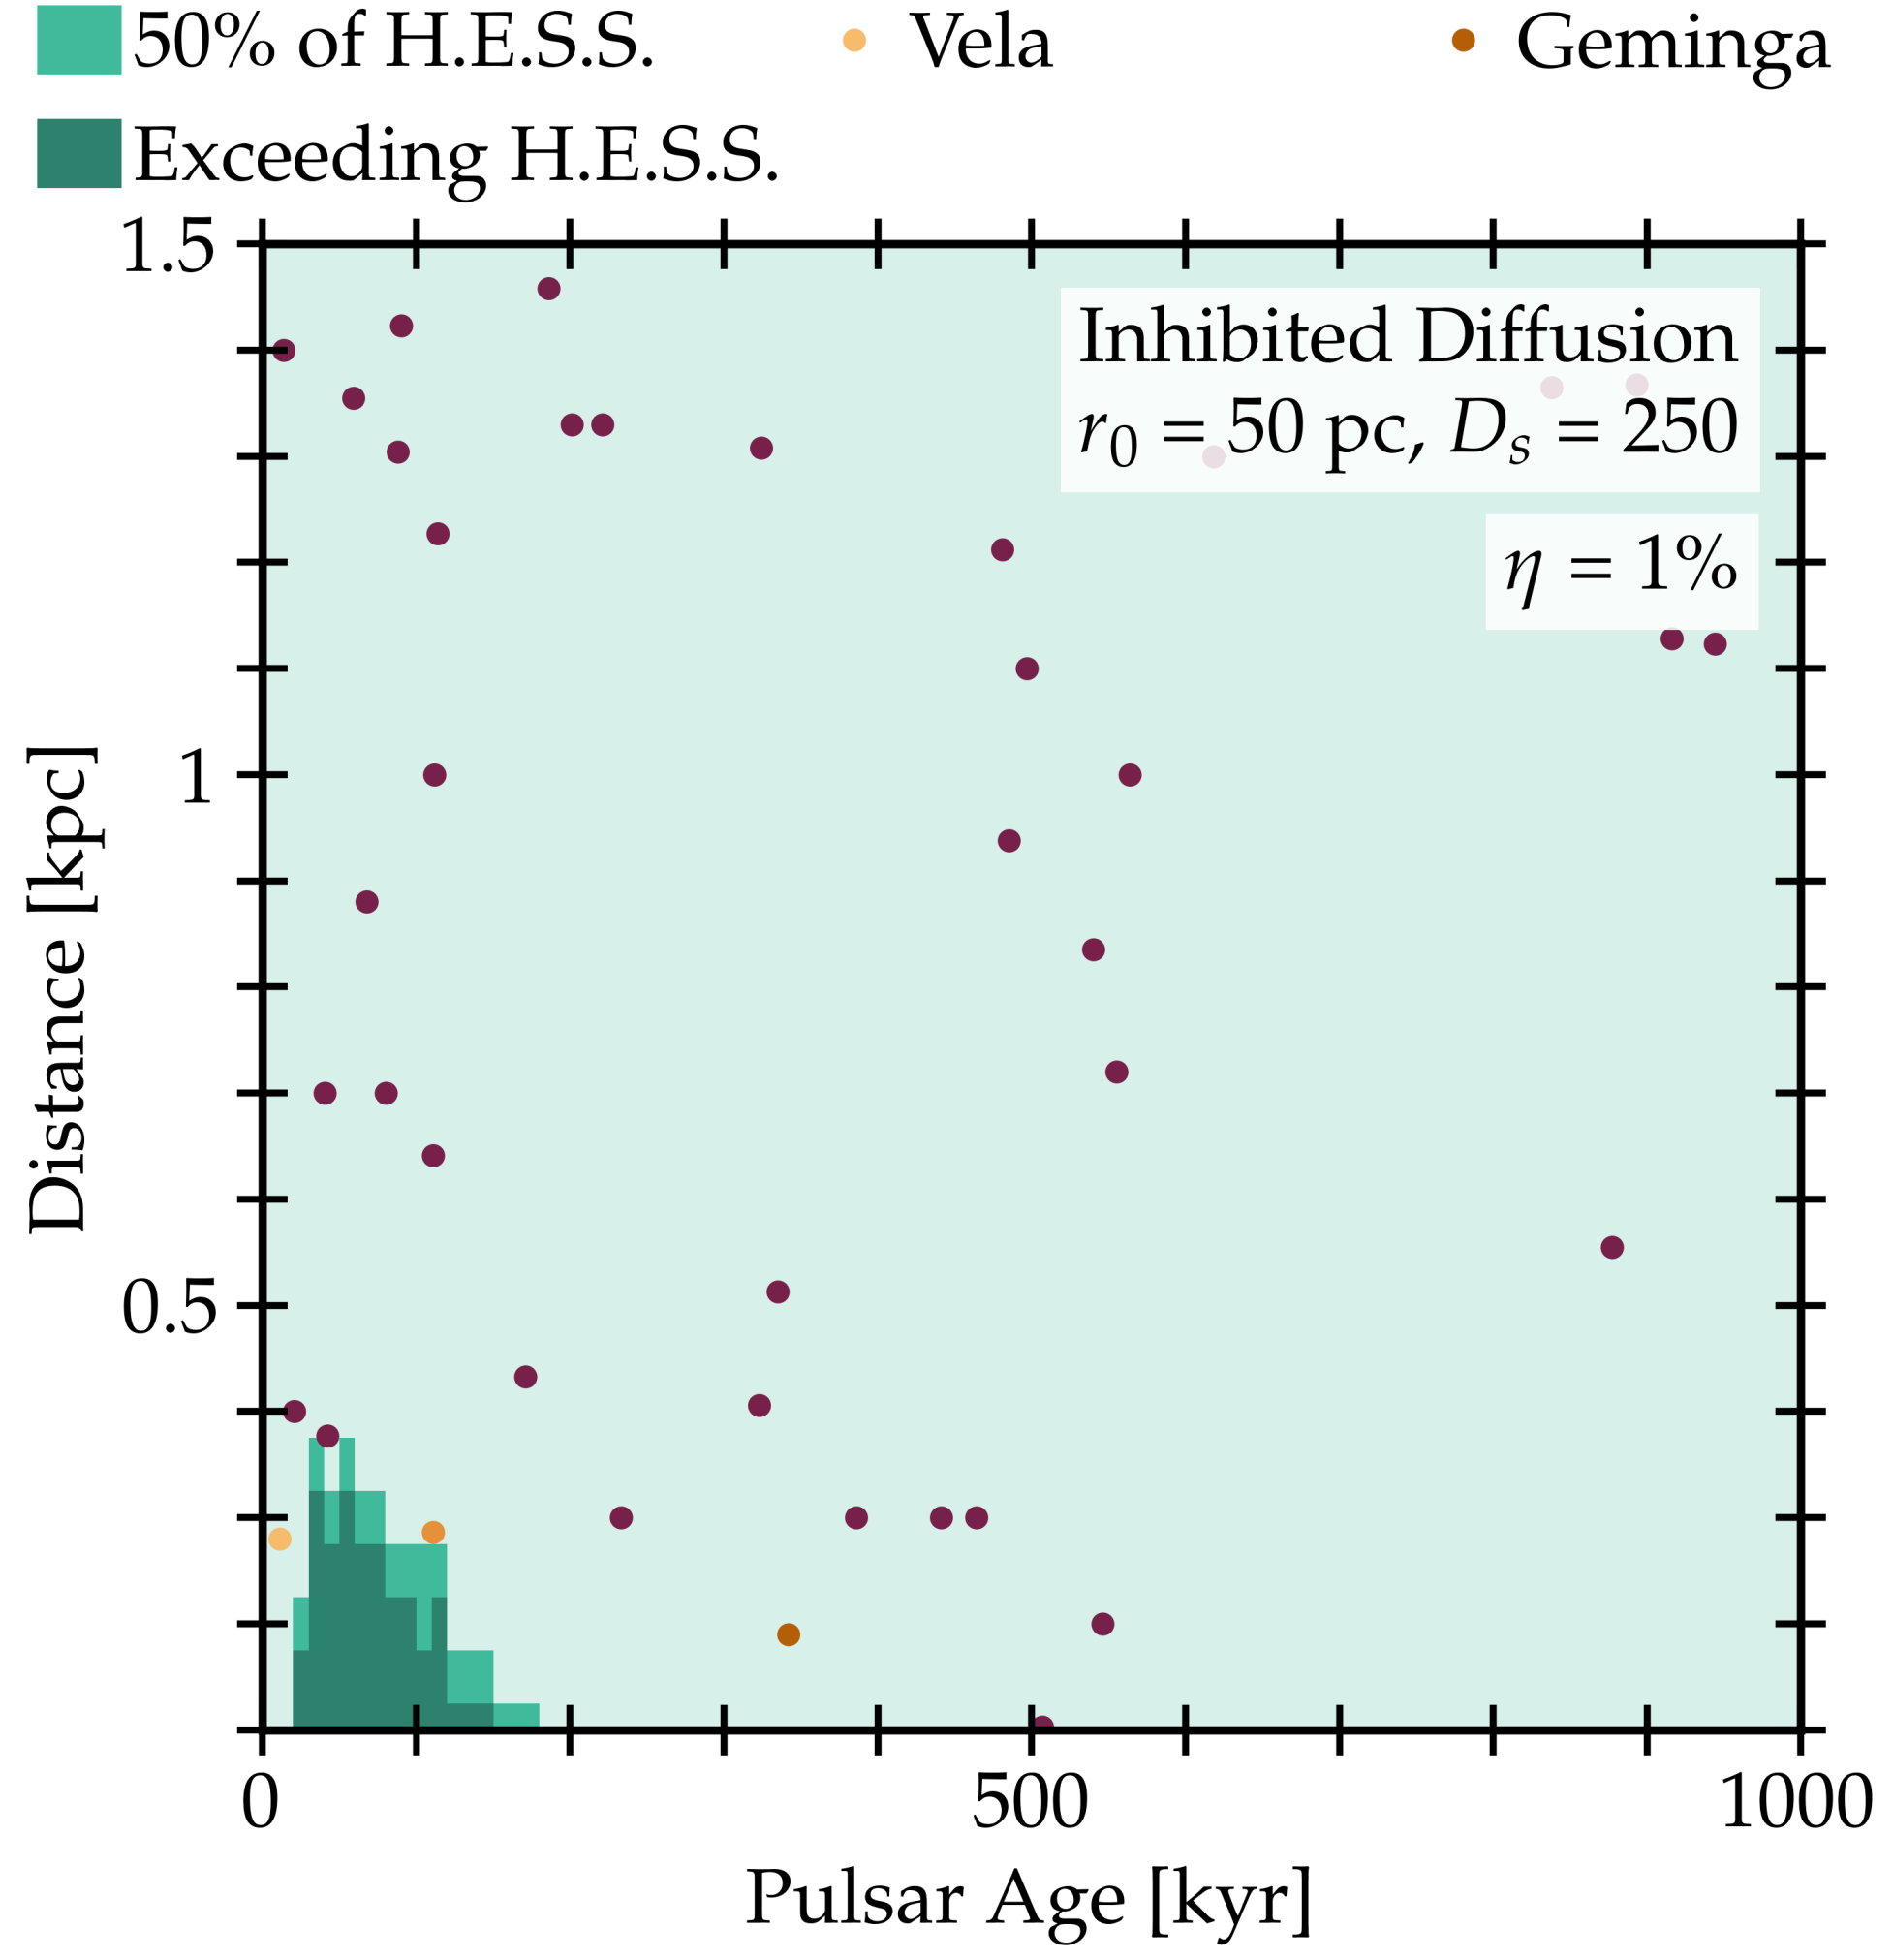
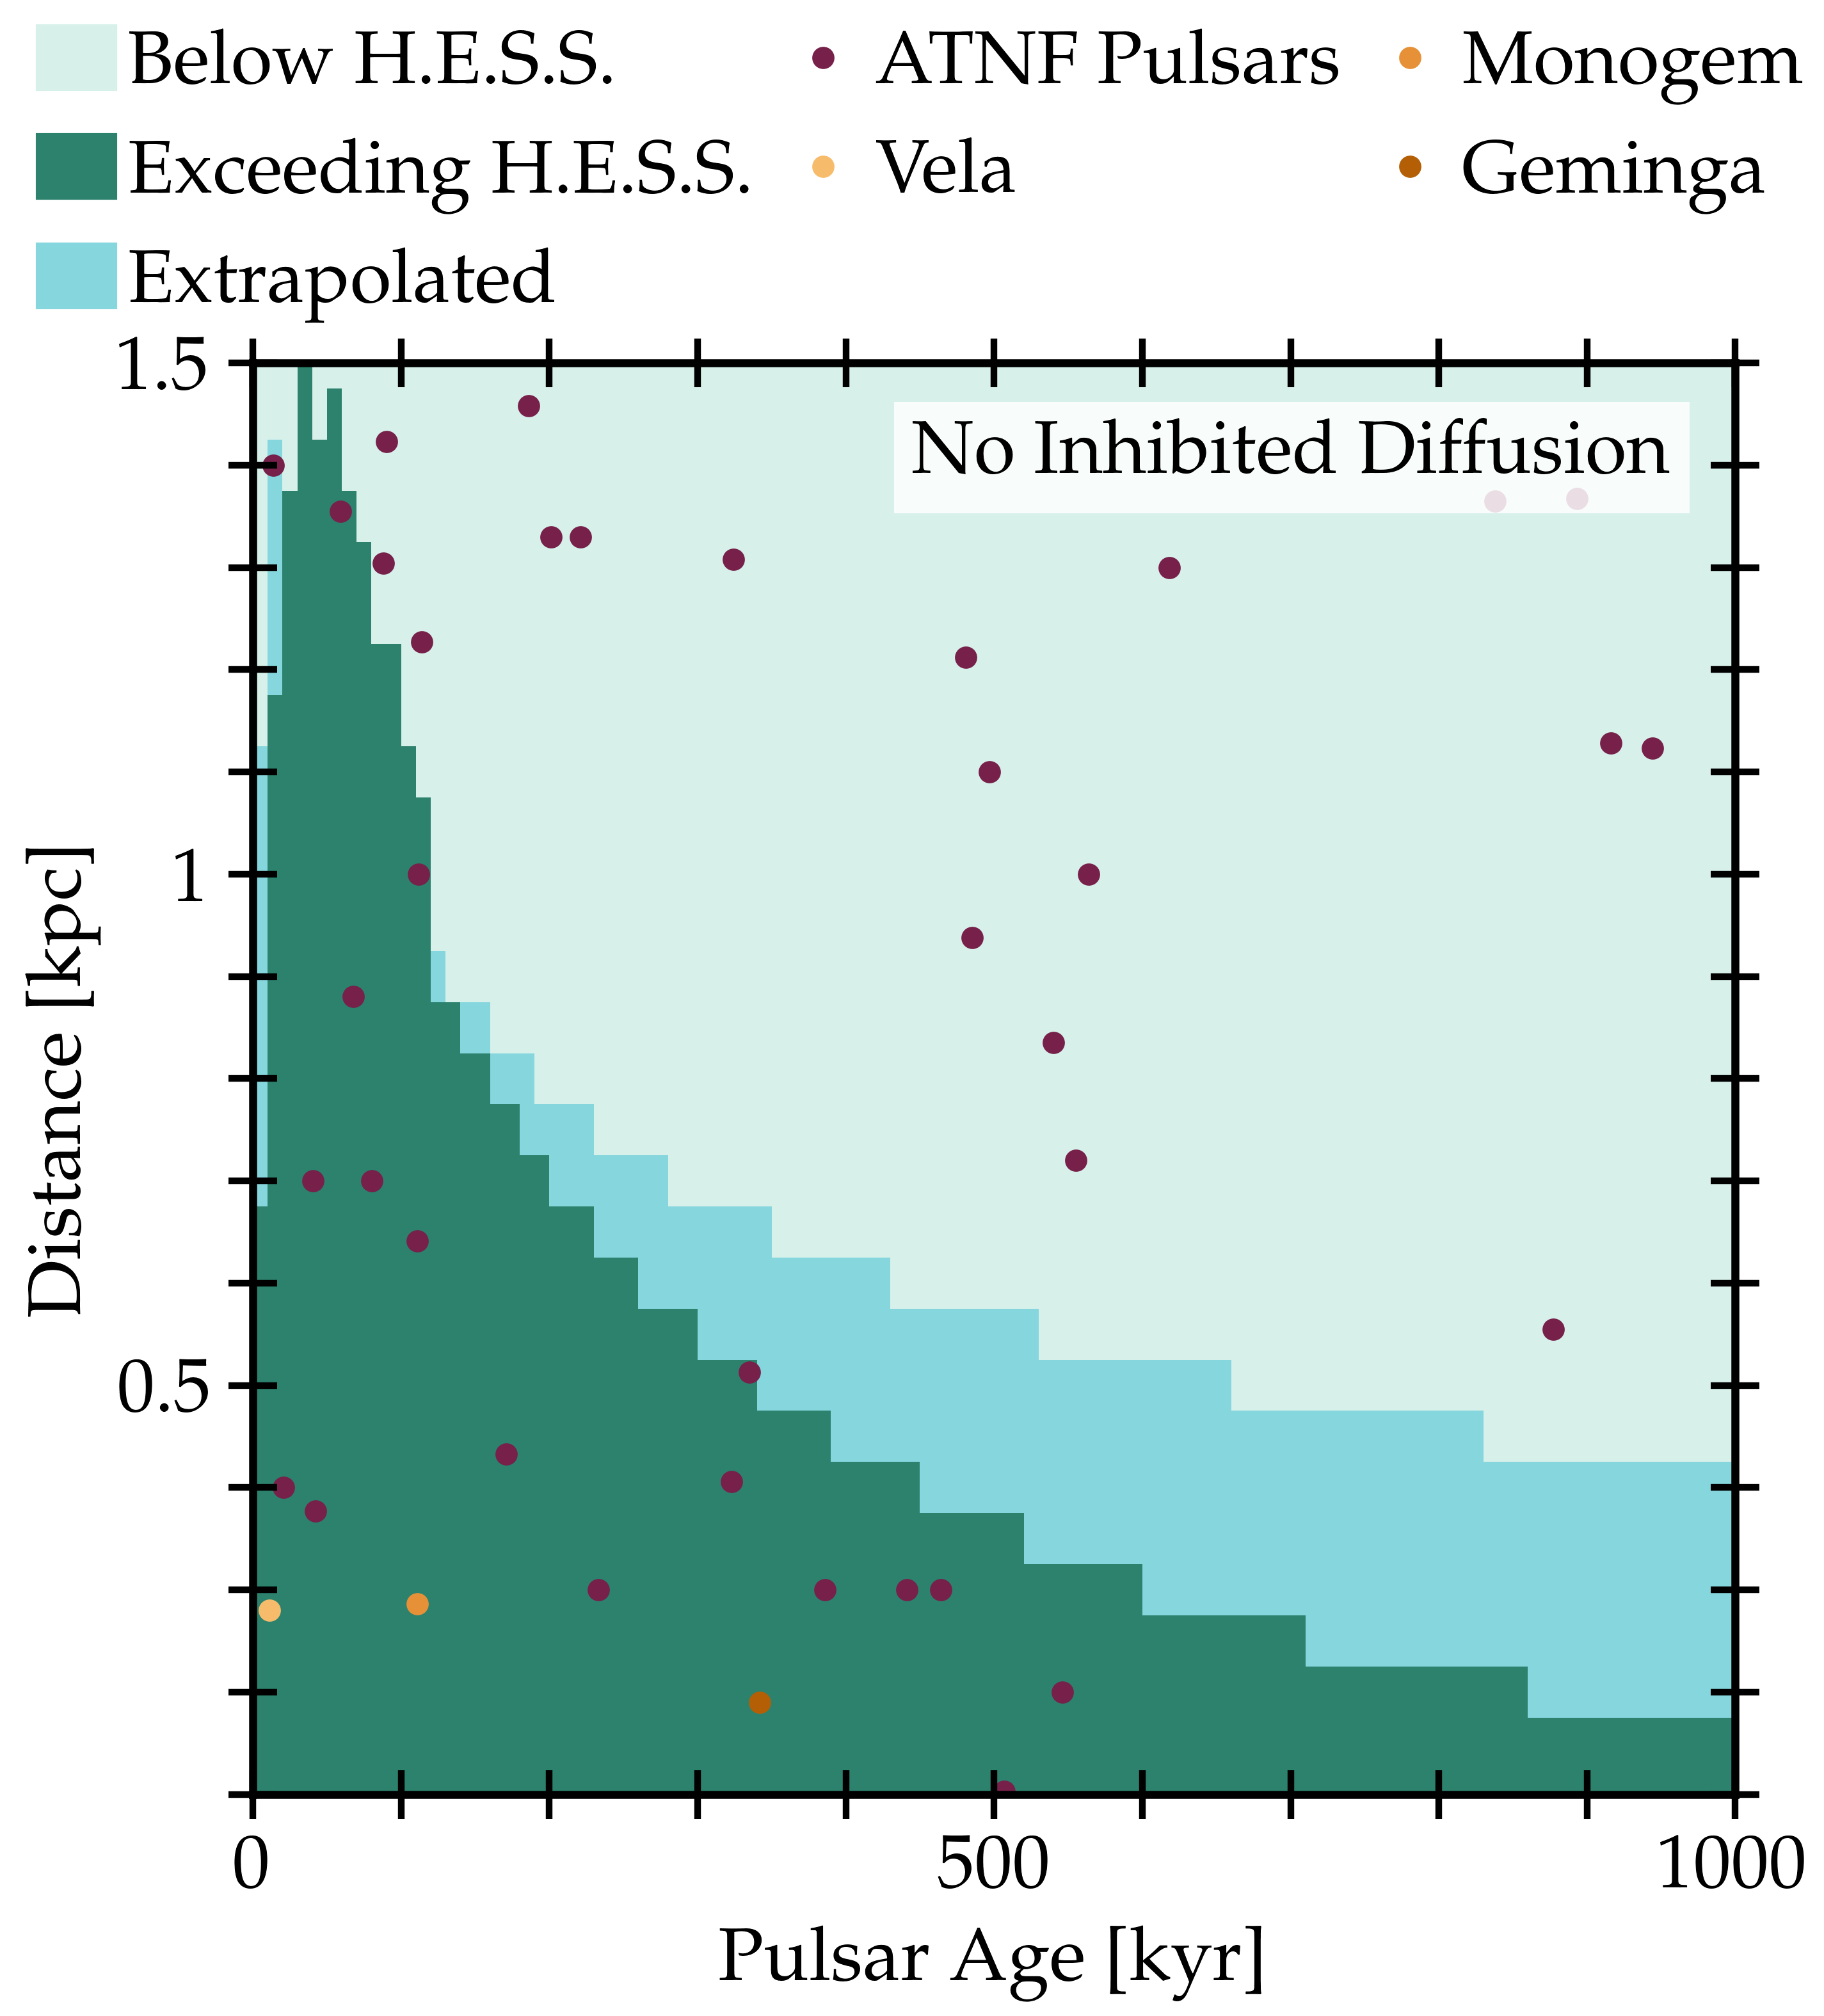
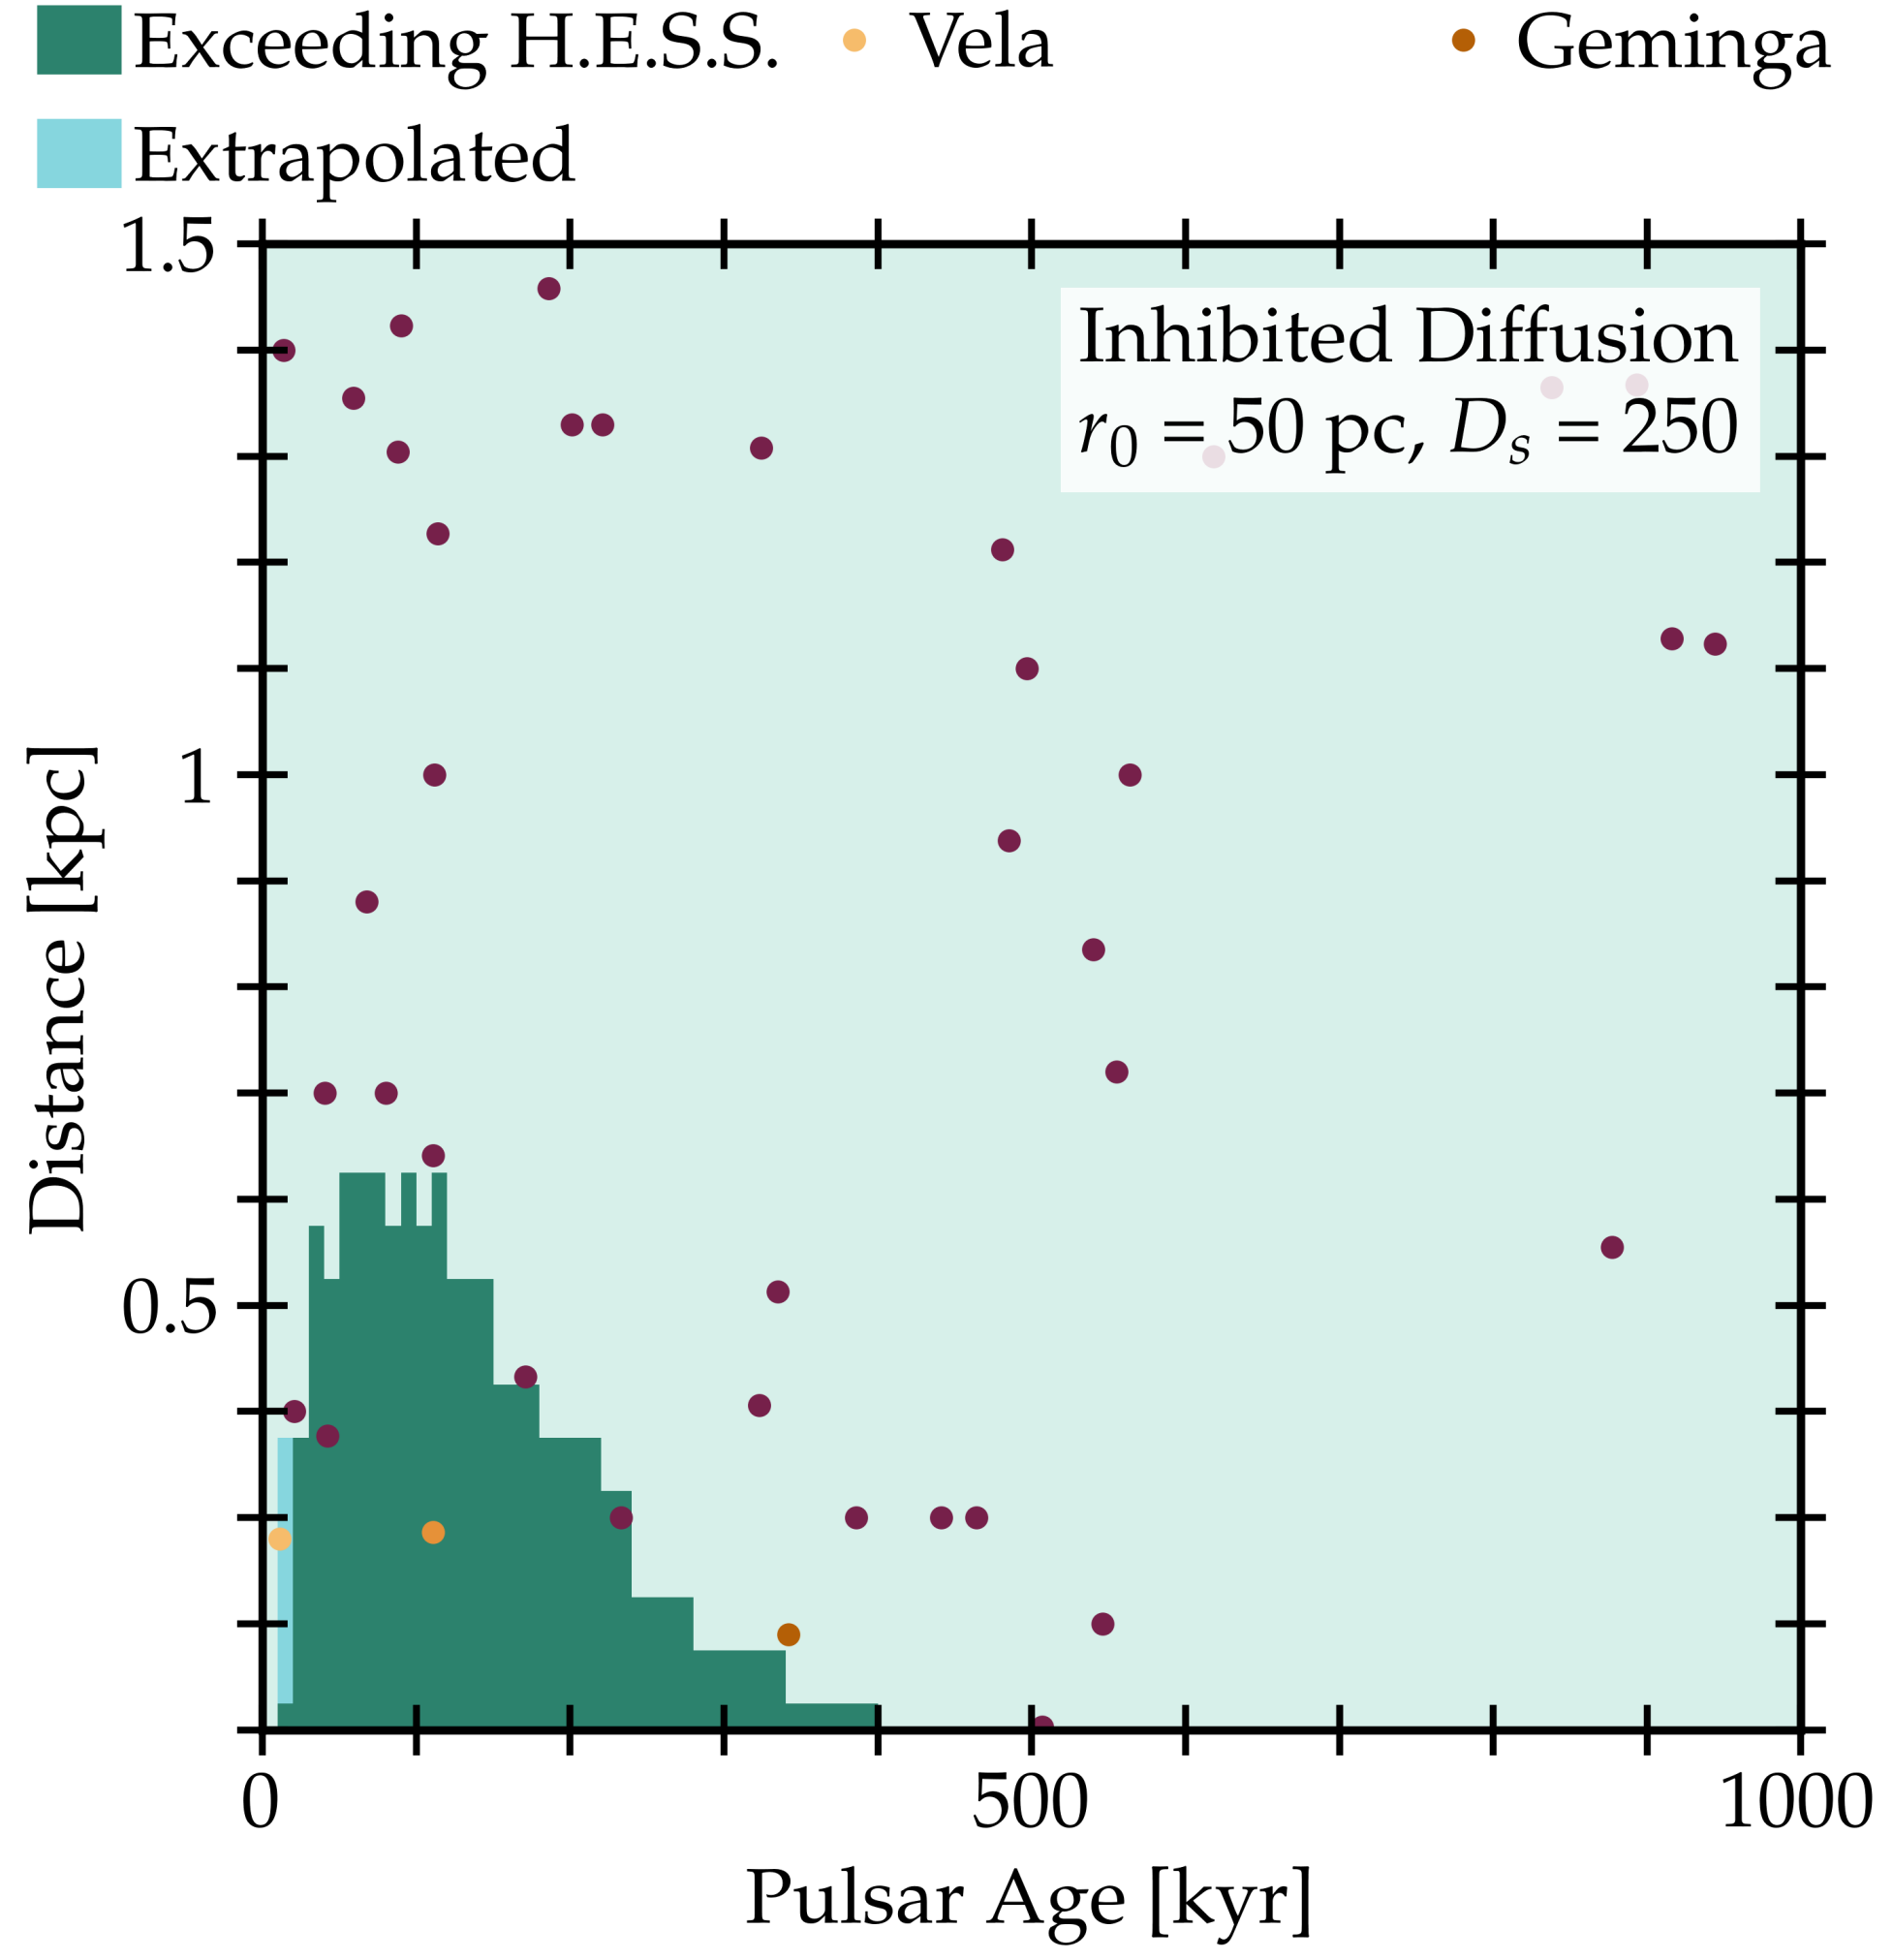
Figure 2 compares pulsars of different ages and distances to the H.E.S.S. data for our three diffusion models: the one-zone model (top panel), the two-zone model with pc and (middle) and pc and (bottom). Violet dots represent pulsars in the ATNF catalogue [35, 36], while Vela, Monogem and Geminga are shown with yellow, orange and dark orange dots, respectively. Pulsars in dark green regions have fluxes that would individually overproduce the H.E.S.S. data. Medium green regions represent pulsars which individually account for more than 50% of the flux in a single H.E.S.S. energy bin. Light green regions correspond to pulsars whose spectra fall below the H.E.S.S. data. In the one-zone model, known pulsars overproduce the H.E.S.S. data. The number reduces to 11 in the two-zone model with a suppression, while in the case of = 250 only three sources exceed the H.E.S.S. flux. We note that even this model does not saturate the potential for diffusion to be severely restricted near pulsars, as many pulsar wind nebulae as well as TeV halos like Geminga show evidence for diffusion to be inhibited by a factor of 1000 or more [42, 26].
Figure 3 shows the same result as Fig. 2 for models where we change the pulsar efficiency from to 5% or 1%. This reduces the flux from each pulsar and reduces the number that exceed H.E.S.S. data. However, we find that for a 5% (1%) efficiency, 14 (5) pulsars still exceed H.E.S.S data. Even for pulsars with much lower efficiencies than our standard scenario, inhibited diffusion is needed to be consistent with H.E.S.S.
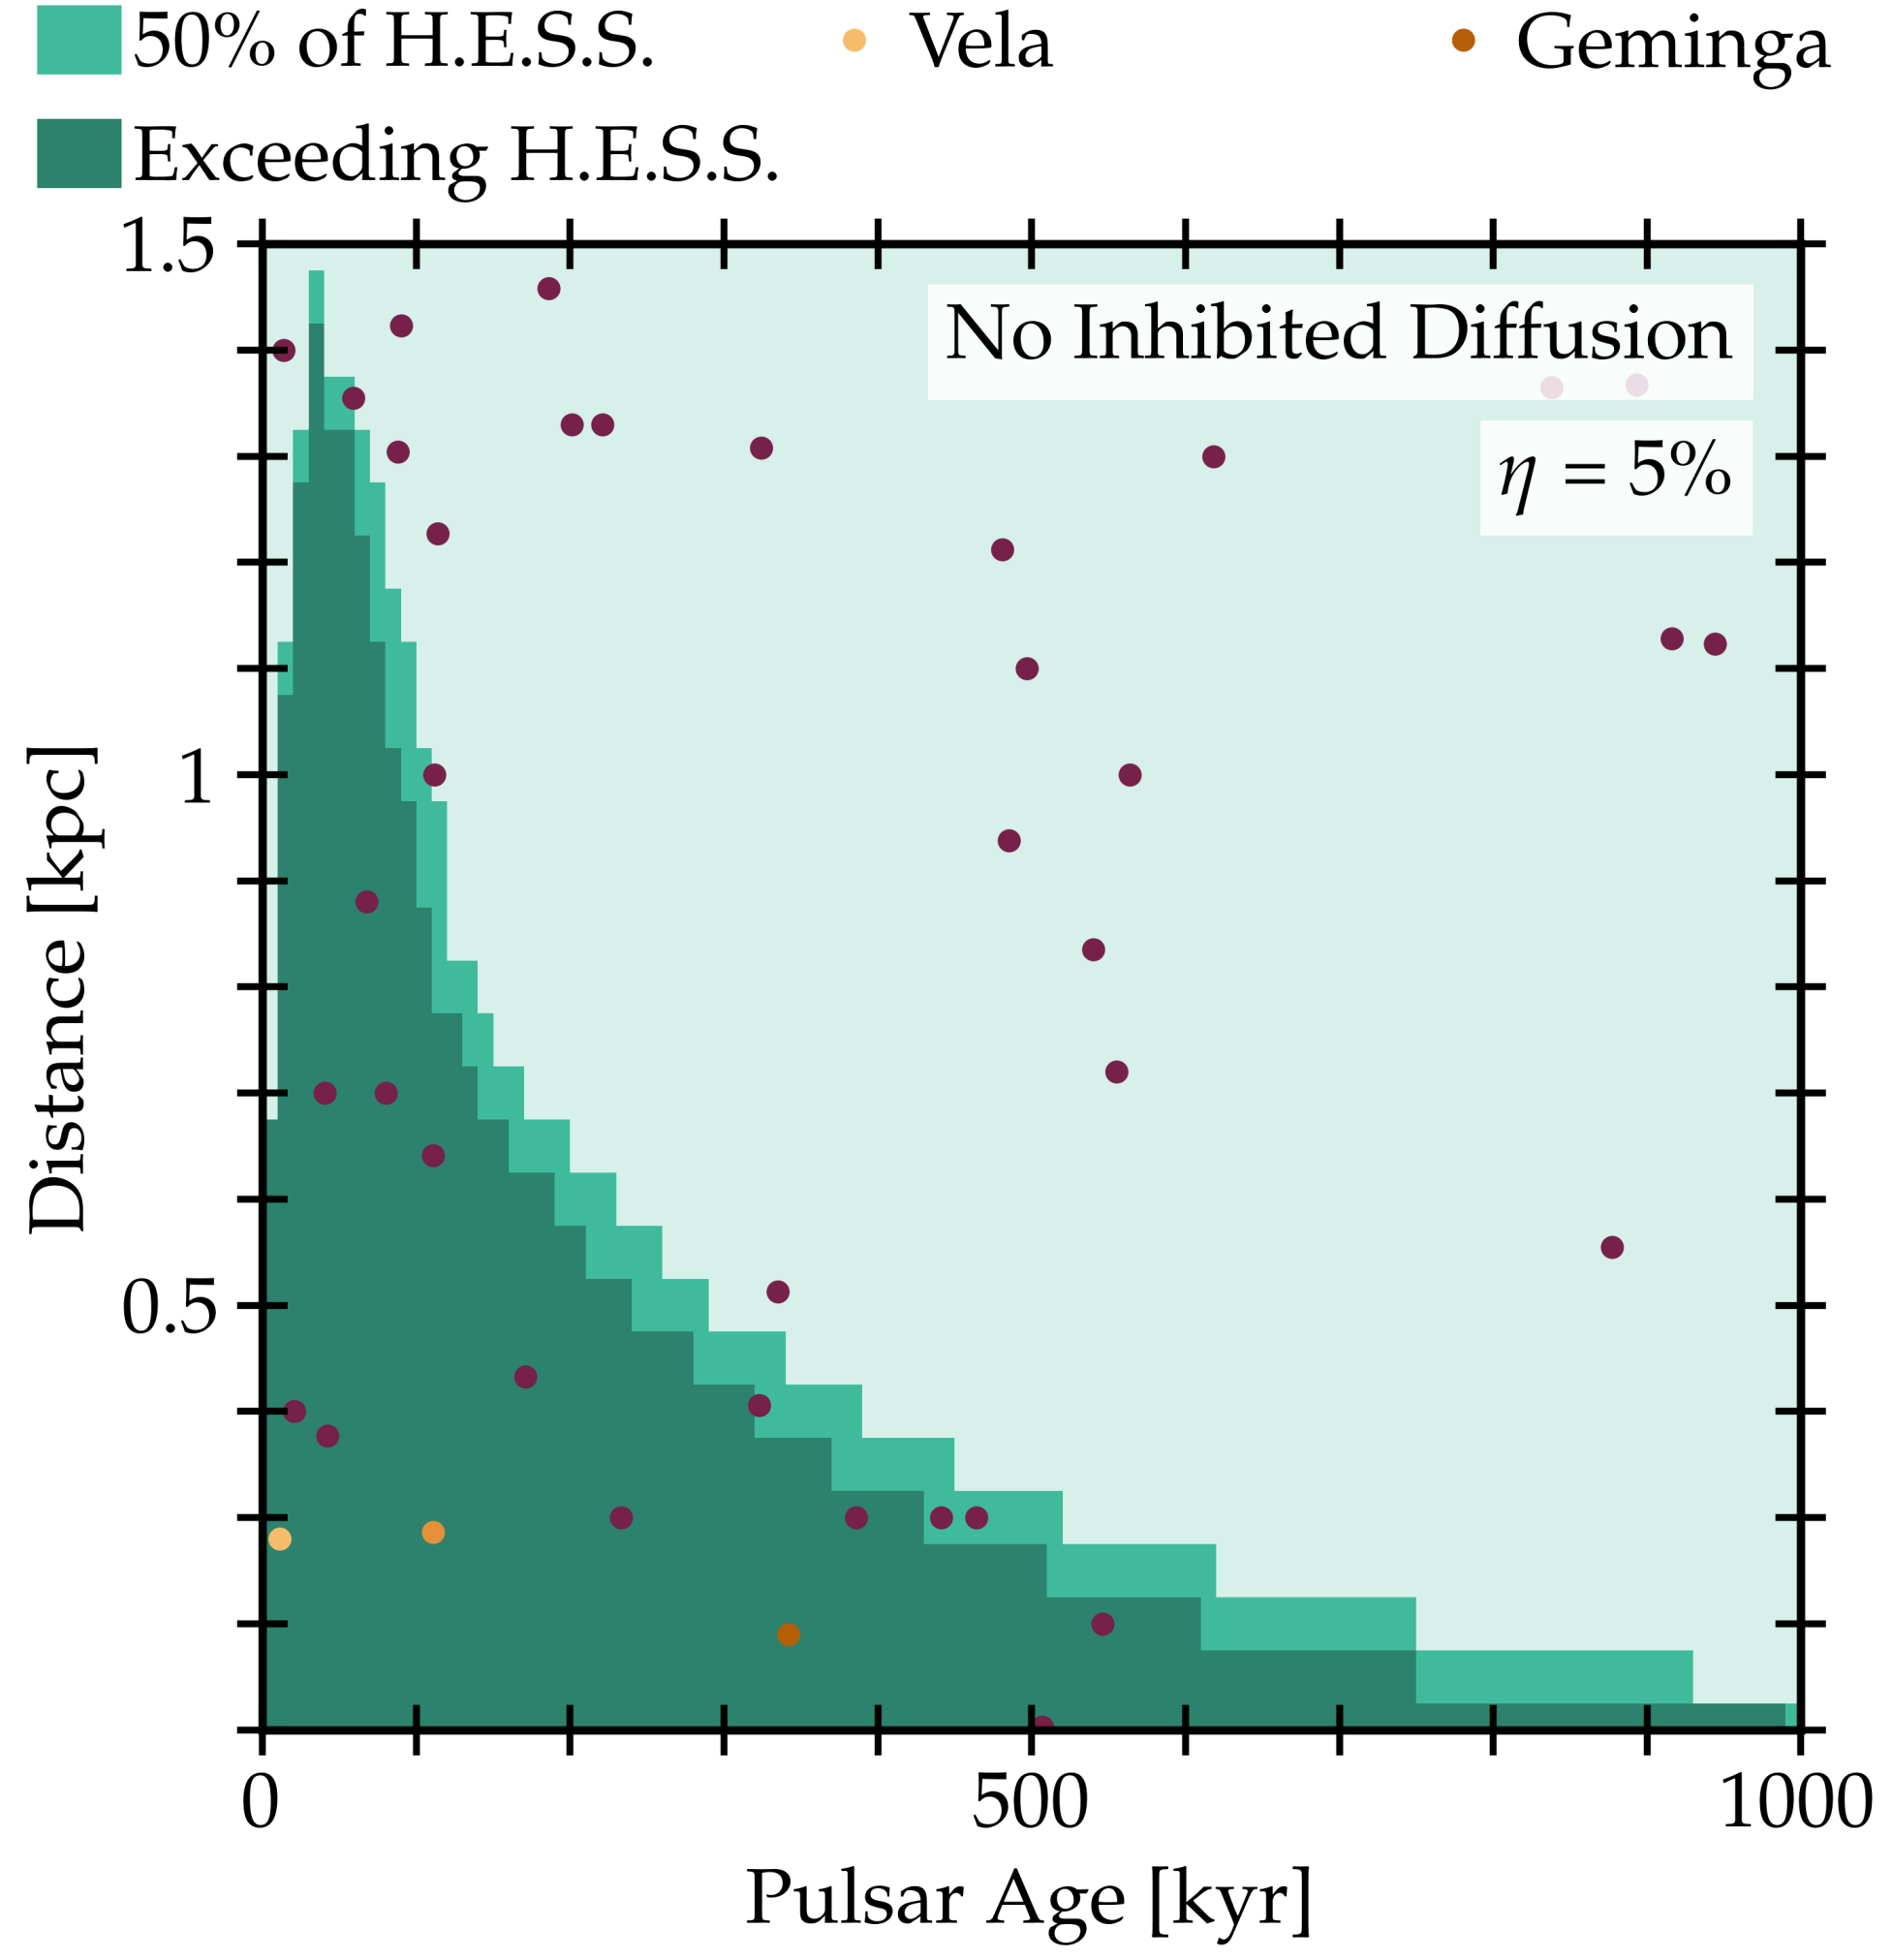
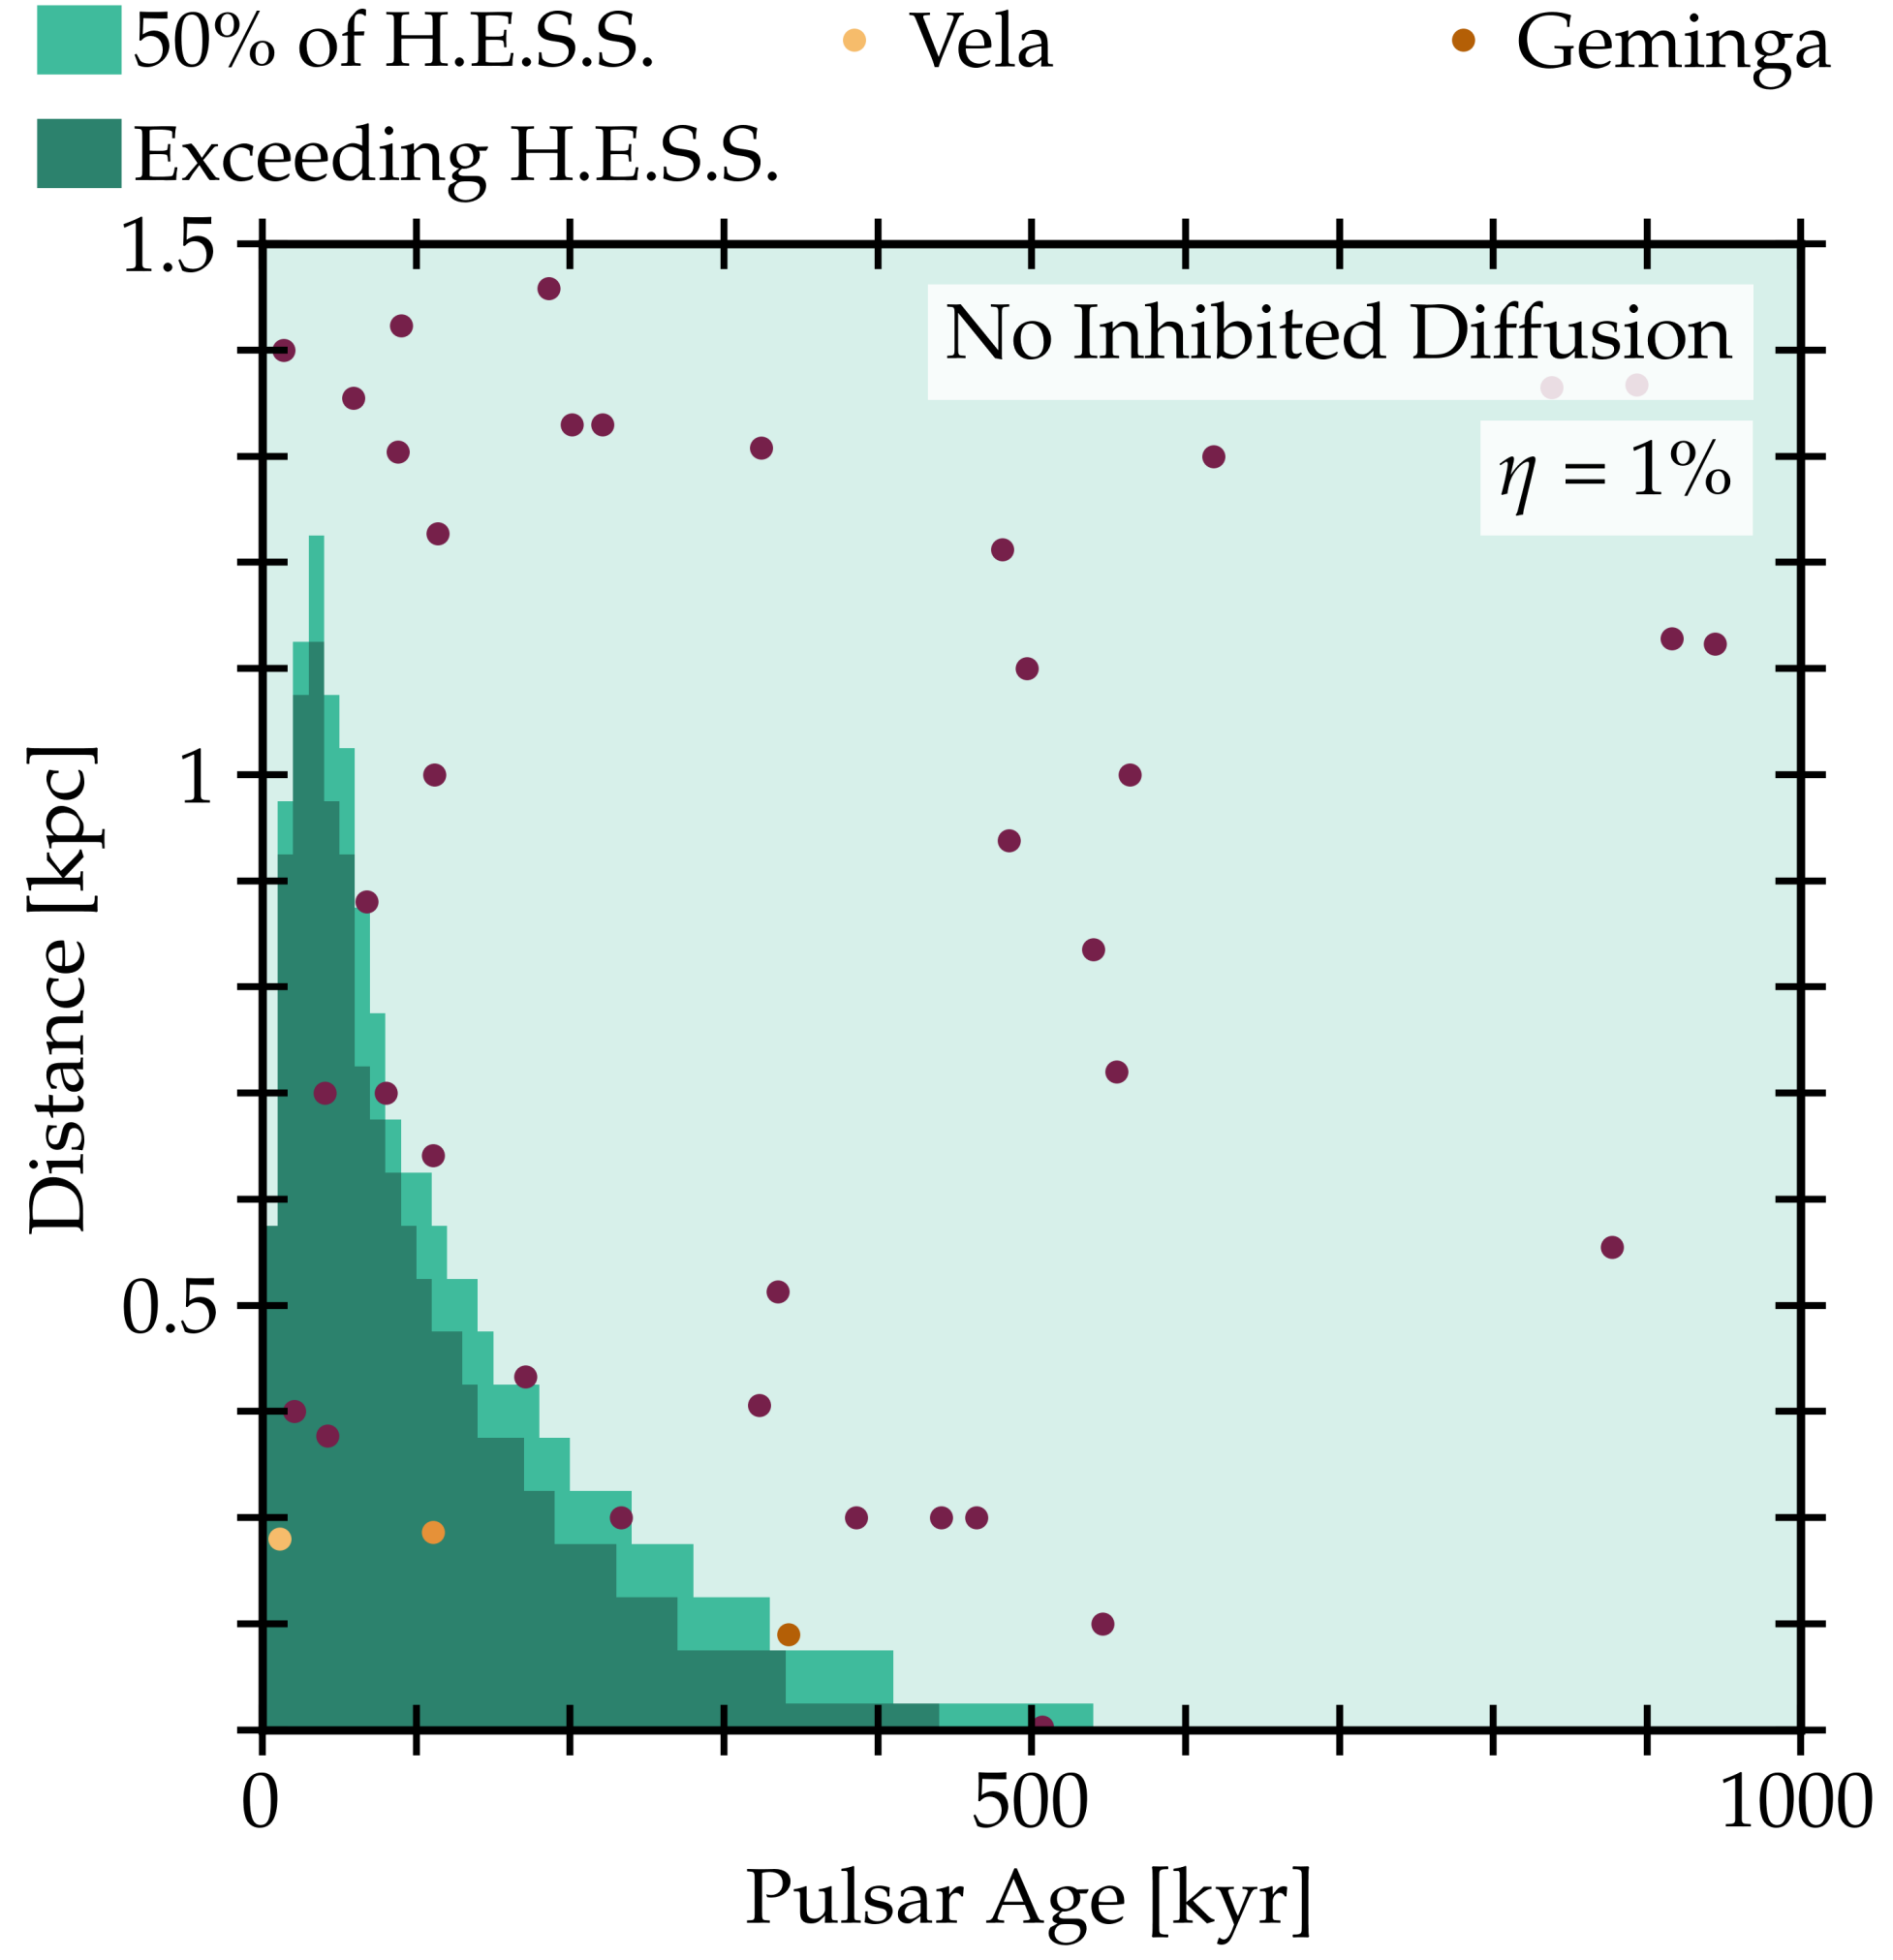
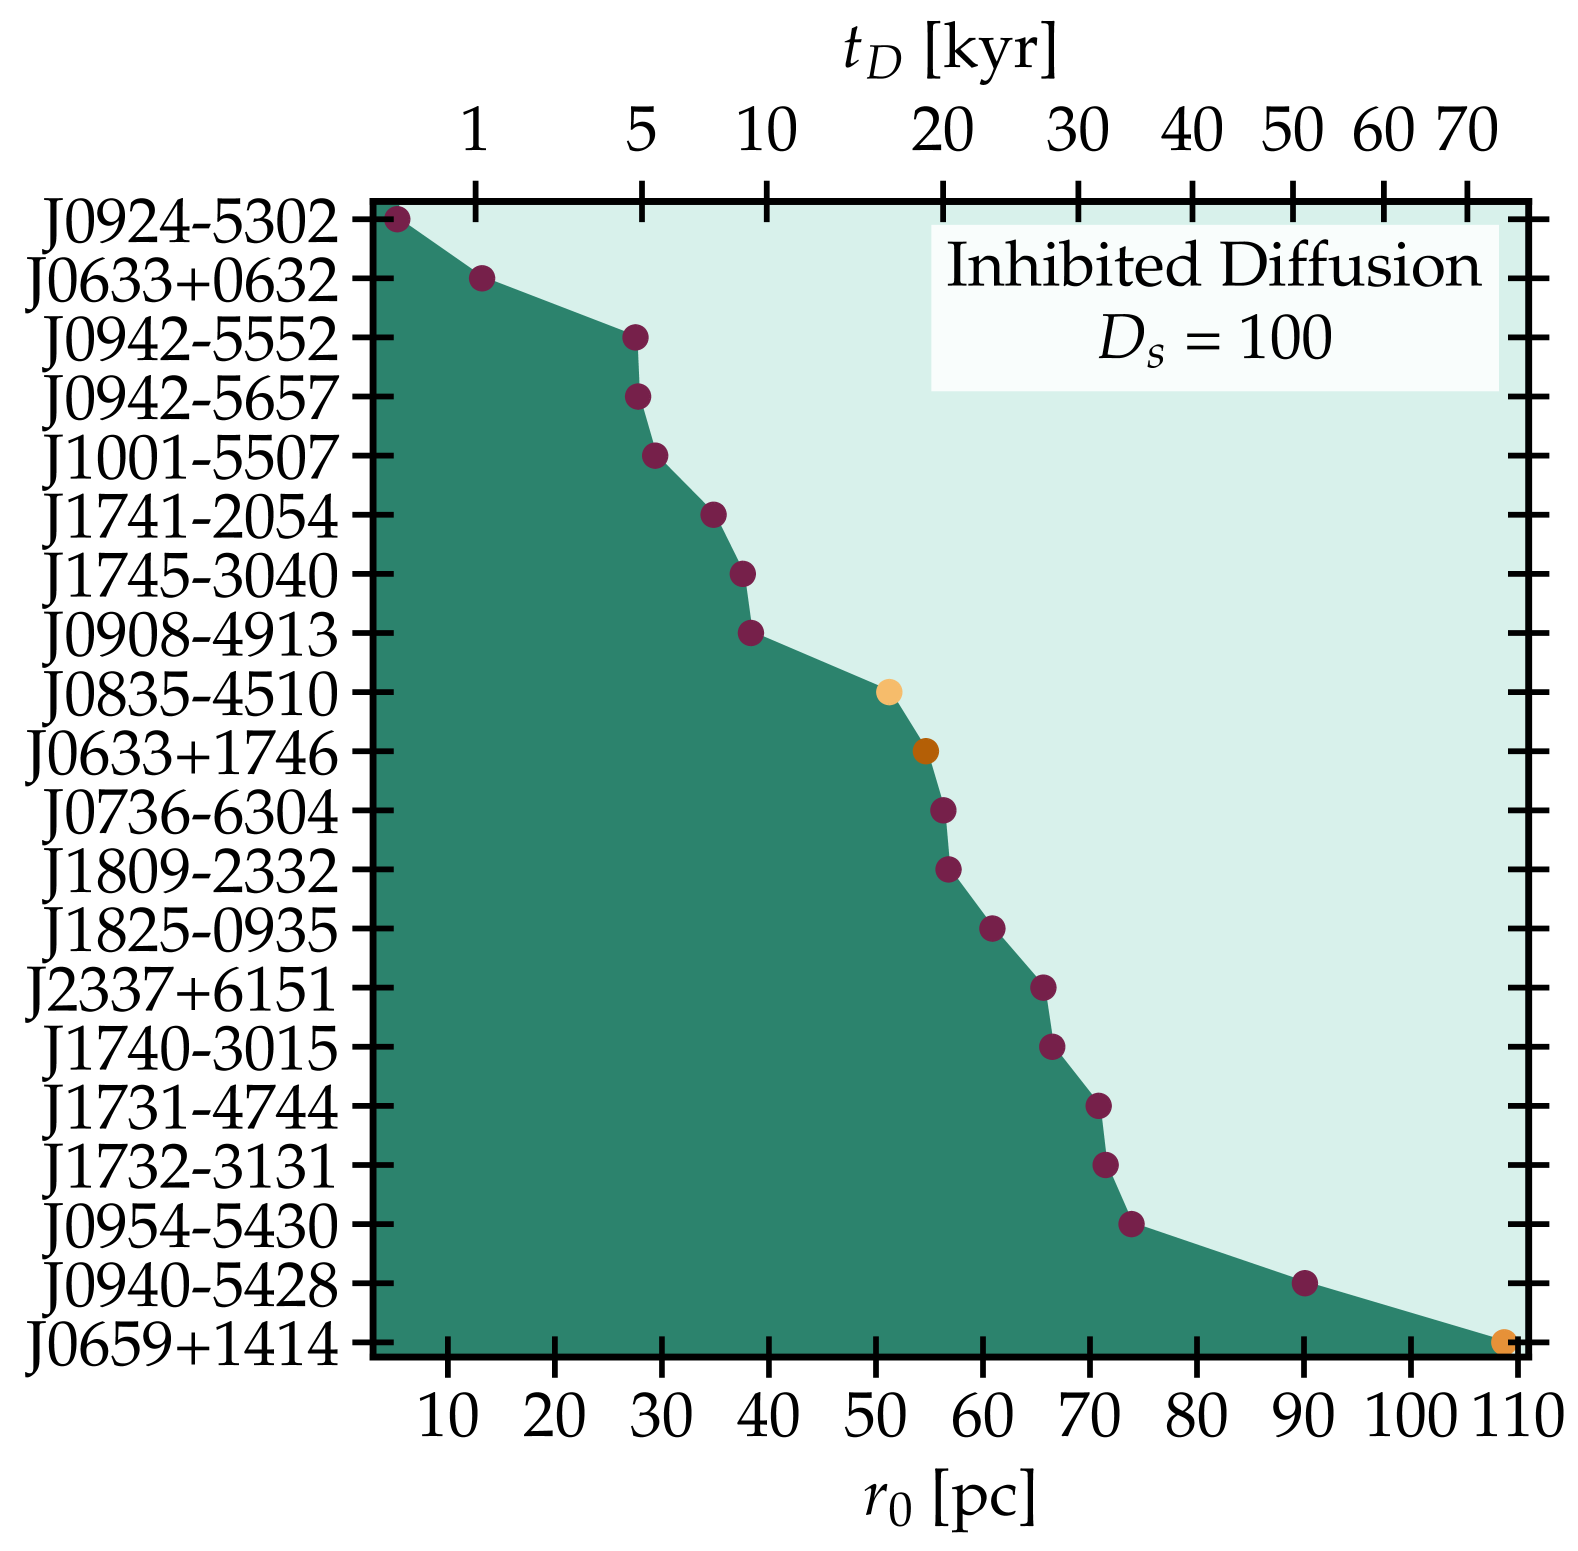
Figure 4 shows how strongly diffusion must be suppressed for each of the 20 ATNF pulsars that overproduce the H.E.S.S. data in one-zone models. In this figure, we use the exact ages and distances for each pulsar. We note that the degree to which diffusion is suppressed and the size of the inhibited diffusion zone are degenerate. Thus, we fix the suppression factor to and vary the size of the diffusion zone until the pulsar no longer overproduces H.E.S.S. data. The radius of inhibited diffusion can be smaller if diffusion is more strongly suppressed. In the top axis, we use Eq. 14 to approximate the time that a 10 TeV spends in the inhibited diffusion region. For comparison, if diffusion is not inhibited, a 10 TeV traverses 50 pc in only yr.
Fig. 4 shows that must be trapped for more than 20 kyr in many systems, though the exact timescale varies. For example, 10-TeV from Monogem (J0559+1414) must be confined in a low diffusion region for at least 75 kyr, while from Geminga (J0633+1746) must only be confined for at least 20 kyr.
We stress that, throughout this analysis, we only compare each pulsar individually to the H.E.S.S. data, while ignoring contributions from other pulsars. This means that our results are extremely conservative. Within the context of a one-zone model, the combined flux from all ATNF pulsars in our study would overproduce the H.E.S.S. flux unless the average efficiency of the pulsars was less than 0.1%, which falls far short of the known efficiency of multiple PWN and TeV halos. Even this constraint is conservative, as it omits known contributions from mis-aligned pulsars [21] and high-energy electrons accelerated in supernova remnants [43, 44].
Detection of Misaligned Pulsars — Numerous studies have investigated the potential for a mis-aligned pulsar to be discovered fortuitously close to Earth [45, 46]. In Ref. [21], we showed that TeV halo observations provide a new potential method for detecting these pulsars. However, the detection of TeV halos around multiple sources did not require that all pulsars be surrounded by the necessary regions of inhibited diffusion (see also Ref. [13]). Here, we have shown that must be trapped for a significant duration around every energetic pulsar, which in turn requires that every energetic pulsar powers a bright PWN or TeV halo system.
In the supplemental material, we list the 20 nearby pulsars that overproduce the H.E.S.S. data within a one-zone diffusion model. We note that spatially extended emission has already been detected surrounding 12 of these systems, including every system in the northern hemisphere, which is better-covered at TeV energies. Our models indicate that the upcoming addition of CTA north and south [47, 48], as well as the proposed SWGO detector [49, 50], can potentially detect all remaining nearby pulsars, either providing new sources for novel probes of pulsar evolution and fundamental physics, or closing the possibility that such sources exist.
Summary and Outlook.— In this letter, we show that H.E.S.S. observations demand that a zone of inhibited diffusion must exist around every pulsar that is powerful and close enough to Earth. While observations of both PWN and TeV halos around pulsars clearly show that pulsars are able to accelerate to hundreds of TeV, the steep fall of the flux above 1 TeV measured by H.E.S.S. rules out the strong contributions at tens of TeV as suggested by one-zone diffusion models. Instead, these observations require a zone of inhibited diffusion around pulsars which allows the to lose energy in the vicinity of the pulsar before reaching Earth. Our results further show that any pulsar powerful enough to produce high-energy must be a bright source, either in radio, x-ray or -rays, which has either already been detected, or soon will be detected by telescopes such as HAWC and LHAASO, as well as upcoming instruments such as CTA and SWGO.
Acknowledgements.— Many thanks to Benedikt Schroer for enlightening discussions on the two-zone diffusion model. IJ acknowledges support from the Research grant TAsP (Theoretical Astroparticle Physics) funded by INFN, and Research grant “Addressing systematic uncertainties in searches for dark matter”, Grant No. 2022F2843L funded by the Italian Ministry of University and Research (mur). TL is supported by the Swedish Research Council under contract 2022-04283 and the Swedish National Space Agency under contract 117/19. TL also acknowledges sabbatical support from the Wenner- Gren foundation under contract SSh2024-0037.
Every Nearby Energetic Pulsar Is Surrounded by a Region of Inhibited Diffusion
Supplemental Material
Isabelle John, Tim Linden
I Selected ATNF Pulsars
In our analysis, we include every pulsar found in the ATNF pulsar catalog [35, 36] that is within 1.5 kpc of Earth and less than 1 Myr old. In Table S1, we list the 20 pulsars that individually overproduce the H.E.S.S. in a one-zone diffusion model (Fig. 2, top panel), together with observations of an inhibited diffusion zone, which can be a supernova remnant (SNR), pulsar wind nebula (PWN) or TeV halo.
| Pulsar | Age [kyr] | Distance [pc] | Inhibited Diffusion Zone |
|---|---|---|---|
| J0633+0632 | 59.2 | 1355 | PWN [51] |
| J0633+1746 | 342 | 190 | TeV halo [22] |
| J0659+1414 | 111 | 286 | TeV halo [22] |
| J0736-6304 | 507 | 103 | TeV halo candidate [45]111Ref. [45] finds hints for an extended -ray emission around J0736-6304 in the context of a different analysis. |
| J0835-4510 | 11.3 | 280 | TeV halo [27] |
| J0908-4913 | 112 | 1000 | SNR, PWN [52] |
| J0924-5302 | 335 | 513 | – |
| J0940-5428 | 42.2 | 377 | – |
| J0942-5552 | 464 | 300 | – |
| J0942-5657 | 323 | 406 | – |
| J0954-5430 | 171 | 433 | PWN candidate [53] |
| J1001-5507 | 441 | 300 | – |
| J1731-4744 | 80.4 | 700 | – |
| J1732-3131 | 111 | 641 | – |
| J1740-3015 | 20.6 | 400 | PWN, TeV halo [54] |
| J1741-2054 | 386 | 300 | PWN [55, 56] |
| J1745-3040 | 546 | 200 | SNR candidate [57] |
| J1809-2332 | 67.6 | 880 | SNR, PWN [58] |
| J1825-0935 | 233 | 300 | – |
| J2337+6151 | 40.6 | 700 | SNR [59] |
II Reduced Efficiency
In our standard scenario in the main text, we assume an efficiency of converting spindown power into pairs of , based on estimates of Geminga [9]. However, if Geminga is unusually bright, a lower efficiency might be favoured for other pulsars. We therefore also compare our pulsar models to the H.E.S.S. data assuming efficiencies of 5% and 1%. Fig. 3 show both scenarios in the one-zone diffusion model. Figure S1 shows the pulsar population for the two choices of the two-zone diffusion model, as in Fig. 2 for the 5% and 1% efficiencies, respectively. As can be seen, even for a significantly lower pulsar efficiency, that results in a lower flux, the one-zone diffusion model overproduces the data for 14 and 5 sources in the 5% and 1% scenario, respectively, requiring a zone of inhibited diffusion.
III Projection to Future Telescopes
Upcoming telescopes such as the Cherenkov Telescope Array (CTA) [47, 48] are expected to measure the flux even further to energies of hundreds of TeV. This will allow us to further constrain the flux from pulsars that dominantly contribute at energies of hundreds of TeV.
We project the potential constraints based on future CTA observations of the high-energy flux by extrapolating the H.E.S.S. data to PeV by following the powerlaw provided by [1] that describes the flux for energies above the 1-TeV break with a spectral index of .
We show our results in Figure S2, which is similar to Fig. 2, except that the light blue regions represent pulsars that exceed the in the extrapolated energy range. We find that CTA will be able to significantly constrain a much larger population of relatively old pulsars, though, at present there are no known pulsars which inhibit the age- and distance- range probed by CTA observations.

References
- Aharonian et al. [2024] F. Aharonian et al. (H.E.S.S.), Phys. Rev. Lett. 133, 221001 (2024), arXiv:2411.08189 [astro-ph.HE] .
- Adriani et al. [2013] O. Adriani et al. (PAMELA), Phys. Rev. Lett. 111, 081102 (2013), arXiv:1308.0133 [astro-ph.HE] .
- Aguilar et al. [2019a] M. Aguilar, L. Ali Cavasonza, G. Ambrosi, and et al. (AMS Collaboration), Phys. Rev. Lett. 122, 041102 (2019a).
- Aguilar et al. [2019b] M. Aguilar, L. Ali Cavasonza, B. Alpat, and et al. (AMS Collaboration), Phys. Rev. Lett. 122, 101101 (2019b).
- Hooper et al. [2009] D. Hooper, P. Blasi, and P. D. Serpico, JCAP 01, 025 (2009), arXiv:0810.1527 [astro-ph] .
- Profumo [2011] S. Profumo, Central Eur. J. Phys. 10, 1 (2011), arXiv:0812.4457 [astro-ph] .
- Malyshev et al. [2009] D. Malyshev, I. Cholis, and J. Gelfand, Phys. Rev. D 80, 063005 (2009), arXiv:0903.1310 [astro-ph.HE] .
- Linden and Profumo [2013] T. Linden and S. Profumo, Astrophys. J. 772, 18 (2013), arXiv:1304.1791 [astro-ph.HE] .
- Hooper et al. [2017] D. Hooper, I. Cholis, T. Linden, and K. Fang, Phys. Rev. D 96, 103013 (2017), arXiv:1702.08436 [astro-ph.HE] .
- Orusa et al. [2021] L. Orusa, S. Manconi, F. Donato, and M. Di Mauro, JCAP 12, 014 (2021), arXiv:2107.06300 [astro-ph.HE] .
- Cholis and Krommydas [2022] I. Cholis and I. Krommydas, Phys. Rev. D 105, 023015 (2022), arXiv:2111.05864 [astro-ph.HE] .
- Orusa et al. [2025] L. Orusa, S. Manconi, F. Donato, and M. Di Mauro, JCAP 02, 029 (2025), arXiv:2410.10951 [astro-ph.HE] .
- Profumo et al. [2018] S. Profumo, J. Reynoso-Cordova, N. Kaaz, and M. Silverman, Phys. Rev. D 97, 123008 (2018), arXiv:1803.09731 [astro-ph.HE] .
- Huang et al. [2018] Z.-Q. Huang, K. Fang, R.-Y. Liu, and X.-Y. Wang, Astrophys. J. 866, 143 (2018), arXiv:1807.04182 [astro-ph.HE] .
- Tang and Piran [2019] X. Tang and T. Piran, Mon. Not. Roy. Astron. Soc. 484, 3491 (2019), arXiv:1808.02445 [astro-ph.HE] .
- Evoli et al. [2018] C. Evoli, T. Linden, and G. Morlino, Phys. Rev. D 98, 063017 (2018), arXiv:1807.09263 [astro-ph.HE] .
- Di Mauro et al. [2019] M. Di Mauro, S. Manconi, and F. Donato, Phys. Rev. D 100, 123015 (2019), [Erratum: Phys.Rev.D 104, 089903 (2021)], arXiv:1903.05647 [astro-ph.HE] .
- Manconi et al. [2020] S. Manconi, M. Di Mauro, and F. Donato, Phys. Rev. D 102, 023015 (2020), arXiv:2001.09985 [astro-ph.HE] .
- Schroer et al. [2023] B. Schroer, C. Evoli, and P. Blasi, Phys. Rev. D 107, 123020 (2023), arXiv:2305.08019 [astro-ph.HE] .
- Fang [2024] K. Fang, Phys. Rev. D 109, 043041 (2024), arXiv:2310.16594 [astro-ph.HE] .
- Linden et al. [2017] T. Linden, K. Auchettl, J. Bramante, I. Cholis, K. Fang, D. Hooper, T. Karwal, and S. W. Li, Phys. Rev. D 96, 103016 (2017), arXiv:1703.09704 [astro-ph.HE] .
- Abeysekara et al. [2017] A. U. Abeysekara et al. (HAWC), Science 358, 911 (2017), arXiv:1711.06223 [astro-ph.HE] .
- Aharonian et al. [2023a] F. Aharonian et al. (H.E.S.S.), Astron. Astrophys. 673, A148 (2023a), arXiv:2304.02631 [astro-ph.HE] .
- Cao et al. [2024] Z. Cao et al. (LHAASO), Astrophys. J. Suppl. 271, 25 (2024), arXiv:2305.17030 [astro-ph.HE] .
- Fang et al. [2018] K. Fang, X.-J. Bi, P.-F. Yin, and Q. Yuan, Astrophys. J. 863, 30 (2018), arXiv:1803.02640 [astro-ph.HE] .
- Albert et al. [2024] A. Albert, R. Alfaro, C. Alvarez, J. C. Arteaga-Velázquez, D. Avila Rojas, H. A. Ayala Solares, R. Babu, E. Belmont-Moreno, A. Bernal, K. S. Caballero-Mora, T. Capistrán, A. Carramiñana, S. Casanova, U. Cotti, J. Cotzomi, S. Coutiño de León, E. de la Fuente, D. Depaoli, N. Di Lalla, R. Diaz Hernandez, B. L. Dingus, M. A. DuVernois, M. Durocher, J. C. Díaz-Vélez, K. Engel, C. Espinoza, K. L. Fan, K. Fang, N. Fraija, J. A. García-González, F. Garfias, H. Goksu, M. M. González, J. A. Goodman, S. Groetsch, J. P. Harding, S. Hernández-Cadena, I. Herzog, P. Hüntemeyer, D. Huang, F. Hueyotl-Zahuantitla, A. Iriarte, V. Joshi, S. Kaufmann, D. Kieda, A. Lara, W. H. Lee, J. Lee, H. León Vargas, J. T. Linnemann, A. L. Longinotti, G. Luis-Raya, K. Malone, O. Martinez, J. Martínez-Castro, J. A. Matthews, P. Miranda-Romagnoli, J. A. Montes, J. A. Morales-Soto, E. Moreno, M. Mostafá, A. Nayerhoda, L. Nellen, R. Noriega-Papaqui, L. Olivera-Nieto, N. Omodei, Y. Pérez Araujo, E. G. Pérez-Pérez, C. D. Rho, D. Rosa-González, H. Salazar, D. Salazar-Gallegos, A. Sandoval, M. Schneider, G. Schwefer, J. Serna-Franco, Y. Son, R. W. Springer, O. Tibolla, K. Tollefson, I. Torres, R. Torres-Escobedo, R. Turner, F. Urea-Mena, E. Varela, L. Villaseñor, X. Wang, I. J. Watson, E. Willox, H. Wu, S. Yun-Cárcamo, H. Zhou, C. de León, and M. Di Mauro, ApJ 974, 246 (2024).
- Sudoh et al. [2019] T. Sudoh, T. Linden, and J. F. Beacom, Phys. Rev. D 100, 043016 (2019), arXiv:1902.08203 [astro-ph.HE] .
- Aharonian et al. [2021] F. Aharonian et al. (LHAASO), Phys. Rev. Lett. 126, 241103 (2021), arXiv:2106.09396 [astro-ph.HE] .
- Albert et al. [2021] A. Albert et al. (HAWC), Astrophys. J. Lett. 911, L27 (2021), arXiv:2101.07895 [astro-ph.HE] .
- Aharonian et al. [2023b] F. Aharonian et al. (H.E.S.S.), Astron. Astrophys. 672, A103 (2023b), arXiv:2302.13663 [astro-ph.HE] .
- Hooper and Linden [2018] D. Hooper and T. Linden, Phys. Rev. D 98, 083009 (2018), arXiv:1711.07482 [astro-ph.HE] .
- Vink [2012] J. Vink, A&A Rev. 20, 49 (2012), arXiv:1112.0576 [astro-ph.HE] .
- Gaensler and Slane [2006] B. M. Gaensler and P. O. Slane, Ann. Rev. Astron. Astrophys. 44, 17 (2006), arXiv:astro-ph/0601081 .
- Mitchell and Gelfand [2022] A. M. W. Mitchell and J. Gelfand, (2022), 10.1007/978-981-16-4544-0_157-1, arXiv:2208.11026 [astro-ph.HE] .
- Manchester et al. [2005] R. N. Manchester, G. B. Hobbs, A. Teoh, and M. Hobbs, Astron. J. 129, 1993 (2005), arXiv:astro-ph/0412641 .
- [36] “ATNF Pulsar Catalogue Website,” http://www.atnf.csiro.au/research/pulsar/psrcat.
- Osipov et al. [2020] S. M. Osipov, A. M. Bykov, A. E. Petrov, and V. I. Romansky, J. Phys. Conf. Ser. 1697, 012009 (2020).
- John and Linden [2023] I. John and T. Linden, Phys. Rev. D 107, 103021 (2023), arXiv:2206.04699 [astro-ph.HE] .
- Porter et al. [2008] T. A. Porter, I. V. Moskalenko, A. W. Strong, E. Orlando, and L. Bouchet, Astrophys. J. 682, 400 (2008), arXiv:0804.1774 [astro-ph] .
- Korsmeier and Cuoco [2022] M. Korsmeier and A. Cuoco, Phys. Rev. D 105, 103033 (2022), arXiv:2112.08381 [astro-ph.HE] .
- Di Mauro et al. [2024] M. Di Mauro, M. Korsmeier, and A. Cuoco, Phys. Rev. D 109, 123003 (2024), arXiv:2311.17150 [astro-ph.HE] .
- Di Mauro et al. [2020] M. Di Mauro, S. Manconi, and F. Donato, Phys. Rev. D 101, 103035 (2020), arXiv:1908.03216 [astro-ph.HE] .
- Kobayashi et al. [2004] T. Kobayashi, Y. Komori, K. Yoshida, and J. Nishimura, Astrophys. J. 601, 340 (2004), arXiv:astro-ph/0308470 .
- Morlino and Celli [2021] G. Morlino and S. Celli, Mon. Not. Roy. Astron. Soc. 508, 6142 (2021), arXiv:2106.06488 [astro-ph.HE] .
- Lloyd et al. [2019] S. J. Lloyd, P. M. Chadwick, and A. M. Brown, Phys. Rev. D 100, 063005 (2019), arXiv:1908.03413 [astro-ph.HE] .
- Baryakhtar et al. [2017] M. Baryakhtar, J. Bramante, S. W. Li, T. Linden, and N. Raj, Phys. Rev. Lett. 119, 131801 (2017), arXiv:1704.01577 [hep-ph] .
- [47] “https://www.cta-observatory.org,” .
- Knödlseder [2020] J. Knödlseder (CTA Consortium), in 16th Rencontres du Vietnam: Theory meeting experiment: Particle Astrophysics and Cosmology (2020) arXiv:2004.09213 [astro-ph.IM] .
- [49] “https://www.swgo.org/swgowiki/doku.php,” .
- Schoorlemmer [2020] H. Schoorlemmer (SWGO), PoS ICRC2019, 785 (2020), arXiv:1908.08858 [astro-ph.HE] .
- Danilenko et al. [2020] A. Danilenko, A. Karpova, D. Ofengeim, Y. Shibanov, and D. Zyuzin, Mon. Not. Roy. Astron. Soc. 493, 1874 (2020), arXiv:2001.10968 [astro-ph.HE] .
- Johnston and Lower [2021] S. Johnston and M. E. Lower, Mon. Not. Roy. Astron. Soc. 507, L41 (2021), arXiv:2108.09827 [astro-ph.HE] .
- Ding et al. [2021] Y.-C. Ding, N. Li, C.-C. Wei, Y.-L. Wu, and Y.-F. Zhou, Phys. Rev. D 103, 115010 (2021), arXiv:2007.00703 [astro-ph.HE] .
- Kargaltsev and Pavlov [2010] O. Kargaltsev and G. G. Pavlov, in X-ray Astronomy 2009; Present Status, Multi-Wavelength Approach and Future Perspectives, American Institute of Physics Conference Series, Vol. 1248, edited by A. Comastri, L. Angelini, and M. Cappi (AIP, 2010) pp. 25–28, arXiv:1002.0885 [astro-ph.HE] .
- Camilo et al. [2009] F. Camilo, P. S. Ray, S. M. Ransom, M. Burgay, T. J. Johnson, M. Kerr, E. V. Gotthelf, J. P. Halpern, J. Reynolds, R. W. Romani, P. Demorest, S. Johnston, W. van Straten, P. M. Saz Parkinson, M. Ziegler, M. Dormody, D. J. Thompson, D. A. Smith, A. K. Harding, A. A. Abdo, F. Crawford, P. C. C. Freire, M. Keith, M. Kramer, M. S. E. Roberts, P. Weltevrede, and K. S. Wood, ApJ 705, 1 (2009), arXiv:0908.2626 [astro-ph.GA] .
- Marelli et al. [2014] M. Marelli, A. Belfiore, P. Saz Parkinson, P. Caraveo, A. De Luca, C. Sarazin, D. Salvetti, G. R. Sivakoff, and F. Camilo, Astrophys. J. 790, 51 (2014), arXiv:1404.1532 [astro-ph.HE] .
- Aharonian [2008] F. Aharonian (H.E.S.S.), Astron. Astrophys. 483, 509 (2008), arXiv:0803.2844 [astro-ph] .
- Van Etten et al. [2012] A. Van Etten, R. W. Romani, and C.-Y. Ng, The Astrophysical Journal 755, 151 (2012).
- Furst et al. [1993] E. Furst, W. Reich, and J. H. Seiradakis, A&A 276, 470 (1993).
- Mukhopadhyay and Linden [2022] P. Mukhopadhyay and T. Linden, Phys. Rev. D 105, 123008 (2022), arXiv:2111.01143 [astro-ph.HE] .
- Fang et al. [2019] K. Fang, X.-J. Bi, and P.-F. Yin, Mon. Not. Roy. Astron. Soc. 488, 4074 (2019), arXiv:1903.06421 [astro-ph.HE] .