22institutetext: Department of Oncology, University of Cambridge, UK 33institutetext: CRUK Cambridge Centre, University of Cambridge, UK
33email: niuyi@stu.xjtu.edu.cn
ST-Prompt Guided Histological Hypergraph Learning for Spatial Gene Expression Prediction
Abstract
Spatial Transcriptomics (ST) reveals the spatial distribution of gene expression in tissues, offering critical insights into biological processes and disease mechanisms. However, predicting ST from H&E-stained histology images is challenging due to the heterogeneous relationship between histomorphology and gene expression, which arises from substantial variability across different patients and tissue sections. A more practical and valuable approach is to utilize ST data from a few local regions to predict the spatial transcriptomic landscape across the remaining regions in H&E slides. In response, we propose PHG2ST, an ST-prompt guided histological hypergraph learning framework, which leverages sparse ST signals as prompts to guide histological hypergraph learning for global spatial gene expression prediction. Our framework fuses histological hypergraph representations at multiple scales through a masked ST-prompt encoding mechanism, improving robustness and generalizability. Benchmark evaluations on two public ST datasets demonstrate that PHG2ST outperforms the existing state-of-the-art methods and closely aligns with the ground truth. These results underscore the potential of leveraging sparse local ST data for scalable and cost-effective spatial gene expression mapping in real-world biomedical applications.
Keywords:
Spatial Transcriptomics Hypergraph Learning Prompt.1 Introduction
Spatial Transcriptomics (ST) enables the spatially resolved quantification of gene expression [8]. By integrating transcriptomic information with histological context, ST provides a powerful tool for exploring the molecular mechanisms underlying complex biological processes, such as tumor heterogeneity and immune response regulation [26, 20, 24]. However, despite its transformative potential, large-scale applications of ST remain highly constrained by the high cost, labor-intensive experimental procedures [22]. Given these constraints, computational pathology models that leverage routinely available H&E-stained whole slide images (WSIs) to infer ST profiles are being actively explored as a potential avenue [17].
Various methods have been proposed to predict ST from histological images, ranging from histological-spot-based approaches [25, 9] to models that capture broader spatial dependencies using Transformers and graph neural networks (GNNs) [23, 28, 14, 18]. Some methods further enhance prediction by leveraging advanced deep learning techniques. BLEEP employs contrastive learning to align spatial gene expression with histological features [27], while TRIPLEX demonstrates the effectiveness of multi-scale feature extraction for ST prediction [6]. One major challenge is the complex, multi-scale relationship between tissue phenotype and gene expression, where traditional methods struggle to capture both hierarchical spatial structures and long-range dependencies, particularly in WSI settings [7, 4, 21]. Additionally, substantial variability across patients and tissue sections induces a severe domain shift in the tissue phenotype–gene expression relationship, further exacerbated by the limited scale of existing ST datasets [12]. A more fundamental challenge lies in the gap between existing ST prediction settings and real-world application needs. Due to technical and cost limitations, ST profiling is often restricted to small tissue regions, while high dropout rates further degrade data quality. Thus, the focus shifts to imputing missing data [15, 19] or using limited local ST profiles to infer expression across remaining regions.
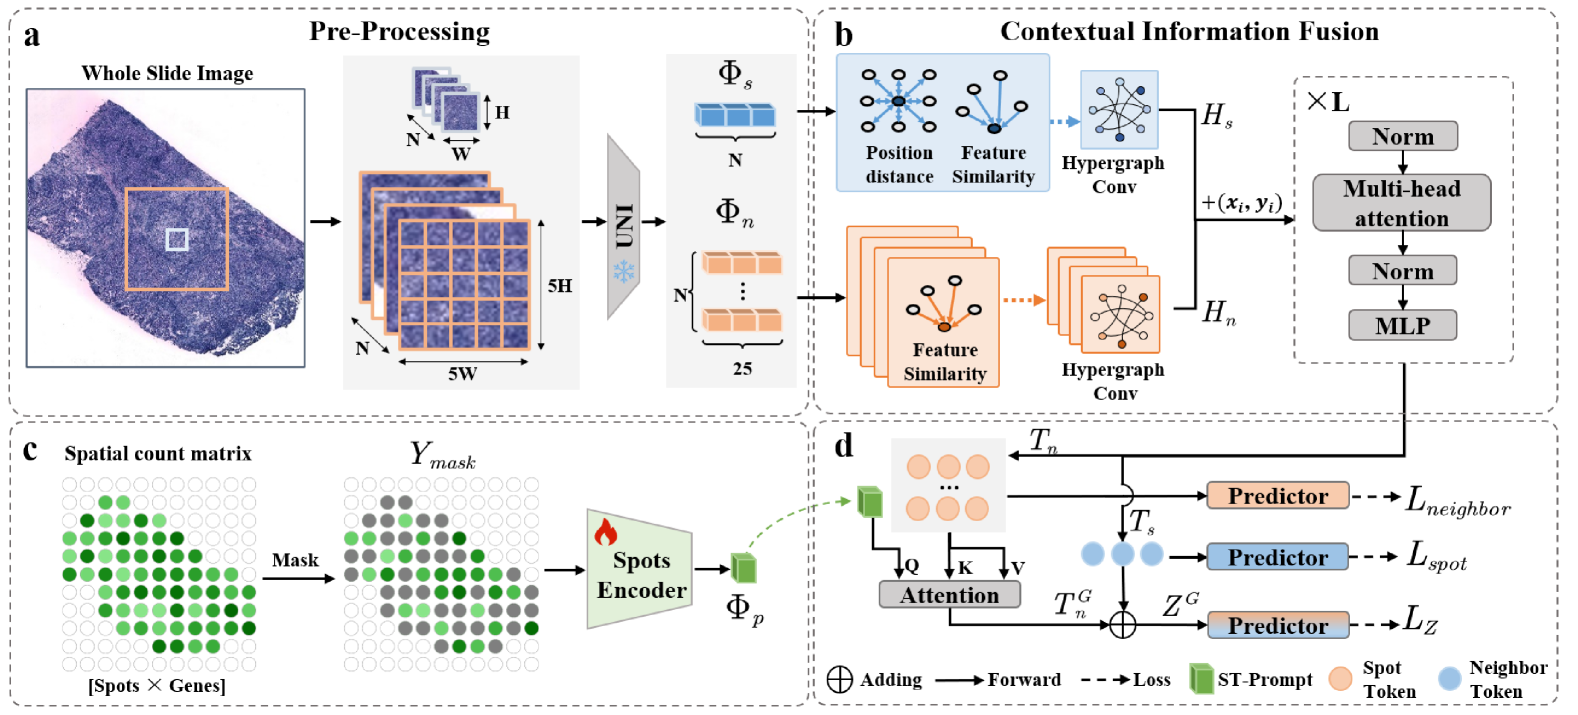
To address these limitations and better align ST prediction with real-world applications, we propose a fundamental shift in task formulation. Rather than training on a fixed WSI-ST dataset and testing on unseen WSIs, we introduce an inference-time prompting paradigm, where ST data from a subset of known spots per WSI guides the ST prediction across the remaining regions. Under this setting, we introduce PHG2ST, an ST prompt-guided histological hypergraph learning framework for enhancing spatial gene expression prediction in WSIs. PHG2ST integrates dual-scale histological features with a hypergraph network, capturing critical high-order relationships between neighboring spots. Specifically, we construct a spot hypergraph at the slide level, aggregating feature representations of hypernodes within the WSI field of view. Additionally, we construct hyper-subgraphs for each spot and its surrounding neighbors, aggregating neighboring node representations within the local region. Finally, a cross-attention mechanism refines neighboring representations by aligning them with ST prompts, ensuring a strong correlation with the known ST data. In this way, PHG2ST utilizes readily available WSIs and a few spots with known gene expression to infer ST across the entire slide. We evaluated PHG2ST on two benchmark datasets, where it consistently outperformed existing models in all metrics. Visualizations of predicted gene expression further confirm its accuracy and potential for scalable, cost-effective ST analysis in real-world applications.
2 Related Work
2.1 Spatial Gene Expression Prediction
ST uses microarray technology to preserve tissue location information on a chip and uses second-generation sequencing to analyze mRNA within the tissue sample. By overlaying the sequencing data back onto the tissue image, a comprehensive gene expression map of the tissue section is generated [29]. The prediction task is modeled as a multi-output regression problem, using histological images as inputs and gene expression as labels. Previous works have explored various modules for this task. ST-Net uses DenseNet101 [11] to extract image embeddings for each spot and employs a linear layer for classification [9]. HisToGene [23] utilizes Vision Transformer [1] to learn relationships between spots. BLEEP [27] introduces contrastive learning to predict the gene expression of query spots by retrieving similar gene expression profiles from the training set. Hist2ST [28] makes an attempt to graph neural networks. HGGEP [18] uses a hypergraph among multiple latent stage features to form the global association. Recently, TRIPLEX [6] achieved promising results by fusing multi-scale histological images through cross-attention, highlighting the importance of spot and neighboring information for gene expression prediction. Previous work has relied entirely on mapping histological images to ST data, often leading to suboptimal accuracy. In contrast, we incorporate ST prompts from limited regions to guide prediction, achieving more precise spatial gene expression mapping that better aligns with real-world scenarios.
2.2 Benchmark Setting for ST Prediction
In the ST prediction task, due to data scarcity, most studies [23, 28, 18] employ the leave-one-out strategy. Current ST datasets often contain multiple sections from the same tissue region of the same patient. This can lead to the performance being overestimated, as models are frequently trained and tested on the same patients. TRIPLEX [6] emphasized the importance of cross-validation and established a new benchmark to evaluate previous methods. Based on this benchmark, we introduce an inference-time prompting paradigm, where a small subset of spot expressions is known in each WSI during testing. Fine-tuning was applied on all comparison methods except BLEEP, using 10% known ST spots per WSI from the test set. Further details are described in the experiment section.
3 Method
3.1 Overview
Our task is defined as a multi-output regression problem. Given a set of spot images from a WSI, denoted as , our goal is to predict the gene expression for each spot, represented as . Here is the number of spots in the WSI, is the number of genes for which are to be predicted, and and are the height and width of the spot images, respectively. We show the overall framework in Fig 1.
3.2 Feature Extraction and ST-Prompt Embedding
3.2.1 Feature Extraction
Our proposed method extracts both spot and neighboring histological features from each individual WSI spot image . We employ UNI [5] as the feature extractor, spot features are directly obtained from the spot image, denotes the embedding dimension.
Neighboring features are derived from the surrounding region of the target spot. Specifically, we concatenate the features of all spots within a region around each target spot to obtain the neighboring features .
3.2.2 Spatial Transcriptomics Prompt Embedding
We randomly mask a portion of the spots in the spatial gene expression count matrix. Specifically, a randomly selected proportion of spots gene expression values are set to zero. We then utilize a novel defined learnable Prompt Projection module to transform this masked expression matrix into prompt features :
| (1) |
where is the linear projection operation parameter matrix, and denotes the activation function, e.g., GELU [10]. denotes the dropout operation and denotes the layer normalization operation.
3.3 Hypergraph Neural Network module
3.3.1 Spot and Neighboring Hypergraph Construction
To flexibly explore the multiple relationships among spots, we employ hypergraph networks [3] to capture the high-order neighboring dependencies of histological image spots at two scales. For spot features, in order to simulate connections between spots with similar semantic content, we calculate the pairwise Euclidean distances between all spot features as a measure of feature similarity. The similarity between spot and is defined as: . and denotes the feature of and at dimention.
Given that spatially adjacent spots generally exhibit similar genetic phenotypes, we establish positional distances based on the spatial coordinates of the spots. The positional distances between spot and is defined as: . and denotes the normalized coordinates of spot and .
We normalize and combine the feature similarity and positional distance to construct the incidence matrix of the hypergraph:
| (2) |
where is the normalization operation. Based on this incidence matrix, we identify the K nearest neighbors for each spot to construct the hyperedges.
Distinct from the spot hypergraph construction, the neighboring hypergraph is constructed within the neighborhood of each spot. We directly compute the Euclidean distance between neighboring features as the incidence matrix and select the K nearest neighbors to form hyperedges. It is important to note that the neighboring hypergraph comprises sub-hypergraphs. We then employ HypergraphConv to aggregate spot features with their shared hyperedge spots, using the values of the incidence matrix as hyperedge weights. The resulting spot and neighboring features after hypergraph processing can be represented as:
| (3) |
| (4) |
3.4 Integrating ST-Prompts and Histological Hypergraphs
While graph neural networks excel at fusing neighboring spot features, they are limited in capturing long-range dependencies between spots. To further integrate the global representation of histological features, we apply Vision Transformer blocks to the spot and neighboring features after hypergraph convolution. The multi-head attention mechanism allows our model to effectively model feature interactions between spot and neighboring representations at global level. The resulting representations of the spot and neighboring tokens are and .
The spot representation, derived from the slide-level hypergraph, incorporates more flexible and specific semantic information. Conversely, the neighbor-level hypergraph, operating within the spot neighborhood, yields a smoother representation. To better capture the relationship between histological visual features and spatial gene expression by leveraging ST-prompt guidance, we implement a cross-attention layer. The features derived from the ST-prompt serve as query, while the neighboring features from the WSI serve as keys and values for the attention mechanism. The attention-guided features are then integrated through an additive operation to obtain the final feature representation:
| (5) |
| (6) |
where indicates the guided neighboring features, and denotes the integrated feature representation. By means of this mechanism, the ST-prompt facilitates the iterative and localized refinement of neighboring features, culminating in a global update across the entire image.
We calculate the MSE loss between prediction and the labels, then use a weighted sum to obtain the final loss:
| (7) |
where and represent the label and prediction of the gene () obtained by a fully connected layer to . We also compute the loss using the fused spot and neighboring representations, the final loss is balanced the different losses with a hyperparameter :
| (8) |
| (9) |
| (10) |
where and represent the spot and neighboring prediction obtained by a fully connected layer to and respectively.
| Model | HER2+ | cSCC | ||||
|---|---|---|---|---|---|---|
| MAE(↓) | CCC(↑) | PCC(↑) | MAE(↓) | CCC(↑) | PCC(↑) | |
| ST-Net | 0.6540.065 | 0.1290.092 | 0.1870.116 | 0.6990.125 | 0.2480.048 | 0.3070.052 |
| HisToGene | 0.6560.054 | 0.1040.058 | 0.1760.092 | 1.0810.105 | 0.0790.029 | 0.2380.047 |
| Hist2ST | 0.6790.075 | 0.1060.070 | 0.2010.117 | 1.0760.108 | 0.0780.044 | 0.2240.067 |
| HGGEP | 0.6430.067 | 0.1230.081 | 0.1900.094 | 0.7360.161 | 0.1250.096 | 0.1730.084 |
| BLEEP | 0.7420.049 | 0.1770.010 | 0.2020.046 | 0.9130.101 | 0.1700.009 | 0.1740.008 |
| TRIPLEX | 0.5430.110 | 0.2250.131 | 0.3180.147 | 0.7020.306 | 0.2630.130 | 0.4310.060 |
| PHG2ST | 0.5160.096 | 0.2560.148 | 0.3380.139 | 0.6980.320 | 0.3120.147 | 0.4790.103 |
4 Experiments and Results
4.1 Experimental Settings
4.1.1 Dataset
We utilized two widely used spatial transcriptomics datasets from the 10X Genomics platform: human HER2-positive breast cancer (HER2+) [2] and human cutaneous squamous cell carcinoma (cSCC) [13]. The HER2+ dataset comprises 36 samples from 8 breast cancer patients, while the cSCC dataset includes 12 samples from 4 patients. We considered only the top 1,000 highly variable genes for each dataset [23]. Gene counts were then normalized by dividing by the total count across all genes, multiplying by 1,000,000, and applying a natural log transformation. After processing, the HER2+ dataset contained 785 genes, and the cSCC dataset contained 171 genes. The total counts of spots in HER2+ and cSCC datasets are 13,620 and 23,205.
4.1.2 Implementation Details and Evaluation Metrics
For WSI preprocessing, each spot was cropped into a 224×224 pixel image patch. Neighboring spots were extracted by cropping a 1120×1120 image centered on the current spot and dividing it into 25 equal-sized sub-images. For PHG2ST, the hyperparameter was set to 0.3, and was set to 4. The model was optimized using the Adam optimizer [16] with an initial learning rate 0.0001 and dynamic adjustment strategy (step size = 50, decay rate = 0.9). The number of training epochs was set to 200, with an early stopping mechanism triggered if there was no improvement in PCC after 20 epochs. During training, PHG2ST randomly selected 30% of the spots with ST labels per WSI as prompts in each iteration. During testing, only 10% of the spots are randomly selected for prompt generation. For the baseline methods, we follow the training settings from their original papers but additionally use the same amount of 10% spots with ST labels to fine-tune each of them before evaluation to ensure a fair comparison. All experiments were implemented in PyTorch and PyTorch-Lightning and trained on an NVIDIA RTX 4090 GPU. Evaluation metrics include Mean Absolute Error (MAE), Concordance Correlation Coefficient (CCC), and Pearson Correlation Coefficient (PCC).
4.2 Experimental Results and Visualization
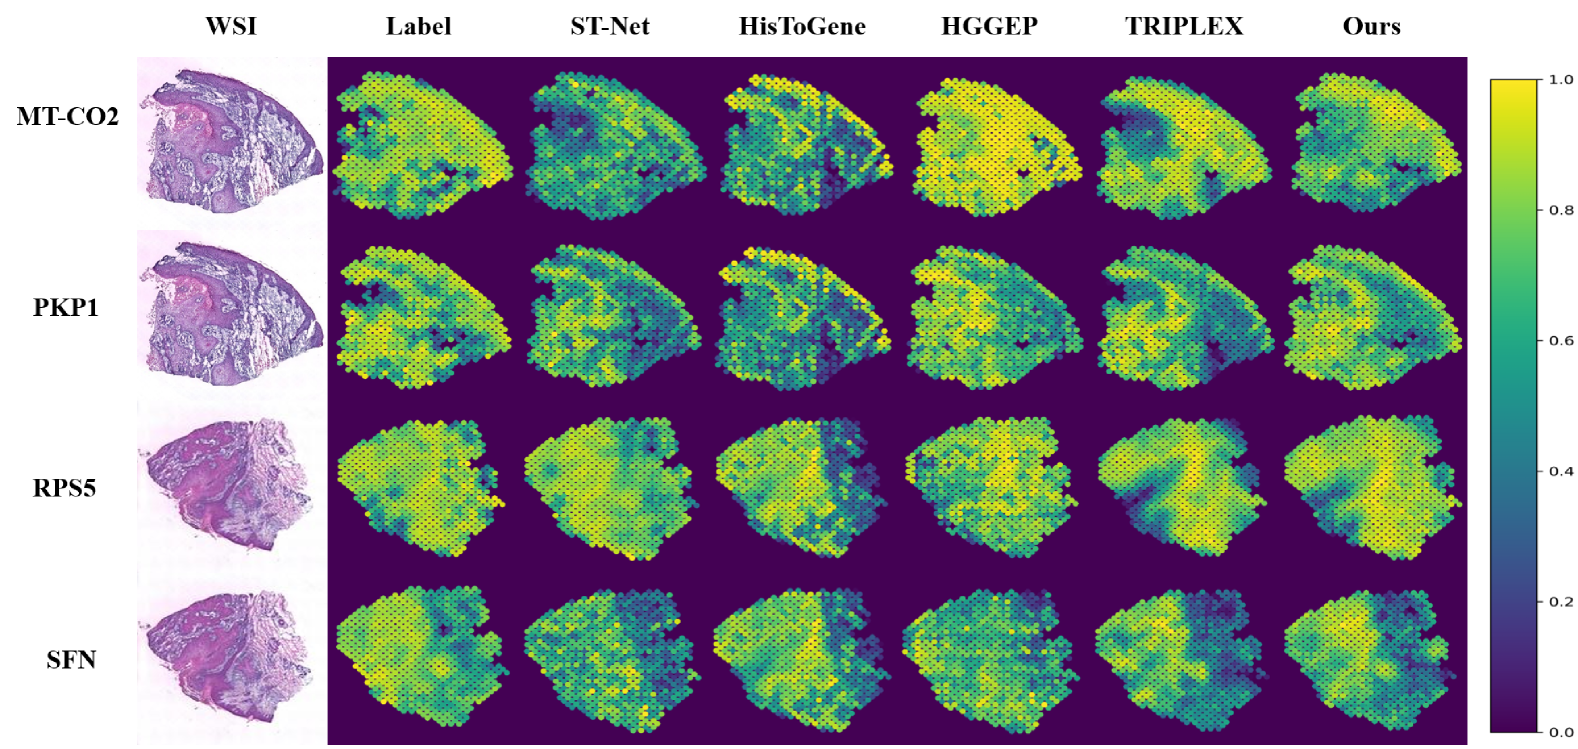
We compared PHG2ST to six state-of-the-art methods on the HER2+ and cSCC datasets in Table 1. ST-Net and HisToGene are spot-based methods, BLEEP utilizes contrastive learning to co-embed spot images and gene expression, Hist2ST and HGGEP utilize graph neural networks and hypergraph networks, TRIPLEX employs a multi-scale feature fusion approach. PHG2ST achieved state-of-the-art performance across all metrics, outperforming the second-best method by 3–5% in CCC and 2–5% in PCC across two datasets. This validated the effectiveness of our framework in ST prediction from histological images in an inference setting with a few known spots. Moreover, visualizations (Fig. 2) also indicate a high similarity between PHG2ST predictions and ground truth values.
4.3 Ablation
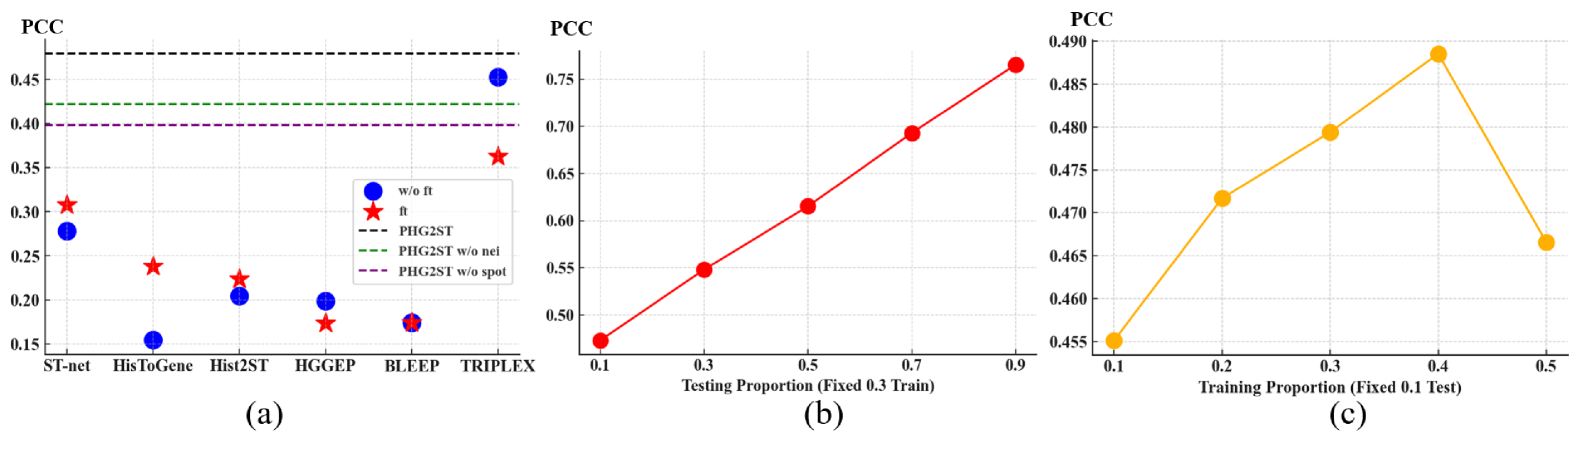
We conducted ablation studies to evaluate (1) the impact of fine-tuning for baseline models, (2) the effectiveness of multi-scale histological hypergraph features, and (3) the influence of ST-prompt ratios during training and testing. As shown in Fig. 3(a), fine-tuning improves the performance of some baseline models, particularly spot-based methods, by adapting them to test ST data. However, for other methods, design limitations make fine-tuning on sparse spots ineffective or even detrimental, leading to performance degradation. Fig. 3(a) (dashed lines) shows that integrating multi-scale histological hypergraph features, from cellular morphology to surrounding tissue phenotypes, improves spatial gene expression prediction. Using either the spot branch or the neighboring branch in isolation leads to a decrease in model performance. Additionally, Fig. 3(b) illustrates that higher ST-prompt ratios at inference improve performance, confirming the framework’s ability to integrate prompt information. However, Fig. 3(c) shows that excessive ST-prompt use during training results in diminishing returns, likely due to over-reliance on prompts over histological features.
5 Conclusion
In this work, we proposed PHG2ST, a spatial transcriptomics-guided histological hypergraph learning framework for predicting spatial gene expression. We demonstrated the feasibility of using a small amount of ST data as a prompt to guide histological features in predicting gene expression across entire WSIs. Experiments validated the superior performance of PHG2ST, highlighting its potential to enable cost-effective WSI spatial transcriptomics acquisition and advance integrative research in pathology and biomedicine.
References
- [1] Alexey, D.: An image is worth 16x16 words: Transformers for image recognition at scale. arXiv preprint arXiv: 2010.11929 (2020)
- [2] Andersson, A., Larsson, L., Stenbeck, L., Salmén, F., Ehinger, A., Wu, S.Z., Al-Eryani, G., Roden, D., Swarbrick, A., Borg, Å., et al.: Spatial deconvolution of her2-positive breast cancer delineates tumor-associated cell type interactions. Nature communications 12(1), 6012 (2021)
- [3] Bai, S., Zhang, F., Torr, P.H.: Hypergraph convolution and hypergraph attention. Pattern Recognition 110, 107637 (2021)
- [4] Barabasi, A.L., Oltvai, Z.N.: Network biology: understanding the cell’s functional organization. Nature reviews genetics 5(2), 101–113 (2004)
- [5] Chen, R.J., Ding, T., Lu, M.Y., Williamson, D.F., Jaume, G., Chen, B., Zhang, A., Shao, D., Song, A.H., Shaban, M., et al.: Towards a general-purpose foundation model for computational pathology. Nature Medicine (2024)
- [6] Chung, Y., Ha, J.H., Im, K.C., Lee, J.S.: Accurate spatial gene expression prediction by integrating multi-resolution features. In: Proceedings of the IEEE/CVF Conference on Computer Vision and Pattern Recognition. pp. 11591–11600 (2024)
- [7] Consortium, .G.P., et al.: A map of human genome variation from population scale sequencing. Nature 467(7319), 1061 (2010)
- [8] Cui Zhou, D., Jayasinghe, R.G., Chen, S., Herndon, J.M., Iglesia, M.D., Navale, P., Wendl, M.C., Caravan, W., Sato, K., Storrs, E., et al.: Spatially restricted drivers and transitional cell populations cooperate with the microenvironment in untreated and chemo-resistant pancreatic cancer. Nature genetics 54(9), 1390–1405 (2022)
- [9] He, B., Bergenstråhle, L., Stenbeck, L., Abid, A., Andersson, A., Borg, Å., Maaskola, J., Lundeberg, J., Zou, J.: Integrating spatial gene expression and breast tumour morphology via deep learning. Nature biomedical engineering 4(8), 827–834 (2020)
- [10] Hendrycks, D., Gimpel, K.: Gaussian error linear units (gelus). arXiv preprint arXiv:1606.08415 (2016)
- [11] Huang, G., Liu, Z., Van Der Maaten, L., Weinberger, K.Q.: Densely connected convolutional networks. In: Proceedings of the IEEE conference on computer vision and pattern recognition. pp. 4700–4708 (2017)
- [12] Jaume, G., Doucet, P., Song, A.H., Lu, M.Y., Almagro-Perez, C., Wagner, S.J., Vaidya, A.J., Chen, R.J., Williamson, D.F.K., Kim, A., Mahmood, F.: Hest-1k: A dataset for spatial transcriptomics and histology image analysis. In: Advances in Neural Information Processing Systems (Dec 2024)
- [13] Ji, A.L., Rubin, A.J., Thrane, K., Jiang, S., Reynolds, D.L., Meyers, R.M., Guo, M.G., George, B.M., Mollbrink, A., Bergenstråhle, J., et al.: Multimodal analysis of composition and spatial architecture in human squamous cell carcinoma. Cell 182(2), 497–514 (2020)
- [14] Jia, Y., Liu, J., Chen, L., Zhao, T., Wang, Y.: Thitogene: a deep learning method for predicting spatial transcriptomics from histological images. Briefings in Bioinformatics 25(1), bbad464 (2024)
- [15] Kharchenko, P.V., Silberstein, L., Scadden, D.T.: Bayesian approach to single-cell differential expression analysis. Nature methods 11(7), 740–742 (2014)
- [16] Kingma, D.P.: Adam: A method for stochastic optimization. arXiv preprint arXiv:1412.6980 (2014)
- [17] Lee, S.H., Jang, H.J.: Deep learning-based prediction of molecular cancer biomarkers from tissue slides: A new tool for precision oncology. Clinical and Molecular Hepatology 28(4), 754 (2022)
- [18] Li, B., Zhang, Y., Wang, Q., Zhang, C., Li, M., Wang, G., Song, Q.: Gene expression prediction from histology images via hypergraph neural networks. Briefings in Bioinformatics 25(6), bbae500 (2024)
- [19] Lopez, R., Nazaret, A., Langevin, M., Samaran, J., Regier, J., Jordan, M.I., Yosef, N.: A joint model of unpaired data from scrna-seq and spatial transcriptomics for imputing missing gene expression measurements. arXiv preprint arXiv:1905.02269 (2019)
- [20] Moncada, R., Barkley, D., Wagner, F., Chiodin, M., Devlin, J.C., Baron, M., Hajdu, C.H., Simeone, D.M., Yanai, I.: Integrating microarray-based spatial transcriptomics and single-cell rna-seq reveals tissue architecture in pancreatic ductal adenocarcinomas. Nature biotechnology 38(3), 333–342 (2020)
- [21] Ober, C., Vercelli, D.: Gene–environment interactions in human disease: nuisance or opportunity? Trends in genetics 27(3), 107–115 (2011)
- [22] Palla, G., Fischer, D.S., Regev, A., Theis, F.J.: Spatial components of molecular tissue biology. Nature Biotechnology 40(3), 308–318 (2022)
- [23] Pang, M., Su, K., Li, M.: Leveraging information in spatial transcriptomics to predict super-resolution gene expression from histology images in tumors. BioRxiv pp. 2021–11 (2021)
- [24] Rao, A., Barkley, D., França, G.S., Yanai, I.: Exploring tissue architecture using spatial transcriptomics. Nature 596(7871), 211–220 (2021)
- [25] Schmauch, B., Romagnoni, A., Pronier, E., Saillard, C., Maillé, P., Calderaro, J., Kamoun, A., Sefta, M., Toldo, S., Zaslavskiy, M., et al.: A deep learning model to predict rna-seq expression of tumours from whole slide images. Nature communications 11(1), 3877 (2020)
- [26] Ståhl, P.L., Salmén, F., Vickovic, S., Lundmark, A., Navarro, J.F., Magnusson, J., Giacomello, S., Asp, M., Westholm, J.O., Huss, M., et al.: Visualization and analysis of gene expression in tissue sections by spatial transcriptomics. Science 353(6294), 78–82 (2016)
- [27] Xie, R., Pang, K., Chung, S., Perciani, C., MacParland, S., Wang, B., Bader, G.: Spatially resolved gene expression prediction from histology images via bi-modal contrastive learning. Advances in Neural Information Processing Systems 36 (2024)
- [28] Zeng, Y., Wei, Z., Yu, W., Yin, R., Yuan, Y., Li, B., Tang, Z., Lu, Y., Yang, Y.: Spatial transcriptomics prediction from histology jointly through transformer and graph neural networks. Briefings in Bioinformatics 23(5), bbac297 (2022)
- [29] Zhang, L., Chen, D., Song, D., Liu, X., Zhang, Y., Xu, X., Wang, X.: Clinical and translational values of spatial transcriptomics. Signal Transduction and Targeted Therapy 7(1), 111 (2022)