Risk-Aware Planning of Power Distribution Systems Using Scalable Cloud Technologies
Abstract
The uncertainty in distribution grid planning is driven by the unpredictable spatial and temporal patterns in adopting electric vehicles (EVs) and solar photovoltaic (PV) systems. This complexity, stemming from interactions among EVs, PV systems, customer behavior, and weather conditions, calls for a scalable framework to capture a full range of possible scenarios and analyze grid responses to factor in compound uncertainty. Although this process is challenging for many utilities today, the need to model numerous grid parameters as random variables and evaluate the impact on the system from many different perspectives will become increasingly essential to facilitate more strategic and well-informed planning investments. We present a scalable, stochastic-aware distribution system planning application that addresses these uncertainties by capturing spatial and temporal variability through a Markov model and conducting Monte Carlo simulations leveraging modular cloud-based architecture. The results demonstrate that 15,000 power flow scenarios generated from the Markov model are completed on the modified IEEE 123-bus test feeder, with each simulation representing an 8,760-hour time series run, all in under an hour. The grid impact extracted from this huge volume of simulated data provides insights into the spatial and temporal effects of adopted technology, highlighting that planning solely for average conditions is inadequate, while worst-case scenario planning may lead to prohibitive expenses.
Index Terms:
Cloud computing, power distribution planning, power flow, stochastic modelingI Introduction
The global imperative for transitioning to a net-zero future has spurred a significant consumer interest in embracing renewable energy solutions, notably solar photovoltaic (PV) systems and electric vehicles (EVs) [1]. However, the location and capacity uncertainty of DER installations, the influence of weather patterns, and varying customer behavior introduce variability in power flow patterns, complicating the planning and management of distribution networks.
Stochastic-optimization-based models are explored in the literature to account for the uncertainty during planning for EV charging station infrastructure and power distribution network [2], [3]. However, these approaches use approximate models for power flow and don’t capture detailed modeling of components such as service transformers. Advanced algorithms leveraging transactive markets [4], chance-constrained programming [5], and correlated probability distributions [6] have been proposed for joint EV and PV planning; however, these approaches are primarily designed for short-term planning and are not directly applicable to extended planning horizons. Important sampling within the Monte-Carlo (MC) framework is studied in power systems planning studies to reduce the search space in stochastic optimization [7]. However, given the emphasis on the worst-case scenario, these methods may lead to extremely conservative and expensive planning solutions as the worst-case scenario usually occurs with a very small probability [8]. Furthering the complexity, the choice of a simplified model can amplify the error produced from lower temporal resolution (or reduced scenario) [9, 10]. Therefore, it is important to consider a full range of possible future scenarios to factor in compounded uncertainty. MC-based approaches are well suited for planning studies with uncertainty in decision variables [11]. However, the major challenge of the MC technique is that to achieve a satisfactory probabilistic distribution approximation accuracy, many samples need to be generated, which is time, computation, and data-intensive—local and inelastic computing resources provisioned by power system organizations today are inadequate for such demands [12]. Recently, advanced cloud-based solutions tailored to utility needs have emerged, providing faster grid analytics, delivering actionable insights from vast amounts of data, with the potential to offer scalable computing without the need for prohibitively expensive supercomputing infrastructure [13, 12]. This shift is further emphasized by a recent statement from the White House, which highlights the potential of advanced computing and software solutions to accelerate the integration of clean energy into the grid [14].
We propose a scalable and extensible framework that leverages GridAPPS-D and Amazon Web Services (AWS) to share grid models and data among applications and provide a consistent means for the distributed processing of grid simulations at a cloud scale. The specific contributions of this paper are:
-
1.
Stochastic-aware distribution system planning application for PV and EV adoption by customers in a distribution grid. The application leverages a Markov model for DER adoption by customers, imposing both temporal and spatial uncertainty and a physics-based grid simulator (GridLAB-D) to conduct load flow analysis.
-
2.
Cloud-based architectural framework with modular components for scenario generation, grid simulation, and post-processing. The application leverages the scalability of cloud services to generate and analyze a full range of planning scenarios for risk-aware decision support.
II Methodology
II-A DER Adoption Model and Scenario Generation
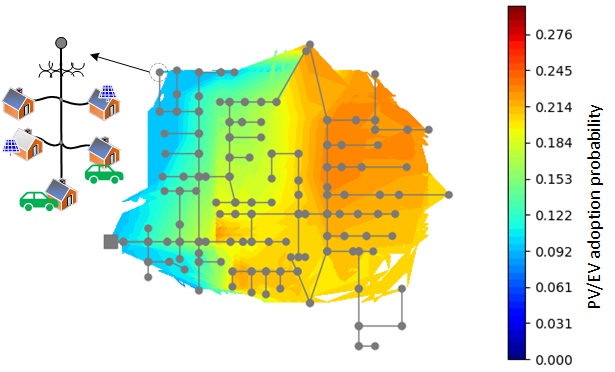
We begin by selecting a representative test feeder from the distribution system to initiate the stochastic analysis of DER adoption. Following a Markov-based adoption model, the population script is designed to distribute solar PV and EV across the feeder. This model utilizes predefined adoption probabilities to simulate consumers’ gradual uptake of DER technologies over time (see Fig. 1).
Let represent the state space for each customer, where: indicates that the customer has not adopted PV/EV technology and indicates that the customer has adopted PV/EV technology. Each customer is associated with a location-based probability of adoption , which influences the transition probabilities between states. We define the transition probability matrix for customer as follows:
where: : the probability that customer adopts PV/EV technology in a given year, given that they have not previously adopted it. : once a customer adopts PV/EV technology, they remain in the adopted state.
The state of customer at year evolves according to the Markov process. Given the initial state , the probability that customer adopts PV/EV by year can be expressed as:
This formulation assumes a homogeneous probability for each year based on location and customer-specific attributes. Using our Markov model, we can generate long-term adoption scenarios to assess the evolution of DER adoption for the next years. Each scenario represents a unique combination of location and DER capacity, allowing us to explore how adoption may unfold under different circumstances.
For each customer and each year , the state transitions based on the probability of adopting PV/EV technology. The process for generating scenarios is as follows:
-
1.
Initialize: For each customer without EV and PV at year 1, set the initial state , indicating no adoption.
-
2.
Yearly Simulation: For each year :
-
•
Update the state for each customer based on the transition probability .
-
•
Track the cumulative DER capacity and location of adopted customers to capture the evolving DER landscape (see Fig. 2).
-
•
-
3.
Repeat: Repeat the above process for trials, where each trial represents a unique realization of the adoption process, capturing the variability in customer decisions.
A total of scenarios are generated, representing different DER adoption patterns over time.
II-B Grid Simulation and Impact Analysis
In the next step, we perform a power flow analysis on each generated scenario, capturing grid states that include bus voltages, line flows, and asset loading conditions. Once the power flow analysis is complete, we use post-processing scripts to analyze the Monte Carlo simulation results, aiming to identify and quantify EV/PV integration risks. For this study, we focus on service transformer overload as a key metric to assess grid impacts.
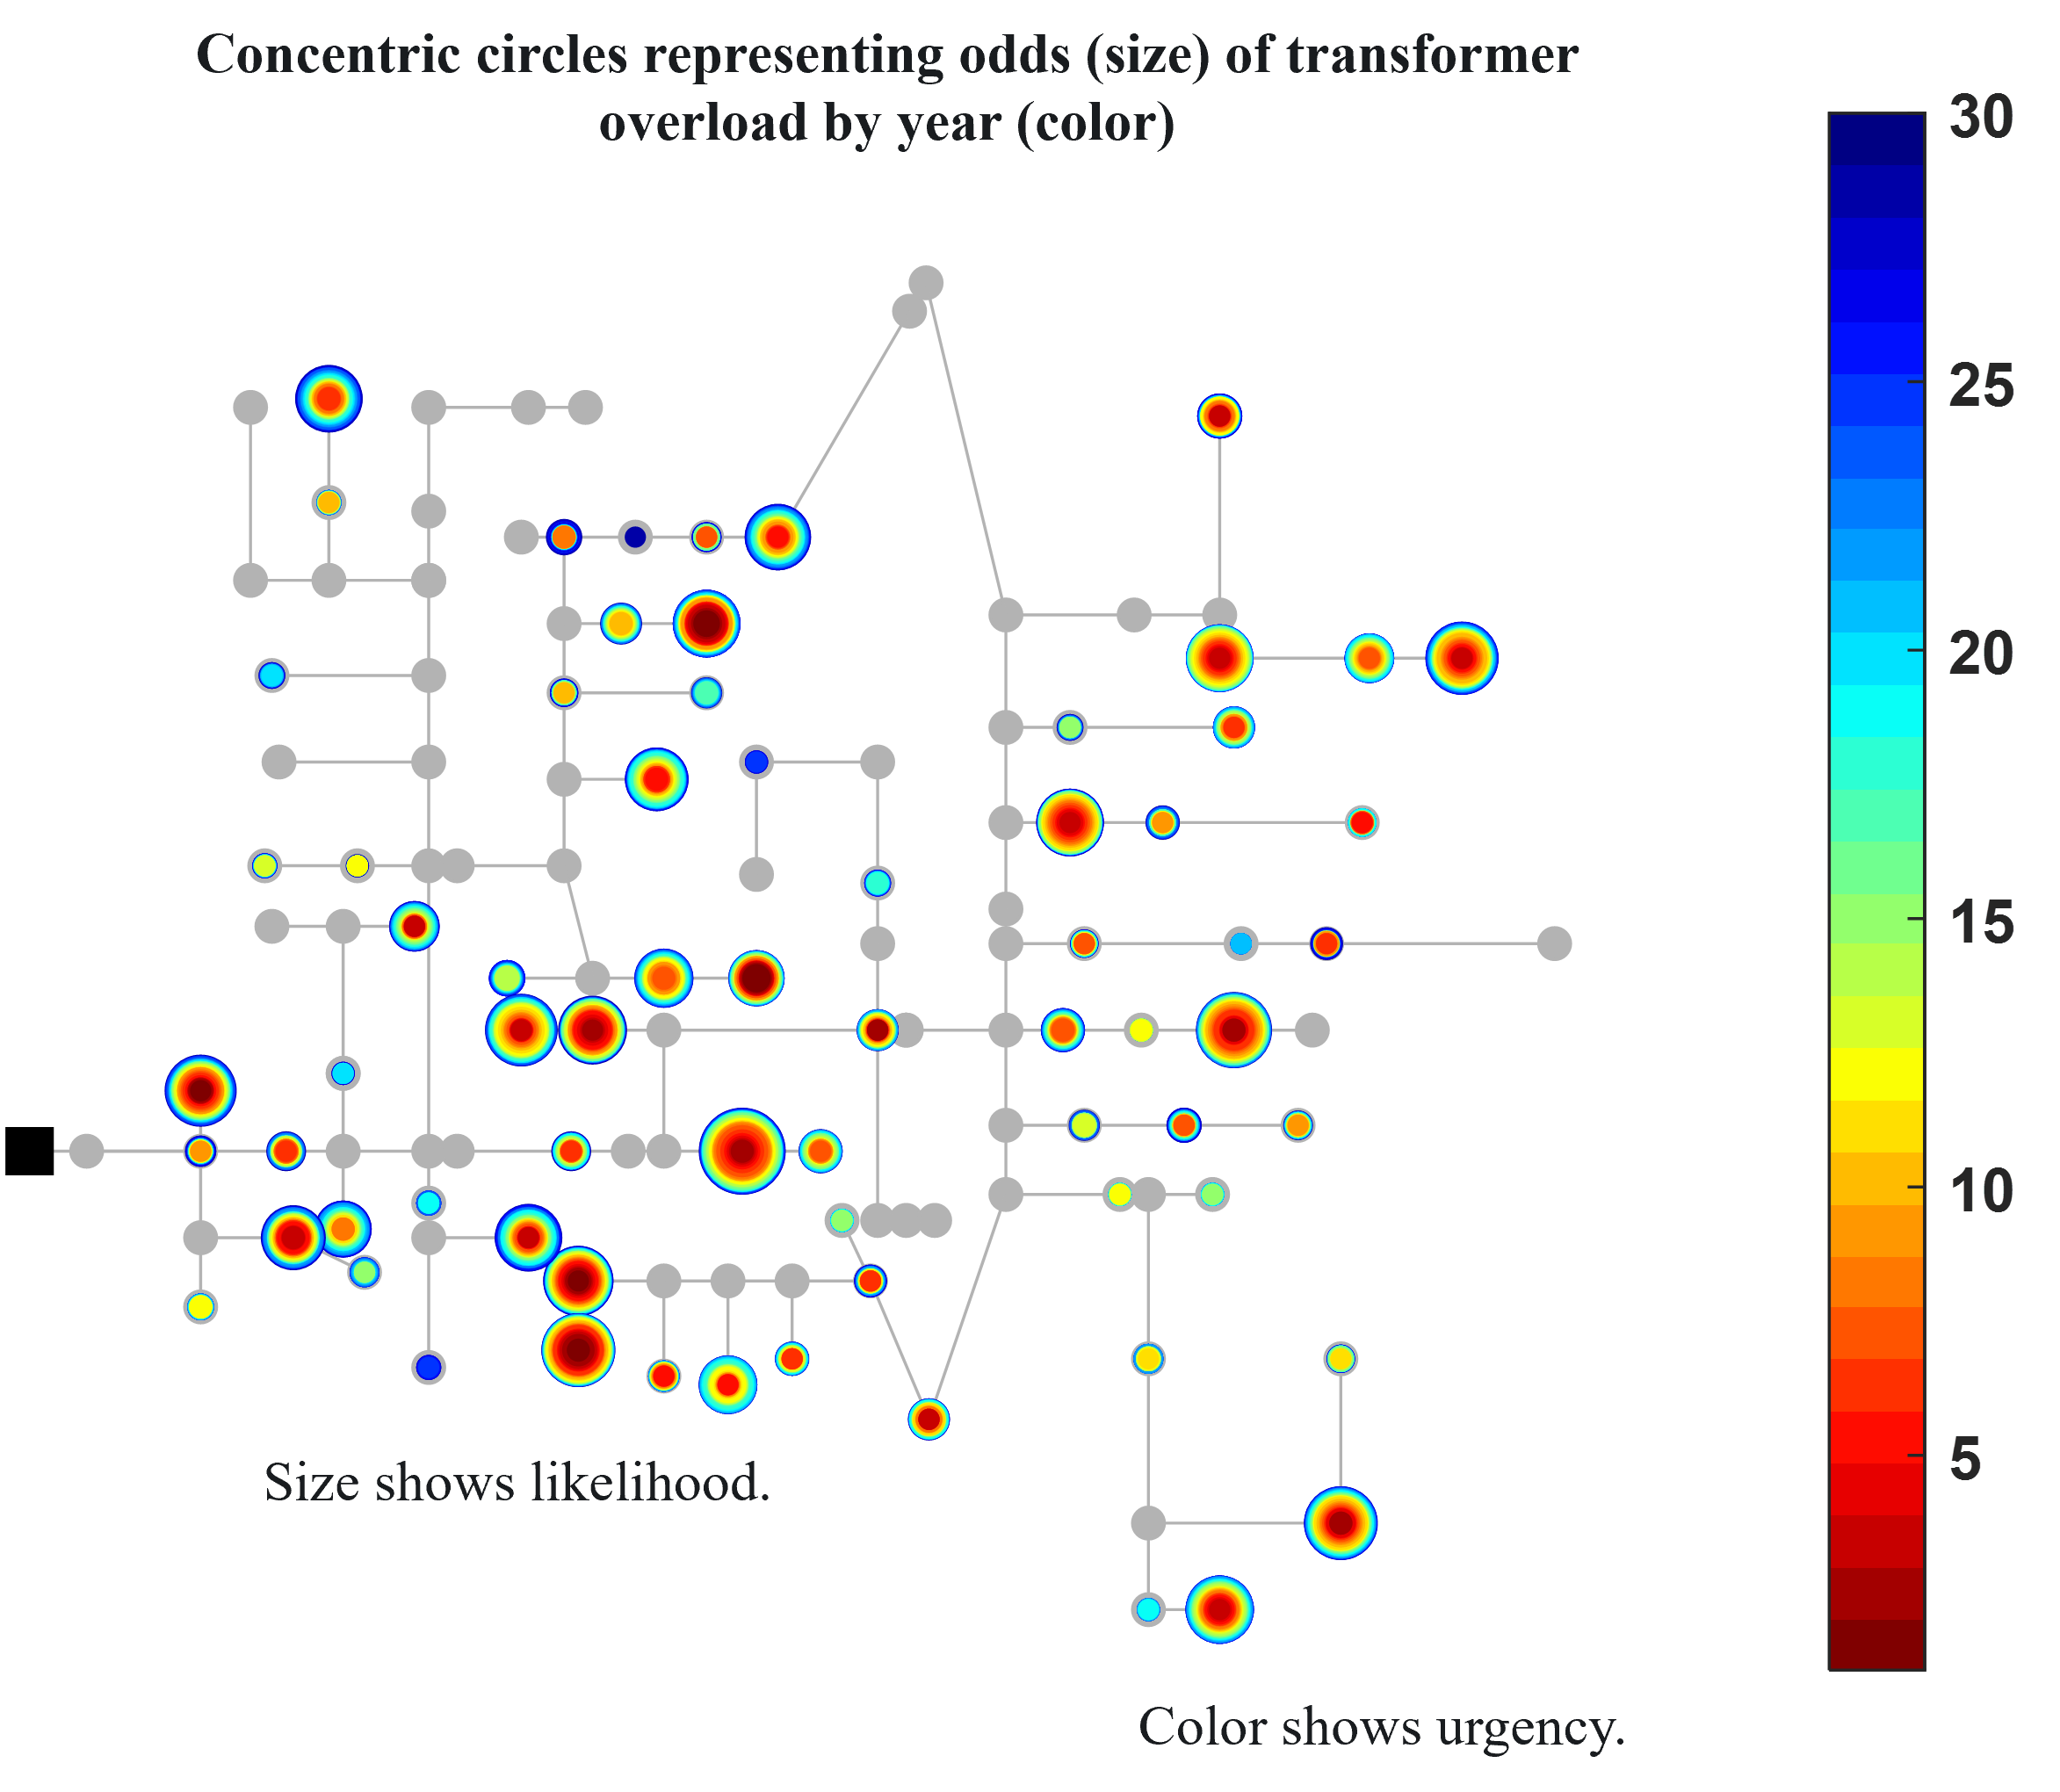
From the scenario, we evaluate the annual frequency of transformer overload. Two key metrics are chosen for visualizing these impacts: (i) the year when the first violation occurs and (ii) the frequency of violations within trials for each year . Using this data, each service transformer can be represented as a series of concentric circles within the grid topology. Each circle corresponds to a different year, with the circle’s size indicating the likelihood of impact in that year and its color showing the earliest an impact was detected. Finally, the user can generate insightful visualizations and plots illustrating the probability distributions of service transformer overloads, facilitating informed decision-making by distribution utilities.
III Proposed Architectural Framework
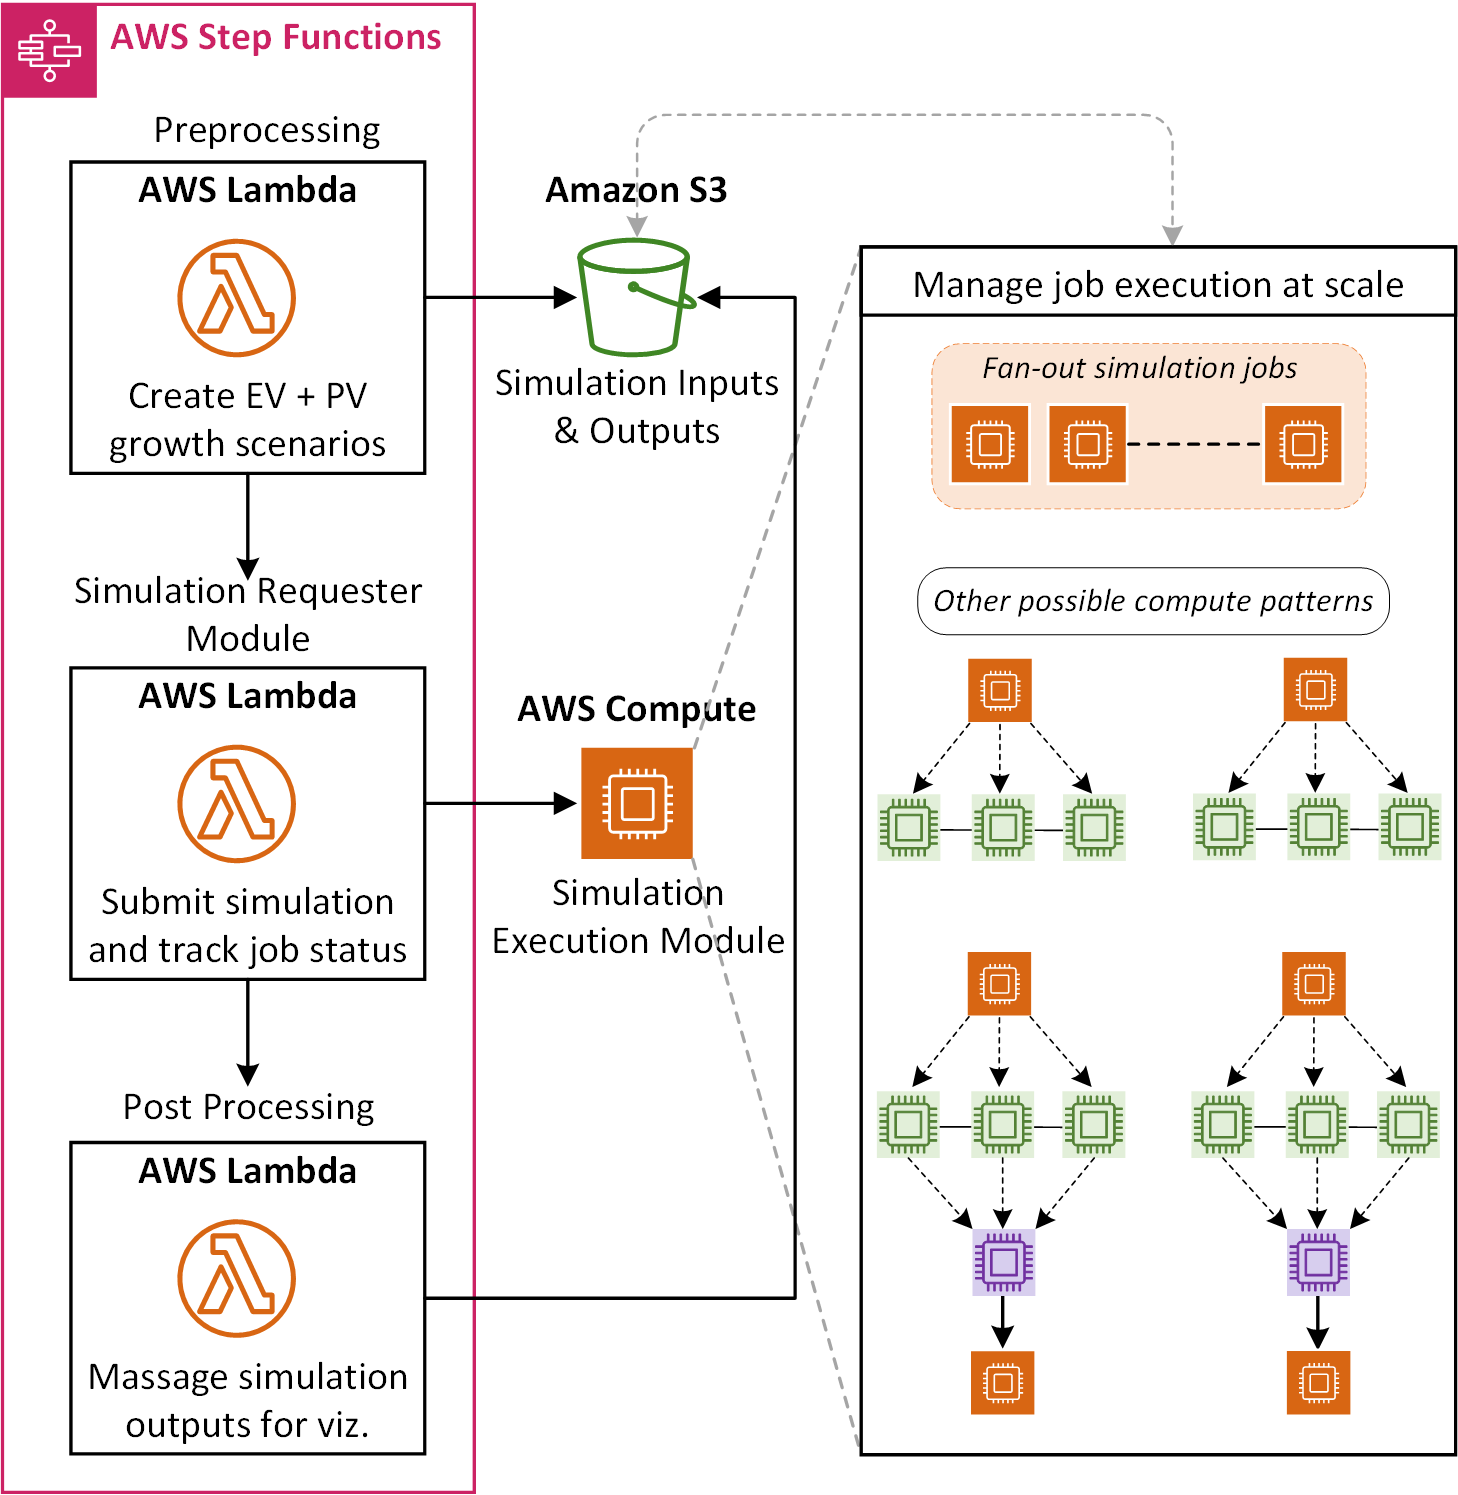
The proposed architectural framework deconstructs the methodology into three simple steps: 1) pre-processing to generate inputs required for the MC simulations, 2) execution of simulations at scale, and 3) post-processing results to identify the location, year of occurrence, and severity of anticipated grid violations. This decoupling of grid simulations from the rest of the use-case-specific logic allows for the future extensibility of this architectural framework. For example, new use cases can re-use simulation execution capabilities at a cloud scale, leveraging hundreds or thousands of compute nodes. Fig. 2 shows a reference architecture for the three-step workflow using AWS Step Functions [https://aws.amazon.com/step-functions/], a visual workflow orchestration service that helps developers use AWS services to build distributed applications, automate processes, orchestrate microservices, and create data and machine learning (ML) pipelines.
III-A Pre-processing
The three-step process begins with the generation of scenarios to be analyzed (preprocessing). AWS Lambda [https://aws.amazon.com/pm/lambda/], a serverless computing service that runs code in response to events, and automatically manages the compute resources, is used for scenario generation, as shown in Figure 1. AWS Step Functions integrates with AWS Lambda to invoke the scenario generation Lambda function, which executes Python code for generating simulation inputs. AWS Lambda allows PNNL researchers to focus on the business logic for scenario generation, such as the use of Markov-model for DER adoption, without thinking about servers or execution runtime. This scenario generation Lambda function generates data for trials, where each trial uses probabilities to model DER adoption and customer behavior for each hour over the next years. This leads to the creation of GridLab-D (.glm) and supporting files (weather and load profiles) per year per trial, representing the inputs for those trials worth of years hourly simulations. Here, each trial is independent of another and can be run concurrently with other trials. Within a trial, however, previous years’ DER adoption informs all the locations available for further DER adoption in successive years, and therefore, requires sequential execution. All files are stored in Amazon Simple Storage Service (S3) [https://aws.amazon.com/s3/].
III-B Simulation Execution
The next step is the re-usable simulation execution part of the proposed architecture. This step is implemented in the form of a requester module that submits simulation jobs to be executed and an execution module that responds to these requests by executing them and allowing the requester to check the status of previously submitted jobs. This allows the execution module to be re-used for other use cases. Another AWS Lambda function is used to implement the requester module, submitting a yearly power flow simulation job for each year and each trial. For trials over years, this equals submitting jobs, where each job needs to run a yearly simulation with 8,760 data points using GridLAB-D. Since all inputs required for each year and each trial are pre-computed in the previous step of the workflow, all simulation jobs can be submitted concurrently and executed independently. For queuing, execution, and management of these simulation jobs, AWS worked closely with PNNL to support running thousands of 8760 grid simulations. For this scaled execution, AWS contributed a cloud solution (diagram icon “Simulation Execution Module”). This cloud solution supported the execution of different compute patterns, including a simple fan-out to a large number of distributed compute nodes, required for such stochastic analysis, as well as other, more complex, and multi-step compute patterns as depicted to the right of Fig. 2. The re-usable execution module offers the performance and scale required for stochastic analyses that can model various uncertainties described in the previous sections.
III-C Post-processing
The final step of the workflow is the postprocessing step, where results from 8,760 power flow analyses over years and trials are processed to identify voltage violations and asset overloads. This step filters and massages the simulation outputs so that a visualization can be easily developed to demonstrate the location of grid violations, the frequency of those violations over the numerous trials, and the timing and severity of those violations over the year, hourly, quasi-static time series simulations. The proposed architectural framework supports running both Python or MATLAB, using an AWS Lambda function for Python code execution, or running MATLAB on AWS [https://aws.amazon.com/blogs/publicsector/matlab-parallel-cloud-computing-aws-researchers/].
IV Demonstration
For our study, we selected the IEEE 123 bus test feeder from the GridAPPS-D database as the basis for our demonstration. We modified the test feeder to investigate DER adoption models—enhancing its ability to accommodate customer-owned PVs and EVs by disaggregating lumped loads into a secondary model that reflects load distribution across the network (see Fig. 1). This approach establishes customer points within the feeder for EV/PV integration, enabling a more granular analysis of adoption patterns and their impacts on distribution operations, such as transformer overloading.
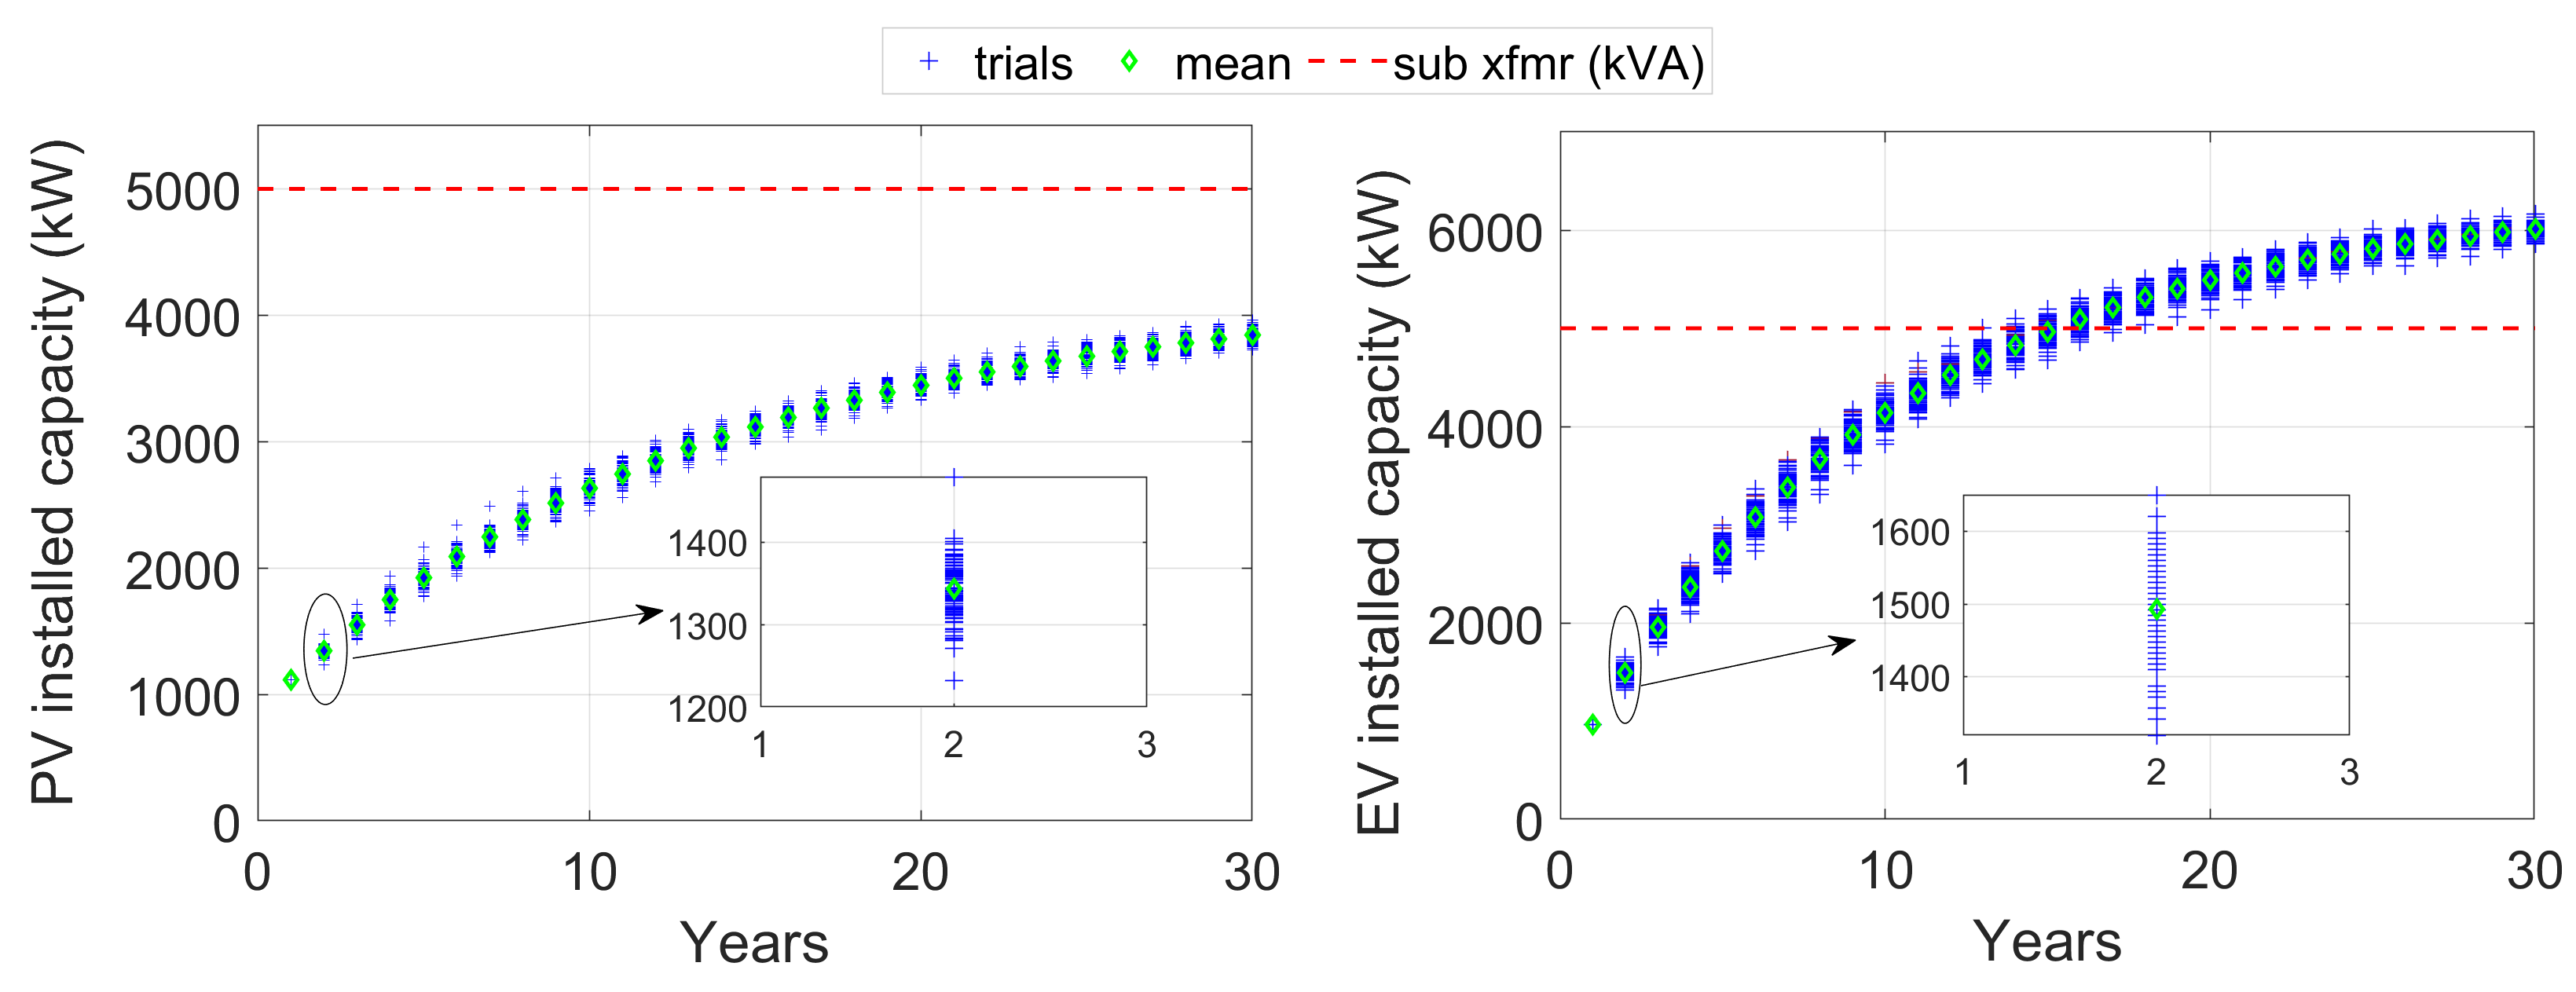
IV-A Simulation Setup
For the demonstration, 500 trials are conducted for a 30-year growth model of customer-owned EV/PV (i.e., 15,000 yearly simulations with 8,760 timestamps). Fig. 3 shows the growth model for PV and EV for the next 30 years. Once the models and data representing this EV and PV growth are generated, and compute resources are provisioned for executing grid simulation jobs, the requester module submitted jobs containing a list of power flow requests. Each request included pre-processed files, including a GridLAB-D model, weather data, and load profiles for 8,760 timestamps in a zip format. The requester module also specified the Amazon S3 location where the job output should be stored for post-processing. The executor module verified the validity of the pre-processed files and then started the GridLAB-D simulation for each request. The 15,000 power flow jobs are created and submitted concurrently. Once all the jobs were submitted, the requester module periodically checked for completion. The execution module processed 1,000 jobs in parallel. An even higher level of parallel execution can be used if needed, either to process the jobs even faster or to execute more analyses in the same amount of time.
IV-B Results
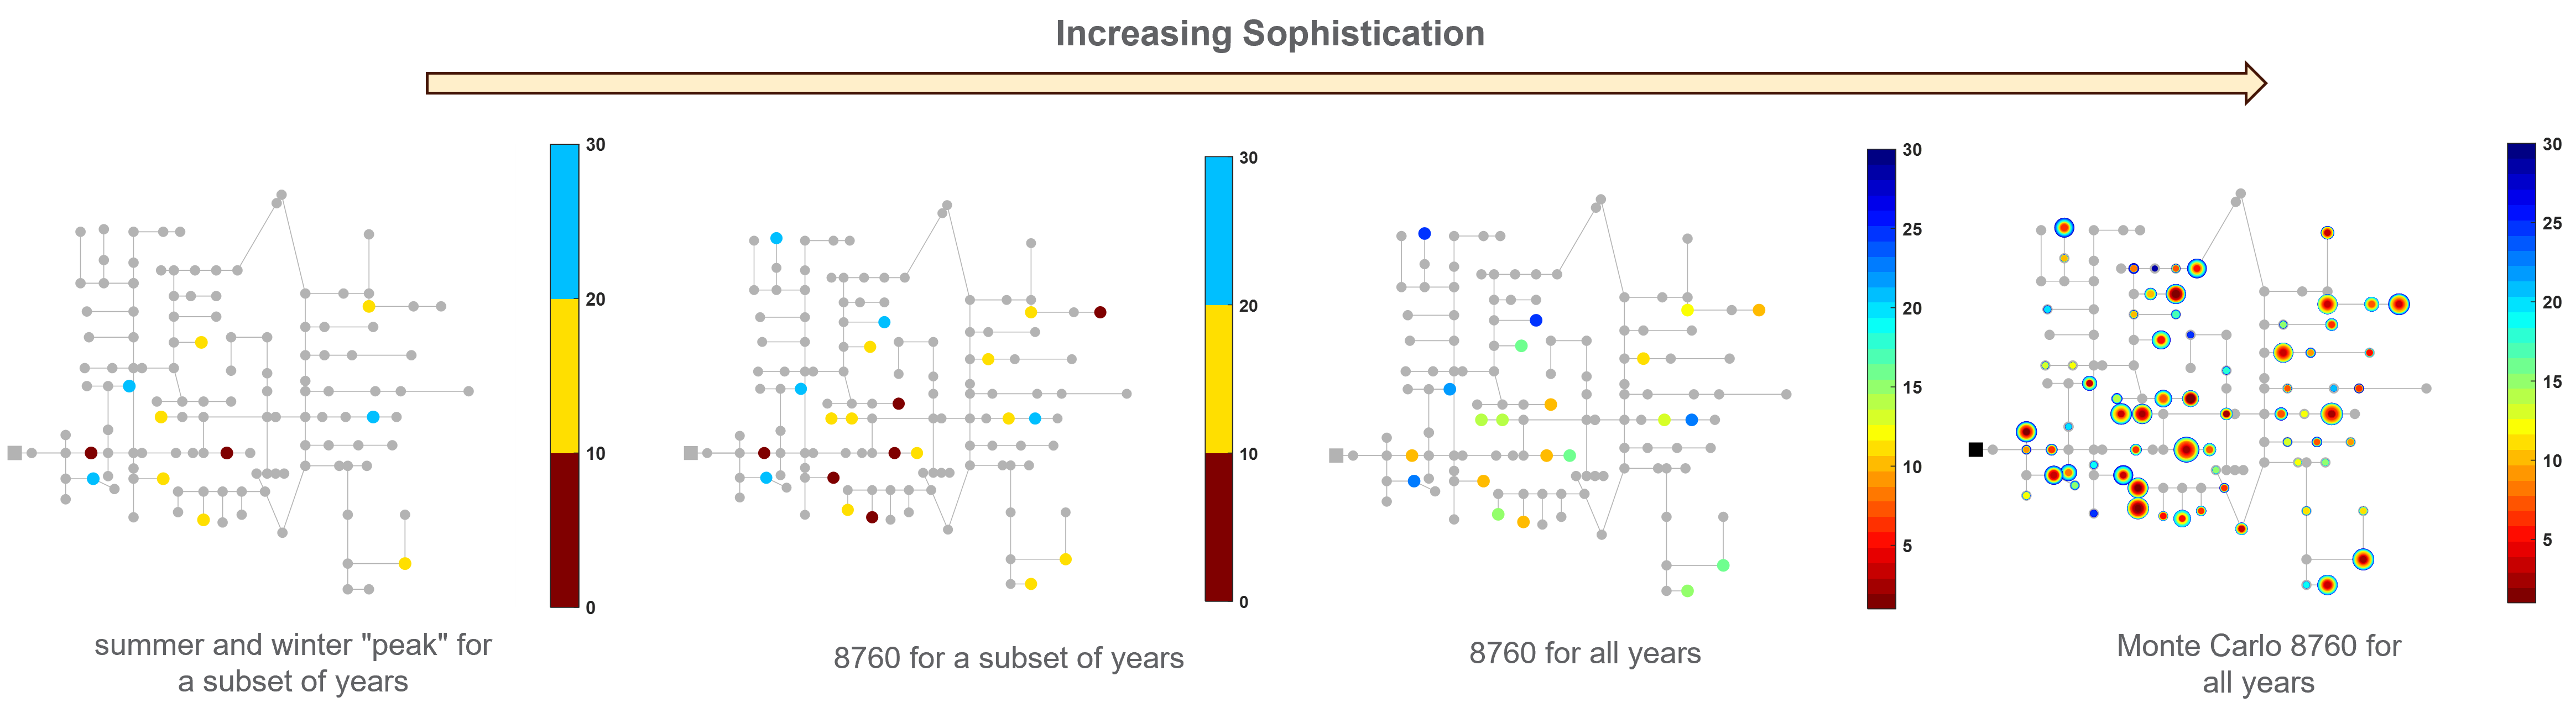
Fig. 4 shows a performance comparison with traditional approaches where DER adoption is studied under particular scenarios. For example, some conventional approaches use worst-case scenarios such as summer peak and winter peak [15], and the business-as-usual distribution system capacity planning horizons are typically five years [16]. With such approaches, outlier results cannot be identified; potential grid impact conditions might be missing and lead to excessively conservative conclusions that constrict DER interconnection. As we move from left to right in Fig. 4, it becomes apparent that expanded scenario analysis, drawing from rich datasets, captures a more comprehensive grid response, bolstering confidence in the resulting conclusions. The increase in sophistication (i.e., scaling DER growth with probabilistic studies) allows the operator to understand better where/when the problems will occur.
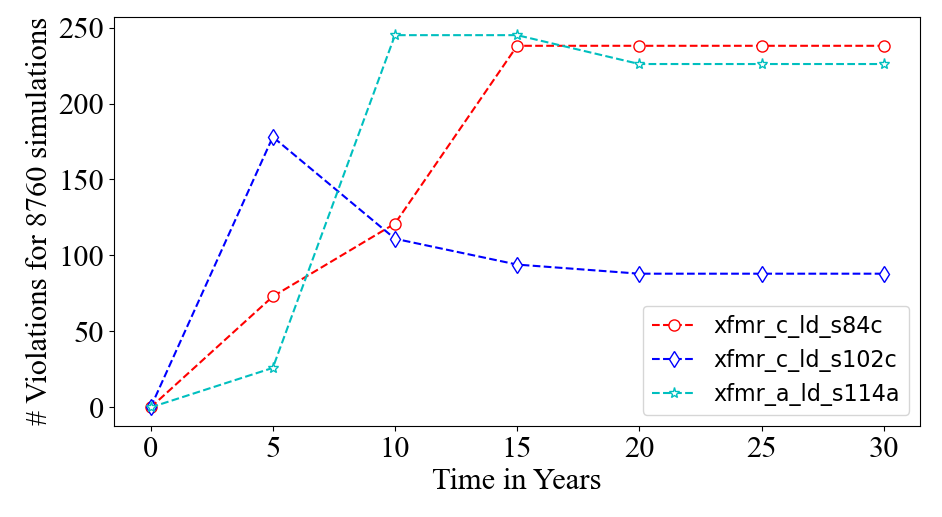
Fig. 5 shows a visualization of service transformer overload with concentric circles representing the impact (odds [size of the circle] of transformer overload by year [color of the circle]). The size of the circle shows the likelihood that problems start to occur, and the circle’s color shows urgency (i.e., transformer overloads in the early years of the DER adoption). For instance, a large red circle represents that the problem in a transformer will occur in the early years, and the problem occurred during most of the trials.
We also studied a few trials to analyze the impact of the co-adoption of EVs and PVs. The impacts of these two technologies may not be additive, and EV charging behaviors may be subject to change after solar panels are added. Consumers may adapt EV charging to the variable solar energy generation and shift EV charging to the hours when solar panels generate electricity [17]. While we do not specifically model the change in customer behavior after adopting such technologies, we randomly selected trials to observe this. Fig. 6 shows a plot where the number of violations of service transformer is reported every five years for the next 30 years. In certain trials, it is observed that the frequency of overloads in transformers decreases after 10-15 years despite the increasing adoption of EVs. This phenomenon can be attributed to the expected shift in electricity consumption patterns among EV users who also adopt solar panels, leading to a change in their energy usage behavior. Such findings could help with load management strategies (i.e., smart charge management in EVs) and infrastructure upgrades.
To showcase the scalability, we monitored the execution time of power flow jobs. The total number of monitored, completed, and failed jobs are tracked each time. Fig. 7 shows the job completion rate for the execution of 15,000 simulations—each covering all 8,760 hours representing a yearly simulation—demonstrates that a total of 131.4 million power flow calculations (8,760 × 15,000) were completed in under an hour. In contrast, an engineering workstation [32 GB RAM; 13th Gen Intel(R) Core(TM) i9] completed one job in around 32 minutes. A performance summary is shown in Table I. In addition to scalability, the deconstructed architecture enables easy reuse of its components for other use cases, providing accessible, high-scale, low-cost technologies that encourage experimentation and innovation. For instance, the project team is adopting these architectural patterns and AWS technologies for new use cases in distribution operations.
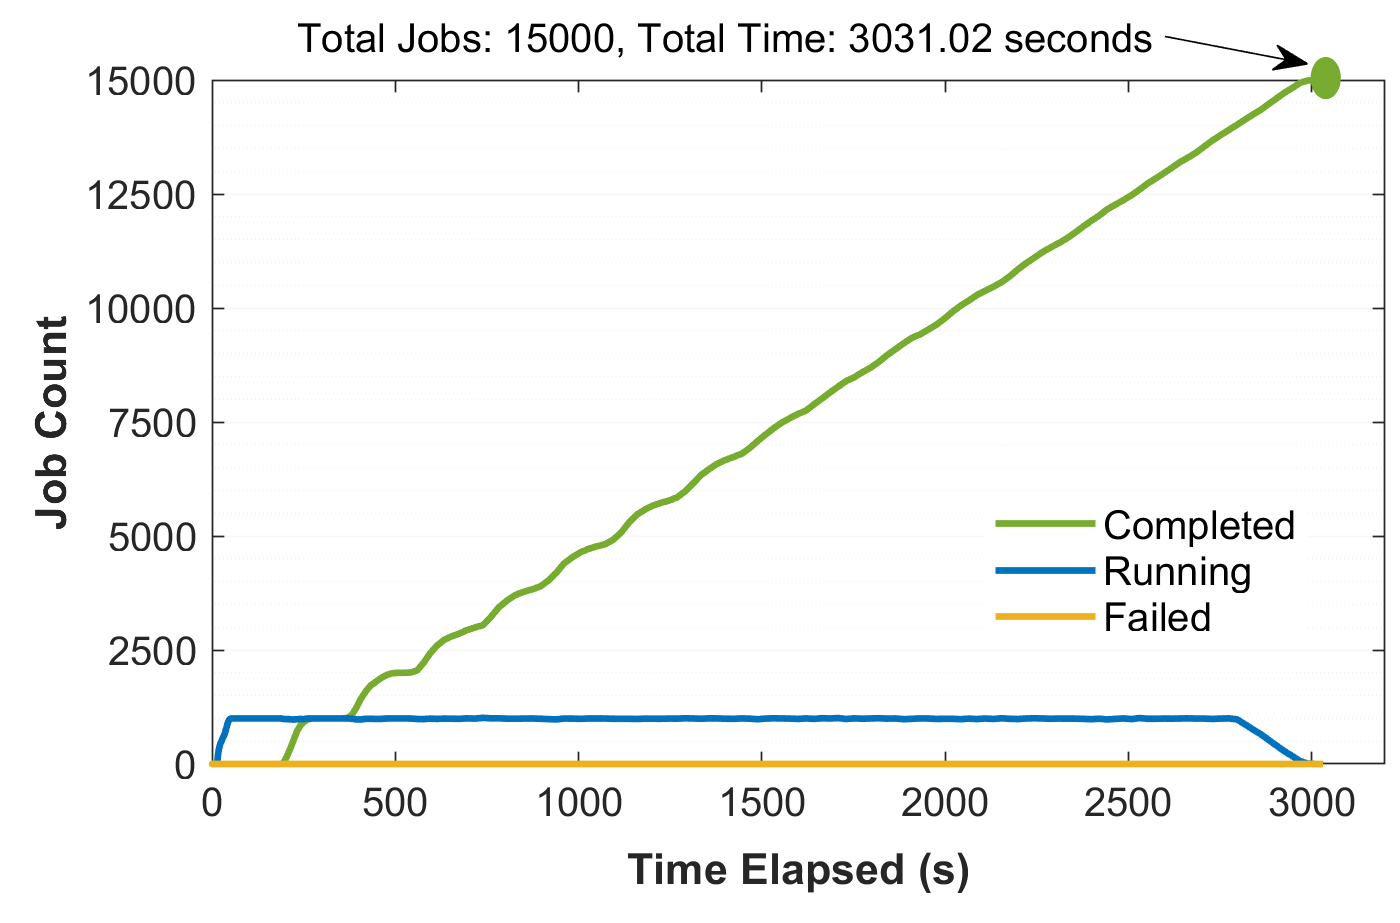
| Computing resource | Avg. time per job | Total execution time |
|---|---|---|
| Cloud solution | 0.202 seconds | 3031.02 seconds |
| Engineering workstation | 32.12 minutes | 334.5 days |
V Conclusions
This paper presented a stochastic-aware distribution planning application that addresses uncertainties arising from the growing adoption of EVs and PVs. By incorporating temporal and spatial variability using a Markov model and leveraging a cloud-based architecture, our approach facilitates efficient large-scale scenario generation and grid impact simulations. Moreover, our analyses of large-scale datasets provided key insights into the spatial and temporal impacts of DERs, underscoring the limitations of planning based on average conditions alone and revealing that worst-case scenario planning, while robust, may introduce high costs. Furthermore, the use of managed cloud services further highlights the benefits of scalable, high-performance computing without the need for costly, in-house supercomputing infrastructure, streamlining implementation and reducing internal development efforts.
References
- [1] S. Sharda, V. M. Garikapati, K. G. Goulias, J. L. Reyna, B. Sun, C. A. Spurlock, and Z. Needell, “The electric vehicles-solar photovoltaics nexus: Driving cross-sectoral adoption of sustainable technologies,” Renewable and Sustainable Energy Reviews, vol. 191, p. 114172, 2024.
- [2] S. Wang et al., “Expansion planning of active distribution networks with multiple distributed energy resources and ev sharing system,” IEEE Transactions on Smart Grid, vol. 11, no. 1, pp. 602–611, 2019.
- [3] P. M. de Quevedo, G. Muñoz-Delgado, and J. Contreras, “Joint expansion planning of distribution networks, ev charging stations and wind power generation under uncertainty,” in 2017 IEEE Power & Energy Society General Meeting. IEEE, 2017, pp. 1–5.
- [4] H. Yao, Y. Xiang, C. Gu, and J. Liu, “Optimal planning of distribution systems and charging stations considering pv-grid-ev transactions,” IEEE Transactions on Smart Grid, vol. 16, no. 1, pp. 691–703, 2025.
- [5] X. Zhang et al., “Joint planning of distributed pv stations and ev charging stations in the distribution systems based on chance-constrained programming,” IEEE Access, vol. 9, pp. 6756–6768, 2021.
- [6] C. D. W. Mudiyanselage et al., “Probabilistic coupled ev-pv hosting capacity analysis in lv networks with spatio-temporal modelling and copula theory,” IET Smart Grid, 2024.
- [7] D. Urgun, C. Singh, and V. Vittal, “Importance sampling using multilabel radial basis classification for composite power system reliability evaluation,” IEEE systems Journal, vol. 14, no. 2, pp. 2791–2800, 2019.
- [8] A. Poudyal et al., “Risk-based active distribution system planning for resilience against extreme weather events,” IEEE Transactions on Sustainable Energy, vol. 14, no. 2, pp. 1178–1192, 2023.
- [9] A. Parchure, S. J. Tyler, M. A. Peskin, K. Rahimi, R. P. Broadwater, and M. Dilek, “Investigating pv generation induced voltage volatility for customers sharing a distribution service transformer,” IEEE Transactions on Industry Applications, vol. 53, no. 1, pp. 71–79, 2016.
- [10] C. Marcy et al., “Comparison of temporal resolution selection approaches in energy systems models,” Energy, vol. 251, p. 123969, 2022.
- [11] S. Poudel, A. Dubey, and A. Bose, “Risk-based probabilistic quantification of power distribution system operational resilience,” IEEE Systems Journal, vol. 14, no. 3, pp. 3506–3517, 2020.
- [12] S. Zhang, A. Pandey, X. Luo, M. Powell, R. Banerji, L. Fan, A. Parchure, and E. Luzcando, “Practical adoption of cloud computing in power systems—drivers, challenges, guidance, and real-world use cases,” IEEE Transactions on Smart Grid, vol. 13, no. 3, pp. 2390–2411, 2022.
- [13] Energy Digitial, “Top 10: Cloud Providers to the Energy Industry”. [Online]. Available: https://energydigital.com/top10/top-10-cloud-providers-to-the-energy-industry.
- [14] Joseph R. Biden, Jr., Readout of White House Discussion on AI and Advanced Software Solutions to Accelerate Clean Energy Grid Integration. [Online]. Available: https://www.presidency.ucsb.edu/node/374856.
- [15] P. Cicilio, E. Cotilla-Sanchez, B. Vaagensmith, and J. Gentle, “Transmission hosting capacity of distributed energy resources,” IEEE Transactions on Sustainable Energy, vol. 12, no. 2, pp. 794–801, 2020.
- [16] J. Keen, J. Giraldez, E. Cook, A. Eiden, S. Placide, A. Hirayama, B. Monson, D. Mino, and F. Eldali, “Distribution capacity expansion planning: Current practice, opportunities, and decision support,” National Renewable Energy Laboratory (NREL), Golden, CO (United States), Tech. Rep., 2022.
- [17] J. Liang, Y. L. Qiu, and B. Xing, “Impacts of the co-adoption of electric vehicles and solar panel systems: Empirical evidence of changes in electricity demand and consumer behaviors from household smart meter data,” Energy Economics, vol. 112, p. 106170, 2022.