The Atacama Cosmology Telescope: DR6 Constraints on Extended Cosmological Models
Abstract
We use new cosmic microwave background (CMB) primary temperature and polarization anisotropy measurements from the Atacama Cosmology Telescope (ACT) Data Release 6 (DR6) to test foundational assumptions of the standard cosmological model, , and set constraints on extensions to it. We derive constraints from the ACT DR6 power spectra alone, as well as in combination with legacy data from the Planck mission. To break geometric degeneracies, we include ACT and Planck CMB lensing data and baryon acoustic oscillation data from DESI Year-1. To test the dependence of our results on non-ACT data, we also explore combinations replacing Planck with WMAP and DESI with BOSS, and further add supernovae measurements from Pantheon+ for models that affect the late-time expansion history. We verify the near-scale-invariance (running of the spectral index ) and adiabaticity of the primordial perturbations. Neutrino properties are consistent with Standard Model predictions: we find no evidence for new light, relativistic species that are free-streaming (, which combined with astrophysical measurements of primordial helium and deuterium abundances becomes ), for non-zero neutrino masses ( eV at 95% CL), or for neutrino self-interactions. We also find no evidence for self-interacting dark radiation (), or for early-universe variation of fundamental constants, including the fine-structure constant () and the electron mass (). Our data are consistent with standard big bang nucleosynthesis (we find ), the COBE/FIRAS-inferred CMB temperature (we find K), a dark matter component that is collisionless and with only a small fraction allowed as axion-like particles, a cosmological constant (), and the late-time growth rate predicted by general relativity (). We find no statistically significant preference for a departure from the baseline model. In fits to models invoking early dark energy, primordial magnetic fields, or an arbitrary modified recombination history, we find , , or km/s/Mpc, respectively; using BOSS instead of DESI BAO data reduces the central values of these constraints by 1–1.5 km/s/Mpc while only slightly increasing the error bars. In general, models introduced to increase the Hubble constant or to decrease the amplitude of density fluctuations inferred from the primary CMB are not favored over by our data.
]Affiliations can be found at the end of the document
1 Introduction
The cold dark matter (CDM) cosmological model has emerged as the standard model of cosmology over the past quarter-century, undergirded by precision measurements of the cosmic microwave background (CMB) primary anisotropy power spectra in both temperature and polarization (e.g., Spergel et al., 2003; Bennett et al., 2013; Planck Collaboration, 2020c; Rosenberg et al., 2022; Tristram et al., 2024; Choi et al., 2020; Balkenhol et al., 2023; Chou et al., 2025, and upcoming South Pole Telescope results), the expansion history of the universe as probed by baryon acoustic oscillations (BAO; Eisenstein et al., 2005; Dawson et al., 2013; DESI Collaboration, 2024a) and Type Ia supernovae measurements (SNIa; Riess et al., 1998; Perlmutter et al., 1999; Rubin et al., 2015, 2023; Scolnic et al., 2018, 2022; DES Collaboration, 2024), the growth of structure from gravitational lensing and galaxy clustering measurements (e.g., Tegmark et al., 2004; Smith et al., 2007; Das et al., 2011; van Engelen et al., 2012; Planck Collaboration, 2020d; Carron et al., 2022; Bianchini et al., 2020; Qu et al., 2024b; Ge et al., 2024; DES Collaboration, 2022; Amon et al., 2022; Secco et al., 2022; Heymans et al., 2021; Asgari et al., 2021; More et al., 2023; Miyatake et al., 2023; Sugiyama et al., 2023; Dalal et al., 2023; Li et al., 2023a; Dark Energy Survey and Kilo-Degree Survey Collaboration, 2023; Alam et al., 2017, 2021; Philcox & Ivanov, 2022; DESI Collaboration, 2024c), and a wide array of additional probes. However, there is strong motivation to further test the model and its underlying ingredients, particularly given our lack of microphysical knowledge of the dark sector. The CMB is a uniquely powerful probe of extensions to CDM (e.g., Planck Collaboration, 2020c; Aiola et al., 2020; Balkenhol et al., 2021), both because of the theoretical accuracy with which new signals can be predicted in the CMB and because the CMB is sensitive to weakly-coupled new physics that is often otherwise difficult to probe.
In this paper, we stress-test using a state-of-the-art CMB dataset built from the new Atacama Cosmology Telescope (ACT) Data Release 6 (DR6) measurements of the small-scale CMB temperature and polarization power spectra. A companion paper presents these data and combines them with the Planck mission legacy data (Planck Collaboration, 2020a, b) to form the most statistically constraining CMB power spectrum dataset assembled to date (Louis et al., 2025). To validate constraints derived from the combination of ACT and Planck data, we also perform analyses combining ACT with legacy data from the WMAP mission (Bennett et al., 2013; Hinshaw et al., 2013). To assist in parameter degeneracy-breaking, we further add gravitational lensing measurements of the CMB from ACT DR6 and Planck (Qu et al., 2024b; Madhavacheril et al., 2024; Carron et al., 2022), as well as BAO distance measurements from the Dark Energy Spectroscopic Instrument (DESI; DESI Collaboration, 2024a, 2025a) or the Baryon Oscillation Spectroscopic Survey (BOSS; Alam et al., 2017, 2021), and from the Pantheon+ supernovae compilation (Scolnic et al., 2022). Further low-redshift data are used in some analyses as well, where significant additional constraining power can be gained.
We test the cosmological model via both single-parameter extensions of and by relaxing its fundamental assumptions — for example, considering variations in the underlying particle physics, energy densities of various components, and gravitational and non-gravitational interactions between them. We constrain new physics operating at energy scales ranging from the inflationary epoch to the recombination epoch to the late-time universe, including models that have been constructed with the aim of increasing the value of the Hubble constant or decreasing the amplitude of late-time density fluctuations inferred from the primary CMB, as well as models motivated by more fundamental considerations in particle physics, such as the existence of new light species in the early universe.
This work builds on — and extends — previous cosmological explorations performed with ACT CMB power spectrum measurements (Dunkley et al., 2011; Sievers et al., 2013; Louis et al., 2017; Aiola et al., 2020; Thiele et al., 2021; Hill et al., 2022; An et al., 2022; Li et al., 2023c; Kreisch et al., 2024). The new ACT DR6 data provide higher sensitivity over a broad range of angular scales, allowing us to access potential signals that would previously have been hidden in the noise. In some cases (depending on the model extension), the ACT DR6 sensitivity is comparable to that achieved by the Planck legacy dataset (Planck Collaboration, 2020c) and serves as a useful cross-check of the CMB response to a specific cosmological model. In other cases, because ACT DR6 provides constraining power in a different region of the power spectrum compared to Planck (particularly in polarization), the joint fit to both datasets surpasses bounds from Planck alone and thus represents a new state of the art.
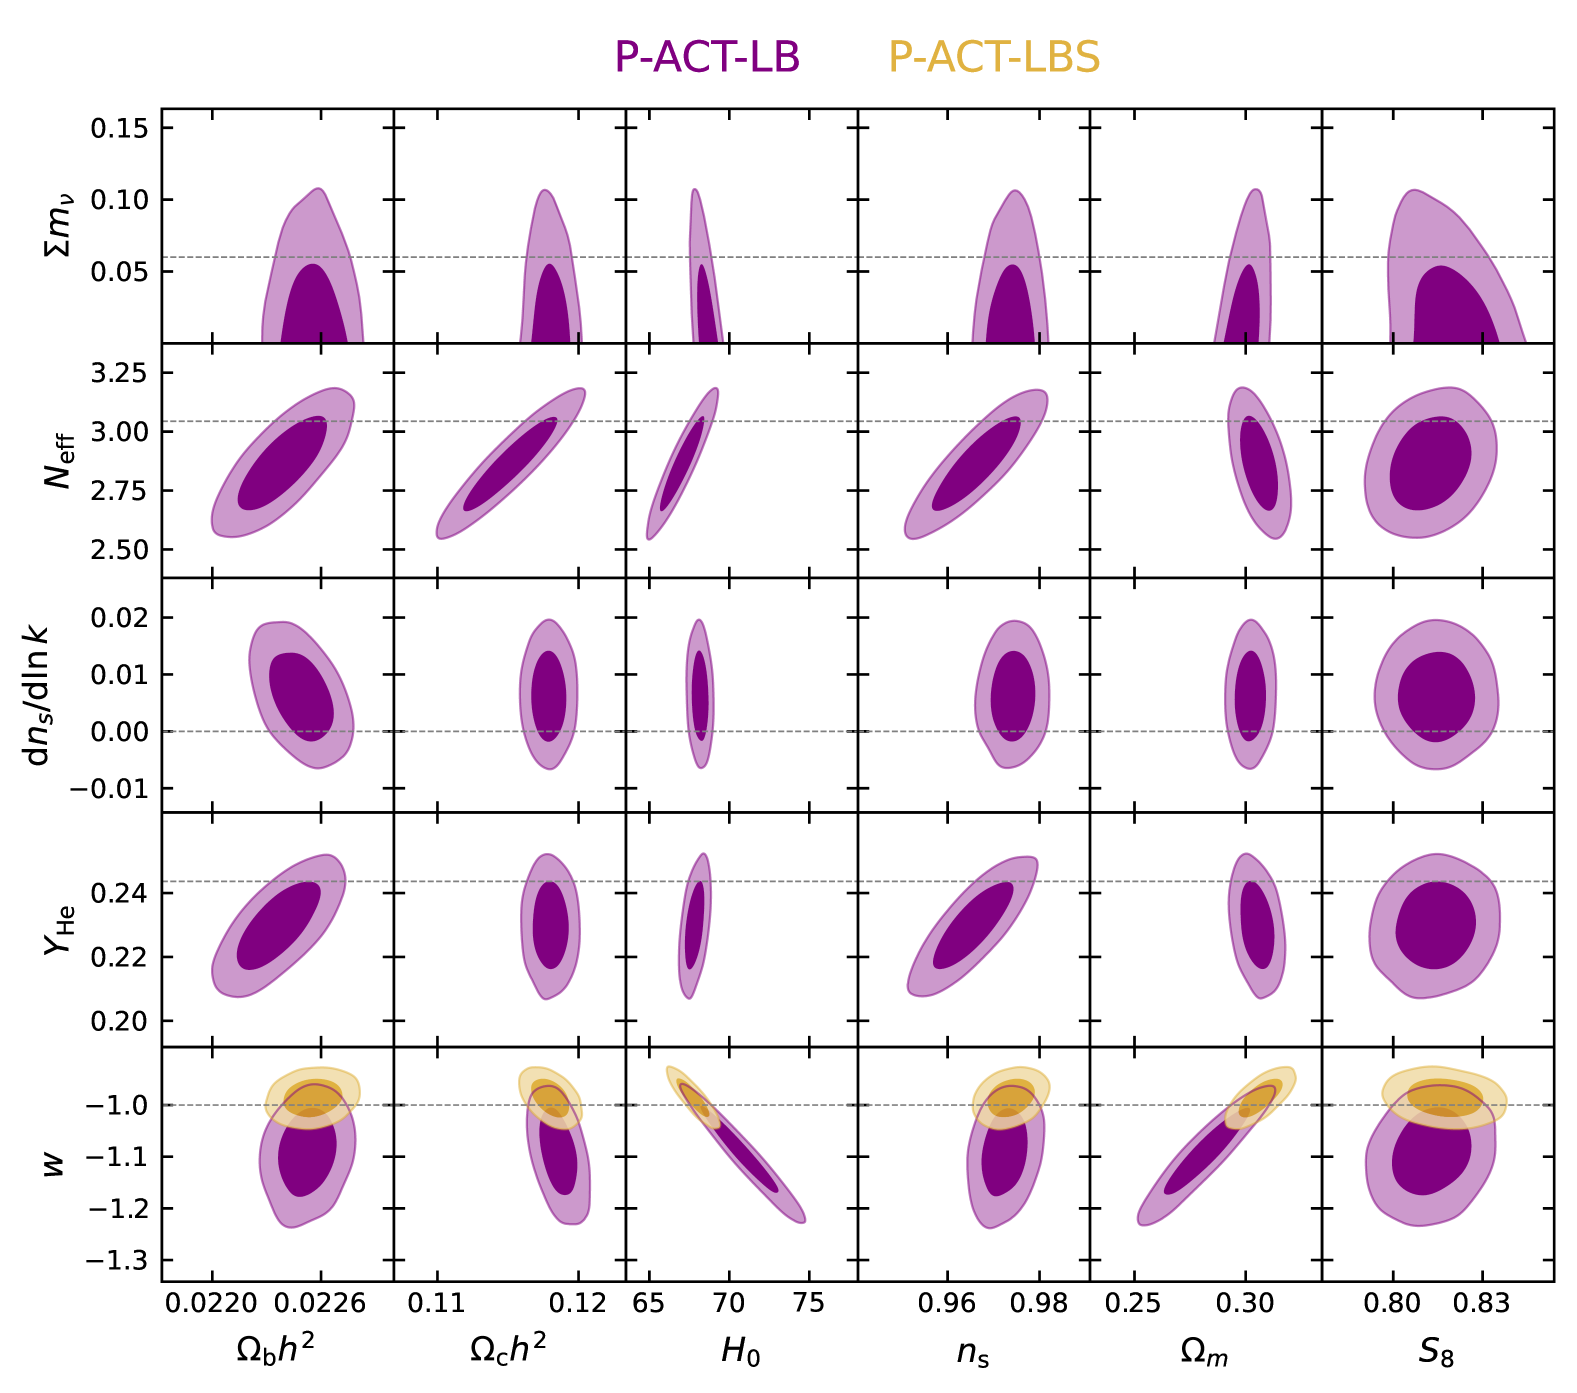
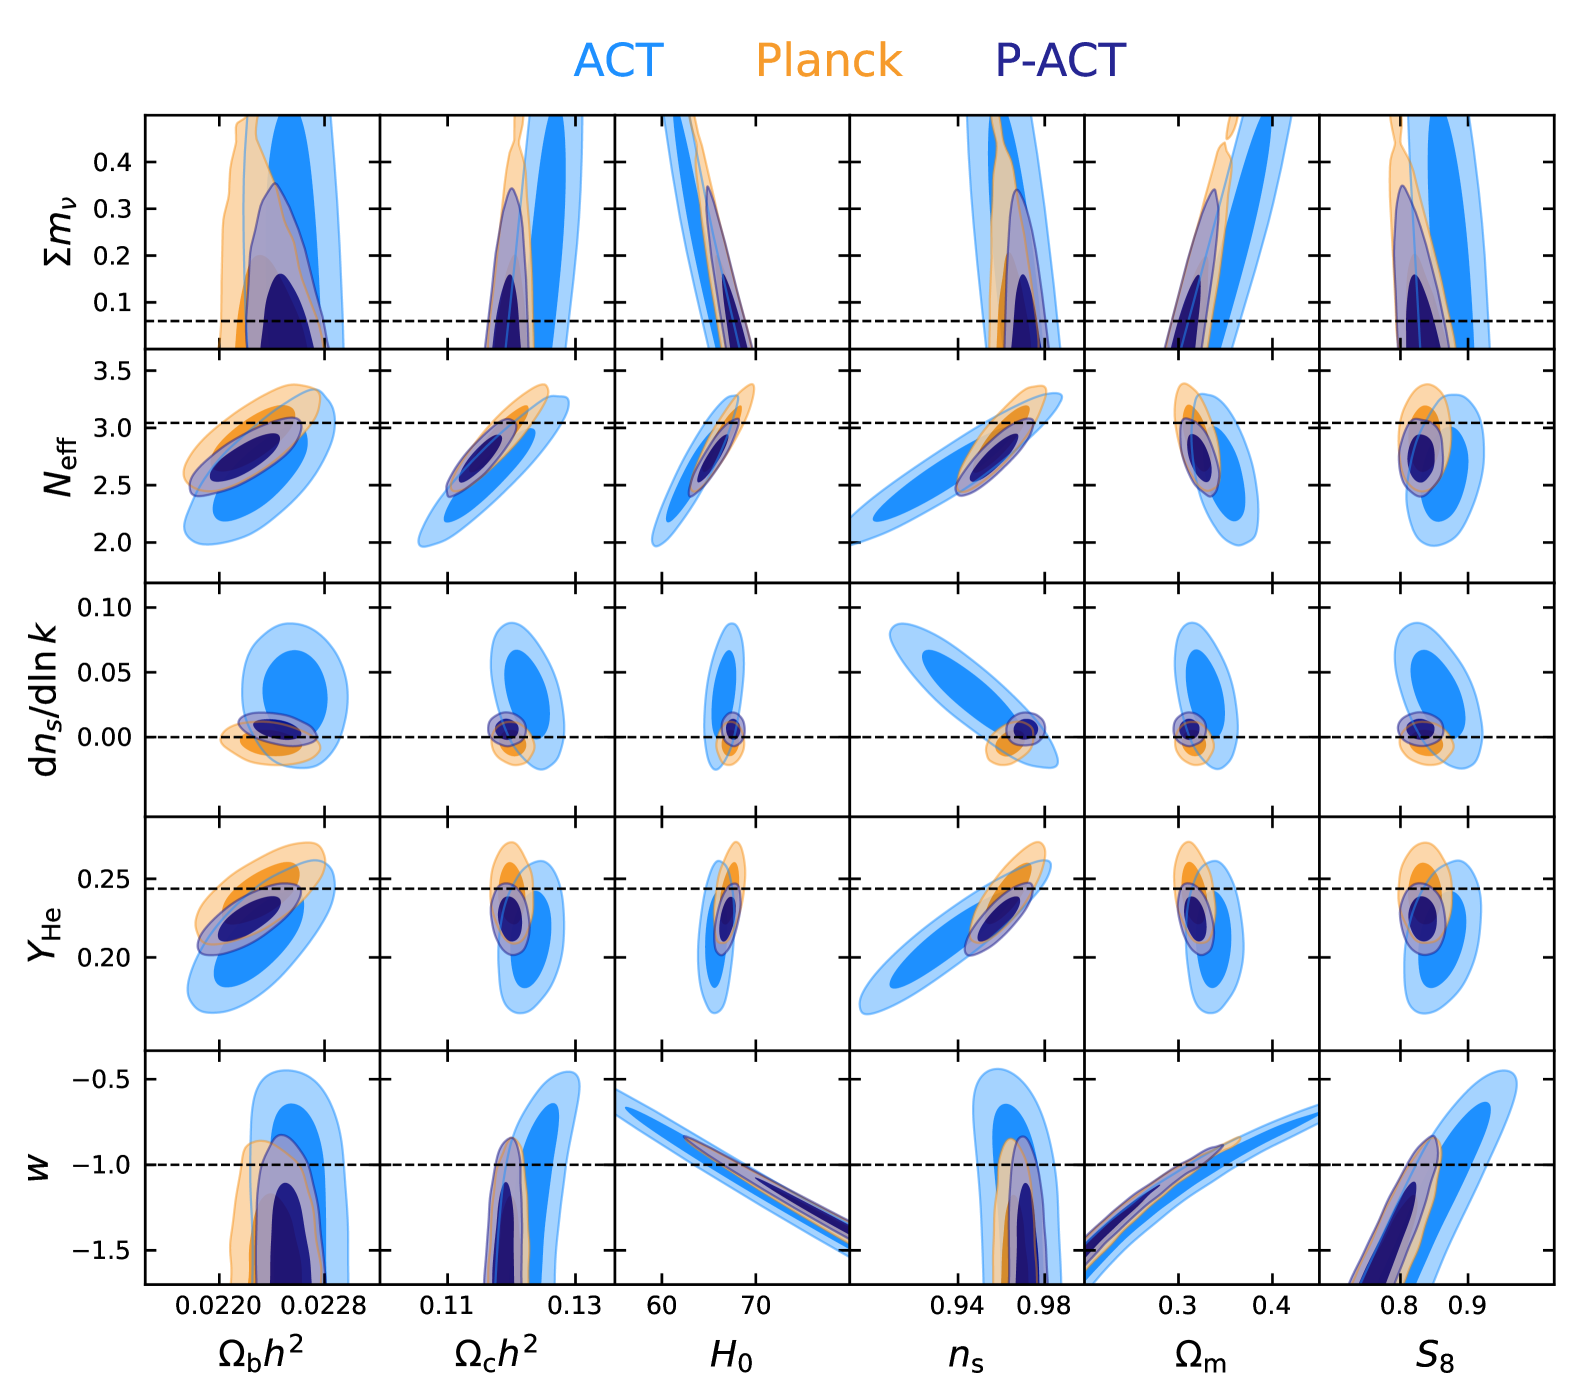
Figure 1 highlights new leading results from ACT DR6 combined with other datasets on a wide range of benchmark single-parameter extensions that are studied in detail later in this paper. This figure is not exhaustive and shows only a small fraction of the extended models analyzed in this work. Figure 2 isolates the specific contributions from the new ACT DR6 data to the primary CMB-derived constraints, by comparing constraints from ACT alone, Planck alone, and their combination. It is evident that the new ACT DR6 data have reached a level of precision competitive with that of Planck; furthermore, due to the complementarity of the two datasets, their joint analysis yields significant gains over the sensitivity of Planck alone, as will be explored throughout this paper.
Across all model extensions studied in this work, we find no preference for departures from the baseline model. Accordingly, we set new limits on key fundamental physics parameters and theoretical models that deviate from the standard scenario, such as models featuring new particles or fields in the pre-recombination universe. Models introduced to increase the CMB-inferred Hubble constant or to decrease the CMB-inferred amplitude of density fluctuations are not favored by our data.
This paper is part of a suite of ACT DR6 papers, with companion papers describing the maps (Naess et al., 2025, N25 hereafter), and power spectra, likelihood, and baseline parameter constraints (Louis et al., 2025, L25 hereafter). Other papers report the power spectrum covariance matrix estimation (Atkins et al., 2024), beam measurements and modeling (Duivenvoorden et al., in prep), and foreground modeling for the power spectrum (Beringue et al., in prep). The broad set of ACT DR6 papers is summarized in N25 and also includes noise simulations (Atkins et al., 2023), CMB lensing maps and interpretation (Qu et al., 2024b; Madhavacheril et al., 2024; MacCrann et al., 2024), component-separated CMB temperature, CMB E-mode, and Compton -maps (Coulton et al., 2024), studies of millimeter transients (Li et al., 2023b), and upcoming cluster and source catalogs.
The remainder of this paper is organized as follows. In §2 we summarize the main datasets used in our analysis. The theoretical framework and assumptions of our analyses are covered in §3, along with an overview of the various computational tools employed. §4-§7 contain the main set of constraints on numerous extensions of the standard cosmology, covering primordial perturbations and inflation constraints (§4), modifications of physics prior to and during recombination (§5), properties of known and hypothetical fundamental particles (§6), and modifications of gravity or other physics impacting cosmic evolution at late times (§7). We discuss model consistency and the resulting impact on cosmological parameter concordance in §8. In §9 we provide a brief summary, highlighting the consistency of the ACT and Planck CMB power spectra with the standard cosmological model. A set of Appendices provides further technical details.
2 Summary of data
2.1 CMB power spectra
The ACT DR6 power spectra described in L25 are derived from maps made from five years of observations collected during 2017–2022, using detector arrays sensitive to three frequency bands: f090 ( GHz), f150 ( GHz), and f220 ( GHz). The maps are described in N25. The array-band combinations and the multipole ranges that pass a comprehensive battery of null tests form the nominal DR6 dataset, comprising temperature-temperature power spectra (TT), temperature-E mode polarization power spectra (TE), and polarization-polarization power spectra (EE). These power spectra have white noise levels that improve over those of Planck by roughly a factor of three in polarization and a factor of two in temperature, with multi-frequency spectra measured over the multipole range and the CMB signal extracted in the range . The spectra and their covariance matrix are used as inputs to a multi-frequency likelihood, MFLike, and a CMB-only (foreground-marginalized) likelihood, ACT-lite, also described in L25.
To leverage the full multipole range accessible with the CMB for cosmological analyses, we combine ACT with satellite data. A minimal addition used in all analyses of the ACT primary CMB (labeled ACT throughout) is a Planck measurement of the optical depth to reionization from the low-multipole EE power spectrum () Sroll2 likelihood (Pagano et al., 2020). In many cases we compress the information of Sroll2 into a Gaussian prior on the optical depth, ; for models that include parameters degenerate with primordial power spectrum parameters, we use the full likelihood shape. As described in L25, we use a baseline CMB combination, labeled P-ACT, which extends the combined dataset further with the inclusion of Planck data on large-to-intermediate scales — at in TT and in TE/EE, truncating the multipole range of the plik_lite likelihood (Planck Collaboration, 2020b) and generating a “Planckcut” likelihood. This combination is built to increase constraining power while minimizing the overlap between the two experiments and allowing us to neglect their covariance. In cases where it is useful to cross-check the results with a Planck-independent CMB combination, we replace Planck with WMAP data from the final 9-year release (Bennett et al., 2013; Hinshaw et al., 2013), with this combination labeled W-ACT. In this case, we truncate the low- WMAP polarization likelihood, replacing it with the Planck Sroll2 likelihood. We use a Python implementation of the WMAP likelihood, pyWMAP, which retains only the data in temperature (on all scales) and at in polarization.
2.2 CMB lensing
Incorporating CMB lensing data into our cosmological constraints provides valuable complementary information to that obtained from the primary CMB power spectra. Gravitational lensing of the CMB probes large-scale structure across a wide range of cosmic history, with a broad peak at – and a tail extending to high redshift.
The ACT DR6 CMB lensing release provides the most precise detection of CMB lensing to date, with a (Qu et al., 2024b; Madhavacheril et al., 2024) measurement of the lensing power spectrum. Lensing is robustly measured across multipoles , with extensive tests confirming stability against systematics and foreground contamination (MacCrann et al., 2024). The associated likelihood conservatively uses only this baseline range to minimize potential systematic impacts.
The Planck PR4 dataset provides a CMB lensing measurement comparable to ACT DR6 in signal-to-noise, achieving 42 using the reprocessed NPIPE maps across multipole range (Carron et al., 2022). Combining Planck with ACT DR6 yields a state-of-the-art lensing power spectrum, with ACT adding high-precision data on smaller scales, .
Our analysis uses a Gaussian likelihood framework to combine the ACT DR6 and Planck PR4 bandpowers, which appropriately accounts for the small correlation between the two datasets (Qu et al., 2024b; Madhavacheril et al., 2024). The effective signal-to-noise ratio of the combined ACT DR6 + Planck NPIPE lensing spectrum, accounting for their joint covariance, corresponds to 58. Perturbative adjustments are also applied to correct for the weak dependence of the measurements on cosmological assumptions, following methods outlined in Planck Collaboration (2016b); Madhavacheril et al. (2024).111Although the ACT DR6 CMB lensing likelihood corrections have not been recomputed based on the improved knowledge of ACT maps and power spectra presented in this new suite of papers, we do not expect this to impact our results. We explicitly verify that even omitting these corrections altogether has negligible impact on our inferred parameter constraints.
2.3 BAO
BAO data measure the acoustic scale at Mpc in the clustering of galaxies in the late-time, , universe. This feature allows one to constrain distance ratios parallel and perpendicular to the line of sight as a function of redshift. The BAO feature along the line-of-sight direction measures , the inverse-ratio between the sound horizon at the baryon drag epoch, , and ; when combined with a calibration of (e.g., from CMB data), this allows a measurement of the Hubble parameter at redshift . The BAO feature in the angular correlation function of galaxies at redshift measures , the ratio between the comoving angular diameter distance and , which thus allows inference of when combined with a calibration of . These quantities are often combined to report measurements of the angle-averaged distance , with . This has a strong dependence on the matter density and other parameters affecting the expansion history of the universe (see, e.g., Eisenstein, 2005; Bassett & Hlozek, 2010; Weinberg et al., 2013). Because the main signature is generated during a phase of linear evolution of matter density perturbations, BAO measurements have become the most common cosmological dataset used to break geometric degeneracies in CMB analyses.
Previous analyses used a compilation of BAO data at different redshifts from multiple surveys, such as the Baryon Oscillation Spectroscopic Survey (BOSS) (Alam et al., 2017) and the 6dF Galaxy Redshift Survey (Beutler et al., 2011). Here, we use the recent DESI Year-1 observations of the BAO feature in galaxy, quasar, and Lyman- forest tracers (DESI Collaboration, 2024a, 2025a, 2025b) as our baseline BAO combination. This DESI dataset spans and includes twelve total data points, of which ten are pairs of and , and two are combined measurements, one each at the lowest and highest redshifts. To ensure that our results are not solely driven by DESI, and in light of the tension between some of the DESI luminous red galaxy (LRG) data points and previous measurements at the same redshifts, we also consider analyses with DESI replaced by BOSS/eBOSS BAO data, including both BOSS DR12 LRGs (Alam et al., 2017) and eBOSS DR16 LRGs (Alam et al., 2021). We primarily perform such analyses for models in which BAO data have a significant impact on the parameter constraints.
2.4 SNIa
Type Ia supernovae (SNIa) are powerful probes of cosmological distances in the modern universe (the last ten billion years). Using SNIa anchored to other cosmological distance indicators, supernovae constrain the luminosity distance across a range of redshifts; even in the absence of absolute calibration, SNIa precisely constrain the relative expansion history of the universe at late times. SNIa are thus sensitive probes of the matter density and the equation of state of dark energy, as well as the spatial curvature when analyzed in tandem with the CMB. To maximize redshift coverage and ensure consistency of calibration of the SNIa, surveys from different groups are combined and re-calibrated, and released with a likelihood including systematic errors from fitting a model of supernova brightness, calibration offsets, and telescope systematics (e.g., Rubin et al., 2015, 2023; DES Collaboration, 2024; Scolnic et al., 2018). Here we use the latest SNIa compilation from Pantheon+ (Scolnic et al., 2022; Brout et al., 2022), which brings together 18 samples comprising 1550 spectroscopically-confirmed SNIa spanning . We primarily include Pantheon+ as an additional dataset when exploring models that affect the expansion history of the late-time universe, and do not explore other SNIa compilations.
2.5 Glossary of data combinations and other additional datasets
In this paper, we analyze the CMB primary anisotropy datasets introduced in §2.1 alone or combined with CMB lensing from §2.2, BAO data from §2.3, and SNIa data from §2.4. We report the resulting constraints with the label conventions for different dataset combinations summarized in Table 1. We present the constraints obtained with the most constraining data combination as our baseline results: depending on the model, this combination is either P-ACT-LB or P-ACT-LBS. We discuss and compare these results with those obtained from the primary CMB anisotropies — this is slightly different from the approach taken by the Planck collaboration, which focused primarily on comparisons between a joint CMB primary-anisotropy and lensing result versus results from the CMB combined with large-scale-structure (LSS) probes. We justify our ability to combine these data in §8.1, showing that the best-fit model to P-ACT CMB data gives excellent predictions for the low-redshift measurements, and furthermore that the model gives an excellent joint fit to all data.
| Planck | PlanckTT/TE/EE + Sroll2 |
|---|---|
| ACT | ACTTT/TE/EE + Sroll2 |
| P-ACT | ACTTT/TE/EE + Planck + Sroll2 |
| W-ACT | ACTTT/TE/EE + WMAPTT/TE/EE + Sroll2 |
| followed by | |
| -LB | when adding CMB lensing and BAO |
| -LS | when adding CMB lensing and SNIa |
| -LBS | when adding CMB lensing, BAO, and SNIa |
Depending on the physical signature probed by each model, additional astrophysical and cosmological measurements (beyond CMB lensing, BAO, and SNIa data) can help to further tighten the parameter constraints. These are folded into specific analyses as described in each section of interest below.
As shown in L25, our baseline results confirm a discrepancy between the value of the Hubble constant, , derived from the primary CMB and some measurements of this quantity from the local universe — see Freedman & Madore (2023); Verde et al. (2024) for relevant reviews. Specifically, the constraint on the Hubble constant using distance ladder methods with Cepheid-calibrated SNIa, from the SH0ES collaboration, km/s/Mpc (Riess et al., 2022; Breuval et al., 2024), is the most precise local measurement and also the most discrepant with the CMB estimate (L25). The latest value obtained by the CCHP program using tip of the red giant branch stars (TRGB) to calibrate SNIa distances is km/s/Mpc (Freedman et al., 2020, 2024), which is consistent with the CMB value (and with the SH0ES value), but less precise than the SH0ES constraint. Further recent results from direct measurements can be found in Verde et al. (2024). As a baseline choice, we do not combine our data with local measurements of . However, we discuss in detail cases where a given model can accommodate a larger value of the Hubble constant compared to or where there are important parameter degeneracies that impact .
Similarly, as shown in L25, our baseline results confirm the value of the fluctuation-amplitude parameter (obtained from a combination of the amplitude of matter fluctuations on scales of Mpc, , and the total matter density, ) found in previous Planck analyses, which lies – higher than values found in some weak lensing and galaxy clustering studies (see, e.g., Madhavacheril et al., 2024 for a collection of recent results from low-redshift probes). We emphasize that ACT and Planck CMB lensing data show no evidence of a low value (Madhavacheril et al., 2024; Planck Collaboration, 2020d). As with , as a baseline choice, we do not combine our data with low-redshift measurements of . This choice is also motivated by the fact that some extended models alter the shape and/or redshift evolution of the matter power spectrum, and thus a dedicated reanalysis of the relevant data within the context of each model would be necessary in order to derive valid constraints. Nevertheless, for some models it is appropriate to consider external priors on from low-redshift data; where this is useful and allowed by the parameter posteriors, we include in our analysis a prior from the joint analysis of DES and KIDS weak lensing data, (Dark Energy Survey and Kilo-Degree Survey Collaboration, 2023).222This is a symmetrized Gaussian approximation of the fixed-neutrino-mass result from Table 4 of Dark Energy Survey and Kilo-Degree Survey Collaboration (2023).
3 Analysis methodology
We obtain cosmological parameter constraints using the ACT DR6 multi-frequency or CMB-only likelihood333As shown in L25, these two likelihoods yield cosmological parameters that agree within . coupled to Cobaya (Torrado & Lewis, 2021), which itself is coupled to the Einstein-Boltzmann codes camb (Lewis et al., 2000) or class (Lesgourgues, 2011; Blas et al., 2011), or to CosmoPower emulators of these codes (Spurio Mancini et al., 2022; Bolliet et al., 2024; Jense et al., 2025; Qu et al., 2024a), to compute the lensed theoretical CMB power spectra at high precision, as described in Appendix A. All codes exploring extended models requiring modifications to camb and class are benchmarked against the respective camb and class baseline results. In Table 4 in Appendix A, we provide a summary of the theory code and likelihood that are used for each model.
Unless explicitly mentioned otherwise, we compute all theory predictions using HyRec (Ali-Ha¨ımoud & Hirata, 2011) or CosmoRec (Chluba et al., 2010) (in class and camb, respectively), rather than Recfast (Seager et al., 1999), to obtain higher precision for recombination physics.444The Recfast “fudge parameters” were tuned to provide sufficient accuracy for Planck, but are no longer sufficient for ACT DR6 sensitivity. We test the latest versions of HyRec and CosmoRec to ensure that they provide accurate recombination calculations when we compute the DR6 likelihood evaluation across the full parameter space, while also cross-checking the two codes against each other. We use both because the newest CosmoRec version is not yet available within class; thus we use CosmoRec in camb and HyRec in class. As a baseline choice, we compute Big Bang Nucleosynthesis (BBN) predictions using calculations of the primordial helium abundance from PRIMAT (Pitrou et al., 2018), but in §6.2 we explore other options and discuss in detail the impact of different helium and deuterium abundance calculations.555Differences in the exact helium abundance predicted by the most recent BBN codes have a negligible impact on the CMB primary anisotropy spectra and therefore on cosmological parameters inferred from them. We also note that PRIMAT-based BBN data were not present in class when our analyses were performed (although they now are), so we manually imported a PRIMAT-based table from camb to use in our class calculations. We take care to account for a small difference in the value assumed in the PRIMAT BBN table (3.044) and that assumed in the class BBN module (3.046). We also use the latest version of HMcode (Mead et al., 2021) (rather than Halofit, Smith et al., 2003; Takahashi et al., 2012) for modeling non-linear corrections to the matter power spectrum, unless explicitly stated otherwise. At ACT DR6 precision, the impact of non-linear corrections to CMB lensing are non-negligible even in the primary CMB power spectra (McCarthy et al., 2022). We adopt the dark-matter-only HMcode model for the non-linear matter power spectrum, with no baryonic feedback corrections.666The latest HMcode model is not yet implemented in the main branch of class; we thank J. Lesgourgues for providing an updated version with this model implemented (developed from class v3.2.2). We note that HMCode is not guaranteed to give accurate results when applied to models that alter late-time growth (e.g., models with interactions between dark matter and dark energy in the late universe, as in §7.3); in such cases, we use custom alternative models or restrict to linear scales. The vast majority of the new-physics models studied in this work alter physics in the early universe, and hence their impact on structure formation is generally captured in a change to the linear matter power spectrum at the onset of structure formation, which in most cases remains close to that in . These modeling choices are validated in Appendix A.
Our parameter set includes the six basic CDM cosmological parameters: the physical baryon and cold dark matter densities, and , the optical depth due to reionization, , the amplitude and spectral index of the power spectrum of primordial adiabatic scalar perturbations, and , both defined at a pivot scale ,777This pivot scale is the default choice in many CMB analyses, used by Planck, ACT, SPT, and other experiments. In some cases, following e.g., WMAP, Planck, and BICEP, results are also shown for Mpc-1 — when for example it is important to look at larger scales. This is explicitly mentioned in the relevant sections. and a parameter that sets the absolute distance scale: (i) in camb, an approximation to the angular scale of the acoustic horizon at decoupling, ; (ii) in class, the angular size of the sound horizon at decoupling, ; or (iii) the Hubble constant, in km/s/Mpc (note that the exact definition of the angular scale varies between camb and class — see, e.g., the discussion in Bolliet et al., 2024).888 is expressed throughout this paper in km/s/Mpc; units are generally omitted for brevity. We adopt broad, flat, uninformative priors on all parameters in every analysis in this paper (except when imposing an Sroll2-informed prior on in some ACT-only fits). Priors on extended-model parameters are described in each section, and are generally chosen to be uninformative as well. From the sampled parameters, we obtain several derived parameters, including the rms amplitude of linear density fluctuations at on scales, , the matter density fraction , and . For models in which neutrino physics is not varied, we fix neutrino properties to comprise one massive and two massless particles, with total mass eV and effective number of neutrino species . Following Planck and the ACT DR6 CMB lensing analyses, we assume three massive eigenstates (zero massless) when analyzing models where the sum of the neutrino masses is a free parameter. Additional, model-specific parameters are added to the base set as explained in each subsection below.
Extra parameters are included in our theoretical model for astrophysical foregrounds, passband uncertainties, calibration, and polarization efficiency factors. These parameters are varied as described in L25 when using the MFLike likelihood, or reduced to a minimum set of two varying parameters for overall calibration and polarization efficiency when using the ACT-lite likelihood (also described in L25).
MCMC chains are run with theory predictions computed up to and with the Gelman-Rubin convergence parameter, , reaching values and in nearly all cases smaller than 0.01. Parameter posteriors and statistical results are obtained with GetDist (Lewis, 2019). Marginalized confidence intervals (for two-tailed limits) are calculated with the standard credible-interval approach, i.e., the interval between the two points with highest equal marginalized probability density.
Model comparisons are performed with respect to the benchmark results presented in L25. We determine the maximum a posteriori (MAP) point in parameter space for each model (note that the ACT DR6 likelihood includes informative priors on some nuisance parameters, and thus the MAP is used, rather than the maximum-likelihood point). The MAP for each model is then compared to the best-fit CDM result for the relevant dataset combination. We take care to discard contributions to the effective MAP value arising from uninformative priors — the informative priors placed on nuisance parameters are always identical, and, as noted above, their contributions to the overall are accounted for in the best-fit model determination. For reference, the best-fit P-ACT CDM model yields MAP and for the full P-ACT dataset (see also L25).
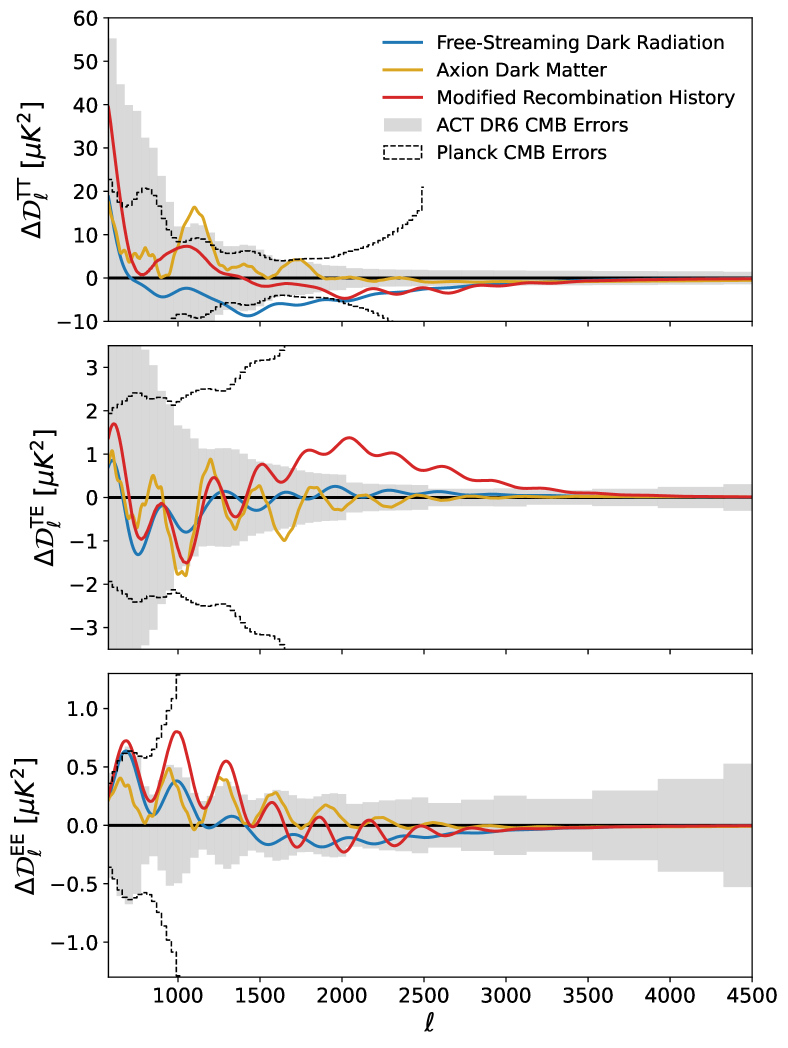
Constraints on parameters of the baseline model are presented in L25. In the following, we report constraints on a large suite of extended cosmological models, organized into four topical sections. In Fig. 3, we illustrate with a few examples how ACT data push constraints on these models beyond what has been achieved by Planck. Some models exhibit features on small scales () not measured by Planck. In other cases, the integrated sensitivity over an extended range of multipoles on small scales, and the sensitive ACT DR6 measurements of TE and EE at intermediate scales, rule out models at high significance that would be allowed within the Planck bounds.
We also discuss how ACT DR6 improves on previous ACT releases, in particular for models that showed a hint of a preference over in the previous ACT DR4 dataset (Hill et al., 2022; Kreisch et al., 2024). Additional comparisons with the DR4 results are shown and discussed in Appendix B and Appendix E.
4 Primordial perturbations and inflation
4.1 Scale invariance of scalar perturbations
One key prediction of the simplest single-field slow-roll inflation models is an almost scale-invariant spectrum of primordial scalar perturbations — the scalar spectral index being close to, but crucially different from (and usually less than) unity (see, e.g., Peiris et al., 2003; Mukhanov, 2007). Analyses of Planck CMB data have confirmed this prediction to high precision and shown its robustness across models (Planck Collaboration, 2020c, e). The new constraints on from ACT DR6 are presented and discussed in L25. Here, to test the inflation slow-roll approximation further, we take the common approach of expanding the power-law form of the primordial power spectrum of scalar curvature perturbations around a pivot scale (Kosowsky & Turner, 1995)
| (1) |
and constrain the running of the spectral index, — i.e., the variation of as function of scale , evaluated at . This is a single-parameter extension to , varied in the range .
This parameter was found to be consistent with zero by Planck, with from combining Planck CMB, lensing, and BAO data (Planck Collaboration, 2020c, e). With the addition of the new ACT DR6 spectra we confirm a vanishing running of the spectral index and tighten the error bar, finding
| (2) | |||||
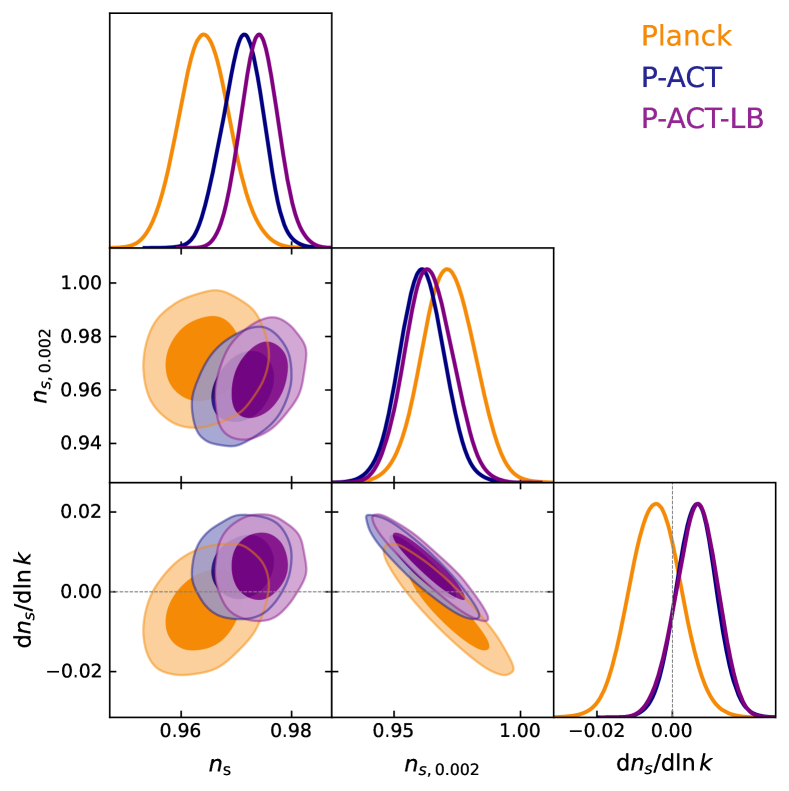
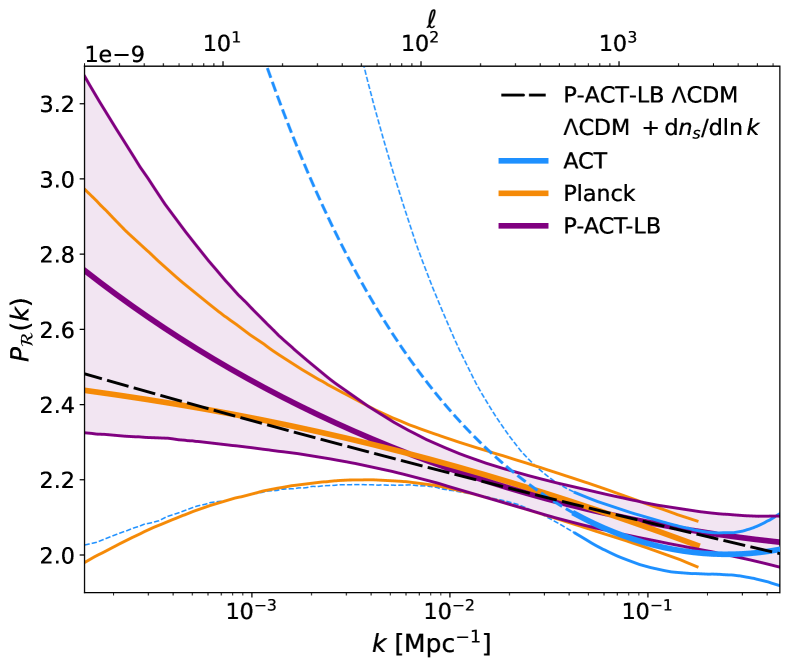
Lacking the measurement of the first acoustic peak, and with both parameters acting to balance the tilt of the spectrum at small scales, ACT alone provides a looser bound on the combined space compared to Planck, as shown in Fig. 2, giving . With the P-ACT combination, is firmly constrained and the error bar on the running is tightened by . Adding additional datasets has a marginal impact here, with the constraints stabilizing around a vanishing running. Figure 4 shows the combined measurement of and projections to Planck’s large scales, at . In Fig. 5 we report the same measurements in terms of the scalar primordial power spectrum using ACT, Planck, and P-ACT-LB. We infer (using Eq. 1) by post-processing the chains using the amplitude, spectral index, and running of the spectral index of our runs, and computing the 95% two-tailed confidence interval. All three datasets measure a similar amplitude and spectral index at the pivot scale, but the constraints from Planck prefer a slight negative running of the spectral index (due to needing to reconcile constraints from large and small scales — see the discussion in Planck Collaboration, 2020c), indicated by the concave shape of the mean of the constraints, while ACT and the combination P-ACT-LB mildly prefer a slight positive running of the spectral index, changing the overall shape of to convex.
Our constraints on disfavor the moderate evidence for negative running of the spectral index seen in combined fits to Lyman- forest and Planck data, (Palanque-Delabrouille et al., 2020). From CMB data alone (P-ACT), we exclude at over significance.
4.2 Primordial power spectrum
In order to explore a broader range of deviations from a simple power-law primordial adiabatic power spectrum than those captured solely by the running of the scalar spectral index, we consider a more model-independent approach.
We reconstruct the primordial power spectrum of the scalar perturbations for wavenumber bins centered at and then 26 equally-spaced logarithmic bins from , where (following previous similar analyses in Bridle et al., 2003; Guo et al., 2011; Hlozek et al., 2012; Aich et al., 2013; Hunt & Sarkar, 2014; de Putter et al., 2014; Miranda et al., 2016; Hazra et al., 2016; Obied et al., 2017; Planck Collaboration, 2020e; Raffaelli & Ballardini, 2025). Given the degeneracy between the primordial power and the optical depth (often described in terms of the degeneracy), we sample the value of for each bin. We use the cubic spline interpolation method implemented within camb to build the initial power spectrum from our binned values. For values below our minimum-assumed wavenumber , we set the amplitude of the primordial power spectrum to . This approach removes the scalar spectral amplitude and the scalar index as sampled parameters, but adds the amplitudes within the 30 different bins as described above, leading to 28 additional parameters/degrees of freedom in this model as compared to . The prior ranges that we adopt for each bin are given in Table 5 in Appendix C, and we use the ACT-lite likelihood to sample the extended parameter space.
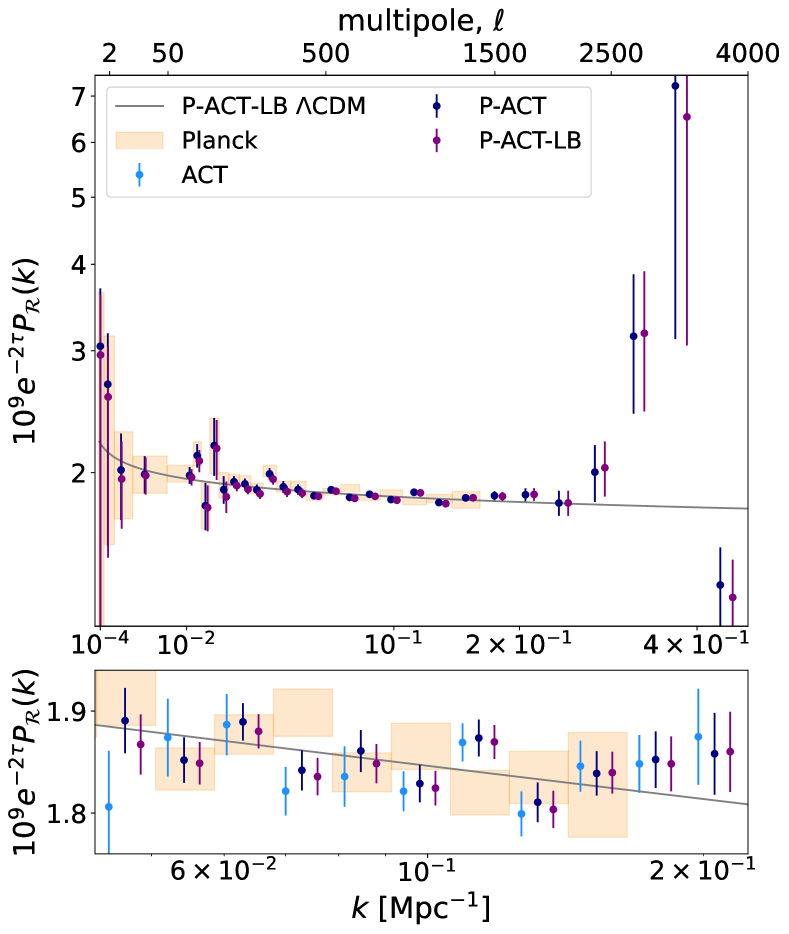
In Fig. 6 we present constraints on the binned primordial power spectrum from ACT, Planck, P-ACT, and P-ACT-LB, compared to the P-ACT-LB best-fit CDM power law. The constraints from P-ACT are improved over the Planck-alone measurements wherever ACT data are included (for ), with the ratio of P-ACT to Planck error bars ranging between 0.95 and 0.43 for wavenumbers between or (). This range is chosen as is the first wavenumber where P-ACT significantly improves over Planck and is the highest wavenumber where Planck has a two-sided marginalized posterior (rather than an upper limit). The correlations across bins can be very high and present either between direct neighbors or between more distant bins. In particular, we find correlations at the level of , with a significant increase around Mpc-1 where bins 6–9 are strongly anti-correlated reaching a level of 90%, and above Mpc-1 where correlations increase again to reach at small scales.
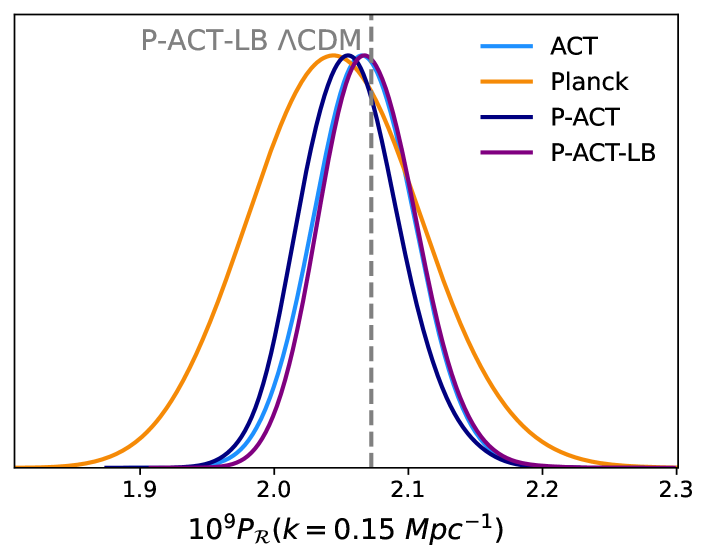
In Fig. 7, we illustrate the improvement in constraining power for . Above that wavenumber, the Planck constraints essentially fill the assumed prior range, while ACT constrains the amplitude of primordial power with a two-sided marginalized posterior up to and with a one-sided 95% CL to . The improvements come from the ACT sensitivity to smaller angular scales ( In particular, at , we obtain a fractional error of 2.8% and 1.4% on for Planck alone and ACT alone, respectively, and a fractional error of
| (3) | |||||
with the individual fits consistent with CDM. Our new constraints improve the range of over which there are significant constraints by about a factor of three compared to Planck.
We map this measurement onto the linear matter power spectrum and compare with other measurements in Appendix C.
4.3 Isocurvature perturbations
Standard single-field inflation predicts purely adiabatic primordial perturbations, in the sense that all perturbations arise from a single degree of freedom (the local time at which inflation ends). This generally implies that fractional perturbations in the number density of all species are equal on super-horizon scales (). In contrast, isocurvature perturbations — characterized by variations in the relative number densities or velocities of different species — can arise in a variety of early-universe scenarios, particularly if there are additional fields present around the time of inflation (Linde, 1985; Mollerach, 1990; Polarski & Starobinsky, 1994; Garcia-Bellido & Wands, 1996; Linde & Mukhanov, 1997; Lyth & Wands, 2002; Kawasaki & Takahashi, 2001; Lyth et al., 2003). Whereas current cosmological observations are consistent with purely adiabatic perturbations, and a pure isocurvature perturbation has been excluded since early measurements of the large-scale CMB anisotropies (Stompor et al., 1996; Enqvist et al., 2000, 2002), it is possible to have models with mixed adiabatic and isocurvature modes, as constrained in previous CMB anisotropy analyses (e.g., Bucher et al., 2004; Moodley et al., 2004; Bean et al., 2006; Planck Collaboration, 2014, 2016c, 2020e). In this section, we place constraints on a range of scenarios consisting of a mixture of an adiabatic mode with a single (possibly correlated) isocurvature mode. We refer the reader to Table 6 in Appendix D for a detailed compilation of the isocurvature constraints derived in this work.
There are four possible non-decaying isocurvature modes: cold dark matter density (CDI), baryon density (BDI), neutrino density (NDI), and neutrino velocity (NVI) (Bucher et al., 2000). At linear order, BDI and CDI modes have an indistinguishable impact on the CMB power, differing only in amplitude; therefore, we do not analyze BDI modes directly.999Our CDI constraints can be converted to BDI constraints by applying the appropriate factors of and , as discussed in Planck Collaboration (2020e). Additionally, we do not consider NVI because it is less theoretically motivated than CDI and NDI. Consequently, we focus on two isocurvature modes: and .
The primordial curvature and isocurvature fluctuations are described by the curvature power spectrum, , the isocurvature power spectrum, , and their cross-power spectrum, . Following Planck analyses of isocurvature (Planck Collaboration, 2014, 2016c, 2020e), we assume power-law primordial power spectra defined in terms of their amplitudes at two scales, and , hence
| (4) | ||||
where and . The mixed adiabatic and isocurvature models are characterized by four new parameters: , , , .
For computational reasons, we focus on models where the adiabatic and isocurvature perturbations are either uncorrelated or fully (anti)-correlated, and thus is a derived parameter. These are the most well-motivated isocurvature scenarios. We sample the adiabatic amplitudes and assuming uniform priors between as a replacement of the amplitude and scalar spectral index of the baseline parameter set. For the isocurvature amplitudes, we sample and (for models where is not fixed) assuming uniform priors between . We sample the amplitudes at two scales instead of sampling a single amplitude and a spectral index to mitigate prior-volume effects that can arise if the data have no preference for isocurvature modes (Moodley et al., 2004).101010We use class with the settings described in Appendix A to compute theoretical predictions for isocurvature models. Additionally, we set hmcode_kmax_extra=100 to address issues in the HMCode non-linear power spectrum calculation for blue-tilted isocurvature perturbations. Despite this, the non-linear evaluation can still fail for a small fraction (%) of samples in the Planck-only uncorrelated CDI constraints with a free spectral index. We exclude this subset of samples from our analysis, slightly affecting Planck-alone constraints for this model. The issues with the non-linear computation do not affect any of our constraints including ACT data, which already exclude such blue-tilted models.
4.3.1 Uncorrelated models
We first present constraints on an uncorrelated () mixture of adiabatic perturbations with a single, possibly scale-invariant, CDI or NDI mode. Scale-invariant CDI perturbations can arise if there are axions or axion-like particles present during inflation (Turner et al., 1983; Axenides et al., 1983; Seckel & Turner, 1985; Turner & Wilczek, 1991; Linde, 1991; Beltran et al., 2007; Hertzberg et al., 2008). Axions can also produce uncorrelated CDI with a blue spectral index (Kasuya & Kawasaki, 2009).
For scale-invariant CDI and NDI modes, we vary and fix . The P-ACT constraint on the amplitude of scale-invariant CDI perturbations is (95% CL). This is slightly weaker than the Planck-only bound of (95% CL), due to the positive correlation between the adiabatic spectral index () and the CDI amplitude. For NDI, the baseline P-ACT constraint on the isocurvature amplitude is at (95% CL), which is 15% tighter than the Planck-only bound, (95% CL). Neither of these constraints changes appreciably between P-ACT and P-ACT-LB.
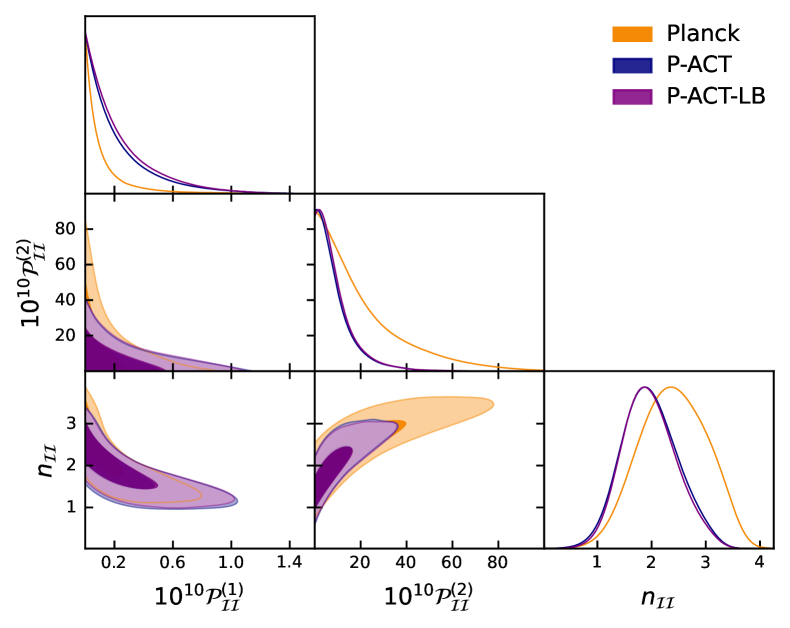
Figure 8 shows the marginalized posterior distributions for the uncorrelated CDI model with a free spectral index. Combining ACT and Planck, we find
| (5) |
The P-ACT constraint on is a significant improvement over the Planck-only constraint of . Interestingly, the P-ACT constraint on is weaker than that from the Planck dataset alone. This is a consequence of the anti-correlation between and , assuming a power-law spectrum. In other words, the large values of that are consistent with the Planck data, but not the P-ACT combination, drive the Planck-only marginalized posterior on towards zero. The addition of CMB lensing and BAO data does not significantly change the P-ACT constraints on this model.
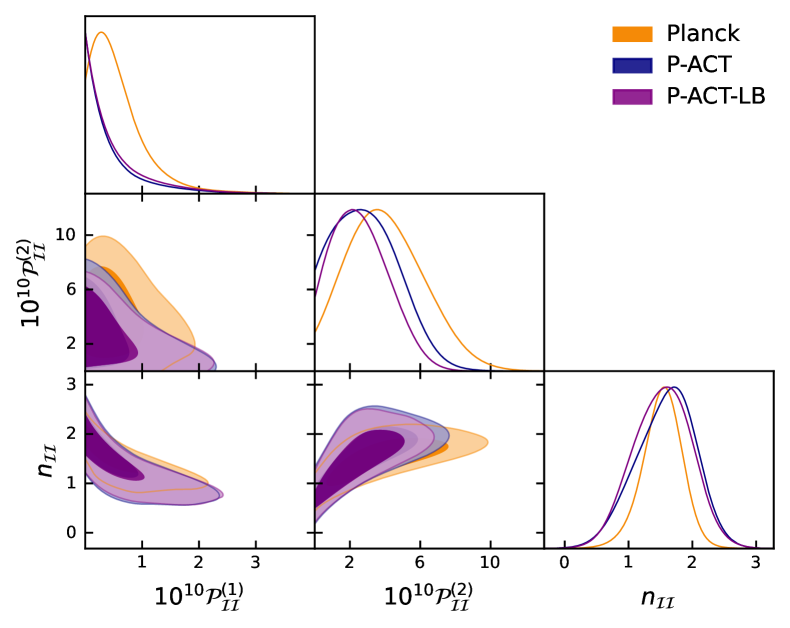
Figure 9 presents the marginalized posteriors on the isocurvature amplitudes for an uncorrelated mixture of adiabatic and NDI modes assuming a free spectral index. Combining ACT and Planck, we find
| (6) |
Interestingly, although the Planck data alone showed a small, statistically insignificant peak in the posterior at non-zero values of and , this feature disappears when ACT DR6 data are included. Finally, including CMB lensing and BAO data further improves the constraint on the amplitude of NDI perturbations at to . In this case, the improvement from CMB lensing and BAO is predominately due to the anti-correlation between and , with P-ACT-LB preferring a slightly larger value of than P-ACT.
In summary, we find no evidence of uncorrelated CDI or NDI. Nevertheless, including ACT DR6 data leads to stringent bounds on the amplitude of small-scale isocurvature perturbations, highlighting the complementarity of large- and small-scale CMB observations.
4.3.2 Correlated models
We also present constraints on a correlated mixture of adiabatic and CDI perturbations. We consider the situation where the adiabatic and CDI modes are fully correlated, , as well as the fully anti-correlated scenario (). In both cases, we vary only and fix assuming . While the high-resolution ACT DR6 spectra are unlikely to significantly improve upon the Planck-only constraints on these models as the transfer function for scale-invariant CDI perturbations is significantly suppressed at high multipoles, we explore correlated CDI models because they are theoretically well-motivated. For example, mixed adiabatic and CDI perturbations with large (anti)-correlations arise in the curvaton scenario (Mollerach, 1990; Moroi & Takahashi, 2001; Lyth & Wands, 2002; Bartolo & Liddle, 2002; Lyth et al., 2003).
For the fully correlated model, the P-ACT dataset constrains the isocurvature amplitude to (95% CL). Including CMB lensing and BAO data slightly relaxes this bound to . For the fully anti-correlated model, P-ACT provides , improving modestly on the Planck-only limit (). P-ACT-LB leads to at 95% confidence.
Overall, we find no evidence of primordial isocurvature perturbations.
4.4 Tensor modes and constraints on inflation models
Tensor perturbations, for example in the form of primordial gravitational waves predicted by inflation models (see, e.g., Kamionkowski & Kovetz, 2016 for a review), add power on very large scales in the CMB T/E angular power spectra and generate a unique large-scale B-mode polarization signal not measured by ACT. However, the full behavior of the primordial perturbations depends on the ratio/co-existence of tensor and scalar modes, with the latter measured by ACT small-scale data via . Here, we study how the updated measurement of presented in L25 affects constraints on inflation models.
The modeling of tensor perturbations is similar to that used for scalars, , and is usually quantified by the tensor-to-scalar ratio parameter, . Here we set via the inflationary consistency relation, . Constraints on and can be directly related to the potential slow-roll parameters of inflation, and , which are determined by the shape of the inflaton potential, as
| (7) |
where is the Planck mass, is the inflaton potential, and and are its first and second derivatives. These parameters respectively describe the steepness and curvature of the inflaton potential, and they relate to the power spectrum parameters as
| (8) |
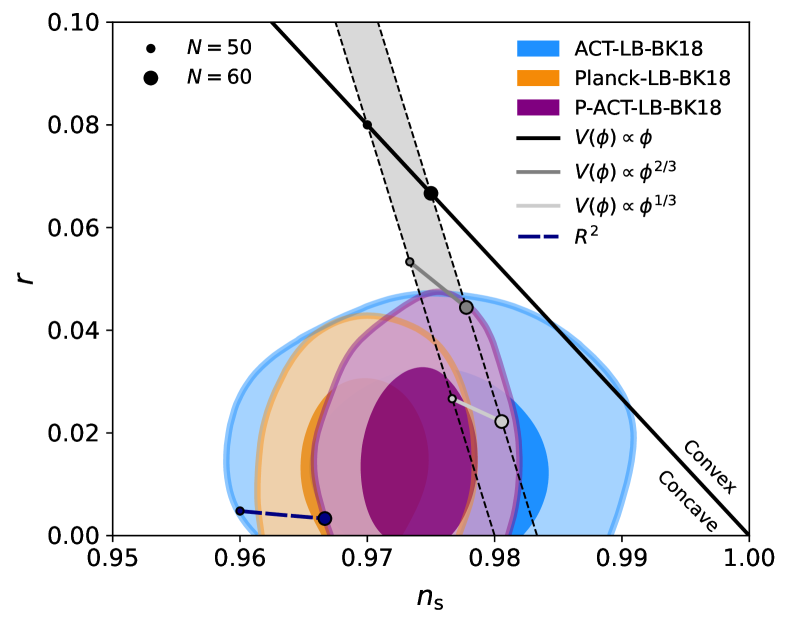
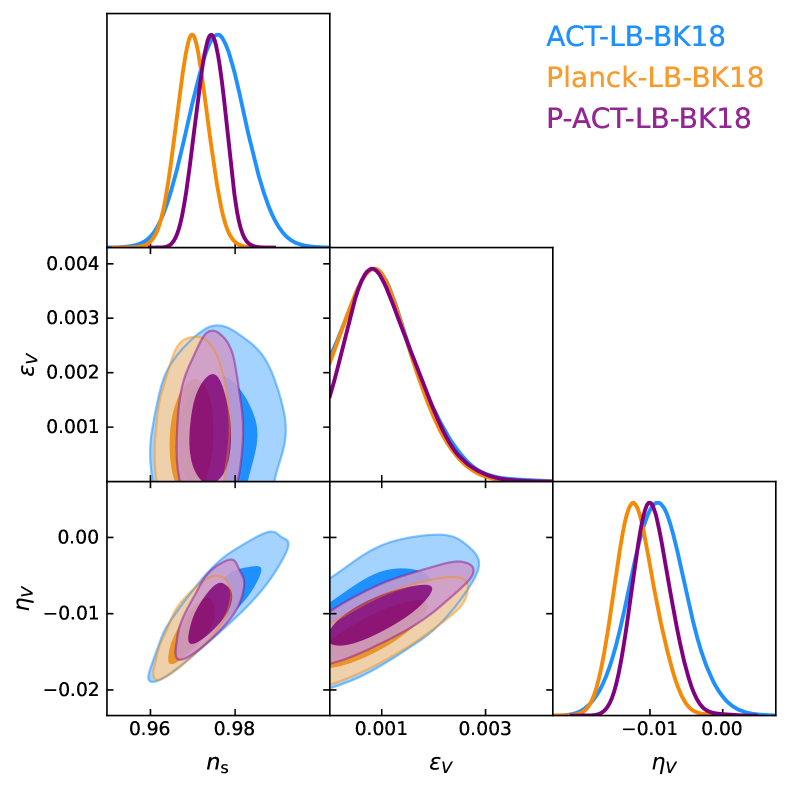
To derive new results in the plane presented in Fig. 10, we vary in the range and we include B-mode measurements from the BICEP and Keck telescopes at the South Pole, which have jointly accumulated more than fifteen years of observations of CMB polarization at degree scales. Their measurements of CMB B-modes are the most precise to date in the field (Ade et al., 2021, BK18) and completely drive the upper limit on , which (combined with from Planck) strongly excludes monomial inflation models with convex potentials. The inclusion of ACT data shows a preference for a slightly higher value of , indicated by the purple contour shifting to the right of the orange contour in Fig. 10, and gives (95%, P-ACT-LB-BK18). As a consequence, P-ACT can accommodate power-law inflation models with slightly higher power-law indices than those preferred by Planck alone (assuming 50–60 e-folds of inflation), i.e., power-law models that are closer to a linear potential and hence possess a second derivative closer to zero. On the contrary, the Starobinsky inflation model (Starobinsky, 1980; Starobinskij, 1992), which predicts lower values of , is more disfavored and lies on the boundary of P-ACT-LB.
The constraints on the slow-roll parameters are shown in Fig. 11, with BK18 determining and ACT adding to the constraint on . The slight preference for a higher value implies a value of closer to zero,
| (9) |
and thus implies a preference for a slightly less concave inflaton potential.
The inclusion of running of the spectral index of scalar perturbations does not significantly change these results.
5 Pre- and modified-recombination physics
5.1 Early dark energy
The early dark energy (EDE) extension to CDM introduces a new field that acts to accelerate the expansion of the universe prior to recombination, reducing the sound horizon at last scattering and thus increasing the CMB-inferred Hubble constant (Poulin et al., 2019; Lin et al., 2019; Agrawal et al., 2023). Here, we consider an axion-like EDE model that has been widely studied in the literature, which is described by the potential (Poulin et al., 2019; Smith et al., 2020)
| (10) |
where is the mass of the field, is the axion decay constant, and is a power-law index. While is excluded on phenomenological grounds — as the EDE would act as an additional contribution to dark matter at late times — values of constitute viable models. Here, we consider as baseline the model, as in previous literature (e.g., Hill et al., 2020; Ivanov et al., 2020b; D’Amico et al., 2021; La Posta et al., 2022; Hill et al., 2022), and discuss the case below and in Appendix E.
Following previous works (Poulin et al., 2019; Smith et al., 2020; Hill et al., 2022), we adopt a phenomenological parametrization that introduces three additional parameters beyond those in CDM: , , and , where
| (11) |
is the maximum fractional contribution of EDE to the cosmic energy budget, which is reached at “critical redshift” , and the initial field displacement . The energy density is given by
| (12) |
and the field evolves by the Klein-Gordon equation (dots here denote derivatives with respect to cosmic time)
| (13) |
Initially the field is frozen due to Hubble friction. Around redshift when , the field begins to roll.
Several previous studies have constrained this model with various datasets (see, e.g., Kamionkowski & Riess, 2023; Poulin et al., 2023b; McDonough et al., 2024 for reviews). Hill et al. (2020) found that Planck alone has no preference for EDE, with (95% CL) and (68% CL); these Planck-derived bounds were further tightened using NPIPE data in McDonough et al. (2024); Efstathiou et al. (2024). However, the ACT DR4 data showed a hint of a preference for the EDE model over CDM at – significance (Hill et al., 2022). The combination of ACT DR4, large-scale Planck TT, Planck CMB lensing, and BOSS BAO data yielded (68% CL) and km/s/Mpc (68% CL) (Hill et al., 2022) (see also Poulin et al., 2021; La Posta et al., 2022; Smith et al., 2022; Smith & Poulin, 2024). However, the statistical weight of Planck was sufficiently large compared to DR4 that this mild preference disappeared when combining ACT DR4 with the full Planck data.
We re-evaluate here the preference for this model with the new ACT DR6 power spectra. Note that, in general, models with a significant EDE fraction leave imprints in the CMB power spectra on modes that are within (or entering) the horizon at redshifts around . While some of these imprints can be absorbed by changes in other cosmological parameters, particularly and (Hill et al., 2020), high-resolution polarization data are expected to break these degeneracies and yield strong sensitivity to EDE, should it be present (Smith et al., 2020; Hill et al., 2022; Smith & Poulin, 2024). For models with , unique features are imprinted in CMB power spectra at , as well as broader imprints extending to smaller angular scales. Indeed, the mild hint of EDE in the ACT DR4 analysis was largely driven by a fluctuation in the EE power spectrum at and a broad trend in the joint ACT and Planck TE power spectrum (Hill et al., 2022). Our analysis of the new ACT DR6 spectra is a high-precision test as to whether these features were the first hints of a real signal, or simply a statistical fluctuation.
We sample the model parameters with uniform priors , , and . We compute theoretical predictions using the EDE model implementation in class, which itself was merged from the modified version class_ede (Hill et al., 2020),111111https://github.com/mwt5345/class_ede as well as using CosmoPower-based emulators of the class EDE predictions (described in Qu et al., 2024a). One important detail to note is that these emulators were trained on theory predictions computed assuming three massive neutrino species, which is different from our baseline convention in this paper of assuming one massive neutrino. This difference leads to very small shifts in the posteriors ( km/s/Mpc), but otherwise leaves the parameter constraints unaffected, as we verify using full class runs. For calculations in the EDE model, we compute theoretical predictions using the implementation in camb, as we find that calculations for this model are more numerically stable in camb than in class (for some extreme scenarios, we find that class does not run successfully). As a test of the theory codes used for the EDE model, we verify that the values computed for a benchmark EDE model with camb and class agree with one another to within 0.06, nearly as good as the agreement for these codes (see Appendix A).
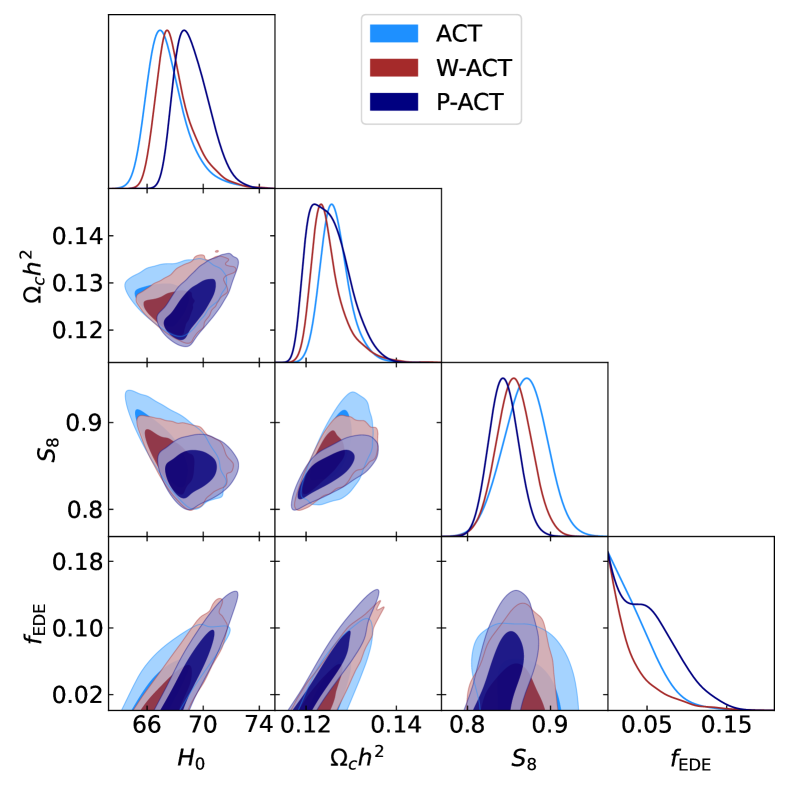
Figures 12 and 13 show the marginalized posterior distributions for key parameters in the EDE model, for different dataset combinations. With the new ACT DR6 spectra, we find
| (14) |
and
| (15) |
with the W-ACT case also shown in the figures to allow a Planck-independent assessment of the EDE constraints. We find that ACT alone shows essentially no shift in within the EDE model, compared to — the hint of non-zero EDE seen in the DR4 data is not seen in DR6 (comparisons between the DR4 and DR6 EDE constraints can be found in Appendix E). When combining with Planck, the posterior shifts upward, but when combining with WMAP, this is significantly lessened: we find . As discussed below, the improvement in quality of fit in all cases is not statistically significant. When we also include CMB lensing and BAO data, we obtain
| (16) |
with W-ACT-LB giving similar results. For comparison, km/s/Mpc in for P-ACT-LB (L25). We also consider substituting BOSS BAO for DESI BAO data, which yields (95%, P-ACT-LB) and km/s/Mpc (68%, P-ACT-LB), slightly decreasing and tightening the bound on compared to P-ACT-LB.121212This is consistent with the results of Qu et al. (2024a), who found that the shift in the best-fit between BOSS and DESI BAO data led to a weaker upper limit on EDE from DESI in combination with data from Planck and other probes. We further verify that these results are essentially unchanged with the inclusion of SNIa data in the analysis.
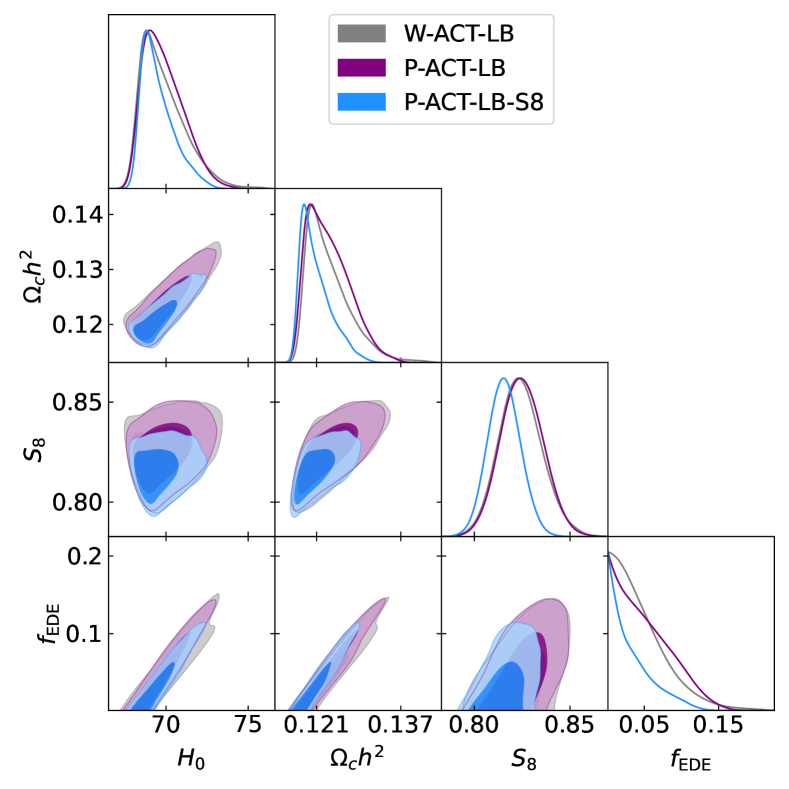
We also obtain constraints for P-ACT-LB-S8,131313Note that we obtain for P-ACT-LB; this constraint agrees with that from Dark Energy Survey and Kilo-Degree Survey Collaboration (2023) at . which includes an external prior on from the joint analysis of DES-Y3 and KiDS-1000 cosmic shear data (Dark Energy Survey and Kilo-Degree Survey Collaboration, 2023), as described in §2.5. Hill et al. (2020), who also placed constraints on EDE, validated that a simple Gaussian prior on is a sufficiently accurate approximation to the inclusion of a full weak lensing likelihood in such joint analyses with CMB data (see their Appendix B). The inclusion of significantly tightens the upper limit on EDE (see Fig. 13), as positive values increase this parameter above its value (the late-time matter power spectrum amplitude is increased due to increases in and in the CMB fit), which is in the opposite direction to the preference in the DES and KiDS data (Hill et al., 2020).
| Pref. in | |||||
|---|---|---|---|---|---|
| ACT | 0.0 | 66.5 | 0.012 | 3.00 | |
| W-ACT | 1.9 | 0.5 | 69.9 | 0.089 | 3.55 |
| P-ACT | 70.4 | 0.091 | 3.56 | ||
| W-ACT-LB | 70.2 | 0.070 | 3.52 | ||
| P-ACT-LB | 71.2 | 0.093 | 3.56 |
Switching now to the EDE model, for ACT alone, we obtain (95%, ACT) with km/s/Mpc. Adding Planck yields (95%, P-ACT) with km/s/Mpc. Finally, adding CMB lensing and BAO data yields (95%, P-ACT-LB) with km/s/Mpc. These results are similar to the case. A full comparison between the two models is discussed in Appendix E.
Some past studies (e.g., Herold et al., 2022; Herold & Ferreira, 2023; Poulin et al., 2023b; Efstathiou et al., 2024) have discussed “projection effects,” where, in the CDM limit (), the additional EDE-specific parameters ( and ) have no impact. These can bias the Bayesian posterior for . Additionally, the exact choice of the prior range can have a significant effect on the final constraints in this model, as large values of are allowed if is sufficiently high that no dynamical effects are imprinted on the CMB (i.e., the EDE is irrelevant by the recombination epoch, La Posta et al., 2022). Finally, the lower bound of only allows the model fit to increase or leave it unchanged, not decrease it. Therefore, to evaluate whether the data have a meaningful preference for the EDE model, it is useful to compare the effective value of the MAP EDE model to that of the CDM model, rather than to solely inspect the Bayesian posteriors, as was done in Hill et al. (2022). To maximize the posterior, we use both Cobaya and PROSPECT, a profile likelihood code that can also be used for accurate global optimization (Brinch Holm et al., 2024).141414For the posterior maximization procedure, we use the full Boltzmann code class rather than the emulators, to obtain high numerical precision. We then take the global MAP from the different minimizer runs.
Performing this exercise, we find no preference for the EDE model from the DR6 data alone or combined with other datasets, as shown in Table 2 for the EDE model. For ACT alone, we do not find an MAP point for the EDE model with lower than that found for , i.e., the additional parameters of the EDE model provide no meaningful improvement in goodness-of-fit to the ACT data within our numerical precision. The MAP model is nearly indistinguishable from , with (very close to the edge of the parameter space) and , the lower edge of our prior, where the impact of EDE on the CMB is minimal. In the other cases, we note that in the EDE model there is a narrow degeneracy direction in the parameter space, where parameters may shift while having very similar effective values. Nevertheless, in none of the cases do we find the improvement in goodness-of-fit over significant.
Using the values, we compute the equivalent preference in using the likelihood-ratio test as in Hill et al. (2022).151515Because the CDM model is a subset of the EDE model (with ), the between the best-fit EDE and best-fit CDM models follows a chi-squared distribution with three degrees of freedom, corresponding to the three additional free parameters of the EDE model. We find that in all cases the preference for EDE over is . The values for the case, shown in Appendix E, yield the same conclusion.
To further circumvent the problem of projection effects, some past works have used a profile likelihood approach (see, e.g., Lewis & Bridle, 2002; Audren et al., 2013 for more detail). However, the values that we find between the EDE and CDM MAP models are insignificant; as such, we see no evidence of preference for the EDE model in either a Bayesian or frequentist framework. Thus, we conclude that the significant computational expense of a full profile likelihood analysis is not justified, and is unlikely to affect the interpretation of these results.
5.2 Varying fundamental constants
The dynamics of recombination depends critically on the values of fundamental constants during the decoupling epoch, including the fine-structure constant and the electron mass . High-precision CMB observations thus allow for constraints on possible variations of these constants over vast scales in both distance and time (see, e.g., Sekiguchi & Takahashi, 2021; Hart & Chluba, 2020, 2018; Planck Collaboration, 2015; Menegoni et al., 2012; Scóccola et al., 2009; Martins et al., 2004; Rocha et al., 2004; Battye et al., 2001; Avelino et al., 2001, 2000; Kaplinghat et al., 1999; Hannestad, 1999). Furthermore, models featuring fundamental constant variations are amongst the few that have had some phenomenological success in increasing the CMB-inferred Hubble constant (Knox & Millea, 2020; Sekiguchi & Takahashi, 2021; Schöneberg et al., 2022). However, we emphasize that these models are not physical, in the sense that the fundamental constant variation is not driven dynamically by a new field or interaction; we simply assume that or can take a different value in the early universe than it does today, which opens degeneracies in the CMB. Recently, Baryakhtar et al. (2024) have found that a first-principles implementation of varying-constant models can yield rather different conclusions than crude phenomenological models, due to (for example) the impact of perturbations in the field driving the constant-variation, as well as its contribution to the cosmic energy budget. However, for simplicity, here we stick to a phenomenological approach in which or are simply allowed to vary, thus testing their values at the CMB epoch as compared to today.
We use the new ACT DR6 power spectra to place updated bounds on possible variation of and (considered individually). For simplicity, we assume that the value of (or ) undergoes an instantaneous, step-function transition well after recombination is completed, but well before the reionization epoch (specifically, we choose for the redshift of this transition). The value of the constant after the transition is fixed to the laboratory-measured value (Particle Data Group, 2024), while the value before the transition is taken to be a free parameter. The relevant physical effects on the recombination dynamics are treated via the implementation in HyRec (Ali-Ha¨ımoud & Hirata, 2011), as incorporated in class (note that CosmoRec (Chluba et al., 2010) includes a similarly accurate treatment of these effects). The dominant physical effects are due to changes in the Thomson scattering cross-section, with , and changes in the energy levels of atomic hydrogen, with . Many additional, subtle effects arise due to the non-equilibrium nature of cosmological recombination — see, e.g., Hart & Chluba (2018); Chluba & Ali-Ha¨ımoud (2016); Planck Collaboration (2015) for a thorough discussion. In general, variations of or change the timing of recombination, with higher values of these constants associated with earlier recombination. Thus, such variations change the physical scales imprinted in the CMB power spectrum, including the damping scale. The new ACT DR6 spectra allow tests of these effects in a qualitatively new regime, deep into the damping tail in TT and across a wide range of scales in TE and EE.
As pointed out in Sekiguchi & Takahashi (2021), a joint variation of and the spatial curvature opens up a particularly significant degeneracy with and other cosmological parameters. In principle, such a model has sufficient freedom to accommodate an increased value of while providing a good fit to not only CMB data, but also late-time measurements of the distance-redshift relation from BAO and SNIa data. Here, we revisit this scenario. In addition, we also consider a model in which both and are allowed to vary.
5.2.1 Electron mass
We parametrize a possible deviation of the electron mass from its present-day value by introducing a free parameter , where () is the mass at (, including today). We adopt a flat, uninformative prior: . Combining ACT and Planck, we find
| (17) |
whereas Planck alone yields . While the P-ACT result lies below unity, we find that this is driven mostly by the Planck data: ACT alone yields , while combining ACT with WMAP yields
| (18) |
Interpreting the P-ACT result as a statistical fluctuation, we further include CMB lensing and DESI BAO data to obtain
| (19) |
Further adding SNIa data slightly tightens the constraints while moving them closer to , giving and (68%, P-ACT-LBS).
These bounds represent the tightest constraints to date on the value of the electron mass at the recombination epoch, now approaching the half-percent level. Here, the BAO data are crucial in breaking severe geometric degeneracies that arise in the primary CMB when the electron mass is allowed to vary (see, e.g., Hart & Chluba, 2018 and Sekiguchi & Takahashi, 2021 for detailed discussion). These severe degeneracies also allow much more freedom in the Hubble constant, which increases compared to the value found in when fitting these datasets. Nevertheless, we emphasize again that this model is not physical: no dynamical field has been introduced that drives the evolution of .
5.2.2 Electron mass and spatial curvature
Sekiguchi & Takahashi (2021) noted that variation of the electron mass has the unique property of allowing multiple scales in the CMB to be preserved (in combination with other parameters changing), including the acoustic scale and the damping scale. However, this variation will change the late-time expansion history, which is why the inclusion of BAO data plays a key role in the constraints above. This observation motivates further extending the model to allow freedom to adjust the late-time distance-redshift relation. Sekiguchi & Takahashi (2021) considered scenarios in which either the spatial curvature or the dark energy equation of state were allowed to vary in addition to . They found spatial curvature to yield surprising success in accommodating significant variation of (and hence ) in fits to Planck CMB and BOSS BAO data, a result that was further validated in Schöneberg et al. (2022).
Here, we revisit this model with the new ACT DR6 spectra. We adopt a uniform prior and the same prior on used above. We compute theoretical predictions using class.
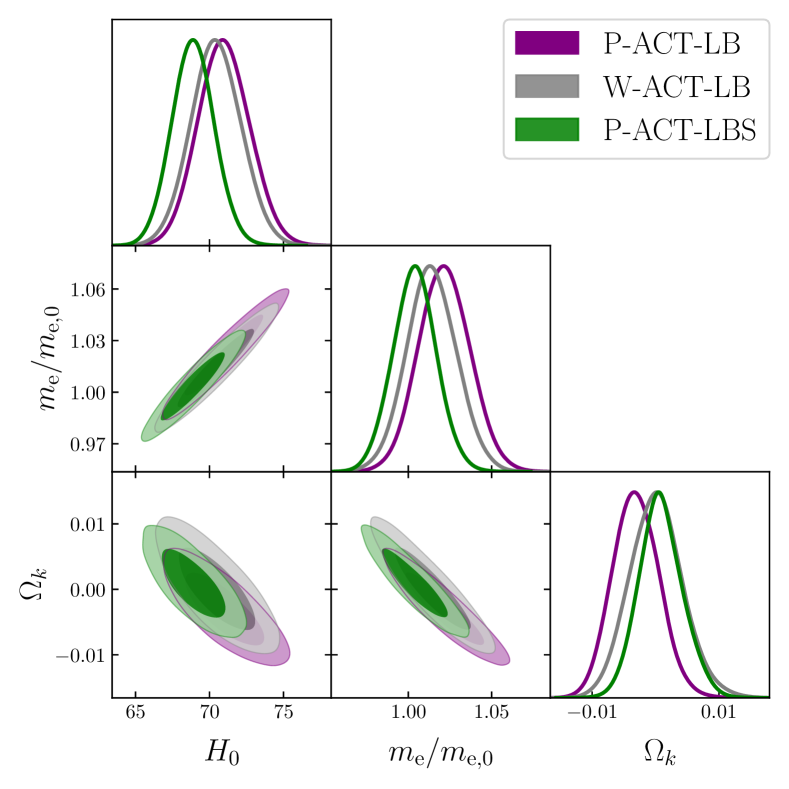
We find that this two-parameter extension of is highly unconstrained in fits to CMB data alone. We thus focus solely on joint analyses of CMB and late-time data here, with results shown in Fig. 14. Our baseline dataset combination yields
| (20) |
While neither non-standard or non-flat are detected on their own in this fit, their combined impact allows to take on higher values, consistent with earlier results from Sekiguchi & Takahashi (2021); Schöneberg et al. (2022). To assess the additional constraining power contributed by ACT, note that the error bar on in our P-ACT-LB analysis is roughly smaller than that found for the same model using Planck and BOSS BAO data (, Schöneberg et al., 2022). We verify that these results are not driven by the high CMB lensing amplitude in Planck by replacing Planck with WMAP in the dataset combination, finding
| (21) |
The parameter posteriors in these fits are significantly broadened compared to those obtained in (cf. for P-ACT-LB in L25) or +. For comparison, we find for P-ACT-LB in §7.1; this bound is weakened by more than a factor of two in the model studied here. Although the central values of some parameters shift compared to , the significance of the shifts is counteracted by the increased error bars, and we find that this model does not yield a significant improvement in goodness-of-fit over . For the MAP model obtained for P-ACT-LB (W-ACT-LB), we find () with respect to , with two additional free parameters. These values correspond to a or preference over , respectively, neither of which is significant.
It is also worth noting that the DESI BAO data play an important role in the central value of the posterior here (and in other models studied in this work). Due to the computational expense of running MCMC chains for this model (which is extremely slow to evaluate in class), we use importance-sampling with an approximate version of the BOSS BAO likelihoods to assess how the results would shift if DESI were replaced with BOSS. We find that the central value of the posterior shifts downward by 1–1.5 km/s/Mpc, while the electron mass and spatial curvature shift closer to their values. The error bars on all quantities increase only slightly. Thus, we conclude that the central values of the above parameter constraints are partially driven by the DESI BAO data.
Furthermore, we find that a joint analysis with Pantheon+ SNIa data pulls all parameters toward their values, while tightening the error bars compared to the P-ACT-LB results:
| (22) |
Notably, the value in this fit is fully consistent with its value. From the joint analysis of P-ACT-LBS and the insignificant improvement in quality of fit to P-ACT-LB, we conclude that there is no evidence for a scenario with spatial curvature and a non-standard electron mass at recombination. The possibility of obtaining a high value of from cosmological data in this model is significantly reduced by these new results.
5.2.3 Fine-structure constant
As done above for the electron mass, we parametrize possible deviation of the fine-structure constant from its present-day value by introducing a free parameter , where () is the value at (, including today). We adopt a flat, uninformative prior: . Combining ACT and Planck, we find
| (23) |
representing a 30% reduction in the error bar compared to that from Planck alone, which yields (consistent with Hart & Chluba, 2020). ACT alone yields .
Further including CMB lensing and DESI BAO data yields
| (24) |
thus fluctuating above unity. Inclusion of SNIa data has negligible effect on this result. As higher corresponds to earlier recombination, this result also yields a moderate increase in the Hubble constant, with km/s/Mpc. Interpreting this result as a statistical fluctuation, these bounds represent the tightest constraints to date on the value of the fine-structure constant at the recombination epoch, approaching the per-mille level.
5.2.4 Fine-structure constant and spatial curvature
Unlike the electron mass, variation of the fine-structure constant (in combination with other parameters) can not simultaneously preserve all of the relevant physical scales in the CMB power spectrum; this is largely why the constraints on above are tighter than those on . This is also why the Hubble constant cannot increase as significantly when varying as when varying (Sekiguchi & Takahashi, 2021). For completeness, and to better understand the results found above for the + model, here we consider extending the varying- model to also allow the spatial curvature to vary. This allows further freedom in the late-time expansion history, allowing wider range of parameter variations to be accommodated in fits to CMB and BAO data.
As above, we compute theoretical predictions for this model using class. We adopt an uninformative prior , while allowing to vary as in our previous analysis.
As expected, we find that this two-parameter extension is far less degenerate than the + model studied above. Focusing for simplicity solely on the P-ACT-LB dataset combination, we find
| (25) |
Comparing to the results above, it is evident that the constraint on is essentially unchanged by the opening of the spatial curvature, which itself is also tightly constrained near zero. Likewise, hardly changes, with the analogous result for fixed spatial curvature yielding km/s/Mpc.
Contrasting the varying- results with the varying-electron-mass case, we find that the degeneracy structure of the two models is remarkably different, with the electron mass possessing much more flexibility in accommodating a wide range of parameter space than the fine-structure constant, consistent with Hart & Chluba (2018, 2020); Sekiguchi & Takahashi (2021).161616A similar result is found for the small-scale baryon clumping scenario studied in §5.3 — allowing to vary also has little degeneracy with the clumping parameter constraint. Nevertheless, we note again that all of the varying-constant models studied here are not physical, but rather simply crude phenomenological approximations. These results may be a useful guide in constructing physical models that can achieve similar flexibility in accommodating a wide range of data.
5.3 Primordial magnetic fields
The existence of primordial magnetic fields (PMFs) is a compelling possibility. Such PMFs could cause inhomogeneities in the baryon distribution around recombination. Thus, the PMF model is an example of a slightly more generic scenario known as “baryon clumping” (Jedamzik & Abel, 2013; Jedamzik & Saveliev, 2019). Primordial magnetic fields with a blue-tilted power spectrum can naturally have kpc-scale correlation lengths. Once the photon gas dynamically decouples from the baryon fluid on small scales, the magnetic force causes efficient growth of baryon density perturbations to potentially contrasts. These kpc-scale perturbations are not directly resolvable in CMB observations, but they cause accelerated recombination due to the quadratic source term in the equation describing the recombination rate (Peebles, 1968). The corresponding decrease in the sound horizon could then partially reconcile CMB-based determinations of the Hubble constant with local universe measurements (Jedamzik & Pogosian, 2020). As magnetic fields are part of the standard model and their generation during early-universe phase transitions is conceivable, PMFs (or baryon clumping models in general) are a well-motivated scenario to potentially increase the CMB-inferred Hubble constant.171717Note that effects due to Faraday rotation (e.g., Cai & Guan, 2022) are not considered here and are expected to yield weaker constraints on such models (Pogosian et al., 2019).
Baryon clumping induces changes in the Silk damping tail in addition to the leading-order geometric effect described above. Two counteracting effects are at play (Jedamzik & Abel, 2013): shortened photon diffusion due to accelerated hydrogen recombination suppresses Silk damping, but the previously accelerated helium recombination decreases the ionization fraction and thus increases the damping. These two effects do not generally cancel, and empirically the first one appears to be dominant (e.g., Thiele et al., 2021). Thus, the high-resolution ACT DR6 data with good signal-to-noise in the damping tail enable stringent constraints on baryon clumping scenarios.
Theoretical modeling of PMF-induced baryon clumping is non-trivial. We adopt a simplified model used in earlier works (Jedamzik & Pogosian, 2020; Thiele et al., 2021; Rashkovetskyi et al., 2021; Galli et al., 2022; Jedamzik & Pogosian, 2023). The baryon density distribution function is sampled by three zones in each of which the baryon density is taken as a constant. Taking the zones as indexed by , each zone carries a volume fraction and a baryon density . Volume and mass conservation imply the constraints . For each zone, the recombination history is computed separately and the thermal history is then taken as the volume-weighted average over the three zones. This treatment neglects Ly photon mixing (Jedamzik et al., 2025).
Within the three-zone model, we choose to work with the “M1” scenario of Jedamzik & Pogosian (2020): , , . After applying the constraints described above, the model thus has only a single free parameter, the variance of the small-scale baryon density fluctuations
| (26) |
Recent perturbative and simulation-based works have suggested refinements of this simplified treatment (Lee & Ali-Ha¨ımoud, 2021; Jedamzik et al., 2025). Jedamzik et al. (2025) recently presented constraints on primordial magnetic fields using a simulation-informed model for the recombination history. Where comparisons can be made between this method and our three-zone model, there is a remarkably close agreement between the two approaches. In particular, the posteriors for in Jedamzik et al. (2025) are similar to results found for the three zone-model.
In the absence of a more accurate publicly available model and in order to facilitate comparison with previous constraints, we choose to continue working with the three-zone model. However, we stress that our constraints are to be interpreted in the context of this model and further work will be needed to evaluate the viability of baryon clumping scenarios more generally. Nevertheless, previous work has indicated that increasing the flexibility of the model does not substantially alter the constraint on or (Thiele et al., 2021).
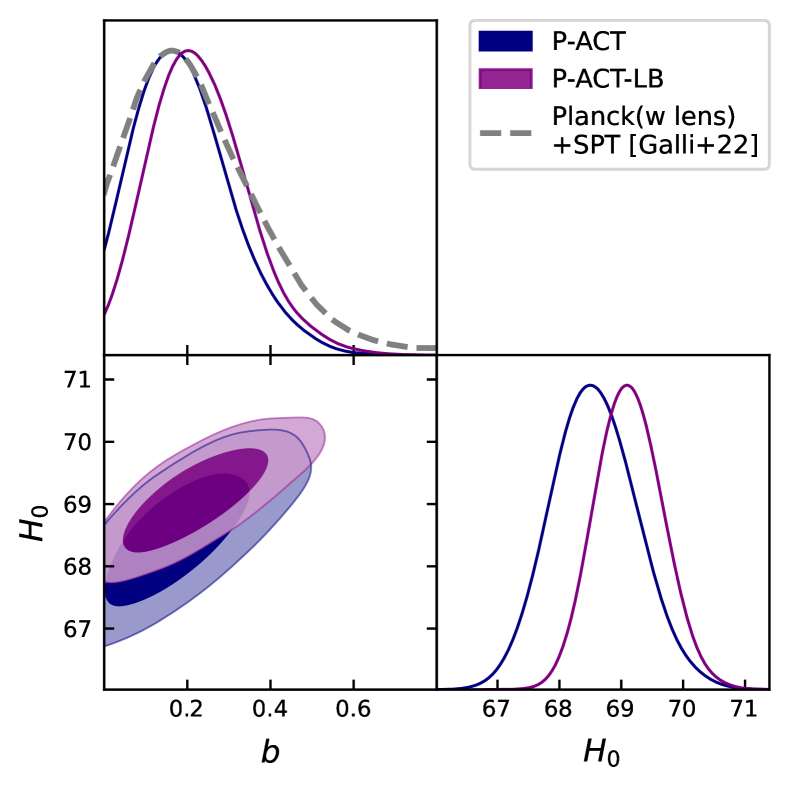
Figure 15 shows our constraints on the clumping parameter and the Hubble constant, from primary CMB data alone and in combination with CMB lensing and BAO data. We find that the constraint on is tightened compared to previous analyses:
| (27) |
For comparison, the Planck primary CMB alone constrains , and the combination of Planck (including CMB lensing) plus SPT-3G gives results consistent with our P-ACT measurement (Galli et al., 2022). If we combine all three datasets (ACT, Planck, and the public SPT-3G data), there is only a marginal improvement on P-ACT.
Note that the posteriors including ACT data peak at non-zero ; thus the improvement in constraining power is larger than what is suggested by comparing the upper limits. As quantified by the standard deviation in , adding ACT improves upon the Planck-only constraint by about . We find no detection of baryon clumping and hence further restrict this model’s ability to increase the CMB-inferred value: we find km/s/Mpc and km/s/Mpc for P-ACT and P-ACT-LB in this model, respectively.
In contrast to the seemingly similar model with varying electron mass, we find that the inclusion of spatial curvature as a free parameter does not appreciably change the posterior in the P-ACT-LB data combination (see §5.2.2 for contrasting results in the varying-electron-mass case). The non-trivial small-scale effects in the baryon clumping model constrain beyond the information contained in the geometric sound-horizon modification.
5.4 Temperature of the CMB
Several studies (e.g., Ivanov et al., 2020a; Wen et al., 2021; Hill & Bolliet, 2023) have explored the possibility of increasing the CMB-anisotropy-inferred value of the Hubble constant by changing the CMB monopole temperature, . In particular, Ivanov et al. (2020a) highlighted a strong negative degeneracy in the - plane when the monopole temperature is left free in analyses of Planck data. Setting a SH0ES prior on would then yield a temperature measurement lower than the combined measurement of K (Fixsen, 2009) from COBE/FIRAS and other data.181818Note that the error bar on from Fixsen (2009) is sufficiently small that this value is taken as a fixed constant in analyses of (and the extended models studied in this paper).
Obtaining a higher value of via a decrease in the monopole CMB temperature is difficult. Models with some level of post-recombination reheating can have an impact by allowing a lower value of the monopole temperature in the early universe (e.g., Hill & Bolliet, 2023 propose to convert a fraction of DM into photons during the dark ages). However, although such a process is straightforward to implement in a phenomenological way, it is hard to find a well-grounded physical mechanism to motivate it such that the blackbody spectrum is preserved (see, e.g., Chluba, 2014).
Nevertheless, these studies have led to the realization that current CMB anisotropy data in combination with BAO data provide, on their own, a powerful probe of the amount of radiation in the universe.191919Note that it is important to self-consistently vary the calibration of the CMB anisotropy data in such analyses, as explained in Ivanov et al. (2020a). A single-parameter extension to the CDM model, where is left free, is well constrained. Ivanov et al. (2020a) combine Planck 2018 CMB anisotropy and lensing data with BOSS DR12 BAO data (eBOSS Collaboration, 2018) and find K (68% CL). Updating this Planck result including BAO from DESI, we find a slightly tighter constraint, . With the addition of the new ACT DR6 spectra, we find a similar constraint
| (28) |
This measurement of is consistent with the direct COBE/FIRAS monopole measurement. The corresponding constraint on is consistent with the result in , as shown in Fig. 16.
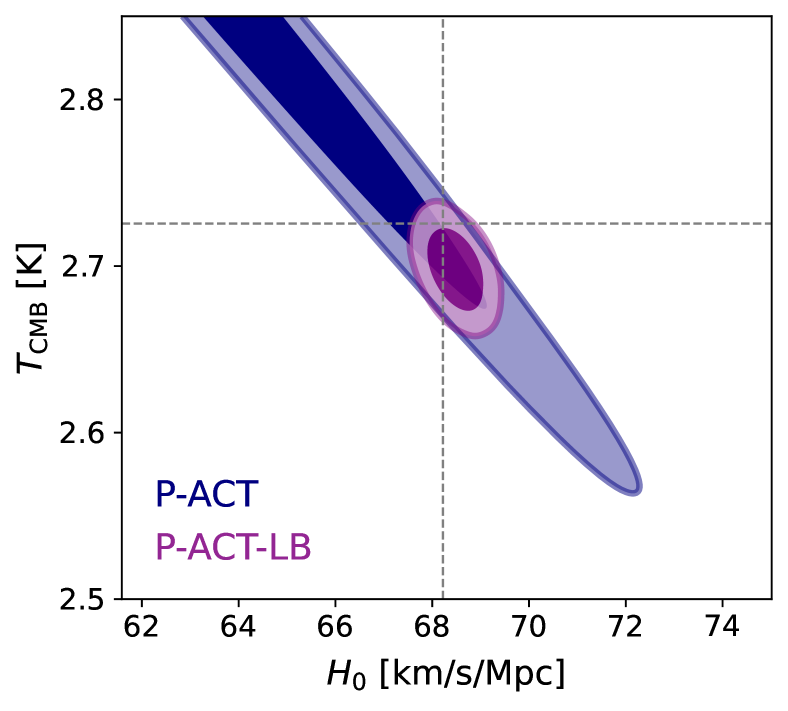
5.5 Modified recombination history
In this subsection, we present a non-parametric reconstruction of the cosmological recombination history, including ACT DR6 data. Modifications to the standard recombination history have been extensively studied, both as a powerful test of the standard cosmological model and as a potential avenue to increase the value of the Hubble constant inferred from CMB observations (e.g., Lee et al., 2023; Lynch et al., 2024b, a; Pogosian et al., 2024; Mirpoorian et al., 2024). To investigate such modifications, we use the ModRec model developed in Lynch et al. (2024b), which parametrizes departures in the ionization fraction, , from the standard recombination history, where and are the number densities of free electrons and hydrogen nuclei, respectively. While phenomenological, the flexible parametrization employed by ModRec effectively captures a broad range of physical scenarios, including the effects of primordial magnetic fields, time-varying electron mass, and dark matter annihilation (Lynch et al., 2024b), all of which are also studied separately elsewhere in this paper.
Following Lynch et al. (2024b), we parameterize departures from the standard ionization fraction at seven control points spanning to , leaving reionization and helium recombination unchanged. These control points are interpolated using a cubic spline that enforces physical bounds, , where is the maximum allowed ionization fraction. We compute all theoretical predictions using the class implementation of ModRec, with precision parameters and settings described in Appendix A. Our control points and their priors are identical to those used in Lynch et al. (2024a, b).
We present constraints on the ModRec model using the Planck-LB and P-ACT-LB datasets — we do not show or discuss discuss P-ACT alone as BAO data are essential for breaking degeneracies between the modified recombination parameters and standard cosmological parameters (Lynch et al., 2024b). We show results for both DESI and BOSS BAO datasets, as the choice of BAO data impacts the reconstructed due to differences in the inferred values of and between BOSS and DESI measurements, assuming CDM (Lynch et al., 2024a; Pogosian et al., 2024).
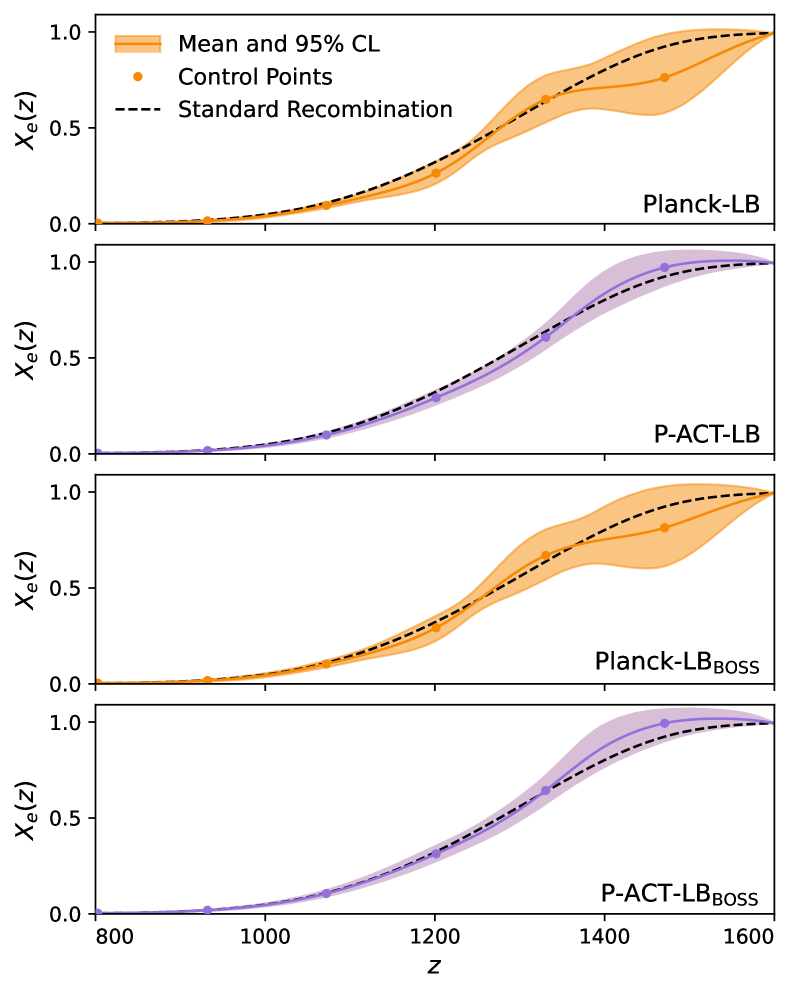
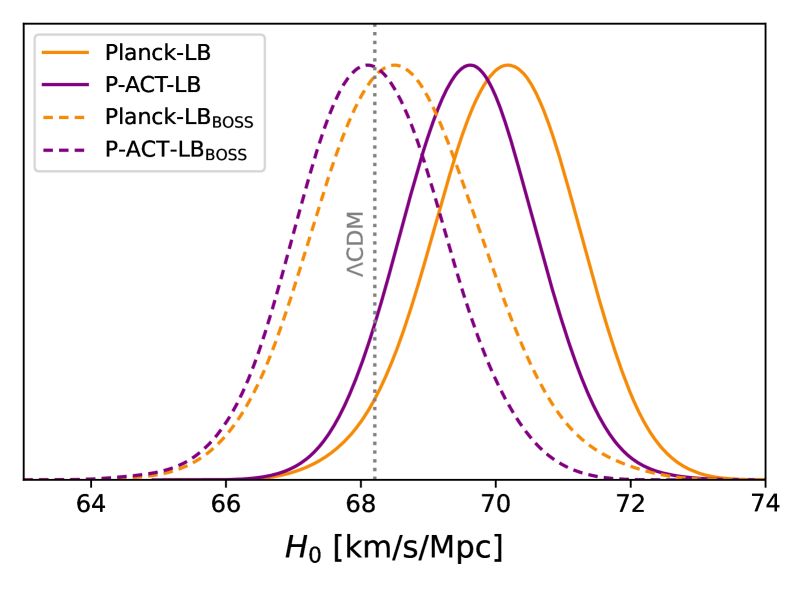
Figure 17 shows the mean and 95% two-tailed CL constraints on the reconstructed ionization fraction as a function of redshift. Including ACT DR6 data significantly improves the constraints on , with a factor of two reduction in the uncertainty of the highest redshift () control point.202020The modified recombination history cosmology in Fig. 3 is obtained by selecting a sample from the Planck-LB chain that has at least a 20% difference in the highest-redshift ionization fraction relative to the standard recombination history and a compared to the chain’s best-fit cosmology. This improvement arises because modifications to the ionization fraction impact the polarization and damping tail of the CMB (Hadzhiyska & Spergel, 2019; Lynch et al., 2024b). The reconstructed recombination histories are consistent with the standard recombination scenario (black dashed lines).212121The standard recombination history is computed using the best-fit CDM parameters from the P-ACT-LB dataset. Using the best-fit parameters from other datasets considered in this work has negligible impact on the predicted .
Notably, the mean ionization fraction from the P-ACT-LB reconstruction is nearly indistinguishable from the standard recombination scenario across all redshifts analyzed, with all sampled control points agreeing with the standard recombination history within , except for the highest redshift control point (), where the ACT data favor a slightly higher () ionization fraction than the standard model. This is driven by ACT’s mild preference for less damping compared to Planck, as a larger value of at high redshifts leads to a decrease in damping (Lynch et al., 2024b). This mild preference for a higher at high redshifts is in the opposite direction of what is generally required by modified recombination models that aim to increase the value of inferred from the primary CMB. Finally, with respect to the MAP CDM model, we find () for the P-ACT-LB (P-ACT-LB) datasets, for a model with seven additional free parameters. These values correspond to a preference of and over CDM, respectively, and hence are not statistically significant. We present the full set of constraints on the control points in Appendix F.
In Fig. 18 we present the marginalized constraints on from the ModRec analysis. Including ACT data shifts closer to its CDM value for both BAO datasets, consistent with our findings that ACT data support the standard recombination history. We find
| (29) | |||||
For comparison, () km/s/Mpc for the Planck-LB () dataset combinations. Additionally, we find that the choice of BAO data can lead to a shift of km/s/Mpc in the posterior mean of . These findings are consistent with previous studies of the ModRec model (Lynch et al., 2024a, b) and are representative of a more general trend where the value inferred from models that modify the (pre)-recombination era physics depends sensitively on the BAO data.
Finally, given that Lynch et al. (2024b) found that ModRec constraints on including DESI BAO data prefer a lower value than recent constraints from supernova surveys, we comment on the constraints for the ModRec model. For P-ACT-LB (Planck-LB), we find (). Therefore, including ACT data has a negligible impact on the inferred value of for the ModRec model.
6 Particle astrophysics
6.1 Neutrinos
The CMB is sensitive to a cosmological background of neutrinos produced in the early universe that contribute a significant fraction () of the radiation density. In the Standard Model (SM) of particle physics, these neutrinos are expected to be three flavors of massless active particles that interact weakly with other SM particles but, as explained below, they are known to have non-zero masses.
6.1.1 Number and mass
The exact number of neutrinos and their total mass are two key parameters of the cosmological model, and can point to beyond-Standard-Model (BSM) physics.
Neutrino number
The effective number of relativistic species quantifies the contribution to the radiation density of neutrinos, or other light particles, during their relativistic phase (including during the BBN epoch and the CMB decoupling epoch), , where and are respectively the neutrino and photon energy densities. Three neutrino species undergoing a non-instantaneous decoupling from the primordial plasma correspond to (Bennett et al., 2021; Froustey et al., 2020; Akita & Yamaguchi, 2020; Drewes et al., 2024), accounting for energy-dependent interactions in the early universe. Numbers greater than this value might indicate the existence of additional light particles or extra free-streaming (dark) radiation — as postulated by many BSM theories (e.g., Weinberg, 1978; Essig et al., 2013; Brust et al., 2013; Abazajian et al., 2012; Weinberg, 2013; Kawasaki et al., 2015; Baumann et al., 2016b). Values of smaller than are also possible in scenarios where radiation is affected not by the existence of extra particles but by non-standard properties of neutrinos or changes to the standard thermal history. In low-reheating temperature scenarios, for example, the late-time entropy production associated with the decay of a massive particle might delay the beginning of the radiation-dominated era down to a temperature of a few MeV, thus preventing the full thermalization of neutrinos (see, e.g., Kawasaki et al., 1999, 2000; Giudice et al., 2001; Tegmark & Zaldarriaga, 2002; Ichikawa et al., 2005, 2007; De Bernardis et al., 2008; de Salas et al., 2015; Hasegawa et al., 2019; Barbieri et al., 2025). Entropy production occurring after neutrino decoupling might also reduce below its standard value by increasing the photon temperature relative to neutrinos (see, e.g., Steigman, 2013, and also Cadamuro & Redondo, 2012, for a scenario involving the decay of an axion-like particle). A reduction of the effective number of neutrino species might also be the signature of sterile neutrinos with strong self-interactions (Mirizzi et al., 2015).
The CMB is able to constrain because its value affects the expansion rate of the universe, especially during the radiation-dominated phase, thereby altering the expansion history just before recombination and the predicted abundances of primordial light elements (Bashinsky & Seljak, 2004; Hou et al., 2013; Abazajian et al., 2015; Pan et al., 2016; Baumann et al., 2016a). At the perturbative level, alters the damping tail (high- region) of the TT/TE/EE spectra, both because the change to the expansion history alters the timescale for diffusion damping and because the free-streaming nature of the radiation damps the growth of perturbations, with the latter also inducing a characteristic phase shift in the acoustic peaks (Bashinsky & Seljak, 2004). Combining the Planck legacy CMB with Planck CMB lensing and BOSS BAO, the neutrino number is measured to be at 68% CL (Planck Collaboration, 2020c), or at 68% CL when we evaluate this estimate using Planck-LB.
With the new ACT DR6 spectra we find at 68% CL, combining into
| (30) | |||||
and giving
| (31) |
This measurement is consistent with SM predictions for three relativistic neutrinos and disfavors the existence of another thermalized particle (irrespective of its spin or decoupling time) at 94% confidence, as calculated from the likelihood of having a minimal additional contribution of 0.027 from a scalar boson (see below) beyond the expected value of 3.044, as shown in Fig. 19. Higher-spin particles are disfavored at higher significance. A strong contribution to this new limit comes from the peak of the ACT distribution shifting to lower values compared to the Planck measurement because, as shown in Fig. 3, the new ACT data prefer somewhat less damping than the Planck best-fit model.
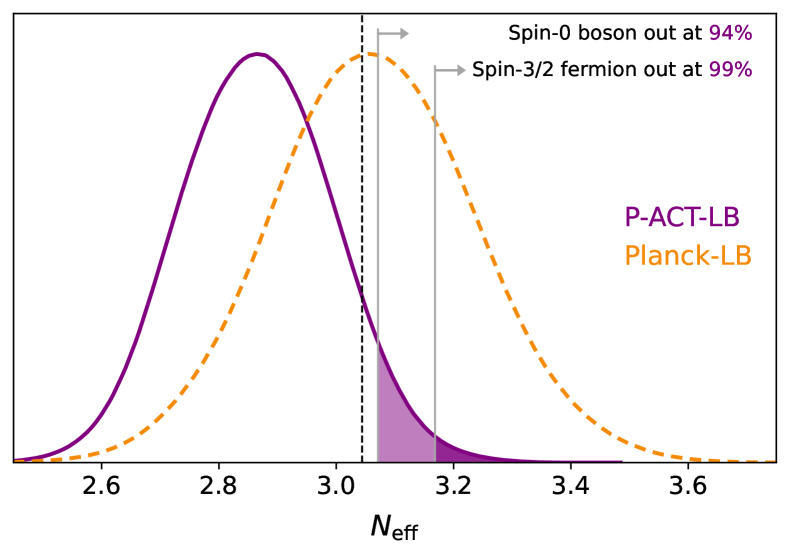
While our constraints are consistent with the SM expectation — and the shift is not statistically significant enough to draw strong conclusions — it is interesting to consider physical models that could yield values of . Recalling that depends on the neutrino-to-photon energy density ratio, a simple possibility to decrease is an injection of energy into the photon-baryon plasma after neutrino decoupling, but before last scattering (note that this would thus lead to different values for at the BBN and CMB epochs). Taking the central value of our P-ACT (P-ACT-LB) posterior, the photon energy density would need to be increased by 12% (6%) between neutrino decoupling and last scattering. If this energy injection takes place between redshifts , a distortion will be produced in the CMB monopole energy spectrum; if it takes place at lower redshifts , a -type distortion will be produced. Using standard formulae for the distortion amplitudes (e.g., Chluba & Sunyaev, 2012), the P-ACT (P-ACT-LB) energy-injection values would yield or ( or ). Such large spectral distortions are strongly excluded already by the COBE/FIRAS data (Fixsen et al., 1996; Bianchini & Fabbian, 2022).222222The COBE/FIRAS spectral distortion bounds are sufficiently tight that only very small increases in the photon energy density are allowed during the and epochs, corresponding roughly to (for both the and limits). Nevertheless, a low value could still be obtained via energy injection into the photon bath at , by cooling the neutrinos via a BSM interaction, or by other, more exotic mechanisms as discussed above.
If we instead start by assuming the existence of the three SM neutrinos and add new, specific light relic particles with mass eV — i.e., only looking at regions of parameter space with — then we can set limits on the new species’ nature by exploiting the fact that the excess in that they generate depends on the spin of the particle and on the temperature at which they decoupled from the thermal bath in the early universe, as shown in Fig. 20 (with predictions from Borsanyi et al., 2016 for different species as adopted in previous CMB literature, including Planck Collaboration, 2016a, 2020c; CMB-S4 Collaboration, 2016; Simons Observatory Collaboration, 2019). We do this by fitting for the positive that such new species would contribute to . We find at 95% CL from ACT, which becomes
| (32) | |||||
where lensing and BAO data relax the bound by moving the overall posterior to higher values as seen previously. The same limit using Planck-LB is at 95% confidence. Our P-ACT-LB combination excludes at 95% CL any light particle of spin 0 or 1/2 that decoupled after the start of the QCD phase transition at temperatures MeV and all light particles with spin 3/2 that decoupled at temperatures GeV. These are the strongest constraints to date on the possible existence of light, weakly coupled particles in the early universe.
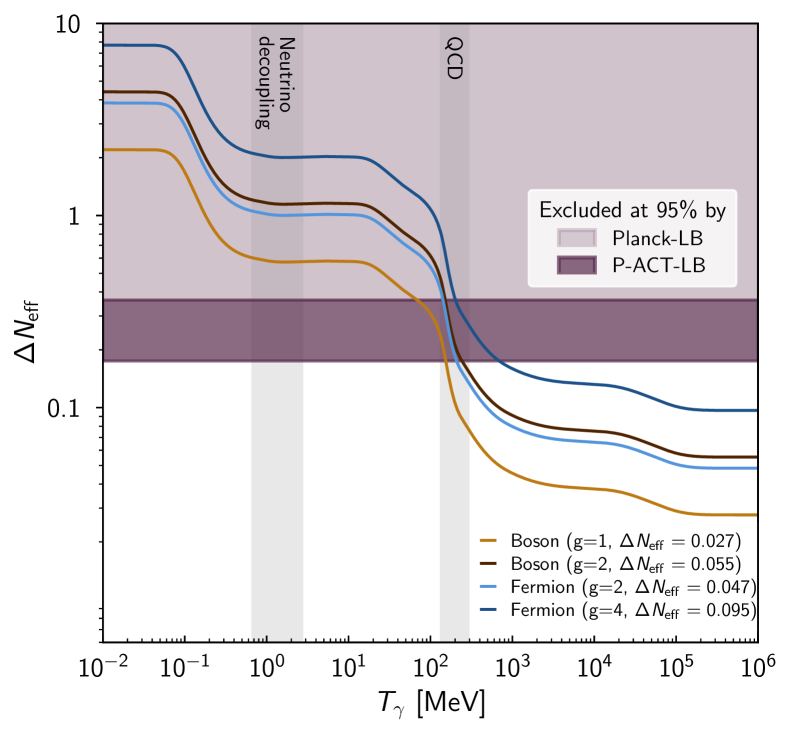
As shown in Figs. 1 and 2, the region of parameter space preferred by ACT is in the low corner of the correlation — we find km/s/Mpc (68%, P-ACT-LB) when varying . This is driven by ACT’s preference for values of below 3.044, while values higher than the SM expectation would be necessary to increase the expansion rate. Therefore, this model extension is no longer viable to move the CMB-inferred Hubble constant toward the local SH0ES estimate. On the contrary, the P-ACT-LB constraint is well within the CCHP measurement of . If we import this latter measurement as a prior on , we find a small pull of the central value of to higher values and negligible tightening of the error bar.
Including also a prior on (as described in §2.5) leaves the constraint essentially unchanged. In fact, including all state-of-the-art non-CMB data has limited impact on the precision of this measurement, which is dominated by P-ACT.
is often used as a proxy parameter to explore the sensitivity of small-scale CMB data to physics that impacts the damping tail; conclusions drawn for in fact speak more broadly about patterns in — and robustness of — results from small scales. As such, we perform a number of tests to look at the stability of the measurement. In Fig. 21, we report the variation in the constraint when comparing our baseline ACT and P-ACT datasets with only a subset of the data.232323To allow fair comparisons across values, all these runs are performed with the ACT multi-frequency likelihood; the ACT TE- and EE-only runs allow the polarization efficiencies to vary freely within a 20% uniform prior. The results are stable across probes, frequencies, and combinations with Planck. The overall constraint is dominated by the ACT TT and TE spectra.
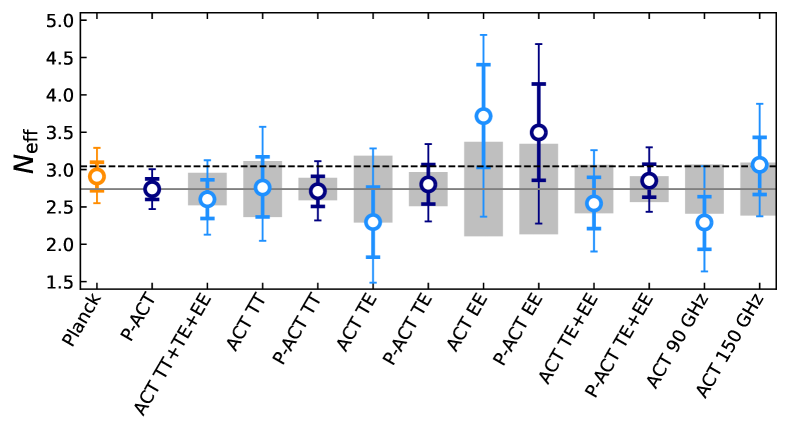
Neutrino mass
The total mass of all neutrino species is parametrized by . Measurements of flavor oscillations between neutrinos have provided evidence for a non-zero mass (Super-Kamiokande Collaboration, 1998; SNO Collaboration, 2002) and set a lower limit on the value of . Depending on the hierarchy (ordering) between mass eigenstates, meV for the normal hierarchy and meV for the inverted hierarchy (e.g., Particle Data Group, 2024). The absolute value of the total mass is still unknown but, given that massive neutrinos with masses at sub-eV scales cannot be explained with the mass-generation mechanisms of the SM of particle physics, we already know that new physics is at play. Cosmology and laboratory experiments are highly complementary probes of the neutrino mass scale, being sensitive to different combinations of individual neutrino masses and mixing parameters, and relying on different assumptions in the derivation of the constraints (see, e.g., Gerbino et al., 2023).
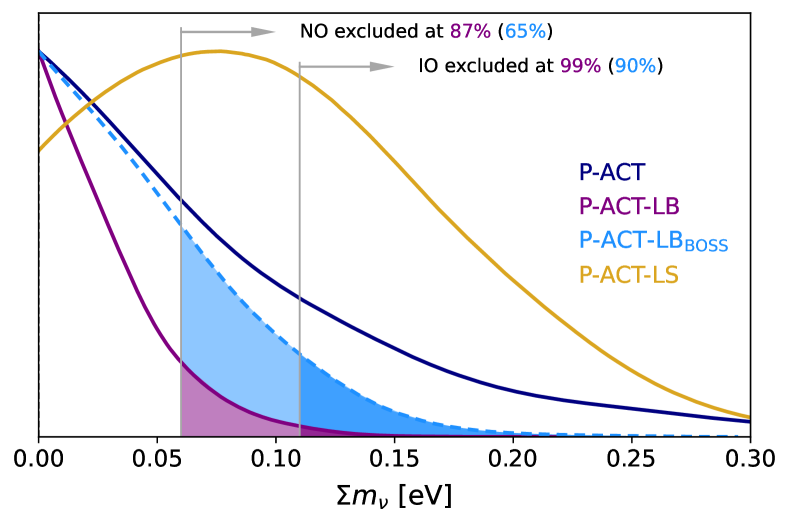
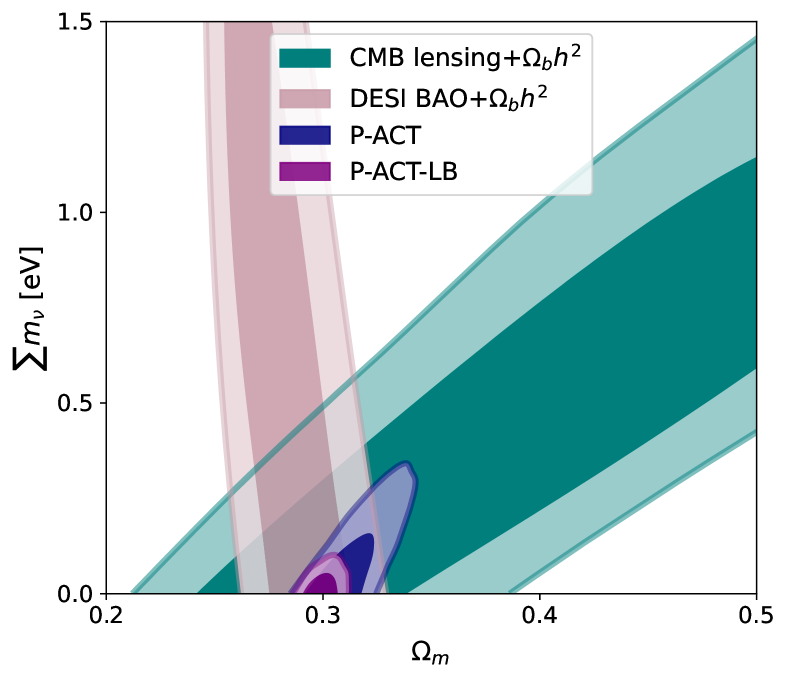
Neutrino mass impacts the growth of structures in the universe after the neutrinos become non-relativistic (e.g., Lesgourgues & Pastor, 2006; Dvorkin et al., 2019), suppressing growth at the level of a few percent. This in turn affects the amplitude of density perturbations measurable in the lensing of the CMB temperature and polarization anisotropies. Planck-LB gives eV at 95% confidence (DESI Collaboration, 2025b), with a significant contribution from the CMB lensing data. With the new ACT DR6 spectra we find
| (33) | |||||
The addition of ACT DR6 to Planck leaves the bounds almost unchanged. However, the neutrino mass constraints from Planck correlate with the high fluctuation of the lensing-like smearing effect in the Planck CMB spectra (measured by the parameter, Calabrese et al., 2008) so the ACT dataset serves here as a useful cross-check of the result. The impact of extra lensing is mitigated in the P-ACT combination by the cut in that we introduce in Planck temperature and is completely avoided in the W-ACT combination — since, as shown in L25, ACT DR6 measures consistent with predictions. Once CMB lensing and BAO data are included, the CMB power spectra contribution to the bound is sub-dominant and the same across experiments. The conclusion that extra lensing-like smearing in the power spectra is not the primary contributor to the very tight bounds on was also reached by Green & Meyers (2024), who delve into all the different pieces of data contributing to a neutrino mass constraint (see also Escudero & Abazajian, 2025).
As shown in Figs. 22 and 23, neutrino mass measurements from cosmology need different datasets to come together to disentangle the effect of neutrinos on the geometry of the universe and growth of structure from the late-time expansion effects (for a recent review see, e.g., Loverde & Weiner, 2024). In particular, DESI’s constraint on the total matter density, through measuring the BAO and inferring cosmic distances, plays a large role in these neutrino mass limits, as shown in Fig. 23. The CMB lensing measurement then breaks the degeneracy between the total density in matter and in neutrinos, due to the unique effect of the neutrino on suppressing the clustering at smaller scales. The addition of ACT DR6 spectra confirms the tight limit that DESI Collaboration (2025b) found with Planck. The combination of P-ACT-LB disfavors at confidence the inverted ordering scenario. This conclusion holds also for an independent-of-Planck combination, with W-ACT-LB giving very similar results.
Given the strong impact on these constraints from BAO, we explore other dataset combinations that can help the CMB for neutrino mass constraints. We replace DESI with BOSS BAO and obtain a bound of
| (34) |
which is unchanged when replacing Planck with WMAP. We also exclude BAO completely and instead exploit the information on the matter density coming from SNIa measurements, finding
| (35) |
In both cases, the limits become weaker and raise the likelihood of the inverted ordering (see Fig. 22). The broadening of the bound in P-ACT-LS is due to the preference of a larger value of the matter density exhibited by the supernovae measurements, as described in Loverde & Weiner (2024).
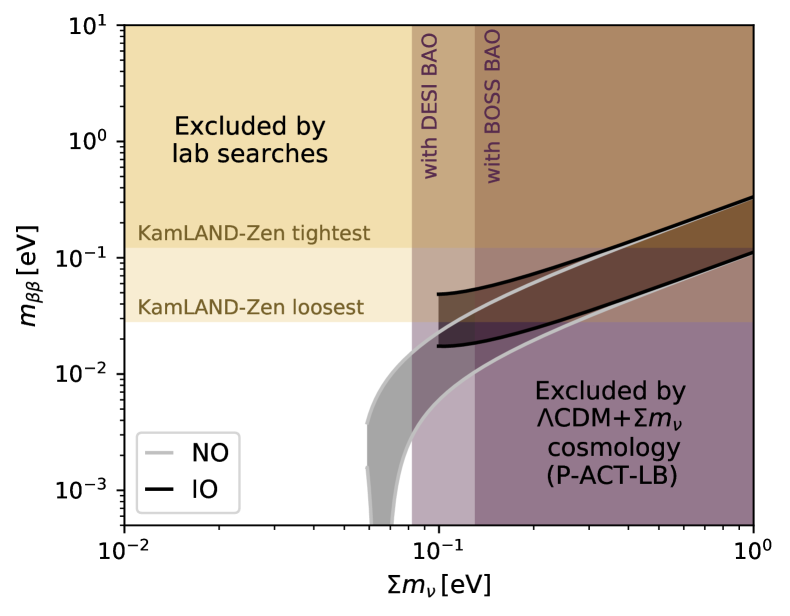
In Fig. 24, we compare our P-ACT-LB bounds with constraints on the effective Majorana mass from the neutrinoless double-beta decay () experiment KamLAND-Zen (KamLAND-Zen Collaboration, 2024) (comparable constraints — not shown here — have also been obtained by the GERDA collaboration, GERDA Collaboration, 2020). The viable parameter space, represented by the two colored bands for the two neutrino mass orderings, is cut by the combination of cosmology and results within . Assuming that the neutrino mass mechanism leads to the process (which thus assumes neutrinos are Majorana particles), KamLAND-Zen is able to exclude almost entirely the inverted ordering region. Cosmology further excludes the still-allowed IO region and a large fraction of the normal ordering. This sets a challenging target for next-generation searches to probe the region of (the lowest value for the Majorana effective mass in the inverted ordering when considering measurements from neutrino oscillation experiments, i.e., the lowest value at the bottom of the black IO band in Fig. 24). However, as discussed in, e.g., DESI Collaboration (2025b); Shao et al. (2024), these limits are model-dependent: for example, extended models with time-varying dark energy will relax the bounds on neutrino mass and bring the IO back into the allowed region. Cosmological bounds also assume that neutrinos are long-lived particles with a Fermi-Dirac distribution function. Models that deviate from these assumptions, such as scenarios featuring decaying neutrinos or neutrinos with average momenta larger than that of a thermal distribution (e.g., Dvali & Funcke, 2016; Lorenz et al., 2019; Oldengott et al., 2019; Chacko et al., 2020, 2021; Barenboim et al., 2021; Alvey et al., 2022a, b; Chen et al., 2022a; Abellán et al., 2022), would likely still be compatible with masses in the IO band.
The constraints on both and remain stable when varying both parameters at the same time, with
| (36) |
and little correlation in the joint parameter region.
While the constraint on agrees with SM predictions, the most probable value for from cosmology is currently zero, in contrast with oscillation measurements. If this difference were to become significant with more precise data, it would imply a tension between our constraints on neutrino properties in the early universe versus neutrino measurements in the laboratory. Fortunately, with the increasing sensitivity of future CMB and BAO measurements, we can hope to determine the sum of neutrino masses to 0.02–0.03 eV precision (e.g., CMB-S4 Collaboration, 2016; Simons Observatory Collaboration, 2019; Eisenstein & DESI Collaboration, 2015; Abitbol et al., 2025).
6.1.2 Neutrino self-interactions
Neutrino self-interactions can arise in a class of BSM models, for example in models where Majorana neutrinos interact through a (pseudo)scalar, the Majoron , related to the breaking of lepton number and to the generation of small neutrino masses (Chikashige et al., 1980, 1981; Schechter & Valle, 1982). In a wide class of models, the neutrino-Majoron coupling constant , controlling the strength of neutrino self-interactions, is proportional to , where is the neutrino mass and is the scale of the new physics that breaks lepton number. In general, a signature of neutrino self-interactions in cosmological observations might point to BSM physics. Here, we study the CMB phenomenology related to neutrino self-interactions arising from neutrino–neutrino scattering processes, which is mostly independent of the spin and parity properties of the mediator. The symbol in the following will denote a generic mediator, including the Majoron, unless otherwise stated. We consider interactions among the three active neutrinos that do not couple different mass eigenstates, and with eigenstate-independent strength (in other words, the matrix of couplings is proportional to the identity matrix in the mass basis).
Self-interactions affect the evolution of perturbations by making neutrinos behave, at certain times, as a collisional fluid and not as free-streaming particles. Acoustic oscillations will then propagate in the neutrino fluid and enhance, through gravity, the amplitude of photon fluctuations. Collisions will also cancel the characteristic phase shift imprinted on photon and matter perturbations by neutrino free streaming. These effects are relevant during the radiation-dominated era, when neutrinos provide a non-negligible contribution to the total energy density, and are imprinted at the time when perturbation modes re-enter the horizon. The range of scales affected thus also depends on the energy dependence of the scattering rate, which simplifies in the two limiting scenarios considered in the following: a very light (“massless”) or very heavy mediator.
Heavy mediator
We consider first the case where the mass of the mediator is much larger than the neutrino temperature at all times directly probed by CMB anisotropies (Cyr-Racine & Sigurdson, 2014). In this case, the neutrino interaction is effectively a four-fermion vertex controlled by a dimensional coupling constant , i.e., the effective low-energy Lagrangian is . This is analogous to the low-energy behavior of standard weak interactions, just with taking the place of the Fermi constant . This low-energy limit does not depend on the nature of the mediator, so the analysis here naturally encompasses both the scalar and vector cases. The Boltzmann hierarchy for neutrino perturbations including the collision term generated by the interaction has been derived by Kreisch et al. (2020).
In this scenario, neutrino free-streaming does not start at the time of weak decoupling, but is instead delayed until , where is the neutrino decoupling temperature. Neutrino self-interactions through a heavy mediator leave an imprint at angular scales (assuming ), where is the scale entering the horizon at .
Previous analyses have shown that CMB and BAO data are compatible with, and in some cases prefer, neutrino self-interactions with (Cyr-Racine & Sigurdson, 2014; Archidiacono & Hannestad, 2014; Lancaster et al., 2017; Oldengott et al., 2017; Park et al., 2019; Kreisch et al., 2020; Barenboim et al., 2019; Brinckmann et al., 2021; Das & Ghosh, 2021; Mazumdar et al., 2022; Roy Choudhury et al., 2021; Poudou et al., 2025). In fact, the posterior for has been found to be bimodal, with probability being concentrated in two distinct regions: a moderately interacting (MI) mode, compatible with no self-interactions, and a strongly interacting (SI) mode. The analysis of ACT DR4 data showed a slight preference for neutrino self-interactions at the level, finding for MI, and for SI (Kreisch et al., 2024).
We start by considering a one-parameter extension of , including as an extra parameter and keeping fixed and . To check if the bimodal behavior persists with the ACT DR6 spectra, we split the parameter space in two regions, (MI) and (SI), and perform separate MCMC runs with flat priors on : (MI) and (SI). The logarithmic prior allows us to explore a wide range of values of , spanning several orders of magnitude.
In the MI region, the P-ACT and P-ACT-LB combinations are compatible with , but show a mild preference for . In contrast, in the SI region, the posteriors for the same dataset combinations peak at the lower edge of the prior range, i.e., at . We show the two posteriors in Fig. 25. Since we are performing separate parameter estimation runs for MI and SI, we cannot use the distributions to assess the relative probability of the two scenarios. Instead we compare the effective of MAP models in the two regions to that of the model, as reported in Table 3. We find that the SI model is never preferred over . The MI model yields basically no improvement to the goodness-of-fit for the ACT DR6 data alone with respect to , while it gives marginal improvement for P-ACT and P-ACT-LB. Specifically, we find (P-ACT) and (P-ACT-LB), corresponding respectively to a mild and 1.8 preference over , as computed using the likelihood-ratio test.
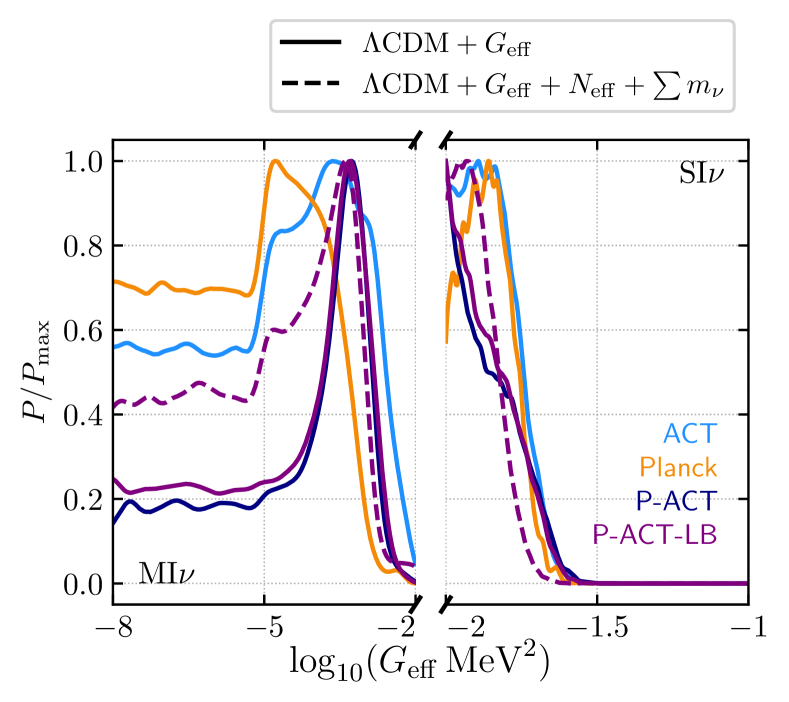
| ACT | P-ACT | P-ACT-LB | |
|---|---|---|---|
| – | 1.7 | ||
| – | – | – |
Since is compatible with the data, the posterior for the MI scenario ideally extends with non-zero probability down to . The posterior is therefore ill-defined with a diverging integrated probability. This prevents the computation of meaningful Bayesian credible intervals. Previous analyses chose to arbitrarily cut the distribution at some lower bound and reported credible intervals depending on this choice. Here, we take a different approach; once the information about the position of the peaks has been acquired from the runs with a logarithmic prior, the proposal density of the MCMC can be correspondingly tuned and we repeat the runs using a uniform prior on , namely , ensuring a proper posterior. We choose a uniform prior on rather than on because the former amounts to a uniform prior on the scattering rate . Adopting this strategy, we find
| (37) |
We repeat the analysis for a model in which only one of the three neutrino families is self-interacting. In this case, we find that both P-ACT and P-ACT-LB yield a posterior with a well-defined peak in the SI region; in particular, (68% P-ACT-LB). The posterior in the MI region is instead qualitatively similar to the one found in the scenario with three interacting neutrinos. Both these single interacting-neutrino models are however not significantly preferred over , with and (P-ACT-LB), corresponding respectively to a 1.1 (MI) and 2.3 (SI) preference over .
We further consider a 9-parameter extended model with three interacting neutrinos in which, in addition to the base parameters and , also and are allowed to vary. As in Kreisch et al. (2024), is used to rescale the neutrino temperature. We find results similar to those for the model with three interacting neutrinos (see Fig. 25). In particular, we do not find a peak in the posterior in the SI region, in contrast to the mild preference for such a model seen in the analysis of the ACT DR4 data (Kreisch et al., 2024). The mild hint of SI in the DR4 analysis was largely driven by a high fluctuation in the EE power spectrum at intermediate scales, , which is no longer present in the DR6 spectra (see Appendix B).
To summarize, we find that limits on interacting neutrino models are sensitive to the underlying assumptions used to describe the broader physics in the neutrino sector. However, neutrino self-interactions are not detected in any scenario that we consider and not preferred over .
This lack of evidence also limits the ability of this model to increase the value of the Hubble constant. For example, a heavy mediator in the MI scenario gives km/s/Mpc () and km/s/Mpc () using P-ACT-LB. In general, we find no significant shift compared to for the model. In the extended case of , the distribution shifts lower by km/s/Mpc and has a twice larger uncertainty. This is driven by the correlation and by ACT’s preference for found in + (see §6.1.1), which persists in this model. In the SI scenario, we find instead km/s/Mpc () and km/s/Mpc () for P-ACT-LB. The km/s/Mpc upward shift in in the model is induced by the positive correlation between and . In the model, this effect is countered by a lower value of , resulting in a lower value of with respect to the corresponding MI scenario.
Laboratory searches, especially double- decay experiments and observations of meson and lepton decays, severely constrain the coupling of neutrinos with a new light boson (Blinov et al., 2019). Taken at face value, the values of in the SI region, as well as those corresponding to the MI peak, are excluded by these searches as shown in Fig. 26, unless the new scalar couples almost exclusively to neutrinos.
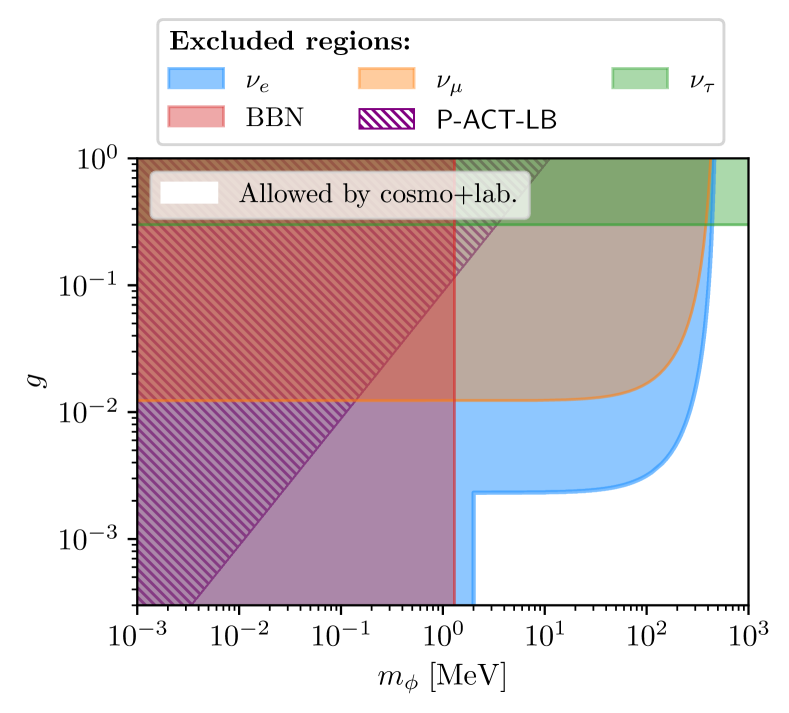
Light mediator
In this scenario the mediator mass is much smaller than the average neutrino momentum at all times of interest and the scattering rate , so that the ratio between the scattering and Hubble rates increases with time. Neutrinos will then start free streaming at weak decoupling as usual, and become collisional again at later times (Archidiacono & Hannestad, 2014; Forastieri et al., 2015, 2019). The effects of collisions are confined to scales between , the scale entering the horizon when neutrinos stop free streaming at late times, and . These correspond to intermediate angular scales in the CMB power spectra (larger scales compared to those affected by a heavy mediator) and so we expect less contribution to this limit from ACT DR6.
We write the thermally averaged cross section , where the coefficient depends on the details of the interaction, including the nature of the mediator. We consider a one-parameter extension of , varying with a flat prior. As in the heavy mediator case, this is equivalent to a flat prior on the neutrino interaction rate . We follow the approach of Forastieri et al. (2015, 2019) where the collision term is approximated using the thermally-averaged scattering rate in the relaxation time approximation. From Planck CMB data, we find at 95% CL. The new ACT DR6 spectra alone give a limit about three times weaker, with at 95% CL. Combining the two datasets gives a improvement on Planck alone, with
| (38) | |||||
or .
Neutrino couplings with a light scalar can be constrained from experiments and from supernovae explosions. These constraints are expressed in terms of the couplings in the basis of the eigenstates of the weak interaction, with , as opposed to the mass basis used in our analysis. The two bases are related through the neutrino mixing matrix. Currently, EXO-200 provides the most stringent laboratory limits on the electron neutrino-Majoron coupling: (Kharusi et al., 2021), where the range expresses the uncertainty due to nuclear matrix elements. Supernova data can also be used to constrain neutrino-Majoron couplings. In particular, scalar emission might overly shorten the observed neutrino signal from SN1987A. This luminosity argument excludes the range of couplings (Kachelriess et al., 2000). In most of the neutrino parameter space allowed by oscillation experiments, and P-ACT yields the strongest constraints on neutrino interactions with a light (pseudo)scalar. In Fig. 27, we show the posterior distribution for for various data combinations, and compare with the limit from the luminosity argument. In the same figure we also show the mild correlation between and the scalar spectral index , which we interpret as the result of the additional power at intermediate scales (i.e., on the left of the pivot scale ) for .
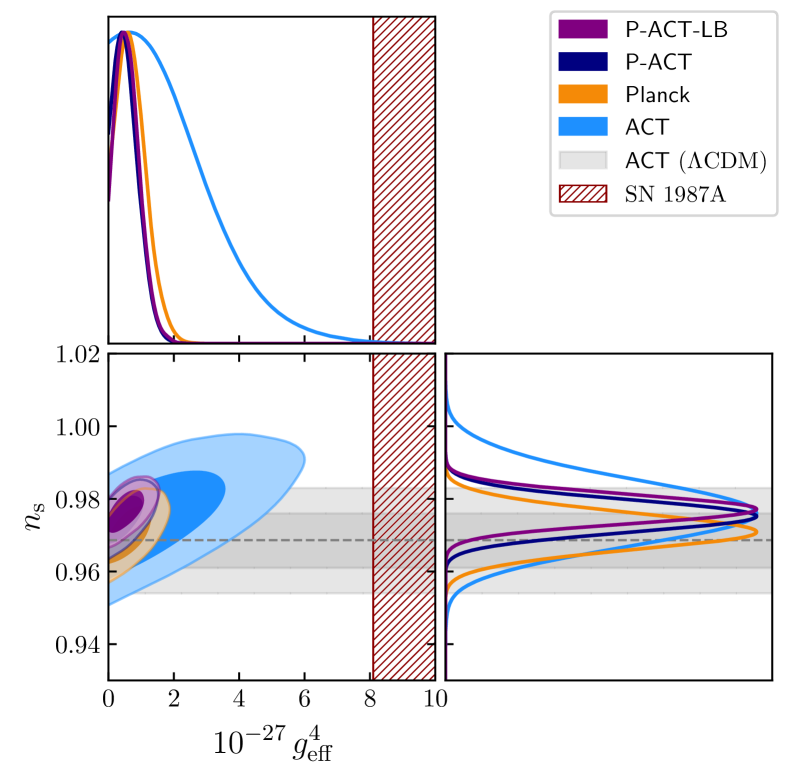
6.2 Helium and deuterium abundances
Light elements formed in the early universe during BBN, with abundances depending on the baryon-to-photon density ratio, , and the number of relativistic degrees of freedom, . Throughout this section we assume no leptonic asymmetry in the electron neutrino sector, i.e., a vanishing chemical potential of electron neutrinos. Given the photon temperature today (Fixsen, 2009), can be related to the physical baryon density .
To compute primordial abundances of light elements as a function of and we can use various computational codes, each built upon different underlying assumptions. In this paper we make use of the PRIMAT (Pitrou et al., 2018) and PRyMordial (Burns et al., 2024) codes in three configurations:
-
(a)
PRIMAT_2021: this is the default BBN computation used in camb version 1.5, but it was not present in the public version of class at the time our analyses were performed.242424We manually import PRIMAT-based tables from camb to use in class, as described in §3. As of writing, PRIMAT has recently been included in the public version of class. We use PRIMAT as the baseline BBN code in all analyses presented in this paper. It implements tabulated reaction rates based on theoretical ab-initio calculations (see Pitrou et al., 2018 and references therein for details) and assumes a neutron lifetime value , i.e., the average provided in PDG 2020 (Particle Data Group, 2020);
-
(b)
PRIMAT_2024: uses the same rates as PRIMAT_2021, with an updated value of from PDG 2024 (Particle Data Group, 2024);
- (c)
These different BBN calculations return the same cosmological parameters and only affect the prediction of BBN abundances, so a distinction and detailed discussion is only required in this section. We focus on BBN predictions for the primordial helium abundance, expressed as the nucleon number density fraction, — rather than the mass fraction parameter normally used in CMB calculations — and the primordial deuterium abundance, . Astrophysical determinations of the helium abundance are primarily derived from observations of low-metallicity extragalactic HII regions, whereas deuterium abundances are measured from high-redshift quasar absorption systems. The latest determinations are summarized in PDG 2024 which also provides average estimates for both elements252525Section 24.3 of Particle Data Group (2024) details the averaging procedure. The PDG 2024 average helium abundance does not incorporate the recent measurements from the EMPRESS survey performed on the Subaru telescope (Matsumoto et al., 2022), which indicate a helium abundance, , lower than the PDG value., namely (Aver et al., 2021, 2022; Valerdi et al., 2019, 2021; Fernández et al., 2019; Kurichin et al., 2021; Hsyu et al., 2020) and (Cooke et al., 2014, 2016; Riemer-Sørensen et al., 2015; Balashev et al., 2016; Riemer-Sørensen et al., 2017). We do not discuss here abundances of other light elements, such as tritium, , and ; these elements are more uncertain in both their determination and their interpretation (Fields, 2011; Iliadis & Coc, 2020; Particle Data Group, 2024).
6.2.1 Abundances assuming standard BBN
Fixing the radiation density to its standard value (), the baryon density in the baseline model can be directly related to the helium fraction. L25 shows that with the new ACT data the baryon density is measured to 0.5% uncertainty; for the three configurations listed above, this leads to262626Note that is only logarithmically sensitive to the baryon density, which leads to the small error bars here.
| (39) |
where the first set of errors reflect only the uncertainty on and the second in parentheses includes the theoretical BBN uncertainty added in quadrature. The shift between (a) and (b) is mainly driven by the different value adopted for the neutron lifetime, while the shift between (b) and (c) reflects the different treatment of the reaction rates and nuclear cross-sections between PRIMAT and PRyMordial; see Schöneberg (2024) for an exhaustive comparison. However, all these shifts are within the theoretical errors provided by the different codes, and encompassed by the PDG average of the observational bounds, which shows an order of magnitude larger error bar; see the upper panel of Fig. 28.
We find that relaxing the assumptions on the radiation density by varying weakens the constraints on the helium fraction, substantially absorbing all the discrepancies between different BBN codes:
| (40) |
Here the error is dominated by the uncertainty on and , and the shift with respect to the case is driven by the shift of between and + models.
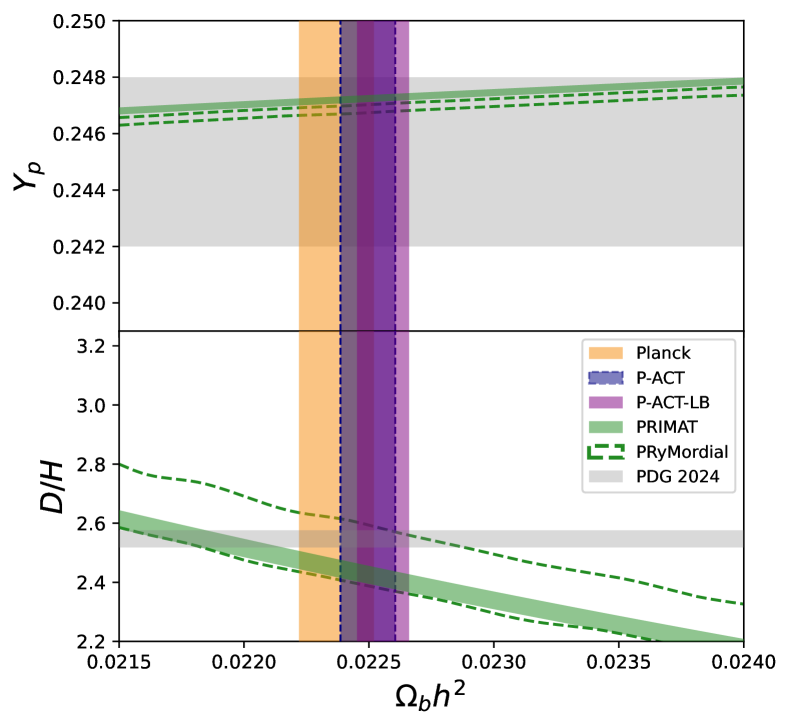
Following the same approach, we can predict the deuterium abundance under the assumption of standard BBN. In the baseline model the baryon density translates into
| (41) |
For deuterium, the neutron lifetime value has a negligible impact (Grohs & Fuller, 2022) and the shift is substantially caused by differences between PRIMAT and PRyMordial calculations, and mainly driven by the different choices made for the reaction rates. Theoretical errors also reflect the different choices made in the marginalization procedure by PRIMAT and PRyMordial — see again Schöneberg (2024) for an exhaustive comparison. When compared to direct measurements of the deuterium abundance, estimations based on PRIMAT exhibit a mild tension, ranging between 2 and 3. In contrast, the inferred values obtained using the PRyMordial computation are consistent with the PDG average, regardless of whether theoretical uncertainties are included; see the lower panel of Fig. 28.
In the + model, the scenario remains unchanged, with all constraints being shifted downward due to the higher baryon abundance found in this model
| (42) |
Again, the deuterium abundance inferred assuming PRyMordial is consistent with astrophysical measurements while both PRIMAT-based estimates are in mild tension ().
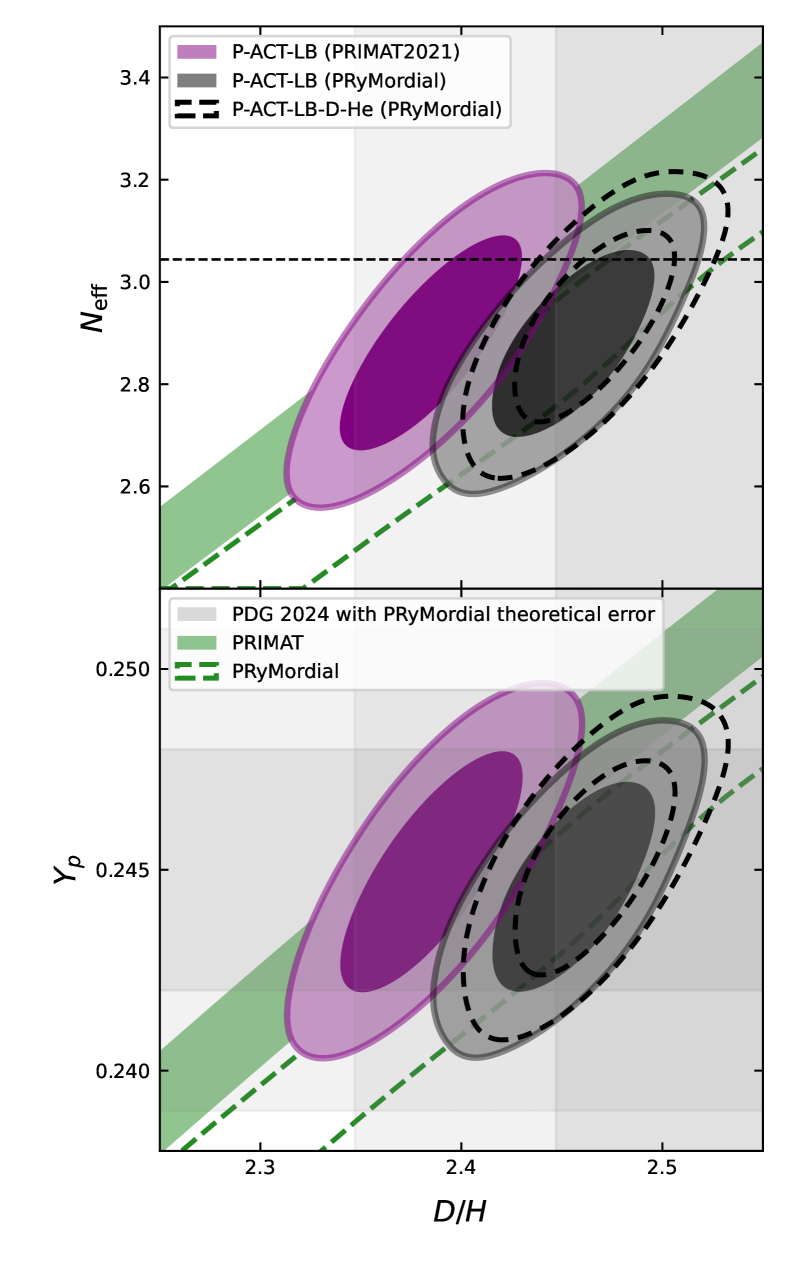
Given these results, we combine direct deuterium measurements, accounting for both observational and theoretical uncertainties, with the posterior distribution of only under the assumption of PRyMordial BBN calculations. This approach yields joint CMB+BBN predictions. After marginalizing over , we obtain
| (43) |
The uncertainty on remains substantially unchanged compared to the limit from P-ACT-LB (§6.1), as the theoretical error on deuterium dominates. The mean of the distribution is shifted towards slightly higher values, driven by the higher astrophysical measurement of the deuterium abundance as shown in Fig. 29.
We also expand this to include helium. In this case, the total uncertainty is dominated by the astrophysical measurement, which is only larger than the CMB determination (see Eq. 40). Combining the CMB data with the PDG averages we get
| (44) |
which represents the tightest limit on to date.
By assuming the PDG averages for helium and deuterium abundances and employing PRyMordial as the BBN calculator, we can also derive a pure BBN constraint on , finding after marginalizing over . This estimate shows that the number of neutrinos at BBN and at the CMB recombination epoch are in very good agreement.
6.2.2 Model-independent bounds on the helium fraction
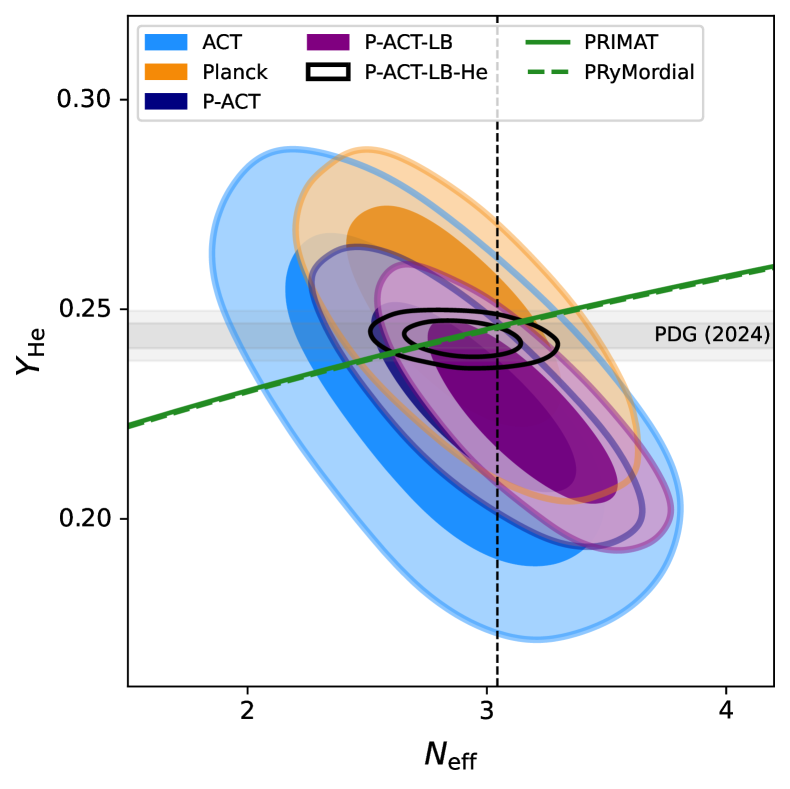
Instead of deriving the primordial helium abundance from BBN codes using constraints on , we can measure it directly with the CMB. Variations in alter the density of free electrons between helium and hydrogen recombination, thereby affecting the damping tail of the CMB anisotropies. By sampling the + model and converting the helium mass fraction into the helium nucleon fraction, we find
| (45) |
in good agreement with the astrophysical helium abundance measurements. Since both the helium abundance and the number of relativistic degrees of freedom influence the CMB damping tail, allowing both to vary simultaneously leads to weaker constraints
| (46) |
This is still consistent with direct helium abundance measurements and with the expected number of neutrinos, but with larger errors. The relatively low values of in this case have the same origin as the low value of in the + model, since lower values of both of these parameters reduce the damping, which is preferred by the ACT data. The joint constraints in the plane are shown in Fig. 30, where the anti-correlation between these two parameters is clearly evident.
Considering the PDG collection of helium abundance measurements as an external dataset, it is possible to sample the ++ model imposing a prior on , which leads to
| (47) |
where the degeneracy between and is efficiently broken by helium measurements (see Fig. 30) and the retrieved constraint is consistent with the one obtained in the + model.
6.3 Axion-like particles
We constrain contributions to the total dark-sector content from ultralight axion-like particles (with masses between ). This ultralight pseudo-scalar dark matter model is well-motivated by high-energy physics, as axions can generically arise from a variety of broken symmetries or compactified extra dimensions, the so-called “axiverse” (Arvanitaki et al., 2010; Duffy & van Bibber, 2009). These ultralight axions suppress structure formation below their de Broglie wavelength, which manifests on astrophysical scales. The axion Jeans scale , below which structure is smoothed out, depends on the axion mass: (Amendola & Barbieri, 2006; Duffy & van Bibber, 2009; Arvanitaki et al., 2010; Park et al., 2022; Hlozek et al., 2015; Marsh, 2016; Hui et al., 2017; Laguë et al., 2021; O’Hare, 2024). The dynamics of the axion are described through the Klein-Gordon equation
| (48) |
Here is the axion field, with indicating its homogeneous component, and primes denote derivatives with respect to conformal time. In the simplest case with a quadratic axion potential, this simplifies to
| (49) |
where is the conformal Hubble parameter, which acts as a friction term in the oscillator equation governing the axion dynamics. When the Hubble term drops (as the universe cools) to near the axion mass , the axion field begins to coherently oscillate, and begins to behave as a dark matter component (with ), whereas it behaves as a frozen-in “dark-energy-like” component at earlier times. This links the axion mass directly to its observational impact on the CMB and large-scale structure clustering. We solve for the relic axion density by solving the field equations given that
| (50) |
where is the critical density at . We model the effects of axions via the axionCAMB Boltzmann solver,272727https://github.com/dgrin1/axionCAMB which has been used in several previous analyses of the impacts of axions on the CMB and LSS (e.g., Hlozek et al., 2015; Hložek et al., 2018; Rogers et al., 2023; Laguë et al., 2021). There have been several improvements in the full Boltzmann solution (e.g., Liu et al., 2024) that are particularly relevant in extreme ranges of parameter space that we do not consider here. We leave a full comparison between codes for future work.
In order to correctly model the power on small scales (and to not introduce spurious signals of axion physics, see Hložek et al., 2017; Dentler et al., 2022), we use a modified halo model including mixed dark matter (Vogt et al., 2023). The computational cost of both the halo model code and axionCAMB requires using an emulator for efficient computation. We employ the axionEmu emulator,282828https://github.com/keirkwame/axionEmu which is based on a modified version of CosmoPower.
We present our constraints on the allowed fraction of the dark matter density that is comprised of axions in Fig. 31. For the lightest axion species (not studied here, but see, e.g., Hlozek et al., 2015) this represents a limit on how axions can constitute the dark energy. For the axions that we consider here, constraints on the axion fraction reflect a disentangling of axion effects from standard cold dark matter in large-scale clustering.
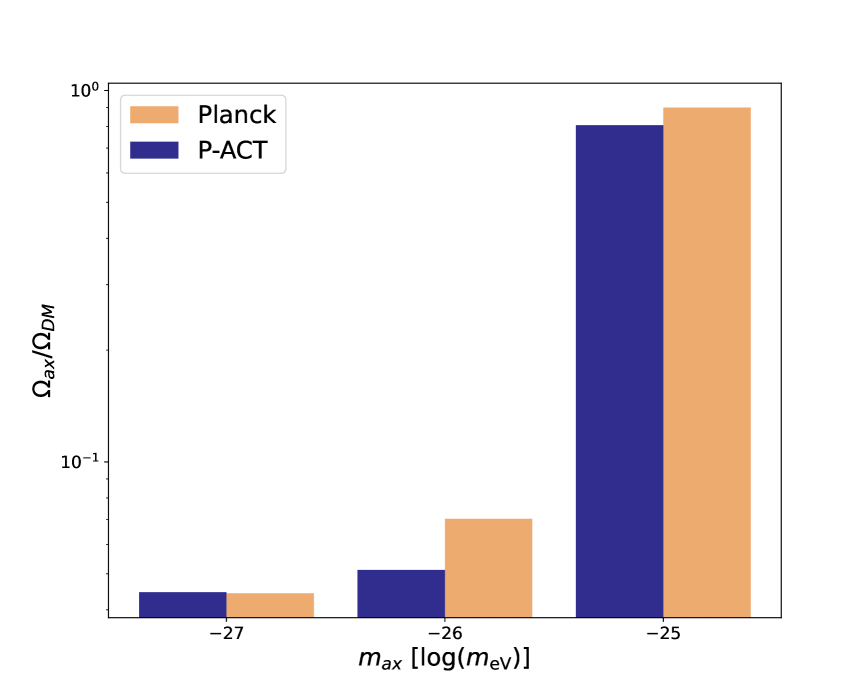
Using the primary CMB spectra from Planck alone or P-ACT, we find
| (51) | |||||
The upper limits for are comparable between Planck and P-ACT at , while P-ACT reduces the allowed fraction of axion-like dark matter to roughly 5% (95% CL) for the mass . For masses lighter than the axion starts to roll in its potential at later times, leading to changes in the primary CMB spectra on scales where Planck is most constraining. Some of the improvement in the constraints comes from the degeneracy between the axion density and the scalar spectral index. As the preferred value of slightly increases between Planck and P-ACT, the limits on the axion density also tighten. The impact of increased sensitivity in the temperature and polarization power spectra is more pronounced for the CMB lensing deflection power spectrum, particularly for . A full presentation of axion constraints including the ACT DR6 lensing power spectrum, and detailed modeling of the nonlinear clustering that impacts the lensing deflection on small scales, will be provided in a future paper (Laguë et al., in prep).
6.4 Dark matter
Many compelling dark matter (DM) models can be tested with cosmological probes, including scenarios where DM interacts with baryons or annihilates into photons as described in this section, and scenarios where DM interacts with dark radiation (§6.5) or with dark energy (§7.3).
6.4.1 DM-baryon interactions
Dark matter models beyond the standard paradigm of cold, collisionless DM (CDM) include scenarios in which DM interacts with baryons (Cushman et al., 2013; Battaglieri et al., 2017; Gluscevic et al., 2019; Akerib et al., 2022). As done in previous ACT analyses (Li et al., 2023c), we consider the specific case in which DM elastically scatters with protons (Gluscevic & Boddy, 2018; Boddy & Gluscevic, 2018) through a contact interaction. These models were previously explored using both linear cosmology (Boehm & Schaeffer, 2005; Sigurdson et al., 2004; Dvorkin et al., 2014; Gluscevic & Boddy, 2018; Boddy & Gluscevic, 2018; Boddy et al., 2018; Nguyen et al., 2021; Rogers et al., 2022; Li et al., 2023c; Slatyer & Wu, 2018; Buen-Abad et al., 2022; Hooper et al., 2022; Becker et al., 2021) and near-field cosmology (Maamari et al., 2021; Nadler et al., 2019, 2021; Gluscevic et al., 2019). In a DM-baryon scattering scenario, the two corresponding cosmological fluids exchange heat and momentum, leading to collisional damping of small-scale perturbations in the early universe. The strength of the interaction is quantified with the momentum-transfer cross-section , where is the relative particle velocity (sourced primarily by thermal velocities at the redshifts of interest), is the power-law index determined by the interaction theory, and the cross-section normalization is a free parameter of the model.
We consider models with , 0, and 2 and fix the DM particle mass to MeV. We choose a sub-proton mass because direct detection experiments probe values of greater than 1 GeV, and constraints from exclude thermal-relic DM with masses lower than MeV (Lewin & Smith, 1996; An et al., 2022). The choice of MeV allows us to explore the extreme end of what direct detection does not reach. We then choose to explore the set of values that correspond to the most salient DM-baryon scattering models: millicharged DM (), a velocity-independent and spin-independent contact interaction (), and DM with a velocity-dependent contact interaction () (Dvorkin et al., 2014). We use a modified version of class (Gluscevic & Boddy, 2018; Boddy et al., 2018) that incorporates the effect of DM-baryon scattering in the linear-theory Einstein-Boltzmann equations. We assume a broad, flat, positive prior on for each value of . Each interaction model is thus a single-parameter extension of , for a given and DM particle mass.
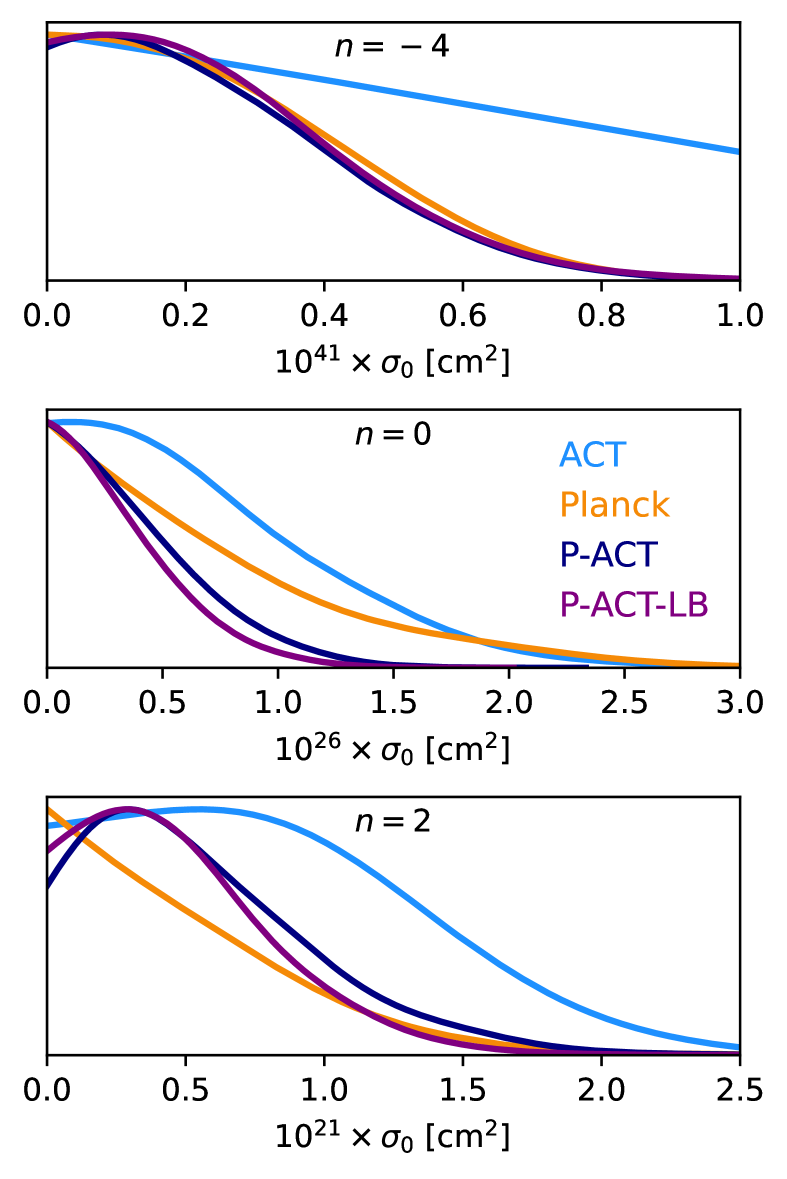
We present constraints corresponding to the three interaction scenarios in Fig. 32. For , we find that ACT data do not improve on Planck constraints, giving ; similarly, the addition of CMB lensing and BAO data has a negligible impact on the constraint. This is because the model produces a scale-independent suppression at high , and the high-multipole measurements from ACT do not add significantly to the signal-to-noise for this scenario. On the other hand, the model produces a strong -dependent power suppression in both temperature and polarization (e.g., He et al., 2025), and thus ACT alone has comparable constraining power to Planck, leading to an upper bound of . A combined analysis of ACT and Planck data leads to a factor of two improvement in the upper bounds,
| (52) | |||||
For , ACT only marginally improves on Planck constraints, giving (95%, P-ACT). The addition of CMB lensing and BAO data again has a minimal impact, giving . As ACT data are particularly sensitive to power suppression on small scales, the difference in constraining power for and stems from the baryon-loading-like effect occurring in the model, which leads to an enhancement of power at intermediate multipoles, rather than a strong suppression seen in the case (Boddy et al., 2018).
The limits presented here are the tightest bounds on DM-baryon interactions obtained to date from linear cosmology. In particular, these bounds are consistent with and comparable to the results of joint analyses of Planck, BOSS, and DES data (He et al., 2023, 2025). Meanwhile, the bounds obtained from highly nonlinear systems, such as the Milky Way satellite galaxy population, are stronger for all models that produce strong scale-dependent suppression (in this case, ), as they lead to a notable decrement of small halos in the late universe (Maamari et al., 2021; Nadler et al., 2019, 2024). However, the non-linear modeling required for satellite analyses does not yet allow the exploration of the full cosmological parameter space, and the bounds obtained from near-field cosmology are thus not an apples-to-apples comparison to the present results. Moreover, mixed DM with a subcomponent interacting through velocity-independent () scattering was also found to yield a lower value of , by suppressing the linear matter power spectrum on semi-nonlinear scales (He et al., 2023, 2025). The ACT DR6 analysis results presented here are consistent with the preferred parameter space of interacting DM that reduces by a non-negligible amount, for the case where all DM interacts with protons. However, models that are most interesting in this context feature mixed DM and dedicated analyses of these scenarios are left for future work.
6.4.2 DM annihilation
If DM annihilates into Standard Model particles, energy released by the annihilation process is injected into the photon-baryon plasma around the time of recombination. This energy injection affects the CMB by altering the ionization history so as to broaden the width of the last-scattering surface and introducing a unique signature in matter clustering. The main observational signatures in the CMB power spectra are: (i) damping of high- power in both temperature and polarization; (ii) enhancement of the polarization power spectrum at ; (iii) shifts of the low- acoustic peaks in polarization (e.g., Padmanabhan & Finkbeiner, 2005; Madhavacheril et al., 2014; Green et al., 2019). The high- signature is degenerate with other parameters that alter the damping tail, such as ; thus, most of the constraining power beyond Planck for this model is anticipated to come from large-scale polarization measurements. Because of this, we do not expect major improvements in the constraints for this model from ACT DR6, given the scales probed by our data.
We follow earlier literature (Finkbeiner et al., 2012; Madhavacheril et al., 2014) and constrain the annihilation parameter
| (53) |
where is the DM particle mass, is the thermally-averaged annihilation cross-section, and is the fraction of the energy due to annihilation that is injected into the plasma (Planck Collaboration, 2020c). The transferred energy fraction is indeed redshift-dependent, but this redshift dependence only weakly impacts the CMB and can thus be approximated by a constant fraction (Slatyer, 2016a, b). Thus, corresponds to the energy transferred to the plasma around the redshifts at which the CMB is most sensitive to DM annihilation () (Finkbeiner et al., 2012). We assume that this energy from DM annihilation is transferred to the plasma immediately, known as the “on-the-spot approximation” (Planck Collaboration, 2020c). We set a broad, flat prior on and use the implementation of this model in the current standard version of class.
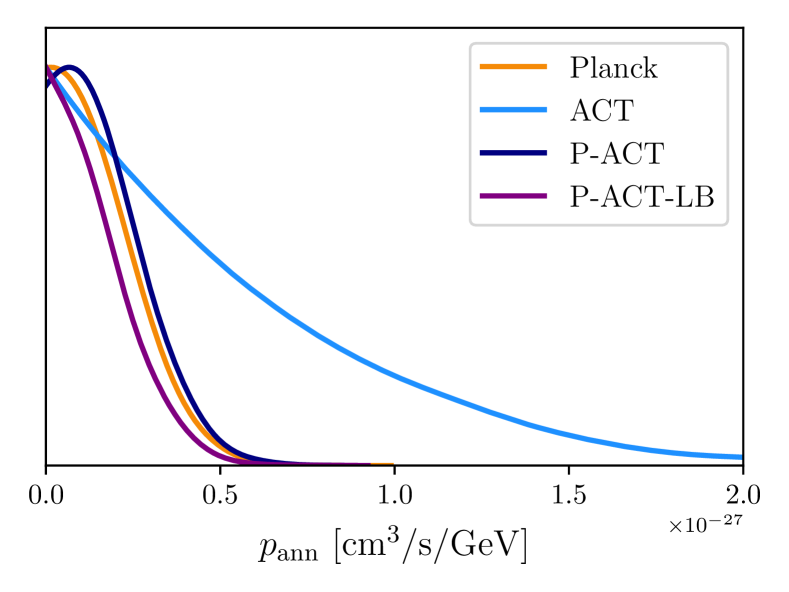
The results of this analysis are summarized in Fig. 33. We find no evidence of DM annihilation from the new ACT DR6 spectra, with . When combining with Planck, we find that the joint upper limit does not improve upon the Planck-only constraint of ,292929We find a slightly weaker bound for Planck alone than that in Eq. (89a) of Planck Collaboration (2020c); this may be due to a slight shift of the central value arising from our use of Sroll2 for the low- EE data, which is particularly important in constraining this model. but this is primarily due to the peak of the posterior for shifting slightly away from zero, as can be seen in Fig. 33. The joint constraint gives . The addition of CMB lensing and BAO data helps to tighten the constraints and pushes the peak of the posterior back to zero, yielding . Further addition of SNIa data does not tighten this limit. While the ACT DR6 data do not significantly improve constraints on beyond those from Planck, future improvements from large-scale CMB polarization data are expected (see, e.g., Madhavacheril et al., 2014; Green et al., 2019).
6.5 Interacting dark radiation
6.5.1 Self-interacting DR
A wide range of dark radiation (DR) models have been constructed, beyond the simple free-streaming case parameterized by (e.g., Jeong & Takahashi, 2013; Buen-Abad et al., 2015; Cyr-Racine et al., 2016; Lesgourgues et al., 2016; Aloni et al., 2022; Joseph et al., 2023; Buen-Abad et al., 2023; Rubira et al., 2023; Schöneberg et al., 2023; Zhou & Weiner, 2024). These models generically involve self-interactions amongst the DR, interactions between the DR and (a subset of) the DM, or combinations thereof, potentially with non-trivial time-dependence (e.g., due to the temperature of the DR-DM sector falling below the mass of a massive mediator particle). As a first step toward investigating these scenarios, we consider a simple model of (strongly) self-interacting DR (SIDR), for example due to a new gauge interaction in the dark sector. At the background level, this model is identical to , with a free parameter describing the number of additional relativistic species (and hence the additional DR energy density). However, the SIDR and free-streaming DR models differ at the perturbative level: the SIDR forms a perfect relativistic fluid with , with interactions sufficiently strong that no anisotropic stress (or higher-order Boltzmann moments) can be supported. Thus, the perturbative dynamics are characterized fully by the continuity and Euler equations. Unlike free-streaming DR, SIDR can cluster on small scales, thus reducing the impact of Silk damping on the high- power spectra (at fixed DR energy density). In addition, SIDR generates a smaller phase shift in the power spectra. Thus, CMB fits to the SIDR model can accommodate larger amounts of DR than the free-streaming DR model, which can thus allow higher values of (e.g., Aloni et al., 2022; Schöneberg et al., 2022; Allali et al., 2024).
We consider a simple SIDR model parameterized solely by , with . We assume no interactions between the SIDR and the DM. We use the implementation of this model in class303030We set idm_dr_tight_coupling_trigger_tau_c_over_tau_h = 0.005 and idm_dr_tight_coupling_trigger_tau_c_over_tau_k = 0.008 to ensure high accuracy, identical to the values we use for the analogous class accuracy parameters in the SM sector (see Appendix A). and we adopt a flat, uninformative prior . We assume that the SM neutrino sector consists of one massive state carrying 0.06 eV and two massless states, with .
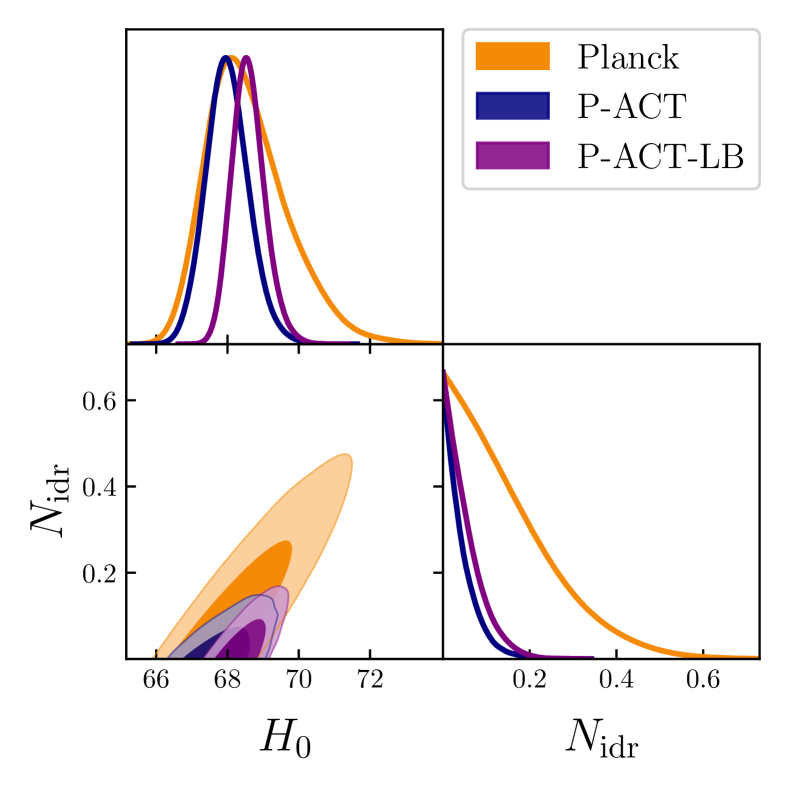
Constraints on this model are presented in Fig. 34. From the ACT DR6 primary CMB power spectra alone, we find
| (54) |
Including Planck primary CMB power spectra, we obtain
| (55) |
The joint P-ACT constraint represents more than a factor-of-three improvement over the constraint from Planck alone, for which we find at 95% confidence. The origin of this tight constraint is the lack of preference for excess high- damping in the DR6 power spectra; since SIDR can only increase damping (due to the physical bound ), its existence is thus disfavored by the data. From the primary CMB, we thus see no evidence of additional SIDR species, extending our results for the free-streaming DR case () to a very different physical regime.
Including additional low-redshift datasets does not significantly tighten the bound on , but further tightens the error bar on and other cosmological parameters. From the combination of ACT and Planck CMB spectra, ACT and Planck CMB lensing, and DESI BAO, we obtain
| (56) |
The upper limit on weakens slightly compared to that found for P-ACT above, due to small shifts in the best-fit parameter values. Further including SNIa data in the analysis yields negligible changes to these constraints.
The MAP SIDR model found for P-ACT, as well as that found for P-ACT-LB, yields negligible improvement in the quality of fit over CDM — in fact, we find that the MAP SIDR model lies at the limit of the parameter space in both cases, i.e., with , indicating no preference for this model extension. We emphasize again that this lack of preference arises from the lack of excess damping seen at high- in ACT: because SIDR can only increase damping over that in , the model cannot accommodate decreased damping (unlike , which can do so via a value of ).
These are the tightest bounds on SIDR presented to date. The ability of this model to increase the value of inferred from cosmological data is strongly limited by these observations, with the new ACT DR6 spectra playing a crucial role in significantly tightening the constraints compared to those from Planck.
6.5.2 Interacting DR-DM
A wide range of dark sector models have been considered in the literature, featuring various types of interactions between dark radiation and dark matter species (e.g., Cyr-Racine et al., 2016; Buen-Abad et al., 2015; Lesgourgues et al., 2016). As a first step in probing this space of models, here we consider the fiducial scenario studied in Rubira et al. (2023), in which an SIDR fluid (identical to that studied above) interacts with all of the DM via an interaction with a momentum transfer rate between the DM and the DR (Buen-Abad et al., 2018). Microphysically, such an interaction can be realized in dark-sector models featuring non-Abelian gauge bosons (hence the “nadm” subscript) that mediate interactions between Dirac fermion DM particles (Buen-Abad et al., 2015; Lesgourgues et al., 2016). In this particular model, has a redshift (or temperature) dependence that matches that of the Hubble rate during radiation domination — see Buen-Abad et al. (2015) for an explicit calculation of the momentum transfer rate in the “nadm” model. As a consequence, the interaction between the DR and the DM is relevant while modes covering a broad range of scales enter the horizon (essentially during all of radiation domination), which leads to a roughly scale-invariant suppression of power for such modes. This makes the model a promising candidate to decrease the CMB-inferred value of (Buen-Abad et al., 2015; Rubira et al., 2023). The SIDR abundance (set by ) determines the scale where power is suppressed, while the interaction strength determines the amount of suppression (Buen-Abad et al., 2015).313131Note that the IDR-IDM interaction studied here is not relevant in the late universe, and thus late-time growth is not affected; modifications to structure formation are captured by the change in the linear matter power spectrum.
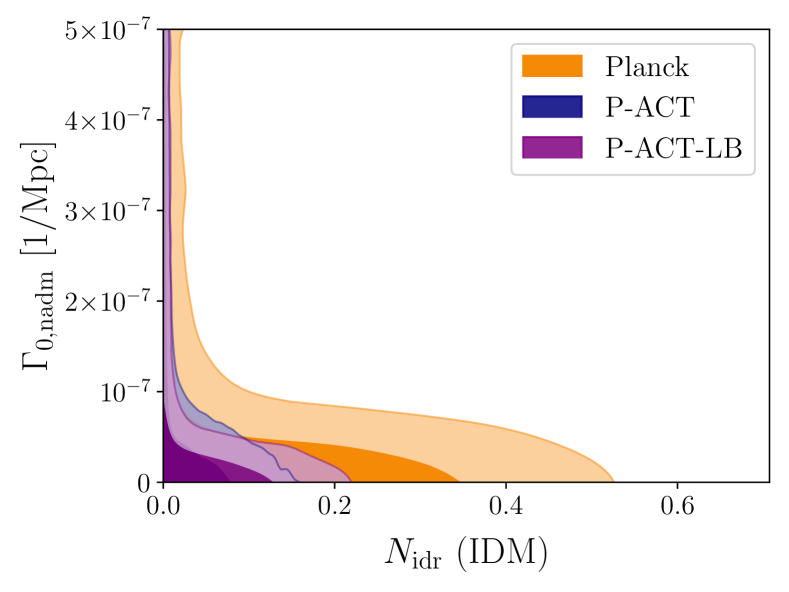
We use the implementation of this interacting DR – interacting DM (IDR-IDM) model in class (Lesgourgues et al., 2016; Archidiacono et al., 2019). The model contains two additional free parameters beyond those of base : (as in the SIDR model above) and . We adopt the same priors and model assumptions as for the SIDR scenario for all common parameters, while for , we adopt an uninformative, uniform prior .
We find no preference for the IDR-IDM scenario in the ACT DR6 spectra. Constraints on this model are shown in Fig. 35. Joint analysis of ACT and Planck yields
| (57) |
This is a significant improvement over analogous results from Planck alone, for which we find at 95% CL and no bound on (at 95% CL). We find negligible reduction in in the P-ACT fit to the IDR-IDM model, with at 68% CL. Inclusion of CMB lensing and DESI BAO data in the combined dataset yields:
| (58) |
The bound on tightens considerably compared to P-ACT, with at 68% CL, further limiting this model’s ability to yield low values of this parameter.
We note that Bayesian constraints on the IDR-IDM model can suffer from volume effects, since becomes degenerate in the limit. We thus confirm that the best-fit IDR-IDM model to P-ACT or P-ACT-LB does not yield a significantly better fit to these data than . In fact, as found for SIDR, we find that the MAP model in the IDR-IDM scenario for both P-ACT and P-ACT-LB is indistinguishable from within our numerical precision. Overall, we see no evidence of extended dark-sector physics in this analysis.
7 Gravity and late-time physics
7.1 Geometry: spatial curvature
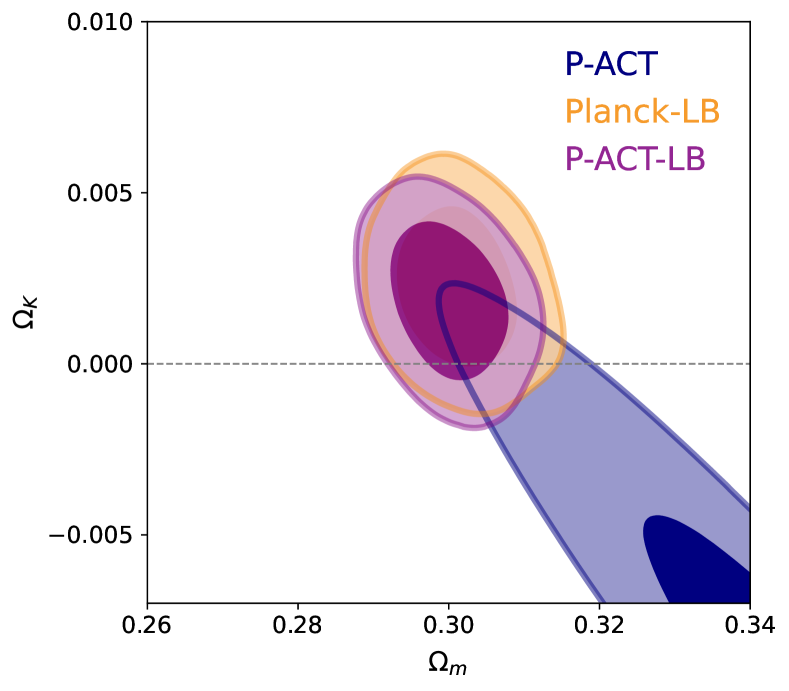
In the inflationary scenario, at the end of inflation the universe is predicted to emerge in a state very close to spatially flat (Linde, 1982; Albrecht & Steinhardt, 1982). This hypothesis is tested empirically by allowing the curvature density parameter, , which is fixed to zero in the baseline model, to be a free parameter. As discussed in L25, the new ACT DR6 power spectra alone prefer a flat geometry, breaking degeneracies via lensing effects in the power spectra; in a joint fit with Planck, ACT DR6 moves the Planck contours toward vanishing curvature. When adding BAO and CMB lensing data to the primary CMB, the degeneracy with the matter density is more effectively broken, as shown in Fig. 36, and the constraints tighten significantly, yielding
| (59) |
similar to (68%, Planck-LB). These limits derived from the combination of CMB and low-redshift data tightly constrain the universe’s spatial geometry, and are fully consistent with spatial flatness.
This result can be converted into a new limit on the present-day radius of spatial curvature of the universe, where is the total cosmic energy density, such that . With P-ACT-LB we find at 95% confidence Gpc or equivalently billion light-years for a closed universe ( or ) and Gpc or billion light-years for an open universe ( or ).
7.2 Late-time dark energy
Within the model, the dark energy density is constant over time, described by a cosmological constant with an equation of state at all times. A common way of exploring the dark energy component is to relax the assumption on its equation of state, considering a time evolution of the pressure-density ratio with (Chevallier & Polarski, 2001; Linder, 2003)323232See, e.g., Shlivko & Steinhardt (2024) for consideration of time-evolving dark energy beyond the parametrization.
| (60) |
This is equivalent to a cosmological constant when setting today’s value of the equation of state to and its time dependence to . This expansion can then be used for explorations varying either only or both and , as we do below. Opening these degrees of freedom in the dark energy component causes strong degeneracies between parameters when using only CMB data and therefore we mostly report results for combinations with CMB lensing and external probes of the expansion history, including both BAO and SNIa. In particular, as shown in DESI Collaboration (2025b) in fits to models with additional degrees of freedom in the dark energy equation of state, SNIa are essential to break degeneracies with and the matter density. We do not expect significant improvements from the new ACT power spectra for late-time dark energy, but we report constraints here given interest in this model following the DESI Year-1 results.
When is free to vary as a single-parameter extension to (without time dependence — — and imposing a flat prior )333333To get theory predictions for this model we use camb with the Parametrized Post-Friedmann approach (Fang et al., 2008) to compute dark energy perturbations (dark_energy_model=DarkEnergyPPF)., we obtain the contours shown in Fig. 1 for P-ACT-LB. Adding also SNIa data, we find
| (61) |
in good agreement with the expectation, and with the same error bar as previous measurements using CMB from Planck (, DESI Collaboration, 2025b).
When we expand the model further, with both and varying (with a flat prior ), we find
| (62) |
with marginalized posteriors shown in Fig. 37. We see a moderate preference for the model over , similar to what was reported in DESI Collaboration (2025b) using CMB data from Planck (, ).343434Quantitatively, comparing the MAP CDM and models, we find () for P-ACT-LBS, while DESI Collaboration (2025b) find () for Planck-LBS. This result is driven partially by the DESI data and partially by the SNIa data. Substituting the BAO dataset with BOSS BAO, the posteriors are consistent with the cosmological constant scenario. The specific CMB dataset used for this analysis has essentially no impact: Planck alone, P-ACT, or W-ACT yield similar results.
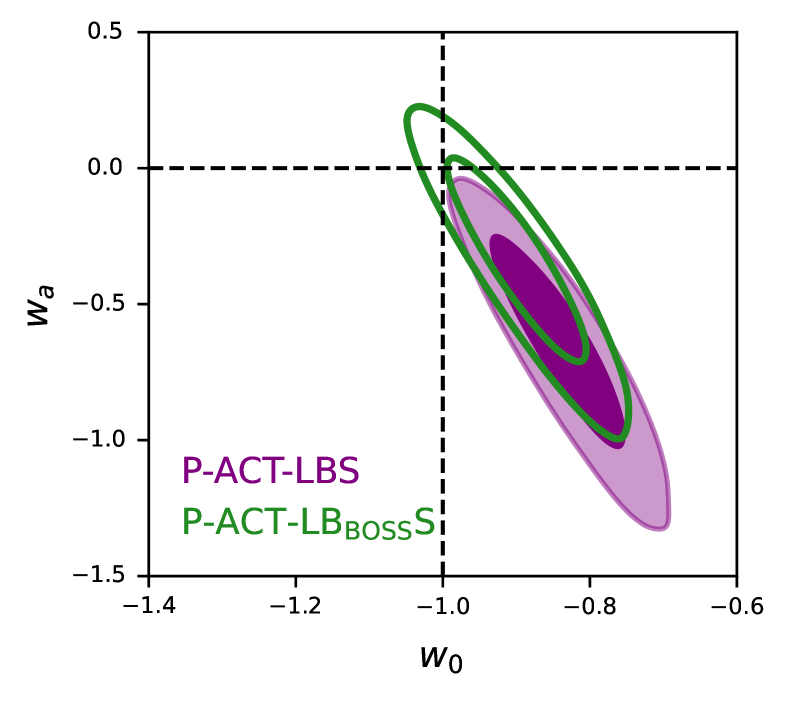
7.3 Interacting DE-DM
An extension of CDM with kinetic interactions between the DM and DE fluids was initially considered in Simpson (2010). This model introduces a coupling constant, , describing pure momentum transfer between the DM and DE. This coupling leaves the homogeneous background cosmological evolution unchanged, but alters the dark sector perturbation evolution equations as follows (Simpson, 2010):
| (63) | ||||
| (64) | ||||
| (65) | ||||
| (66) |
where is the DE equation of state, is the energy density contrast, is the velocity divergence, , is the conformal Hubble factor (), is the Newtonian gravitational potential, and ′ denotes differentiation with respect to conformal time.
This type of interaction leads to slower structure growth, and this idea was revisited in Poulin et al. (2023a) as a potential way to reduce the value of inferred from CMB and LSS data. The coupling strength needed to appreciably reduce is around (where is the critical density). While previous work assumed linear theory, Laguë et al. (2024) developed a halo-model approach to characterize the behavior of DM with non-zero on semi-linear scales. This model is an adapted version of HMcode (still assuming dark matter only) and accounts for changes in halo formation resulting from DE-DM interactions using modified fitting functions for the critical and virial overdensities. A combination of CMB lensing from ACT DR6 and Planck, BAO from SDSS/BOSS, and CMB primary anisotropy measurements from Planck constrains the contribution of at the 95% CL using this prescription (Laguë et al., 2024).
Here, we enlarge the dataset to include the new ACT DR6 primary CMB power spectra, and we replace the BAO likelihood with that of DESI.353535We note here that the interacting DE-DM model is the only case in this paper for which we use the extended setting for the ACT DR6 + Planck CMB lensing data. To constrain , we make use of the full CMB lensing likelihood up to (Madhavacheril et al., 2024; Qu et al., 2024b). We study two configurations for this model. We first fix the dark energy equation of state to three different values of , allowing to vary (the model is thus a two-parameter extension of CDM with only one additional degree of freedom). We avoid due to a divergence that arises in Eq. (66) in this case. We then also jointly sample both parameters, but we find that Metropolis-Hastings sampling performs poorly when varying both and . This occurs because can take a very wide range of values when goes to .363636In this case, due to the computational expense in this model, we stop the chains at a Gelman-Rubin statistic of ; thus, slight variations in the final bounds are expected. We adopt a flat prior . We compute theoretical predictions for this scenario using the modified version of class from Laguë et al. (2024).373737https://github.com/fmccarthy/Class_DMDE
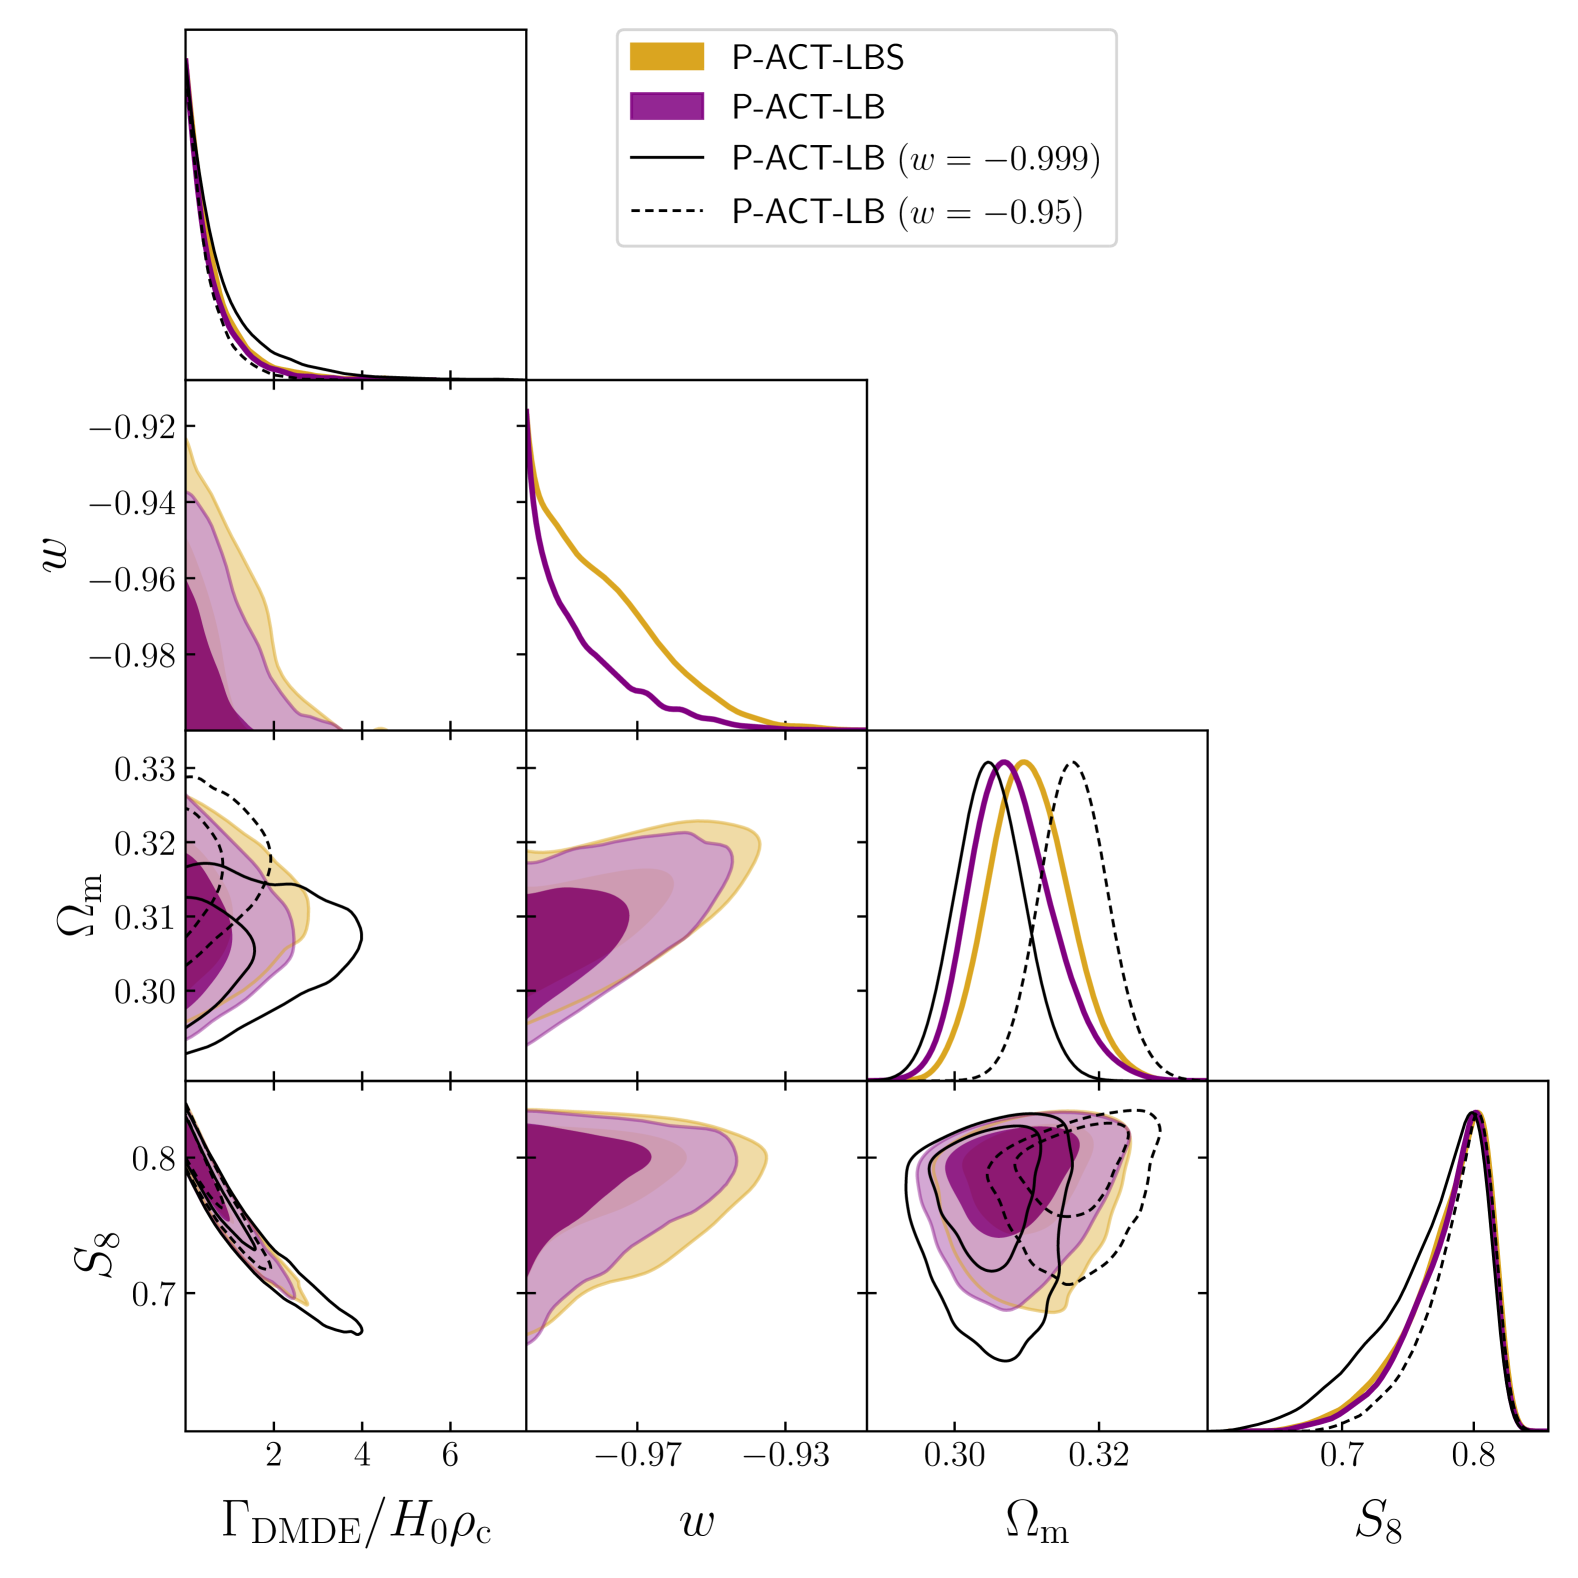
We show the parameter posterior distributions for a subset of the runs in Fig. 38. Given the large degeneracies present in this model when using only CMB data, we focus on results for the data combinations P-ACT-LB and P-ACT-LBS. For fixed values of , we find that the limit on gets tighter moving away from the boundary: , , and (all at 95% CL from P-ACT-LB). Similarly, the limit gets tighter, with the low-end tail of the distribution being more excluded (see Fig. 38). When varying and simultaneously, we find
| (67) |
and when including SNIa data from Pantheon+
| (68) |
We also perform the same analyses with BOSS BAO data used in place of DESI, finding similar constraints on (with error bars -% larger) and somewhat weaker bounds on (roughly -% larger upper limits). We see no preference for this model over CDM for any dataset combination considered here, with the best-fit model lying at the edge of the parameter space (note that there are no projection effects in the Bayesian posteriors in the cases where we fix to specific values). The inclusion of the ACT DR6 and DESI data tightens the upper limit on by 33% compared to the bounds from Laguë et al. (2024) when varying both and using the P-ACT-LB dataset. The improvement in constraining power comes mainly from using the DESI BAO dataset instead of BOSS and the improved bounds on from the primary CMB in ACT DR6. The addition of SNIa data from Pantheon+ does not improve our bounds.
As observed in previous work, the coupling between the DM and DE leads to reduced values of , significantly broadening the marginalized posterior for this parameter. When approaches unity, the effects of the coupling are delayed to lower redshifts. This makes CMB lensing, which is sensitive to redshifts around , less constraining for this model. For this reason, we find a more extended posterior for when is near , as shown in Fig. 38. In general, we find that this model allows values of from P-ACT-LB that are consistent with values found in galaxy weak lensing surveys, but we caution that a joint analysis with such datasets would require a full model for the nonlinear matter power spectrum in this scenario.
7.4 Modified gravity
The growth rate of large-scale structure , where is the linear growth factor and is the scale factor, can be accurately approximated in the matter- or dark energy-dominated eras as
| (69) |
where is the growth index, which takes a canonical value of 0.55 in general relativity (GR) with a flat CDM cosmology (Fry, 1985; Wang & Steinhardt, 1998; Linder, 2005). This simple model with values of differing from 0.55 is part of a broader class of modified gravity theories, which generically predict modifications to the growth of structure. Various studies have considered and constrained different prescriptions for the growth and geometry (e.g., Wang et al., 2007; Guzzo et al., 2008; Dossett et al., 2010; Hudson & Turnbull, 2012; Rapetti et al., 2013; Pouri et al., 2014; Ruiz & Huterer, 2015; Bernal et al., 2016; Johnson et al., 2016; Alam et al., 2016; Moresco & Marulli, 2017; Basilakos & Anagnostopoulos, 2020; DES Collaboration, 2021; Garc´ıa-Garc´ıa et al., 2021; Ruiz-Zapatero et al., 2021, 2022; White et al., 2022; Andrade et al., 2021; Chen et al., 2022b; DES Collaboration, 2023). Some studies have found evidence for suppression of the growth of structure, while others have not. One of the most sensitive datasets for such theories is the combination (the product of and ) which is constrained by various redshift-space distortion (RSD) and peculiar velocity surveys. RSD surveys measure the growth rate of structure via the imprint of peculiar velocities on the quadrupole of redshift-space galaxy clustering measurements (e.g., Kaiser, 1987; Hamilton, 1998; Percival & White, 2009; Song & Percival, 2009). Surveys of the peculiar velocities of individual galaxies can be performed at low-to-moderate redshifts, when an estimate of the absolute distance to each galaxy is available (e.g., from Cepheid, TRGB, or SNIa observations), thus allowing the cosmological contribution to the observed redshift to be isolated from the peculiar-velocity contribution (e.g., Miller & Branch, 1992; Riess et al., 1998; Turnbull et al., 2012; Tully et al., 2016; Stahl et al., 2021). CMB data also contribute constraining power via lensing effects (e.g., Calabrese et al., 2009).
A recent analysis by Nguyen et al. (2023) found moderate evidence of a potential deviation from the GR prediction for . They considered measurements of peculiar velocities from Boruah et al. (2020), Huterer et al. (2017), Turner et al. (2022), and Said et al. (2020), and measurements of RSD from Beutler et al. (2012), Howlett et al. (2015), Blake et al. (2012), Blake et al. (2013), Pezzotta et al. (2017), Alam et al. (2021), and Okumura et al. (2016). Combining these with data from Planck, they found evidence for suppression of the growth of structure at significance, with . This suppression both significantly reduced and eliminated Planck’s (mild) preference for positive spatial curvature.
Here, we study the impact of including the new ACT DR6 spectra on these results, following the approach of Nguyen et al. (2023). Since Eq. (69) is only valid for sub-horizon perturbations, this approach leaves the unlensed primary CMB perturbations unchanged, but modifies the CMB lensing potential and other late-time observables self-consistently. We use all measurements considered by Nguyen et al. (2023) to form a likelihood, consisting of a simple Gaussian likelihood for each survey’s constraint on . DESI also recently released measurements (DESI Collaboration, 2024b) which we do not include here to facilitate comparison with Nguyen et al. (2023), but we discuss them in §8.1. In combination with ACT and other datasets, we use the likelihood to constrain the growth index as a single-parameter extension to CDM, varied with a uniform prior . To perform the theoretical calculations, we use the modified version of camb released by Nguyen et al. (2023).383838https://github.com/MinhMPA/CAMB_GammaPrime_Growth
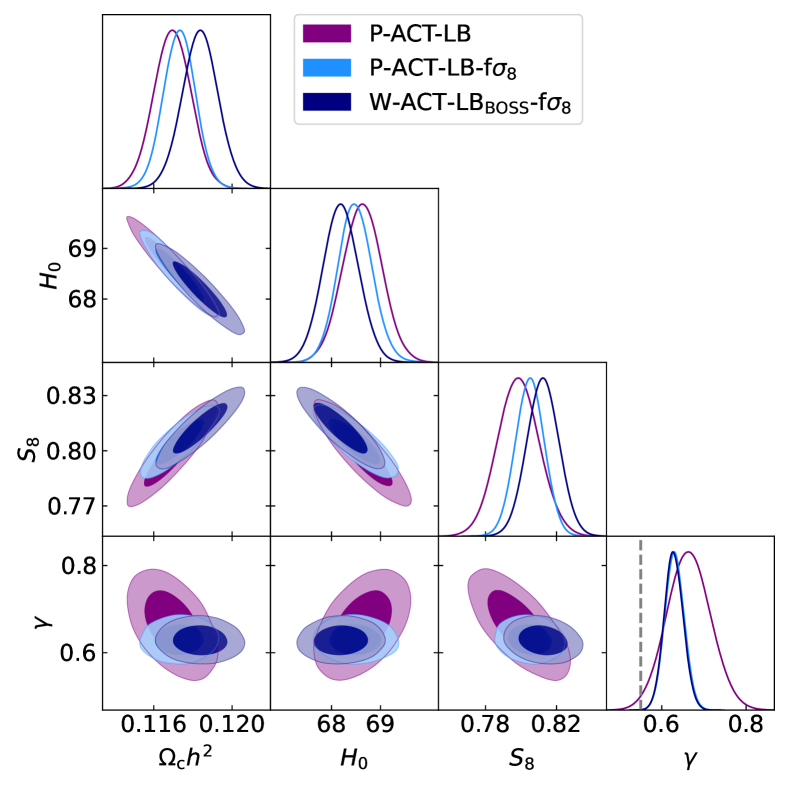
With the new DR6 spectra, we find the growth index to be , with . Combining with Planck, these limits tighten significantly, yielding and . Further adding CMB lensing and DESI BAO data, we obtain
| (70) |
This value of lies above the GR prediction, but is nevertheless consistent with it (as shown in Fig. 39). When replacing the DESI BAO data with BOSS BAO data, we obtain and , which is consistent with the P-ACT-LB result but moves closer to the GR expectation. Including now the measurements, we obtain393939We note that when including measurements, for the BOSS likelihood we use a likelihood that combines BAO and RSD data from BOSS DR12 and eBOSS DR16, as described in eBOSS Collaboration (2021). When we refer to P-ACT-LB-f or W-ACT-LB-f, this is the BOSS likelihood that is used.
| (71) |
Replacing DESI BAO data with BOSS has minimal impact, giving and (68%, P-ACT-LB-f). The central values of in these constraints deviate from GR at . The data driving this result are those from RSD and peculiar velocity surveys, but the central values are consistent with those found in our analyses without these data.
Note that values of can improve concordance between CMB-derived and LSS-derived constraints on , compared to those in . For example, our P-ACT result in the modified-growth model () is lower than that in (, L25). We do not run constraints using non-CMB data on their own, but Nguyen et al. (2023) find that the combination of , DES-Y1 32-point, and pre-DESI BAO data yields in this model. This agrees with the P-ACT result at , whereas in , the same comparison is discrepant at . The moderate tension is reduced in the modified-growth model both by shifts in the central values and small increases in the error bars.
The effects of varying on the lensed CMB power spectrum are similar to those from the phenomenological lensing amplitude parameter, (Nguyen et al., 2023), for which Planck has a moderate preference for a value (Planck Collaboration, 2020c). To assess whether it is the Planck behavior driving the evidence for a high growth index, we swap in WMAP for Planck data. For the CMB-only combination, we find and . Adding CMB lensing, BOSS BAO, and the data yields
| (72) |
still finding a deviation from the GR value of . This shows that the current evidence for a non-standard growth index is not driven by Planck’s preference for a high CMB lensing amplitude or by DESI BAO data. The precision on this result is driven strongly by the data. We discuss in more detail how this dataset compares with in §8.1. Any preference for this model appears to be largely driven by the data (in fact, by just two of these data points) rather than the ACT data or other CMB data, as discussed further in §8.1.
8 Consistency with low-redshift data and impact on cosmological concordance
8.1 consistency with low-redshift observations
Given our findings that no model is significantly preferred over , we confirm the consistency of our baseline model (described in L25) with the main low-redshift datasets used here in combination with P-ACT. The agreement between the predictions of the best-fit P-ACT model and direct measurements of the CMB lensing power spectrum, BAO distances, and SNIa distances provides a powerful consistency test of the cosmological model and justifies our joint inclusion of these datasets in and extended model fits.
In Fig. 40, we show predictions for the two main datasets we combine with: ACT DR6+Planck NPIPE CMB lensing and DESI BAO. We find that the P-ACT best-fit model predicts these observations well, and slightly improves the agreement with the DESI data, compared to that seen for the model determined by Planck alone. The same figure also shows the combined P-ACT-LB fit to all datasets, including residuals and the probability to exceed (PTE) for CMB lensing and BAO.404040The three models give very similar PTEs for CMB lensing — 34.7%, 35.3%, 35.3% for Planck, P-ACT, and P-ACT-LB, respectively — which round to the same number when reporting only two significant figures. We find here and in L25 that the jointly-derived model is a good fit to all datasets. The residuals and best-fit PTE for Planck and ACT primary CMB power spectra are discussed in L25.
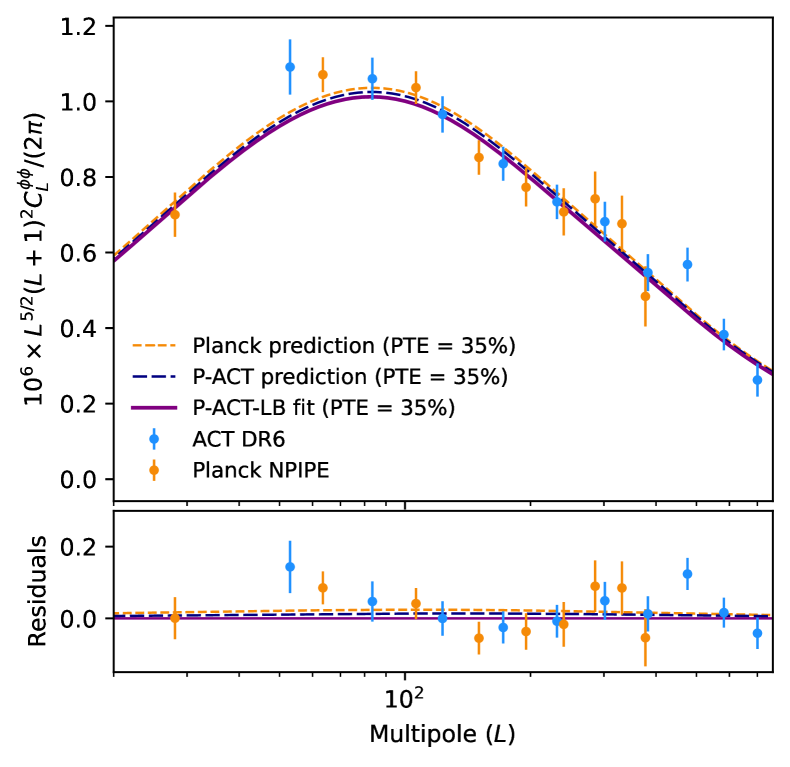
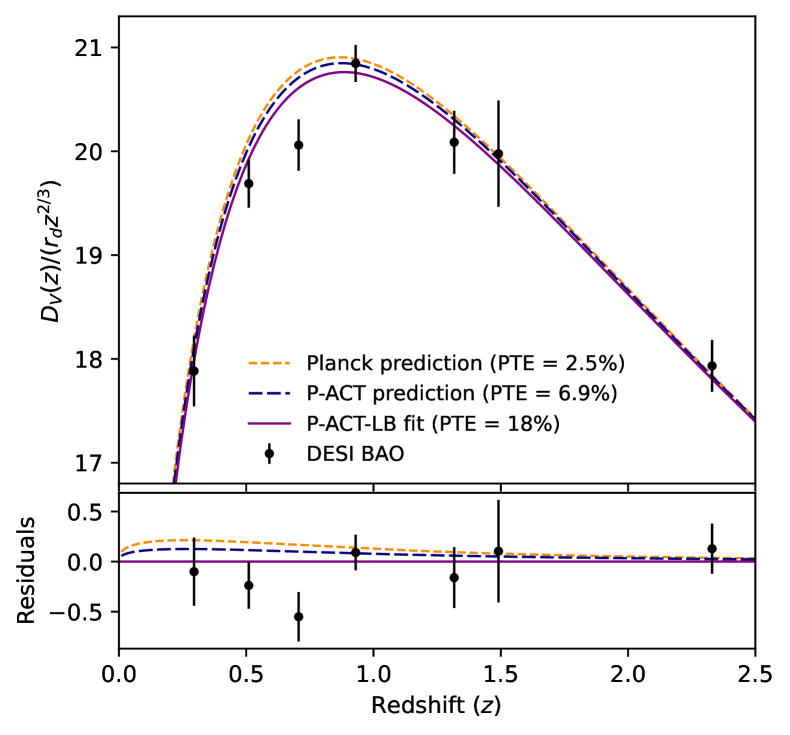
Figure 41 shows the equivalent comparison for the Pantheon+ SNIa compilation. We show the usual Hubble diagram of the distance modulus (corrected apparent magnitude) of all SNIa in the compilation as a function of redshift, and compare it with predictions from the CMB and the joint best-fit model. Differently from Brout et al. (2022), we do not normalize the distance modulus using the SH0ES calibration. Instead, we separately obtain and correct for the absolute magnitude calibration from the Planck and P-ACT cosmology. The fit of the joint P-ACT-S dataset marginalizes over this calibration while sampling the cosmological parameters. We find that all solutions are in good agreement with the whole sample, recovering maximum-likelihood values similar to those reported in the Pantheon+ public chains.
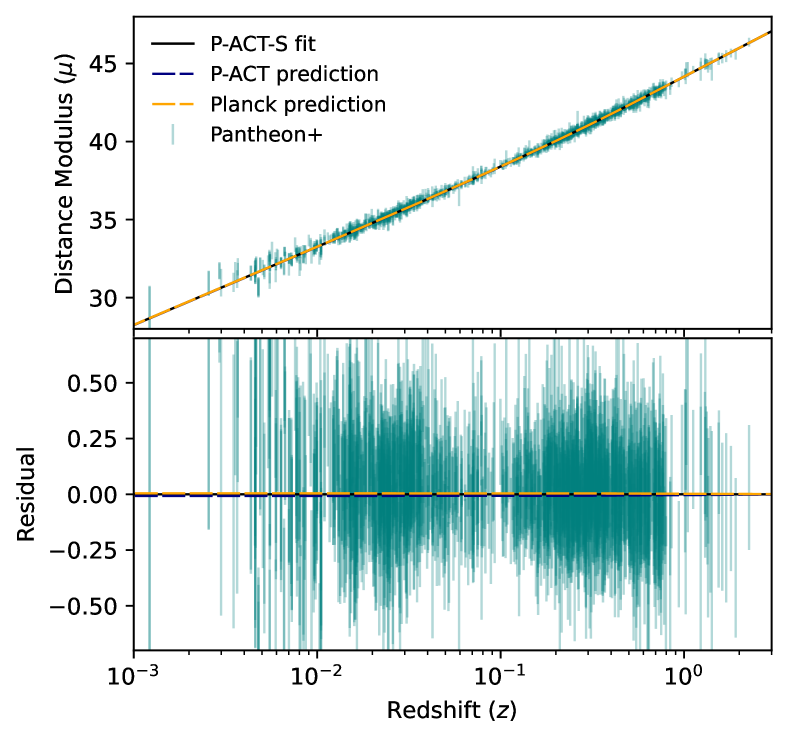
Figure 42 shows the data used in the likelihood from §7.4, compared with the theoretical predictions in for from the 68% CL constraints for P-ACT and W-ACT (L25). It appears that the hint of deviation from found in §7.4 is driven by low- points in the dataset that have small error bars and lie below the CMB expectation for . To assess the difference between the CMB-predicted and the data points from RSD and peculiar velocity surveys, we compute the between them, finding with respect to the P-ACT prediction and with respect to the W-ACT prediction, both for 20 degrees of freedom, indicating some discordance (note, however, that these values do not propagate the theoretical uncertainty on the CMB predictions). These values decrease significantly if we omit two of the low- peculiar velocity data points that have the lowest values. These points are at redshifts (from Turner et al., 2022, with ) and (from Said et al., 2020 with ). Omitting these points, we find for the P-ACT prediction and for W-ACT, both for 18 degrees of freedom, illustrating no tension. Because of the significant reduction that results from removing the lowest two redshift points, we conclude that deviations from CDM when including data in §7.4 are largely driven by those points. In theory, one could redo the analysis omitting those points from the likelihood. However, we do not perform this exercise here since it is not the ACT DR6 data driving these deviations.
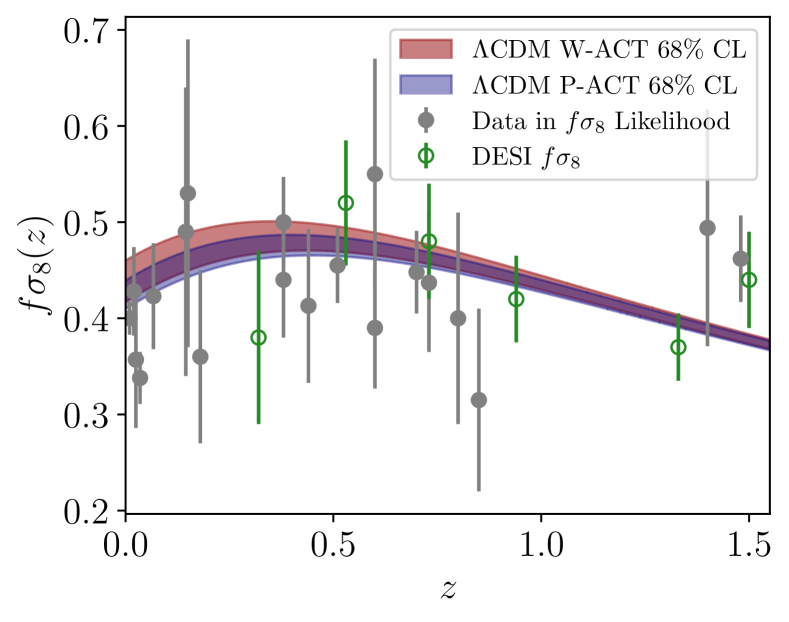
Figure 42 also shows recent measurements from DESI (DESI Collaboration, 2024b), though these points are not used in our joint likelihood analysis. Assuming a diagonal covariance matrix, we find that the DESI measurements have with respect to the P-ACT prediction and with respect to the W-ACT prediction, both for 6 degrees of freedom. Thus, the DESI RSD data are in good agreement with CDM, further suggesting that the two outlying points at very low- are not indicative of new physics.
8.2 Cosmological concordance
Many of the models studied in this paper impact the value of the Hubble constant inferred from the primary CMB power spectra, and the precision of the measurement changes because of parameter degeneracies in these scenarios. In some cases, such as in models with variations in the particle physics content and/or particle interactions, the degeneracies are due to changes in the ingredients of the universe affecting the expansion history at early times. In other cases, for example for the early dark energy model, the physics prior to or at recombination is changed significantly to reduce the sound horizon and this increases the Hubble constant at the expense of additional degrees of freedom in the cosmological model correlating with . While no robust detection of any of these extended models has been made in previous CMB or LSS data, some of these models have previously had non-negligible success in shifting the CMB-derived value toward the local distance ladder estimate from SH0ES. In this work, we have shown that this is generally no longer the case when including the new ACT data. ACT DR6 contributes to limiting the allowed region of parameter space to km/s/Mpc within all of the models studied here. This range is calculated as the minimum and maximum value at 68% CL of all the P-ACT-LB and P-ACT-LBS results (whichever yields higher precision) from all models explored in this work; the neutrino self-interaction result from §6.1.2 sets the lower end of the allowed range and the early dark energy result from §5.1 sets the upper end. This range of values is in agreement with the CCHP measurement (Freedman et al., 2024), but lies below the latest SH0ES measurement (Breuval et al., 2024).
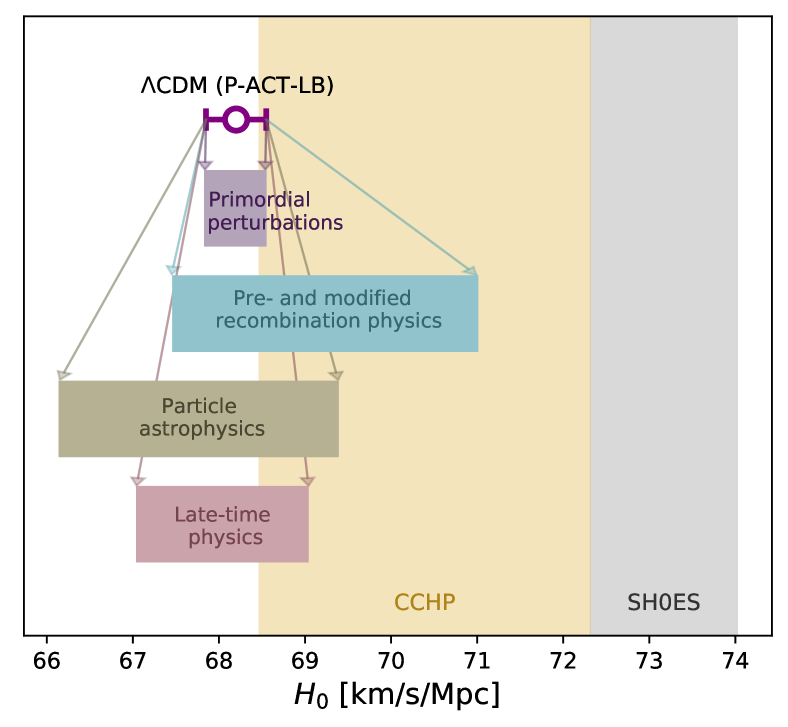
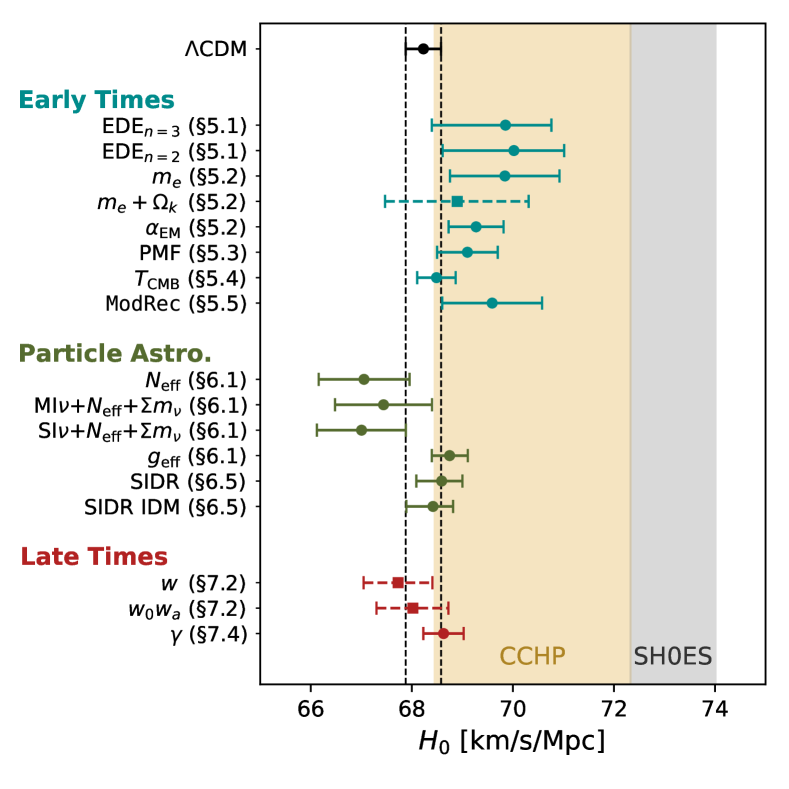
These results are summarized in Fig. 43. Figure 44 provides more details on the full suite of constraints for the three classes of models that have a non-negligible impact on . Figure 45 breaks this result further down into the specific behavior of versus key model parameters in many extended models of interest, and shows that both the CMB-only dataset, P-ACT, and its combination with CMB lensing and BAO, P-ACT-LB, are inconsistent with the SH0ES estimate. Because of correlations with the inferred value of the total matter density ,414141Note that the primary CMB most directly constrains a degenerate combination of and , roughly , with the exact value of the exponent depending on the range of angular scales measured, due to the different physical effects at play (e.g., Percival et al., 2002; Kable et al., 2019). BAO data play an important role in determining the central value of in many extended models. Notably, as shown in many of the analyses in §5–§7, using BOSS BAO instead of DESI data reduces the central value of by 1–1.5 km/s/Mpc — hence moving constraints in the opposite direction of SH0ES — while only slightly increasing the error bars. Upcoming DESI data will be instrumental in further clarifying this situation.
From a more model-independent perspective, the consistency of the inferred physical matter density from Planck and ACT (as well as their combination; L25) within provides a strong indication that the model accurately describes physics just prior to recombination. As noted in Knox & Millea (2020), the shape of the radiation-driving envelope in the CMB power spectra is directly tied to the physics operating around matter-radiation equality. If new physics were present at this epoch, a generic expectation is that -based inferences of should exhibit deviations when inferred on different angular scale ranges, due to different scales probing at different times via radiation driving. We see no such evidence of such deviations in (L25), thus providing a strong validation of the physics of in this important redshift range.
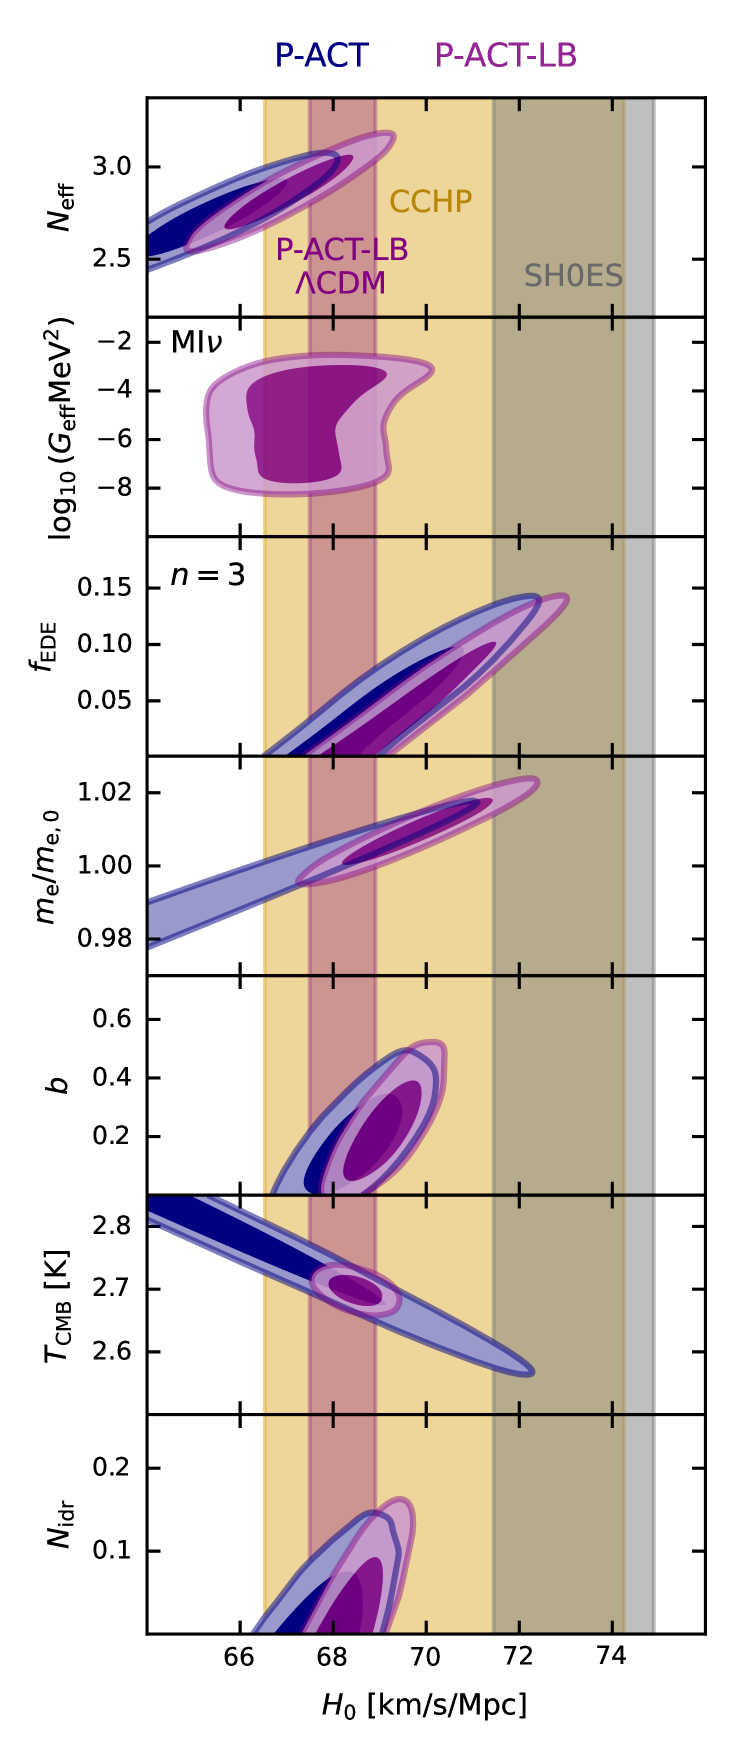
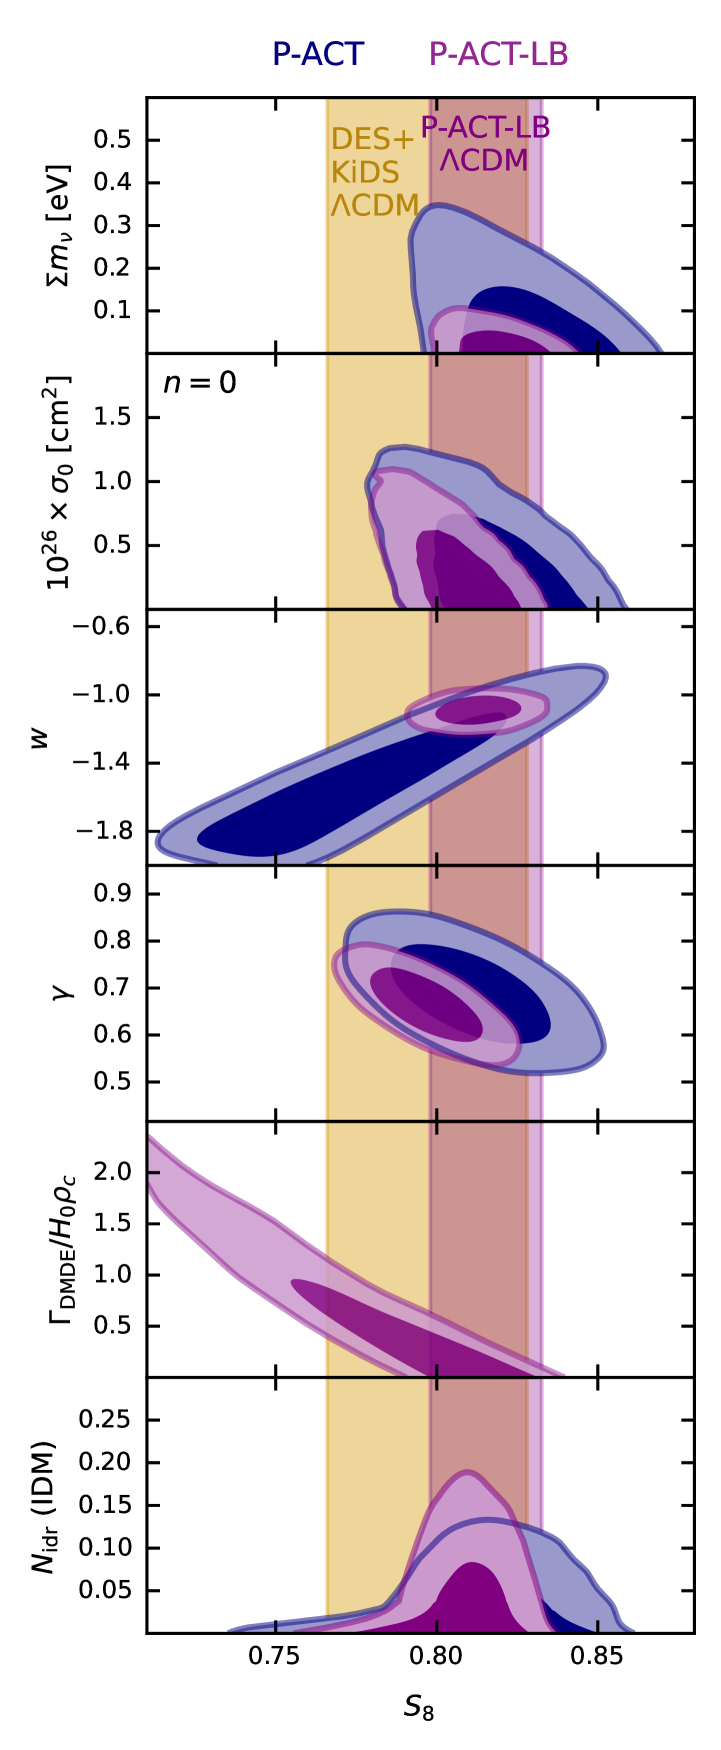
We also find that models that alter the growth of structure are not preferred by our data. In particular, we do not find evidence in any extended model for a significant shift in the CMB-inferred value toward lower late-universe estimates, for example from cosmic shear surveys, as summarized in Fig. 46. Our results generally lie on the upper end of the limits from DES+KiDS (Dark Energy Survey and Kilo-Degree Survey Collaboration, 2023), although it is important to note that the value in is already consistent between P-ACT-LB and this result. Also in this case the matter density inferred via DESI BAO will contribute to the location of the maximum-likelihood point. For all models tested, using BOSS instead of DESI BAO data yields qualitatively similar conclusions. In addition, it is important to note that the inference of itself from galaxy weak lensing or other late-time data will generally change in the presence of the new physics shown in these models (e.g., non-GR values of or non-zero ), and thus one should take the comparison shown here with a grain of salt. For a high-precision comparison, constraints from late-time data should be self-consistently derived in these extended models, which we leave to future, dedicated analyses.
9 Summary
In this paper, we have used a state-of-the-art CMB primary anisotropy dataset built from new ACT DR6 power spectra combined with large-scale data from the Planck satellite to set constraints on a large suite of extended cosmological models, both testing foundational assumptions made in the standard model and constraining more complex scenarios. We show that the new ACT DR6 data have reached a level of precision competitive with that of Planck for the primary CMB contribution to the constraints, and because of the complementarity of the two datasets — particularly at in TT and on essentially all scales measured by ACT in TE and EE — their joint analysis yields significant gains over the sensitivity of Planck alone. We further include ACT and Planck CMB lensing data, BAO data from DESI and SNIa from Pantheon+ to obtain the tightest limits to date on many fundamental physics parameters and cosmological models. To validate the results, we also explore combinations replacing Planck with WMAP large-scale CMB data, and DESI with BAO data from BOSS.
Key takeaways from this work include:
-
•
We test predictions for the early-universe inflationary epoch, verifying the near-scale-invariance and adiabaticity of the primordial scalar perturbations, and restricting the parameter space for inflation models;
-
•
We tightly bound the presence of early dark energy, or primordial magnetic fields that would impact the pre-recombination period, as well as variations in fundamental constants or in the monopole temperature of the CMB or the standard recombination history;
-
•
We measure the properties of neutrinos and find no evidence for new light, relativistic species that are free-streaming, no evidence for non-zero neutrino masses, and no evidence for neutrino self-interactions. We also set limits on primordial helium and deuterium abundances that are consistent with standard BBN predictions and with astrophysical measurements;
-
•
Dark matter is consistent with the standard collisionless CDM assumption, with no evidence for annihilation or interactions with baryons. We also limit the contribution to DM from ultralight axion-like particles to be no more than 5% at axion masses of eV;
-
•
We find no evidence for interactions in the dark sector, either within a single dark radiation component, between dark radiation and dark matter components, or between dark matter and dark energy;
-
•
Dark energy and late-time gravity generally behave as expected in the standard model ( and ), although we find a moderate hint for time-evolving dark energy with P-ACT-LBS, consistent with (and driven by the BAO and SNIa data from) DESI Collaboration (2025b). Upcoming BAO and SNIa data are expected to clarify the robustness of this hint.
Assessing the preference for each extended model over via the marginalized posterior for the extended-model parameter (in the case of 1D extensions) or via comparison of the MAP model to that in (in the case of multi-parameter extensions), we find that no extended model is preferred over . This conclusion includes a wide range of extended models constructed with the aim of increasing the value of the Hubble constant or decreasing the amplitude of density fluctuations inferred from the primary CMB. With these results providing stringent tests in new observational regimes, the footing of the standard model of cosmology is further solidified.
This work paves the way for further, higher-precision tests of the cosmological model in the coming decade with even more sensitive CMB polarization data, including that expected from the Simons Observatory (Simons Observatory Collaboration, 2019; Abitbol et al., 2025), CMB-S4 (CMB-S4 Collaboration, 2016; Abazajian et al., 2019), LiteBIRD (LiteBIRD Collaboration et al., 2023), and other experiments. The noise levels of these surveys will push nearly an order of magnitude below those of ACT DR6 over the next 10-15 years, enabling precise searches for new physics, including not only the models studied in this work, but also new scenarios yet to be constructed.
ACKNOWLEDGEMENTS
We are grateful to Julien Lesgourgues for assistance in providing the version of class used throughout this work, to Antony Lewis for useful exchanges regarding camb, and to Alessio Spurio Mancini for help with CosmoPower. We also thank Jens Chluba and Yacine Ali-Haimoud for useful correspondence regarding CosmoRec and HyRec, and we thank Gabriel Lynch for useful correspondence regarding the Modified Recombination scenario, Henrique Rubira for useful correspondence regarding the IDR-IDM scenario, and Minh Nguyen for useful correspondence regarding the modified-growth-index scenario.
Support for ACT was through the U.S. National Science Foundation through awards AST-0408698, AST-0965625, and AST-1440226 for the ACT project, as well as awards PHY-0355328, PHY-0855887 and PHY-1214379. Funding was also provided by Princeton University, the University of Pennsylvania, and a Canada Foundation for Innovation (CFI) award to UBC. ACT operated in the Parque Astronómico Atacama in northern Chile under the auspices of the Agencia Nacional de Investigación y Desarrollo (ANID). The development of multichroic detectors and lenses was supported by NASA grants NNX13AE56G and NNX14AB58G. Detector research at NIST was supported by the NIST Innovations in Measurement Science program. Computing for ACT was performed using the Princeton Research Computing resources at Princeton University and the Niagara supercomputer at the SciNet HPC Consortium. SciNet is funded by the CFI under the auspices of Compute Canada, the Government of Ontario, the Ontario Research Fund–Research Excellence, and the University of Toronto. This research also used resources of the National Energy Research Scientific Computing Center (NERSC), a U.S. Department of Energy Office of Science User Facility located at Lawrence Berkeley National Laboratory, operated under Contract No. DE-AC02-05CH11231 using NERSC award HEP-ERCAPmp107 from 2021 to 2025. We thank the Republic of Chile for hosting ACT in the northern Atacama, and the local indigenous Licanantay communities whom we follow in observing and learning from the night sky.
Some cosmological analyses were performed on the Hawk high-performance computing cluster at the Advanced Research Computing at Cardiff (ARCCA). We made extensive use of computational resources at the University of Oxford Department of Physics, funded by the John Fell Oxford University Press Research Fund.
We are grateful to the NASA LAMBDA archive for hosting our data. This work uses data from the Planck satellite, based on observations obtained with Planck (http://www.esa.int/Planck), an ESA science mission with instruments and contributions directly funded by ESA Member States, NASA, and Canada. We acknowledge work done by the Simons Observatory collaboration in developing open-source software used in this paper.
IAC acknowledges support from Fundación Mauricio y Carlota Botton and the Cambridge International Trust. SA, MH and DNS acknowledge the support of the Simons Foundation. ZA and JD acknowledge support from NSF grant AST-2108126. EC, IH and HJ acknowledge support from the Horizon 2020 ERC Starting Grant (Grant agreement No 849169). OD acknowledges support from a SNSF Eccellenza Professorial Fellowship (No. 186879). JD acknowledges support from a Royal Society Wolfson Visiting Fellowship and from the Kavli Institute for Cosmology Cambridge and the Institute of Astronomy, Cambridge. RD and CS acknowledge support from the Agencia Nacional de Investigación y Desarrollo (ANID) through Basal project FB210003. RD acknowledges support from ANID-QUIMAL 240004 and FONDEF ID21I10236. SG acknowledges support from STFC and UKRI (grant numbers ST/W002892/1 and ST/X006360/1). SJG acknowledges support from NSF grant AST-2307727 and acknowledges the Texas Advanced Computing Center (TACC) at the University of Texas at Austin for providing computational resources that have contributed to the research results reported within this paper. V.G. acknowledges the support from NASA through the Astrophysics Theory Program, Award Number 21-ATP21-0135, the National Science Foundation (NSF) CAREER Grant No. PHY2239205, and from the Research Corporation for Science Advancement under the Cottrell Scholar Program.This research was carried out in part at the Jet Propulsion Laboratory, California Institute of Technology, under a contract with the National Aeronautics and Space Administration (80NM0018D0004). JCH acknowledges support from NSF grant AST-2108536, the Sloan Foundation, and the Simons Foundation, and thanks the Scientific Computing Core staff at the Flatiron Institute for computational support. MHi acknowledges support from the National Research Foundation of South Africa (grant no. 137975). ADH acknowledges support from the Sutton Family Chair in Science, Christianity and Cultures, from the Faculty of Arts and Science, University of Toronto, and from the Natural Sciences and Engineering Research Council of Canada (NSERC) [RGPIN-2023-05014, DGECR-2023- 00180]. JPH (George A. and Margaret M. Downsbrough Professor of Astrophysics) acknowledges the Downsbrough heirs and the estate of George Atha Downsbrough for their support. JK, MM and KPS acknowledge support from NSF grants AST-2307727 and AST-2153201. ALP acknowledges support from a Science and Technology Facilities Council (STFC) Consolidated Grant (ST/W000903/1). ML acknowledges that IFAE is partially funded by the CERCA program of the Generalitat de Catalunya. SN acknowledges a grant from the Simons Foundation (CCA 918271, PBL). TN thanks support from JSPS KAKENHI Grant No. JP20H05859, No. JP22K03682, and World Premier International Research Center Initiative (WPI Initiative), MEXT, Japan. FN acknowledges funding from the European Union (ERC, POLOCALC, 101096035). LP acknowledges support from the Wilkinson and Misrahi Funds. KKR is supported by an Ernest Rutherford Fellowship from the UKRI Science and Technology Facilities Council (grant number ST/Z510191/1). NS acknowledges support from DOE award number DE-SC0025309. KMS acknowledges support from the NSF Graduate Research Fellowship Program under Grant No. DGE 2036197, and acknowledges the use of computing resources from Columbia University’s Shared Research Computing Facility project, which is supported by NIH Research Facility Improvement Grant 1G20RR030893-01, and associated funds from the New York State Empire State Development, Division of Science Technology and Innovation (NYSTAR) Contract C090171, both awarded April 15, 2010. NB, MG, ML and LP acknowledge the financial support from the INFN InDark initiative and from the COSMOS network through the ASI (Italian Space Agency) Grants 2016-24-H.0 and 2016-24-H.1-2018. NB, MG and ML are funded by the European Union (ERC, RELiCS, project number 101116027). MG acknowledges support from the PRIN (Progetti di ricerca di Rilevante Interesse Nazionale) number 2022WJ9J33.
We gratefully acknowledge the many publicly available software packages that were essential for parts of this analysis. They include: camb (Lewis et al., 2000), class (Blas et al., 2011; Lesgourgues, 2011), CosmoPower (Spurio Mancini et al., 2022), HyRec (Ali-Ha¨ımoud & Hirata, 2011), CosmoRec (Chluba et al., 2010), HMcode (Mead et al., 2021), PRIMAT (Pitrou et al., 2018), Cobaya (Torrado & Lewis, 2021), PROSPECT (Brinch Holm et al., 2024), GetDist (Lewis, 2019), numpy (Harris et al., 2020), and matplotlib (Hunter, 2007).
References
- Abazajian et al. (2019) Abazajian, K., et al. 2019, arXiv:1907.04473, arXiv e-prints, arXiv:1907.04473, CMB-S4 Science Case, Reference Design, and Project Plan
- Abazajian et al. (2012) Abazajian, K. N., et al. 2012, arXiv:1204.5379, arXiv e-prints, arXiv:1204.5379, Light Sterile Neutrinos: A White Paper
- Abazajian et al. (2015) —. 2015, arXiv:1309.5383, Astroparticle Physics, 63, 66, Neutrino physics from the cosmic microwave background and large scale structure
- Abellán et al. (2022) Abellán, G. F., Chacko, Z., Dev, A., Du, P., Poulin, V., & Tsai, Y. 2022, arXiv:2112.13862, Journal of High Energy Physics, 2022, 76, Improved cosmological constraints on the neutrino mass and lifetime
- Abitbol et al. (2025) Abitbol, M., et al. 2025, arXiv:2503.00636, arXiv e-prints, arXiv:2503.00636, The Simons Observatory: Science Goals and Forecasts for the Enhanced Large Aperture Telescope
- Abolfathi et al. (2018) Abolfathi, B., et al. 2018, arXiv:1707.09322, ApJS, 235, 42, The Fourteenth Data Release of the Sloan Digital Sky Survey: First Spectroscopic Data from the Extended Baryon Oscillation Spectroscopic Survey and from the Second Phase of the Apache Point Observatory Galactic Evolution Experiment
- Ade et al. (2021) Ade, P. A. R., et al. 2021, arXiv:2110.00483, Phys. Rev. Lett., 127, 151301, Improved Constraints on Primordial Gravitational Waves using Planck, WMAP, and BICEP/Keck Observations through the 2018 Observing Season
- Agrawal et al. (2023) Agrawal, P., Cyr-Racine, F.-Y., Pinner, D., & Randall, L. 2023, arXiv:1904.01016, Phys. Dark Univ., 42, 101347, Rock ‘n’ roll solutions to the Hubble tension
- Aich et al. (2013) Aich, M., Hazra, D. K., Sriramkumar, L., & Souradeep, T. 2013, arXiv:1106.2798, Phys. Rev. D, 87, 083526, Oscillations in the inflaton potential: Complete numerical treatment and comparison with the recent and forthcoming CMB datasets
- Aiola et al. (2020) Aiola, S., et al. 2020, arXiv:2007.07288, J. Cosmology Astropart. Phys, 2020, 047, The Atacama Cosmology Telescope: DR4 maps and cosmological parameters
- Akerib et al. (2022) Akerib, D. S., et al. 2022, arXiv:2203.08084, Snowmass2021 Cosmic Frontier Dark Matter Direct Detection to the Neutrino Fog
- Akita & Yamaguchi (2020) Akita, K. & Yamaguchi, M. 2020, arXiv:2005.07047, J. Cosmology Astropart. Phys, 2020, 012, A precision calculation of relic neutrino decoupling
- Alam et al. (2016) Alam, S., Ho, S., & Silvestri, A. 2016, arXiv:1509.05034, Mon. Not. Roy. Astron. Soc., 456, 3743, Testing deviations from CDM with growth rate measurements from six large-scale structure surveys at 0.06–1
- Alam et al. (2017) Alam, S., et al. 2017, arXiv:1607.03155, MNRAS, 470, 2617, The clustering of galaxies in the completed SDSS-III Baryon Oscillation Spectroscopic Survey: cosmological analysis of the DR12 galaxy sample
- Alam et al. (2021) —. 2021, arXiv:2007.08991, Phys. Rev. D, 103, 083533, Completed SDSS-IV extended Baryon Oscillation Spectroscopic Survey: Cosmological implications from two decades of spectroscopic surveys at the Apache Point Observatory
- Albrecht & Steinhardt (1982) Albrecht, A. & Steinhardt, P. J. 1982, Phys. Rev. Lett., 48, 1220, Cosmology for Grand Unified Theories with Radiatively Induced Symmetry Breaking, https://link.aps.org/doi/10.1103/PhysRevLett.48.1220
- Ali-Ha¨ımoud & Hirata (2011) Ali-Haïmoud, Y. & Hirata, C. M. 2011, arXiv:1011.3758, Phys. Rev. D, 83, 043513, HyRec: A fast and highly accurate primordial hydrogen and helium recombination code
- Allali et al. (2024) Allali, I. J., Notari, A., & Rompineve, F. 2024, arXiv:2404.15220, arXiv e-prints, arXiv:2404.15220, Dark Radiation with Baryon Acoustic Oscillations from DESI 2024 and the tension
- Aloni et al. (2022) Aloni, D., Berlin, A., Joseph, M., Schmaltz, M., & Weiner, N. 2022, arXiv:2111.00014, Phys. Rev. D, 105, 123516, A Step in understanding the Hubble tension
- Alvey et al. (2022a) Alvey, J., Escudero, M., & Sabti, N. 2022a, arXiv:2111.12726, J. Cosmology Astropart. Phys, 2022, 037, What can CMB observations tell us about the neutrino distribution function?
- Alvey et al. (2022b) Alvey, J., Escudero, M., Sabti, N., & Schwetz, T. 2022b, arXiv:2111.14870, Phys. Rev. D, 105, 063501, Cosmic neutrino background detection in large-neutrino-mass cosmologies
- Amendola & Barbieri (2006) Amendola, L. & Barbieri, R. 2006, hep-ph/0509257, Physics Letters B, 642, 192, Dark matter from an ultra-light pseudo-Goldsone-boson
- Amon et al. (2022) Amon, A., et al. 2022, arXiv:2105.13543, Phys. Rev. D, 105, 023514, Dark Energy Survey Year 3 results: Cosmology from cosmic shear and robustness to data calibration
- An et al. (2022) An, R., Gluscevic, V., Calabrese, E., & Hill, J. C. 2022, arXiv:2202.03515, J. Cosmology Astropart. Phys, 2022, 002, What does cosmology tell us about the mass of thermal-relic dark matter?
- Andrade et al. (2021) Andrade, U., Anbajagane, D., von Marttens, R., Huterer, D., & Alcaniz, J. 2021, arXiv:2107.07538, JCAP, 11, 014, A test of the standard cosmological model with geometry and growth
- Archidiacono & Hannestad (2014) Archidiacono, M. & Hannestad, S. 2014, arXiv:1311.3873, JCAP, 07, 046, Updated constraints on non-standard neutrino interactions from Planck
- Archidiacono et al. (2019) Archidiacono, M., Hooper, D. C., Murgia, R., Bohr, S., Lesgourgues, J., & Viel, M. 2019, arXiv:1907.01496, J. Cosmology Astropart. Phys, 2019, 055, Constraining Dark Matter-Dark Radiation interactions with CMB, BAO, and Lyman-
- Arvanitaki et al. (2010) Arvanitaki, A., Dimopoulos, S., Dubovsky, S., Kaloper, N., & March-Russell, J. 2010, arXiv:0905.4720, Phys. Rev. D, 81, 123530, String Axiverse
- Asgari et al. (2021) Asgari, M., et al. 2021, arXiv:2007.15633, A&A, 645, A104, KiDS-1000 cosmology: Cosmic shear constraints and comparison between two point statistics
- Atkins et al. (2023) Atkins, Z., et al. 2023, arXiv:2303.04180, J. Cosmology Astropart. Phys, 2023, 073, The Atacama Cosmology Telescope: map-based noise simulations for DR6
- Atkins et al. (2024) —. 2024, arXiv:2412.07068, arXiv e-prints, arXiv:2412.07068, The Atacama Cosmology Telescope: Semi-Analytic Covariance Matrices for the DR6 CMB Power Spectra, https://ui.adsabs.harvard.edu/abs/2024arXiv241207068A
- Audren et al. (2013) Audren, B., Lesgourgues, J., Benabed, K., & Prunet, S. 2013, arXiv:1210.7183, J. Cosmology Astropart. Phys, 2013, 001, Conservative constraints on early cosmology with MONTE PYTHON
- Avelino et al. (2000) Avelino, P. P., Martins, C. J. A. P., Rocha, G., & Viana, P. 2000, astro-ph/0008446, Phys. Rev. D, 62, 123508, Looking for a varying in the cosmic microwave background
- Avelino et al. (2001) Avelino, P. P., et al. 2001, astro-ph/0102144, Phys. Rev. D, 64, 103505, Early-universe constraints on a time-varying fine structure constant
- Aver et al. (2022) Aver, E., Berg, D. A., Hirschauer, A. S., Olive, K. A., Pogge, R. W., Rogers, N. S. J., Salzer, J. J., & Skillman, E. D. 2022, arXiv:2109.00178, MNRAS, 510, 373, A comprehensive chemical abundance analysis of the extremely metal poor Leoncino Dwarf galaxy (AGC 198691)
- Aver et al. (2021) Aver, E., Berg, D. A., Olive, K. A., Pogge, R. W., Salzer, J. J., & Skillman, E. D. 2021, arXiv:2010.04180, J. Cosmology Astropart. Phys, 2021, 027, Improving helium abundance determinations with Leo P as a case study
- Axenides et al. (1983) Axenides, M., Brandenberger, R. H., & Turner, M. S. 1983, Phys. Lett. B, 126, 178, Development of Axion Perturbations in an Axion Dominated Universe
- Balashev et al. (2016) Balashev, S. A., Zavarygin, E. O., Ivanchik, A. V., Telikova, K. N., & Varshalovich, D. A. 2016, arXiv:1511.01797, MNRAS, 458, 2188, The primordial deuterium abundance: subDLA system at zabs = 2.437 towards the QSO J 1444+2919
- Balkenhol et al. (2021) Balkenhol, L. et al. 2021, arXiv:2103.13618, Phys. Rev. D, 104, 083509, Constraints on CDM extensions from the SPT-3G 2018 EE and TE power spectra
- Balkenhol et al. (2023) Balkenhol, L., et al. 2023, arXiv:2212.05642, Phys. Rev. D, 108, 023510, Measurement of the CMB temperature power spectrum and constraints on cosmology from the SPT-3G 2018 TT, TE, and EE dataset
- Barbieri et al. (2025) Barbieri, N., Brinckmann, T., Gariazzo, S., Lattanzi, M., Pastor, S., & Pisanti, O. 2025, arXiv:2501.01369, Current constraints on cosmological scenarios with very low reheating temperatures
- Barenboim et al. (2021) Barenboim, G., Chen, J. Z., Hannestad, S., Oldengott, I. M., Tram, T., & Wong, Y. Y. Y. 2021, arXiv:2011.01502, J. Cosmology Astropart. Phys, 2021, 087, Invisible neutrino decay in precision cosmology
- Barenboim et al. (2019) Barenboim, G., Denton, P. B., & Oldengott, I. M. 2019, arXiv:1903.02036, Phys. Rev. D, 99, 083515, Constraints on inflation with an extended neutrino sector
- Bartolo & Liddle (2002) Bartolo, N. & Liddle, A. R. 2002, astro-ph/0203076, Phys. Rev. D, 65, 121301, The Simplest curvaton model
- Baryakhtar et al. (2024) Baryakhtar, M., Simon, O., & Weiner, Z. J. 2024, arXiv:2405.10358, Phys. Rev. D, 110, 083505, Cosmology with varying fundamental constants from hyperlight, coupled scalars
- Bashinsky & Seljak (2004) Bashinsky, S. & Seljak, U. 2004, astro-ph/0310198, Phys. Rev. D, 69, 083002, Signatures of relativistic neutrinos in CMB anisotropy and matter clustering
- Basilakos & Anagnostopoulos (2020) Basilakos, S. & Anagnostopoulos, F. K. 2020, arXiv:1903.10758, Eur. Phys. J. C, 80, 212, Growth index of matter perturbations in the light of Dark Energy Survey
- Bassett & Hlozek (2010) Bassett, B. & Hlozek, R. 2010, in Dark Energy: Observational and Theoretical Approaches, ed. P. Ruiz-Lapuente, 246
- Battaglieri et al. (2017) Battaglieri, M., et al. 2017, arXiv:1707.04591, US Cosmic Visions: New Ideas in Dark Matter 2017: Community Report
- Battye et al. (2001) Battye, R. A., Crittenden, R., & Weller, J. 2001, astro-ph/0008265, Phys. Rev. D, 63, 043505, Cosmic concordance and the fine structure constant
- Baumann et al. (2016a) Baumann, D., Green, D., Meyers, J., & Wallisch, B. 2016a, arXiv:1508.06342, J. Cosmology Astropart. Phys, 2016, 007, Phases of new physics in the CMB
- Baumann et al. (2016b) Baumann, D., Green, D., & Wallisch, B. 2016b, arXiv:1604.08614, Phys. Rev. Lett., 117, 171301, New Target for Cosmic Axion Searches
- Bean et al. (2006) Bean, R., Dunkley, J., & Pierpaoli, E. 2006, astro-ph/0606685, Phys. Rev. D, 74, 063503, Constraining isocurvature initial conditions with WMAP 3-year data
- Becker et al. (2021) Becker, N., Hooper, D. C., Kahlhoefer, F., Lesgourgues, J., & Schöneberg, N. 2021, Journal of Cosmology and Astroparticle Physics, 2021, 019, Cosmological constraints on multi-interacting dark matter, https://doi.org/10.1088%2F1475-7516%2F2021%2F02%2F019
- Beltran et al. (2007) Beltran, M., Garcia-Bellido, J., & Lesgourgues, J. 2007, hep-ph/0606107, Phys. Rev. D, 75, 103507, Isocurvature bounds on axions revisited
- Bennett et al. (2013) Bennett, C. L., et al. 2013, arXiv:1212.5225, ApJS, 208, 20, Nine-year Wilkinson Microwave Anisotropy Probe (WMAP) Observations: Final Maps and Results
- Bennett et al. (2021) Bennett, J. J., Buldgen, G., de Salas, P. F., Drewes, M., Gariazzo, S., Pastor, S., & Wong, Y. Y. Y. 2021, arXiv:2012.02726, J. Cosmology Astropart. Phys, 2021, 073, Towards a precision calculation of the effective number of neutrinos Neff in the Standard Model. Part II. Neutrino decoupling in the presence of flavour oscillations and finite-temperature QED
- Beringue et al. (in prep) Beringue, B., Surrao, K., Hill, J. C., et al. in prep
- Bernal et al. (2016) Bernal, J. L., Verde, L., & Cuesta, A. J. 2016, arXiv:1511.03049, JCAP, 02, 059, Parameter splitting in dark energy: is dark energy the same in the background and in the cosmic structures?
- Beutler et al. (2011) Beutler, F., et al. 2011, arXiv:1106.3366, MNRAS, 416, 3017, The 6dF Galaxy Survey: baryon acoustic oscillations and the local Hubble constant
- Beutler et al. (2012) —. 2012, arXiv:1204.4725, MNRAS, 423, 3430, The 6dF Galaxy Survey: z 0 measurements of the growth rate and 8
- Bianchini & Fabbian (2022) Bianchini, F. & Fabbian, G. 2022, arXiv:2206.02762, Phys. Rev. D, 106, 063527, CMB spectral distortions revisited: A new take on distortions and primordial non-Gaussianities from FIRAS data
- Bianchini et al. (2020) Bianchini, F., et al. 2020, arXiv:1910.07157, ApJ, 888, 119, Constraints on Cosmological Parameters from the 500 deg2 SPTPOL Lensing Power Spectrum
- Blake et al. (2012) Blake, C., et al. 2012, arXiv:1204.3674, MNRAS, 425, 405, The WiggleZ Dark Energy Survey: joint measurements of the expansion and growth history at z ¡ 1
- Blake et al. (2013) Blake, C. et al. 2013, arXiv:1309.5556, Mon. Not. Roy. Astron. Soc., 436, 3089, Galaxy And Mass Assembly (GAMA): improved cosmic growth measurements using multiple tracers of large-scale structure
- Blas et al. (2011) Blas, D., Lesgourgues, J., & Tram, T. 2011, arXiv:1104.2933, J. Cosmology Astropart. Phys, 2011, 034, The Cosmic Linear Anisotropy Solving System (CLASS). Part II: Approximation schemes
- Blinov et al. (2019) Blinov, N., Kelly, K. J., Krnjaic, G. Z., & McDermott, S. D. 2019, arXiv:1905.02727, Phys. Rev. Lett., 123, 191102, Constraining the Self-Interacting Neutrino Interpretation of the Hubble Tension
- Blum et al. (2018) Blum, K., Nir, Y., & Shavit, M. 2018, arXiv:1802.08019, Phys. Lett. B, 785, 354, Neutrinoless double-beta decay with massive scalar emission
- Boddy & Gluscevic (2018) Boddy, K. K. & Gluscevic, V. 2018, Physical Review D, 98, First cosmological constraint on the effective theory of dark matter-proton interactions, https://doi.org/10.1103%2Fphysrevd.98.083510
- Boddy et al. (2018) Boddy, K. K., Gluscevic, V., Poulin, V., Kovetz, E. D., Kamionkowski, M., & Barkana, R. 2018, Phys. Rev. D, 98, 123506, Critical assessment of CMB limits on dark matter-baryon scattering: New treatment of the relative bulk velocity, https://link.aps.org/doi/10.1103/PhysRevD.98.123506
- Boehm & Schaeffer (2005) Boehm, C. & Schaeffer, R. 2005, Astronomy & Astrophysics, 438, 419, Constraints on Dark Matter interactions from structure formation: damping lengths, https://doi.org/10.1051%2F0004-6361%3A20042238
- Bolliet et al. (2024) Bolliet, B., Spurio Mancini, A., Hill, J. C., Madhavacheril, M., Jense, H. T., Calabrese, E., & Dunkley, J. 2024, arXiv:2303.01591, MNRAS, 531, 1351, High-accuracy emulators for observables in CDM, Neff, mν, and w cosmologies
- Borsanyi et al. (2016) Borsanyi, S., et al. 2016, arXiv:1606.07494, arXiv e-prints, arXiv:1606.07494, Lattice QCD for Cosmology
- Boruah et al. (2020) Boruah, S. S., Hudson, M. J., & Lavaux, G. 2020, arXiv:1912.09383, Mon. Not. Roy. Astron. Soc., 498, 2703, Cosmic flows in the nearby Universe: new peculiar velocities from SNe and cosmological constraints
- Breuval et al. (2024) Breuval, L., et al. 2024, arXiv:2404.08038, Astrophys. J., 973, 30, Small Magellanic Cloud Cepheids Observed with the Hubble Space Telescope Provide a New Anchor for the SH0ES Distance Ladder
- Bridle et al. (2003) Bridle, S. L., Lewis, A. M., Weller, J., & Efstathiou, G. 2003, astro-ph/0302306, MNRAS, 342, L72, Reconstructing the primordial power spectrum
- Brinch Holm et al. (2024) Brinch Holm, E., Nygaard, A., Dakin, J., Hannestad, S., & Tram, T. 2024, arXiv:2312.02972, MNRAS, 535, 3686, PROSPECT: a profile likelihood code for frequentist cosmological parameter inference
- Brinckmann et al. (2021) Brinckmann, T., Chang, J. H., & LoVerde, M. 2021, arXiv:2012.11830, Phys. Rev. D, 104, 063523, Self-interacting neutrinos, the Hubble parameter tension, and the cosmic microwave background
- Brout et al. (2022) Brout, D., et al. 2022, arXiv:2202.04077, ApJ, 938, 110, The Pantheon+ Analysis: Cosmological Constraints
- Brust et al. (2013) Brust, C., Kaplan, D. E., & Walters, M. T. 2013, arXiv:1303.5379, Journal of High Energy Physics, 2013, 58, New light species and the CMB
- Bucher et al. (2004) Bucher, M., Dunkley, J., Ferreira, P. G., Moodley, K., & Skordis, C. 2004, astro-ph/0401417, Phys. Rev. Lett., 93, 081301, Initial Conditions of the Universe: How Much Isocurvature is Allowed?
- Bucher et al. (2000) Bucher, M., Moodley, K., & Turok, N. 2000, astro-ph/9904231, Phys. Rev. D, 62, 083508, The General primordial cosmic perturbation
- Buen-Abad et al. (2023) Buen-Abad, M. A., Chacko, Z., Kilic, C., Marques-Tavares, G., & Youn, T. 2023, arXiv:2208.05984, Journal of High Energy Physics, 2023, 12, Stepped partially acoustic dark matter, large scale structure, and the Hubble tension
- Buen-Abad et al. (2022) Buen-Abad, M. A., Essig, R., McKeen, D., & Zhong, Y.-M. 2022, Physics Reports, 961, 1, Cosmological constraints on dark matter interactions with ordinary matter, https://doi.org/10.1016%2Fj.physrep.2022.02.006
- Buen-Abad et al. (2015) Buen-Abad, M. A., Marques-Tavares, G., & Schmaltz, M. 2015, arXiv:1505.03542, Phys. Rev. D, 92, 023531, Non-Abelian dark matter and dark radiation
- Buen-Abad et al. (2018) Buen-Abad, M. A., Schmaltz, M., Lesgourgues, J., & Brinckmann, T. 2018, arXiv:1708.09406, J. Cosmology Astropart. Phys, 2018, 008, Interacting dark sector and precision cosmology
- Burns et al. (2024) Burns, A.-K., Tait, T. M. P., & Valli, M. 2024, arXiv:2307.07061, European Physical Journal C, 84, 86, PRyMordial: the first three minutes, within and beyond the standard model
- Cadamuro & Redondo (2012) Cadamuro, D. & Redondo, J. 2012, arXiv:1110.2895, JCAP, 02, 032, Cosmological bounds on pseudo Nambu-Goldstone bosons
- Cai & Guan (2022) Cai, H. & Guan, Y. 2022, arXiv:2111.14199, Phys. Rev. D, 105, 063536, Computing microwave background polarization power spectra from cosmic birefringence
- Calabrese et al. (2009) Calabrese, E., Cooray, A., Martinelli, M., Melchiorri, A., Pagano, L., Slosar, A., & Smoot, G. F. 2009, arXiv:0908.1585, Phys. Rev. D, 80, 103516, CMB lensing constraints on dark energy and modified gravity scenarios
- Calabrese et al. (2008) Calabrese, E., Slosar, A., Melchiorri, A., Smoot, G. F., & Zahn, O. 2008, arXiv:0803.2309, Phys. Rev. D, 77, 123531, Cosmic microwave weak lensing data as a test for the dark universe
- Carron et al. (2022) Carron, J., Mirmelstein, M., & Lewis, A. 2022, arXiv:2206.07773, J. Cosmology Astropart. Phys, 2022, 039, CMB lensing from Planck PR4 maps
- Chabanier et al. (2019) Chabanier, S., Millea, M., & Palanque-Delabrouille, N. 2019, arXiv:1905.08103, MNRAS, 489, 2247, Matter power spectrum: from Ly forest to CMB scales
- Chacko et al. (2020) Chacko, Z., Dev, A., Du, P., Poulin, V., & Tsai, Y. 2020, arXiv:1909.05275, Journal of High Energy Physics, 2020, 20, Cosmological limits on the neutrino mass and lifetime
- Chacko et al. (2021) —. 2021, arXiv:2002.08401, Phys. Rev. D, 103, 043519, Determining the neutrino lifetime from cosmology
- Chen et al. (2022a) Chen, J. Z., Oldengott, I. M., Pierobon, G., & Wong, Y. Y. Y. 2022a, arXiv:2203.09075, Eur. Phys. J. C, 82, 640, Weaker yet again: mass spectrum-consistent cosmological constraints on the neutrino lifetime
- Chen et al. (2022b) Chen, S.-F., White, M., DeRose, J., & Kokron, N. 2022b, arXiv:2204.10392, JCAP, 07, 041, Cosmological analysis of three-dimensional BOSS galaxy clustering and Planck CMB lensing cross correlations via Lagrangian perturbation theory
- Chevallier & Polarski (2001) Chevallier, M. & Polarski, D. 2001, gr-qc/0009008, International Journal of Modern Physics D, 10, 213, Accelerating Universes with Scaling Dark Matter
- Chikashige et al. (1980) Chikashige, Y., Mohapatra, R. N., & Peccei, R. D. 1980, Phys. Rev. Lett., 45, 1926, Spontaneously Broken Lepton Number and Cosmological Constraints on the Neutrino Mass Spectrum
- Chikashige et al. (1981) —. 1981, Phys. Lett. B, 98, 265, Are There Real Goldstone Bosons Associated with Broken Lepton Number?
- Chluba (2014) Chluba, J. 2014, arXiv:1405.1277, MNRAS, 443, 1881, Tests of the CMB temperature-redshift relation, CMB spectral distortions and why adiabatic photon production is hard
- Chluba & Ali-Ha¨ımoud (2016) Chluba, J. & Ali-Haïmoud, Y. 2016, arXiv:1510.03877, MNRAS, 456, 3494, COSMOSPEC: fast and detailed computation of the cosmological recombination radiation from hydrogen and helium
- Chluba et al. (2012) Chluba, J., Fung, J., & Switzer, E. R. 2012, arXiv:1110.0247, MNRAS, 423, 3227, Radiative transfer effects during primordial helium recombination
- Chluba & Sunyaev (2012) Chluba, J. & Sunyaev, R. A. 2012, arXiv:1109.6552, MNRAS, 419, 1294, The evolution of CMB spectral distortions in the early Universe
- Chluba et al. (2010) Chluba, J., Vasil, G. M., & Dursi, L. J. 2010, arXiv:1003.4928, MNRAS, 407, 599, Recombinations to the Rydberg states of hydrogen and their effect during the cosmological recombination epoch
- Choi et al. (2020) Choi, S. K., et al. 2020, arXiv:2007.07289, J. Cosmology Astropart. Phys, 2020, 045, The Atacama Cosmology Telescope: a measurement of the Cosmic Microwave Background power spectra at 98 and 150 GHz
- Chou et al. (2025) Chou, T. L., et al. 2025, arXiv:2501.06890, arXiv e-prints, arXiv:2501.06890, Measurements of the Temperature and E-mode Polarization of the Cosmic Microwave Background from the Full 500-square-degree SPTpol Dataset
- CMB-S4 Collaboration (2016) CMB-S4 Collaboration. 2016, arXiv:1610.02743, arXiv e-prints, arXiv:1610.02743, CMB-S4 Science Book, First Edition
- Cooke et al. (2014) Cooke, R. J., Pettini, M., Jorgenson, R. A., Murphy, M. T., & Steidel, C. C. 2014, arXiv:1308.3240, ApJ, 781, 31, Precision Measures of the Primordial Abundance of Deuterium
- Cooke et al. (2016) Cooke, R. J., Pettini, M., Nollett, K. M., & Jorgenson, R. 2016, arXiv:1607.03900, ApJ, 830, 148, The Primordial Deuterium Abundance of the Most Metal-poor Damped Lyman- System
- Coulton et al. (2024) Coulton, W., et al. 2024, arXiv:2307.01258, Phys. Rev. D, 109, 063530, Atacama Cosmology Telescope: High-resolution component-separated maps across one third of the sky
- Cushman et al. (2013) Cushman, P., et al. 2013, Snowmass CF1 Summary: WIMP Dark Matter Direct Detection, https://arxiv.org/abs/1310.8327
- Cyr-Racine & Sigurdson (2014) Cyr-Racine, F.-Y. & Sigurdson, K. 2014, arXiv:1306.1536, Phys. Rev. D, 90, 123533, Limits on Neutrino-Neutrino Scattering in the Early Universe
- Cyr-Racine et al. (2016) Cyr-Racine, F.-Y., Sigurdson, K., Zavala, J., Bringmann, T., Vogelsberger, M., & Pfrommer, C. 2016, arXiv:1512.05344, Phys. Rev. D, 93, 123527, ETHOS—an effective theory of structure formation: From dark particle physics to the matter distribution of the Universe
- Dalal et al. (2023) Dalal, R., et al. 2023, arXiv:2304.00701, Phys. Rev. D, 108, 123519, Hyper Suprime-Cam Year 3 results: Cosmology from cosmic shear power spectra
- D’Amico et al. (2021) D’Amico, G., Senatore, L., Zhang, P., & Zheng, H. 2021, arXiv:2006.12420, JCAP, 05, 072, The Hubble Tension in Light of the Full-Shape Analysis of Large-Scale Structure Data
- Dark Energy Survey and Kilo-Degree Survey Collaboration (2023) Dark Energy Survey and Kilo-Degree Survey Collaboration. 2023, arXiv:2305.17173, The Open Journal of Astrophysics, 6, 36, DES Y3 + KiDS-1000: Consistent cosmology combining cosmic shear surveys
- Das & Ghosh (2021) Das, A. & Ghosh, S. 2021, arXiv:2011.12315, JCAP, 07, 038, Flavor-specific interaction favors strong neutrino self-coupling in the early universe
- Das et al. (2011) Das, S., et al. 2011, arXiv:1103.2124, Phys. Rev. Lett., 107, 021301, Detection of the Power Spectrum of Cosmic Microwave Background Lensing by the Atacama Cosmology Telescope
- Dawson et al. (2013) Dawson, K. S., et al. 2013, arXiv:1208.0022, AJ, 145, 10, The Baryon Oscillation Spectroscopic Survey of SDSS-III
- De Bernardis et al. (2008) De Bernardis, F., Pagano, L., & Melchiorri, A. 2008, Astropart. Phys., 30, 192, New constraints on the reheating temperature of the universe after WMAP-5
- de Putter et al. (2014) de Putter, R., Linder, E. V., & Mishra, A. 2014, arXiv:1401.7022, Phys. Rev. D, 89, 103502, Inflationary freedom and cosmological neutrino constraints
- de Salas et al. (2015) de Salas, P. F., Lattanzi, M., Mangano, G., Miele, G., Pastor, S., & Pisanti, O. 2015, arXiv:1511.00672, Phys. Rev. D, 92, 123534, Bounds on very low reheating scenarios after Planck
- Dentler et al. (2022) Dentler, M., Marsh, D. J. E., Hložek, R., Laguë, A., Rogers, K. K., & Grin, D. 2022, arXiv:2111.01199, MNRAS, 515, 5646, Fuzzy dark matter and the Dark Energy Survey Year 1 data
- DES Collaboration (2021) DES Collaboration. 2021, arXiv:2010.05924, Phys. Rev. D, 103, 023528, DES Y1 results: Splitting growth and geometry to test CDM
- DES Collaboration (2022) —. 2022, arXiv:2105.13549, Phys. Rev. D, 105, 023520, Dark Energy Survey Year 3 results: Cosmological constraints from galaxy clustering and weak lensing
- DES Collaboration (2023) —. 2023, arXiv:2207.05766, Phys. Rev. D, 107, 083504, Dark Energy Survey Year 3 results: Constraints on extensions to CDM with weak lensing and galaxy clustering
- DES Collaboration (2024) —. 2024, arXiv:2401.02929, ApJ, 973, L14, The Dark Energy Survey: Cosmology Results with 1500 New High-redshift Type Ia Supernovae Using the Full 5 yr Data Set
- DESI Collaboration (2024a) DESI Collaboration. 2024a, arXiv:2404.03000, arXiv e-prints, arXiv:2404.03000, DESI 2024 III: Baryon Acoustic Oscillations from Galaxies and Quasars
- DESI Collaboration (2024b) —. 2024b, arXiv:2411.12021, arXiv e-prints, arXiv:2411.12021, DESI 2024 V: Full-Shape Galaxy Clustering from Galaxies and Quasars
- DESI Collaboration (2024c) —. 2024c, arXiv:2411.12022, arXiv e-prints, arXiv:2411.12022, DESI 2024 VII: Cosmological Constraints from the Full-Shape Modeling of Clustering Measurements
- DESI Collaboration (2025a) —. 2025a, arXiv:2404.03001, J. Cosmology Astropart. Phys, 2025, 124, DESI 2024 IV: Baryon Acoustic Oscillations from the Lyman alpha forest
- DESI Collaboration (2025b) —. 2025b, arXiv:2404.03002, J. Cosmology Astropart. Phys, 2025, 021, DESI 2024 VI: cosmological constraints from the measurements of baryon acoustic oscillations
- Dossett et al. (2010) Dossett, J., Ishak, M., Moldenhauer, J., Gong, Y., Wang, A., & Gong, Y. 2010, arXiv:1004.3086, JCAP, 04, 022, Constraints on growth index parameters from current and future observations
- Drewes et al. (2024) Drewes, M., Georis, Y., Klasen, M., Wiggering, L. P., & Wong, Y. Y. Y. 2024, arXiv:2402.18481, J. Cosmology Astropart. Phys, 2024, 032, Towards a precision calculation of N eff in the Standard Model. Part III. Improved estimate of NLO contributions to the collision integral
- Duffy & van Bibber (2009) Duffy, L. D. & van Bibber, K. 2009, arXiv:0904.3346, New J. Phys., 11, 105008, Axions as Dark Matter Particles
- Duivenvoorden et al. (in prep) Duivenvoorden, A. et al. in prep
- Dunkley et al. (2011) Dunkley, J., et al. 2011, arXiv:1009.0866, ApJ, 739, 52, The Atacama Cosmology Telescope: Cosmological Parameters from the 2008 Power Spectrum
- Dvali & Funcke (2016) Dvali, G. & Funcke, L. 2016, arXiv:1602.03191, Phys. Rev. D, 93, 113002, Small neutrino masses from gravitational -term
- Dvorkin et al. (2014) Dvorkin, C., Blum, K., & Kamionkowski, M. 2014, Phys. Rev. D, 89, 023519, Constraining dark matter-baryon scattering with linear cosmology, https://link.aps.org/doi/10.1103/PhysRevD.89.023519
- Dvorkin et al. (2019) Dvorkin, C., et al. 2019, arXiv:1903.03689, BAAS, 51, 64, Neutrino Mass from Cosmology: Probing Physics Beyond the Standard Model
- eBOSS Collaboration (2018) eBOSS Collaboration. 2018, arXiv:1705.06373, Mon. Not. Roy. Astron. Soc., 473, 4773, The clustering of the SDSS-IV extended Baryon Oscillation Spectroscopic Survey DR14 quasar sample: first measurement of baryon acoustic oscillations between redshift 0.8 and 2.2
- eBOSS Collaboration (2021) —. 2021, arXiv:2007.08991, Phys. Rev. D, 103, 083533, Completed SDSS-IV extended Baryon Oscillation Spectroscopic Survey: Cosmological implications from two decades of spectroscopic surveys at the Apache Point Observatory
- Efstathiou et al. (2024) Efstathiou, G., Rosenberg, E., & Poulin, V. 2024, arXiv:2311.00524, Phys. Rev. Lett., 132, 221002, Improved Planck Constraints on Axionlike Early Dark Energy as a Resolution of the Hubble Tension
- Eisenstein (2005) Eisenstein, D. 2005, New Astronomy Reviews, 49, 360, wide-Field Imaging from Space, Dark energy and cosmic sound, https://www.sciencedirect.com/science/article/pii/S1387647305000850
- Eisenstein & DESI Collaboration (2015) Eisenstein, D. & DESI Collaboration. 2015, in American Astronomical Society Meeting Abstracts, Vol. 225, American Astronomical Society Meeting Abstracts #225, 336.05
- Eisenstein et al. (2005) Eisenstein, D. J., et al. 2005, astro-ph/0501171, ApJ, 633, 560, Detection of the Baryon Acoustic Peak in the Large-Scale Correlation Function of SDSS Luminous Red Galaxies
- Enqvist et al. (2000) Enqvist, K., Kurki-Suonio, H., & Valiviita, J. 2000, astro-ph/0006429, Phys. Rev. D, 62, 103003, Limits on isocurvature fluctuations from boomerang and MAXIMA
- Enqvist et al. (2002) —. 2002, astro-ph/0108422, Phys. Rev. D, 65, 043002, Open and closed CDM isocurvature models contrasted with the CMB data
- Escudero & Abazajian (2025) Escudero, H. G. & Abazajian, K. N. 2025, arXiv:2412.05451, Phys. Rev. D, 111, 043520, Status of neutrino cosmology: Standard CDM, extensions, and tensions
- Essig et al. (2013) Essig, R., et al. 2013, arXiv:1311.0029, arXiv e-prints, arXiv:1311.0029, Dark Sectors and New, Light, Weakly-Coupled Particles
- Fang et al. (2008) Fang, W., Hu, W., & Lewis, A. 2008, arXiv:0808.3125, Phys. Rev. D, 78, 087303, Crossing the phantom divide with parametrized post-Friedmann dark energy
- Fernández et al. (2019) Fernández, V., Terlevich, E., Díaz, A. I., & Terlevich, R. 2019, arXiv:1905.09215, MNRAS, 487, 3221, A Bayesian direct method implementation to fit emission line spectra: application to the primordial He abundance determination
- Fields (2011) Fields, B. D. 2011, arXiv:1203.3551, Annual Review of Nuclear and Particle Science, 61, 47, The Primordial Lithium Problem
- Finkbeiner et al. (2012) Finkbeiner, D. P., Galli, S., Lin, T., & Slatyer, T. R. 2012, Physical Review D, 85, Searching for dark matter in the CMB: A compact parametrization of energy injection from new physics, http://dx.doi.org/10.1103/PhysRevD.85.043522
- Fixsen (2009) Fixsen, D. J. 2009, arXiv:0911.1955, ApJ, 707, 916, The Temperature of the Cosmic Microwave Background
- Fixsen et al. (1996) Fixsen, D. J., Cheng, E. S., Gales, J. M., Mather, J. C., Shafer, R. A., & Wright, E. L. 1996, astro-ph/9605054, ApJ, 473, 576, The Cosmic Microwave Background Spectrum from the Full COBE FIRAS Data Set
- Forastieri et al. (2015) Forastieri, F., Lattanzi, M., & Natoli, P. 2015, arXiv:1504.04999, JCAP, 07, 014, Constraints on secret neutrino interactions after Planck
- Forastieri et al. (2019) —. 2019, arXiv:1904.07810, Phys. Rev. D, 100, 103526, Cosmological constraints on neutrino self-interactions with a light mediator
- Freedman & Madore (2023) Freedman, W. L. & Madore, B. F. 2023, arXiv:2309.05618, J. Cosmology Astropart. Phys, 2023, 050, Progress in direct measurements of the Hubble constant
- Freedman et al. (2024) Freedman, W. L., Madore, B. F., Jang, I. S., Hoyt, T. J., Lee, A. J., & Owens, K. A. 2024, arXiv:2408.06153, arXiv e-prints, arXiv:2408.06153, Status Report on the Chicago-Carnegie Hubble Program (CCHP): Measurement of the Hubble Constant Using the Hubble and James Webb Space Telescope
- Freedman et al. (2020) Freedman, W. L., et al. 2020, arXiv:2002.01550, ApJ, 891, 57, Calibration of the Tip of the Red Giant Branch
- Froustey et al. (2020) Froustey, J., Pitrou, C., & Volpe, M. C. 2020, arXiv:2008.01074, J. Cosmology Astropart. Phys, 2020, 015, Neutrino decoupling including flavour oscillations and primordial nucleosynthesis
- Fry (1985) Fry, J. 1985, Physics Letters B, 158, 211, Dynamical measures of density in exotic cosmologies
- Galli et al. (2022) Galli, S., Pogosian, L., Jedamzik, K., & Balkenhol, L. 2022, arXiv:2109.03816, Phys. Rev. D, 105, 023513, Consistency of Planck, ACT, and SPT constraints on magnetically assisted recombination and forecasts for future experiments
- Garcia-Bellido & Wands (1996) Garcia-Bellido, J. & Wands, D. 1996, astro-ph/9511029, Phys. Rev. D, 53, 5437, Metric perturbations in two field inflation
- Garc´ıa-Garc´ıa et al. (2021) García-García, C., Zapatero, J. R., Alonso, D., Bellini, E., Ferreira, P. G., Mueller, E.-M., Nicola, A., & Ruiz-Lapuente, P. 2021, arXiv:2105.12108, JCAP, 10, 030, The growth of density perturbations in the last 10 billion years from tomographic large-scale structure data
- Ge et al. (2024) Ge, F., et al. 2024, arXiv:2411.06000, arXiv e-prints, arXiv:2411.06000, Cosmology From CMB Lensing and Delensed EE Power Spectra Using 2019-2020 SPT-3G Polarization Data
- Gerbino et al. (2023) Gerbino, M., et al. 2023, arXiv:2203.07377, Physics of the Dark Universe, 42, 101333, Synergy between cosmological and laboratory searches in neutrino physics
- GERDA Collaboration (2020) GERDA Collaboration. 2020, Phys. Rev. Lett., 125, 252502, Final Results of GERDA on the Search for Neutrinoless Double- Decay, https://link.aps.org/doi/10.1103/PhysRevLett.125.252502
- Giudice et al. (2001) Giudice, G. F., Kolb, E. W., & Riotto, A. 2001, hep-ph/0005123, Phys. Rev. D, 64, 023508, Largest temperature of the radiation era and its cosmological implications
- Gluscevic & Boddy (2018) Gluscevic, V. & Boddy, K. K. 2018, Physical Review Letters, 121, Constraints on Scattering of keV–TeV Dark Matter with Protons in the Early Universe, https://doi.org/10.1103%2Fphysrevlett.121.081301
- Gluscevic et al. (2019) Gluscevic, V., et al. 2019, Cosmological Probes of Dark Matter Interactions: The Next Decade, https://arxiv.org/abs/1903.05140
- Gratton & Challinor (2020) Gratton, S. & Challinor, A. 2020, arXiv:1911.07754, MNRAS, 499, 3410, Understanding parameter differences between analyses employing nested data subsets
- Green et al. (2019) Green, D., Meerburg, P. D., & Meyers, J. 2019, arXiv:1804.01055, J. Cosmology Astropart. Phys, 2019, 025, Aspects of dark matter annihilation in cosmology
- Green & Meyers (2024) Green, D. & Meyers, J. 2024, arXiv:2407.07878, arXiv e-prints, arXiv:2407.07878, The Cosmological Preference for Negative Neutrino Mass
- Grohs & Fuller (2022) Grohs, E. & Fuller, G. M. 2022, in Handbook of Nuclear Physics, 127
- Guo et al. (2011) Guo, Z.-K., Schwarz, D. J., & Zhang, Y.-Z. 2011, arXiv:1105.5916, J. Cosmology Astropart. Phys, 2011, 031, Reconstruction of the primordial power spectrum from CMB data
- Guzzo et al. (2008) Guzzo, L. et al. 2008, arXiv:0802.1944, Nature, 451, 541, A test of the nature of cosmic acceleration using galaxy redshift distortions
- Hadzhiyska & Spergel (2019) Hadzhiyska, B. & Spergel, D. N. 2019, arXiv:1808.04083, Phys. Rev. D, 99, 043537, Measuring the Duration of Last Scattering
- Hamilton (1998) Hamilton, A. J. S. 1998, astro-ph/9708102, in Astrophysics and Space Science Library, Vol. 231, The Evolving Universe, ed. D. Hamilton, 185
- Hannestad (1999) Hannestad, S. 1999, astro-ph/9810102, Phys. Rev. D, 60, 023515, Possible constraints on the time variation of the fine structure constant from cosmic microwave background data
- Harris et al. (2020) Harris, C. R., et al. 2020, arXiv:2006.10256, Nature, 585, 357, Array programming with NumPy
- Hart & Chluba (2018) Hart, L. & Chluba, J. 2018, arXiv:1705.03925, MNRAS, 474, 1850, New constraints on time-dependent variations of fundamental constants using Planck data
- Hart & Chluba (2020) —. 2020, arXiv:1912.03986, MNRAS, 493, 3255, Updated fundamental constant constraints from Planck 2018 data and possible relations to the Hubble tension
- Hasegawa et al. (2019) Hasegawa, T., Hiroshima, N., Kohri, K., Hansen, R. S. L., Tram, T., & Hannestad, S. 2019, arXiv:1908.10189, JCAP, 12, 012, MeV-scale reheating temperature and thermalization of oscillating neutrinos by radiative and hadronic decays of massive particles
- Hazra et al. (2016) Hazra, D. K., Shafieloo, A., Smoot, G. F., & Starobinsky, A. A. 2016, arXiv:1605.02106, J. Cosmology Astropart. Phys, 2016, 009, Primordial features and Planck polarization
- He et al. (2025) He, A., Ivanov, M. M., An, R., Driskell, T., & Gluscevic, V. 2025, arXiv:2502.02636, Bounds on Velocity-Dependent Dark Matter-Baryon Scattering from Large-Scale Structure, https://arxiv.org/abs/2502.02636
- He et al. (2023) He, A., Ivanov, M. M., An, R., & Gluscevic, V. 2023, arXiv:2301.08260, ApJ, 954, L8, S8 Tension in the Context of Dark Matter-Baryon Scattering
- Herold & Ferreira (2023) Herold, L. & Ferreira, E. G. M. 2023, arXiv:2210.16296, Phys. Rev. D, 108, 043513, Resolving the Hubble tension with early dark energy
- Herold et al. (2022) Herold, L., Ferreira, E. G. M., & Komatsu, E. 2022, arXiv:2112.12140, Astrophys. J. Lett., 929, L16, New Constraint on Early Dark Energy from Planck and BOSS Data Using the Profile Likelihood
- Hertzberg et al. (2008) Hertzberg, M. P., Tegmark, M., & Wilczek, F. 2008, arXiv:0807.1726, Phys. Rev. D, 78, 083507, Axion Cosmology and the Energy Scale of Inflation
- Heymans et al. (2021) Heymans, C., et al. 2021, arXiv:2007.15632, A&A, 646, A140, KiDS-1000 Cosmology: Multi-probe weak gravitational lensing and spectroscopic galaxy clustering constraints
- Hill & Bolliet (2023) Hill, J. C. & Bolliet, B. 2023, arXiv:2304.03750, arXiv e-prints, arXiv:2304.03750, Did the Universe Reheat After Recombination?
- Hill et al. (2020) Hill, J. C., McDonough, E., Toomey, M. W., & Alexander, S. 2020, Physical Review D, 102, Early dark energy does not restore cosmological concordance
- Hill et al. (2022) Hill, J. C., et al. 2022, arXiv:2109.04451, Phys. Rev. D, 105, 123536, Atacama Cosmology Telescope: Constraints on prerecombination early dark energy
- Hinshaw et al. (2013) Hinshaw, G., et al. 2013, arXiv:1212.5226, ApJS, 208, 19, Nine-year Wilkinson Microwave Anisotropy Probe (WMAP) Observations: Cosmological Parameter Results
- Hložek et al. (2018) Hložek, R., Marsh, D. J. E., & Grin, D. 2018, arXiv:1708.05681, MNRAS, 476, 3063, Using the full power of the cosmic microwave background to probe axion dark matter
- Hložek et al. (2017) Hložek, R., Marsh, D. J. E., Grin, D., Allison, R., Dunkley, J., & Calabrese, E. 2017, arXiv:1607.08208, Phys. Rev. D, 95, 123511, Future CMB tests of dark matter: Ultralight axions and massive neutrinos
- Hlozek et al. (2015) Hlozek, R., Grin, D., Marsh, D. J. E., & Ferreira, P. G. 2015, arXiv:1410.2896, Phys. Rev. D, 91, 103512, A search for ultralight axions using precision cosmological data
- Hlozek et al. (2012) Hlozek, R., et al. 2012, arXiv:1105.4887, ApJ, 749, 90, The Atacama Cosmology Telescope: A Measurement of the Primordial Power Spectrum
- Hooper et al. (2022) Hooper, D. C., Schöneberg, N., Murgia, R., Archidiacono, M., Lesgourgues, J., & Viel, M. 2022, Journal of Cosmology and Astroparticle Physics, 2022, 032, One likelihood to bind them all: Lyman- constraints on non-standard dark matter, https://doi.org/10.1088%2F1475-7516%2F2022%2F10%2F032
- Hou et al. (2013) Hou, Z., Keisler, R., Knox, L., Millea, M., & Reichardt, C. 2013, arXiv:1104.2333, Phys. Rev. D, 87, 083008, How massless neutrinos affect the cosmic microwave background damping tail
- Howlett et al. (2015) Howlett, C., Ross, A., Samushia, L., Percival, W., & Manera, M. 2015, arXiv:1409.3238, Mon. Not. Roy. Astron. Soc., 449, 848, The clustering of the SDSS main galaxy sample – II. Mock galaxy catalogues and a measurement of the growth of structure from redshift space distortions at
- Hsyu et al. (2020) Hsyu, T., Cooke, R. J., Prochaska, J. X., & Bolte, M. 2020, arXiv:2005.12290, ApJ, 896, 77, The PHLEK Survey: A New Determination of the Primordial Helium Abundance
- Hudson & Turnbull (2012) Hudson, M. J. & Turnbull, S. J. 2012, arXiv:1203.4814, ApJ, 751, L30, The Growth Rate of Cosmic Structure from Peculiar Velocities at Low and High Redshifts
- Hui et al. (2017) Hui, L., Ostriker, J. P., Tremaine, S., & Witten, E. 2017, arXiv:1610.08297, Phys. Rev. D, 95, 043541, Ultralight scalars as cosmological dark matter
- Hunt & Sarkar (2014) Hunt, P. & Sarkar, S. 2014, arXiv:1308.2317, J. Cosmology Astropart. Phys, 2014, 025, Reconstruction of the primordial power spectrum of curvature perturbations using multiple data sets
- Hunter (2007) Hunter, J. D. 2007, Computing in Science & Engineering, 9, 90, Matplotlib: A 2D graphics environment
- Huterer et al. (2017) Huterer, D., Shafer, D., Scolnic, D., & Schmidt, F. 2017, arXiv:1611.09862, JCAP, 05, 015, Testing CDM at the lowest redshifts with SN Ia and galaxy velocities
- Ichikawa et al. (2005) Ichikawa, K., Kawasaki, M., & Takahashi, F. 2005, astro-ph/0505395, Phys. Rev. D, 72, 043522, The Oscillation effects on thermalization of the neutrinos in the Universe with low reheating temperature
- Ichikawa et al. (2007) —. 2007, astro-ph/0611784, JCAP, 05, 007, Constraint on the effective number of neutrino species from the WMAP and SDSS LRG power spectra
- Iliadis & Coc (2020) Iliadis, C. & Coc, A. 2020, arXiv:2008.12200, ApJ, 901, 127, Thermonuclear Reaction Rates and Primordial Nucleosynthesis
- Ivanov et al. (2020a) Ivanov, M. M., Ali-Haïmoud, Y., & Lesgourgues, J. 2020a, arXiv:2005.10656, Phys. Rev. D, 102, 063515, H0 tension or T0 tension?
- Ivanov et al. (2020b) Ivanov, M. M., McDonough, E., Hill, J. C., Simonović, M., Toomey, M. W., Alexander, S., & Zaldarriaga, M. 2020b, arXiv:2006.11235, Phys. Rev. D, 102, 103502, Constraining Early Dark Energy with Large-Scale Structure
- Jedamzik & Abel (2013) Jedamzik, K. & Abel, T. 2013, Journal of Cosmology and Astroparticle Physics, 2013, 050, Small-scale primordial magnetic fields and anisotropies in the cosmic microwave background radiation, https://dx.doi.org/10.1088/1475-7516/2013/10/050
- Jedamzik et al. (2025) Jedamzik, K., Abel, T., & Ali-Haimoud, Y. 2025, arXiv:2312.11448, JCAP, 03, 012, Cosmic recombination in the presence of primordial magnetic fields
- Jedamzik & Pogosian (2020) Jedamzik, K. & Pogosian, L. 2020, arXiv:2004.09487, Phys. Rev. Lett., 125, 181302, Relieving the Hubble Tension with Primordial Magnetic Fields
- Jedamzik & Pogosian (2023) —. 2023, arXiv:2307.05475, arXiv e-prints, arXiv:2307.05475, Primordial magnetic fields and the Hubble tension
- Jedamzik et al. (2025) Jedamzik, K., Pogosian, L., & Abel, T. 2025, arXiv:2503.09599, arXiv e-prints, arXiv:2503.09599, Hints of Primordial Magnetic Fields at Recombination and Implications for the Hubble Tension
- Jedamzik & Saveliev (2019) Jedamzik, K. & Saveliev, A. 2019, arXiv:1804.06115, Phys. Rev. Lett., 123, 021301, Stringent Limit on Primordial Magnetic Fields from the Cosmic Microwave Background Radiation
- Jense et al. (2025) Jense, H. T., Harrison, I., Calabrese, E., Spurio Mancini, A., Bolliet, B., Dunkley, J., & Hill, J. C. 2025, arXiv:2405.07903, RAS Techniques and Instruments, 4, rzaf002, A complete framework for cosmological emulation and inference with CosmoPower
- Jeong & Takahashi (2013) Jeong, K. S. & Takahashi, F. 2013, arXiv:1305.6521, Physics Letters B, 725, 134, Self-interacting dark radiation
- Johnson et al. (2016) Johnson, A., Blake, C., Dossett, J., Koda, J., Parkinson, D., & Joudaki, S. 2016, arXiv:1504.06885, Mon. Not. Roy. Astron. Soc., 458, 2725, Searching for Modified Gravity: Scale and Redshift Dependent Constraints from Galaxy Peculiar Velocities
- Joseph et al. (2023) Joseph, M., Aloni, D., Schmaltz, M., Sivarajan, E. N., & Weiner, N. 2023, arXiv:2207.03500, Phys. Rev. D, 108, 023520, A Step in understanding the S8 tension
- Kable et al. (2019) Kable, J. A., Addison, G. E., & Bennett, C. L. 2019, arXiv:1809.03983, ApJ, 871, 77, Quantifying the CMB Degeneracy between the Matter Density and Hubble Constant in Current Experiments
- Kachelriess et al. (2000) Kachelriess, M., Tomas, R., & Valle, J. W. F. 2000, hep-ph/0001039, Phys. Rev. D, 62, 023004, Supernova bounds on Majoron emitting decays of light neutrinos
- Kaiser (1987) Kaiser, N. 1987, MNRAS, 227, 1, Clustering in real space and in redshift space
- Kamionkowski & Kovetz (2016) Kamionkowski, M. & Kovetz, E. D. 2016, arXiv:1510.06042, ARA&A, 54, 227, The Quest for B Modes from Inflationary Gravitational Waves
- Kamionkowski & Riess (2023) Kamionkowski, M. & Riess, A. G. 2023, arXiv:2211.04492, Ann. Rev. Nucl. Part. Sci., 73, 153, The Hubble Tension and Early Dark Energy
- KamLAND-Zen Collaboration (2024) KamLAND-Zen Collaboration. 2024, arXiv:2406.11438, Search for Majorana Neutrinos with the Complete KamLAND-Zen Dataset
- Kaplinghat et al. (1999) Kaplinghat, M., Scherrer, R. J., & Turner, M. S. 1999, astro-ph/9810133, Phys. Rev. D, 60, 023516, Constraining variations in the fine-structure constant with the cosmic microwave background
- Kasuya & Kawasaki (2009) Kasuya, S. & Kawasaki, M. 2009, arXiv:0904.3800, Phys. Rev. D, 80, 023516, Axion isocurvature fluctuations with extremely blue spectrum
- Kawasaki et al. (1999) Kawasaki, M., Kohri, K., & Sugiyama, N. 1999, astro-ph/9811437, Phys. Rev. Lett., 82, 4168, Cosmological constraints on late time entropy production
- Kawasaki et al. (2000) —. 2000, astro-ph/0002127, Phys. Rev. D, 62, 023506, MeV scale reheating temperature and thermalization of neutrino background
- Kawasaki & Takahashi (2001) Kawasaki, M. & Takahashi, F. 2001, hep-ph/0105134, Phys. Lett. B, 516, 388, Adiabatic and isocurvature fluctuations of Affleck-Dine field in D term inflation model
- Kawasaki et al. (2015) Kawasaki, M., Yamada, M., & Yanagida, T. T. 2015, arXiv:1504.04126, Phys. Rev. D, 91, 125018, Observable dark radiation from a cosmologically safe QCD axion
- Kharusi et al. (2021) Kharusi, S. A. et al. 2021, arXiv:2109.01327, Phys. Rev. D, 104, 112002, Search for Majoron-emitting modes of 136Xe double beta decay with the complete EXO-200 dataset
- Knox & Millea (2020) Knox, L. & Millea, M. 2020, arXiv:1908.03663, Phys. Rev. D, 101, 043533, Hubble constant hunter’s guide
- Kosowsky & Turner (1995) Kosowsky, A. & Turner, M. S. 1995, astro-ph/9504071, Phys. Rev. D, 52, R1739, CBR anisotropy and the running of the scalar spectral index
- Kou & Lewis (2025) Kou, R. & Lewis, A. 2025, arXiv:2410.16185, J. Cosmology Astropart. Phys, 2025, 033, A flexible parameterization to test early physics solutions to the Hubble tension with future CMB data
- Kreisch et al. (2020) Kreisch, C. D., Cyr-Racine, F.-Y., & Doré, O. 2020, arXiv:1902.00534, Phys. Rev. D, 101, 123505, Neutrino puzzle: Anomalies, interactions, and cosmological tensions
- Kreisch et al. (2024) Kreisch, C. D., et al. 2024, arXiv:2207.03164, Phys. Rev. D, 109, 043501, Atacama Cosmology Telescope: The persistence of neutrino self-interaction in cosmological measurements
- Kurichin et al. (2021) Kurichin, O. A., Kislitsyn, P. A., Klimenko, V. V., Balashev, S. A., & Ivanchik, A. V. 2021, arXiv:2101.09127, MNRAS, 502, 3045, A new determination of the primordial helium abundance using the analyses of H II region spectra from SDSS
- La Posta et al. (2022) La Posta, A., Louis, T., Garrido, X., & Hill, J. C. 2022, arXiv:2112.10754, Phys. Rev. D, 105, 083519, Constraints on prerecombination early dark energy from SPT-3G public data
- Laguë et al. (2021) Laguë, A., Bond, J. R., Hložek, R., Marsh, D. J. E., & Söding, L. 2021, arXiv:2004.08482, MNRAS, 504, 2391, Evolving ultralight scalars into non-linearity with Lagrangian perturbation theory
- Laguë et al. (2024) Laguë, A., McCarthy, F., Madhavacheril, M., Hill, J. C., & Qu, F. J. 2024, arXiv:2402.08149, Phys. Rev. D, 110, 023536, Constraints on dark matter-dark energy scattering from ACT DR6 CMB lensing measurements
- Laguë et al. (in prep) Laguë, A. et al. in prep
- Lancaster et al. (2017) Lancaster, L., Cyr-Racine, F.-Y., Knox, L., & Pan, Z. 2017, arXiv:1704.06657, JCAP, 07, 033, A tale of two modes: Neutrino free-streaming in the early universe
- Lee & Ali-Ha¨ımoud (2021) Lee, N. & Ali-Haïmoud, Y. 2021, arXiv:2108.07798, Phys. Rev. D, 104, 103509, Probing small-scale baryon and dark matter isocurvature perturbations with cosmic microwave background anisotropies
- Lee et al. (2023) Lee, N., Ali-Haïmoud, Y., Schöneberg, N., & Poulin, V. 2023, arXiv:2212.04494, Phys. Rev. Lett., 130, 161003, What It Takes to Solve the Hubble Tension through Modifications of Cosmological Recombination
- Lesgourgues (2011) Lesgourgues, J. 2011, arXiv:1104.2932, arXiv e-prints, arXiv:1104.2932, The Cosmic Linear Anisotropy Solving System (CLASS) I: Overview
- Lesgourgues et al. (2016) Lesgourgues, J., Marques-Tavares, G., & Schmaltz, M. 2016, arXiv:1507.04351, J. Cosmology Astropart. Phys, 2016, 037, Evidence for dark matter interactions in cosmological precision data?
- Lesgourgues & Pastor (2006) Lesgourgues, J. & Pastor, S. 2006, astro-ph/0603494, Phys. Rep., 429, 307, Massive neutrinos and cosmology
- Lessa & Peres (2007) Lessa, A. P. & Peres, O. L. G. 2007, hep-ph/0701068, Phys. Rev. D, 75, 094001, Revising limits on neutrino-Majoron couplings
- Lewin & Smith (1996) Lewin, J. & Smith, P. 1996, Astroparticle Physics, 6, 87, Review of mathematics, numerical factors, and corrections for dark matter experiments based on elastic nuclear recoil, https://www.sciencedirect.com/science/article/pii/S0927650596000473
- Lewis (2019) Lewis, A. 2019, arXiv:1910.13970, arXiv e-prints, arXiv:1910.13970, GetDist: a Python package for analysing Monte Carlo samples
- Lewis & Bridle (2002) Lewis, A. & Bridle, S. 2002, astro-ph/0205436, Phys. Rev. D, 66, 103511, Cosmological parameters from CMB and other data: A Monte Carlo approach
- Lewis et al. (2000) Lewis, A., Challinor, A., & Lasenby, A. 2000, astro-ph/9911177, ApJ, 538, 473, Efficient Computation of Cosmic Microwave Background Anisotropies in Closed Friedmann-Robertson-Walker Models
- Li et al. (2023a) Li, X., et al. 2023a, arXiv:2304.00702, Phys. Rev. D, 108, 123518, Hyper Suprime-Cam Year 3 results: Cosmology from cosmic shear two-point correlation functions
- Li et al. (2023b) Li, Y., et al. 2023b, arXiv:2303.04767, ApJ, 956, 36, The Atacama Cosmology Telescope: Systematic Transient Search of 3 Day Maps
- Li et al. (2023c) Li, Z., et al. 2023c, arXiv:2208.08985, J. Cosmology Astropart. Phys, 2023, 046, The Atacama Cosmology Telescope: limits on dark matter-baryon interactions from DR4 power spectra
- Lin et al. (2019) Lin, M.-X., Benevento, G., Hu, W., & Raveri, M. 2019, arXiv:1905.12618, Phys. Rev. D, 100, 063542, Acoustic Dark Energy: Potential Conversion of the Hubble Tension
- Linde (1982) Linde, A. 1982, Physics Letters B, 108, 389, A new inflationary universe scenario: A possible solution of the horizon, flatness, homogeneity, isotropy and primordial monopole problems, https://www.sciencedirect.com/science/article/pii/0370269382912199
- Linde (1985) Linde, A. D. 1985, Phys. Lett. B, 158, 375, Generation of Isothermal Density Perturbations in the Inflationary Universe
- Linde (1991) —. 1991, Phys. Lett. B, 259, 38, Axions in inflationary cosmology
- Linde & Mukhanov (1997) Linde, A. D. & Mukhanov, V. F. 1997, astro-ph/9610219, Phys. Rev. D, 56, R535, Nongaussian isocurvature perturbations from inflation
- Linder (2003) Linder, E. V. 2003, astro-ph/0208512, Phys. Rev. Lett., 90, 091301, Exploring the Expansion History of the Universe
- Linder (2005) Linder, E. V. 2005, Physical Review D, 72, Cosmic growth history and expansion history
- LiteBIRD Collaboration et al. (2023) LiteBIRD Collaboration, et al. 2023, arXiv:2202.02773, Progress of Theoretical and Experimental Physics, 2023, 042F01, Probing cosmic inflation with the LiteBIRD cosmic microwave background polarization survey
- Liu et al. (2024) Liu, R., Hu, W., & Grin, D. 2024, arXiv:2412.15192, arXiv e-prints, arXiv:2412.15192, Accurate method for ultralight axion CMB and matter power spectra
- Lorenz et al. (2019) Lorenz, C. S., Funcke, L., Calabrese, E., & Hannestad, S. 2019, arXiv:1811.01991, Phys. Rev. D, 99, 023501, Time-varying neutrino mass from a supercooled phase transition: Current cosmological constraints and impact on the m-8 plane
- Louis et al. (2025) Louis, T., La Posta, A., Atkins, Z., Jense, H., et al. 2025, The Atacama Cosmology Telescope: DR6 Power Spectra, Likelihoods and CDM Parameters
- Louis et al. (2017) Louis, T., et al. 2017, arXiv:1610.02360, J. Cosmology Astropart. Phys, 2017, 031, The Atacama Cosmology Telescope: two-season ACTPol spectra and parameters
- Loverde & Weiner (2024) Loverde, M. & Weiner, Z. J. 2024, arXiv:2410.00090, J. Cosmology Astropart. Phys, 2024, 048, Massive neutrinos and cosmic composition
- Lynch et al. (2024a) Lynch, G. P., Knox, L., & Chluba, J. 2024a, arXiv:2406.10202, Phys. Rev. D, 110, 083538, DESI observations and the Hubble tension in light of modified recombination
- Lynch et al. (2024b) —. 2024b, arXiv:2404.05715, Phys. Rev. D, 110, 063518, Reconstructing the recombination history by combining early and late cosmological probes
- Lyth et al. (2003) Lyth, D. H., Ungarelli, C., & Wands, D. 2003, astro-ph/0208055, Phys. Rev. D, 67, 023503, The Primordial density perturbation in the curvaton scenario
- Lyth & Wands (2002) Lyth, D. H. & Wands, D. 2002, hep-ph/0110002, Phys. Lett. B, 524, 5, Generating the curvature perturbation without an inflaton
- Maamari et al. (2021) Maamari, K., Gluscevic, V., Boddy, K. K., Nadler, E. O., & Wechsler, R. H. 2021, The Astrophysical Journal Letters, 907, L46, Bounds on Velocity-dependent Dark Matter–Proton Scattering from Milky Way Satellite Abundance, https://doi.org/10.3847%2F2041-8213%2Fabd807
- MacCrann et al. (2024) MacCrann, N., et al. 2024, arXiv:2405.01188, MNRAS, 532, 4247, The Atacama Cosmology Telescope: Reionization kSZ trispectrum methodology and limits
- Madhavacheril et al. (2014) Madhavacheril, M. S., Sehgal, N., & Slatyer, T. R. 2014, Phys. Rev. D, 89, 103508, Current dark matter annihilation constraints from CMB and low-redshift data, https://link.aps.org/doi/10.1103/PhysRevD.89.103508
- Madhavacheril et al. (2024) Madhavacheril, M. S., et al. 2024, The Astrophysical Journal, 962, 113, The Atacama Cosmology Telescope: DR6 Gravitational Lensing Map and Cosmological Parameters, http://dx.doi.org/10.3847/1538-4357/acff5f
- Marsh (2016) Marsh, D. J. E. 2016, arXiv:1510.07633, Phys. Rept., 643, 1, Axion Cosmology
- Martins et al. (2004) Martins, C. J. A. P., Melchiorri, A., Rocha, G., Trotta, R., Avelino, P. P., & Viana, P. T. P. 2004, astro-ph/0302295, Physics Letters B, 585, 29, WMAP constraints on varying and the promise of reionization
- Matsumoto et al. (2022) Matsumoto, A., et al. 2022, arXiv:2203.09617, ApJ, 941, 167, EMPRESS. VIII. A New Determination of Primordial He Abundance with Extremely Metal-poor Galaxies: A Suggestion of the Lepton Asymmetry and Implications for the Hubble Tension
- Mazumdar et al. (2022) Mazumdar, A., Mohanty, S., & Parashari, P. 2022, arXiv:2011.13685, JCAP, 10, 011, Flavour specific neutrino self-interaction: H 0 tension and IceCube
- McCarthy et al. (2022) McCarthy, F., Hill, J. C., & Madhavacheril, M. S. 2022, arXiv:2103.05582, Phys. Rev. D, 105, 023517, Baryonic feedback biases on fundamental physics from lensed CMB power spectra
- McDonough et al. (2024) McDonough, E., Hill, J. C., Ivanov, M. M., La Posta, A., & Toomey, M. W. 2024, arXiv:2310.19899, International Journal of Modern Physics D, 33, 2430003, Observational constraints on early dark energy
- Mead et al. (2021) Mead, A. J., Brieden, S., Tröster, T., & Heymans, C. 2021, arXiv:2009.01858, MNRAS, 502, 1401, HMCODE-2020: improved modelling of non-linear cosmological power spectra with baryonic feedback
- Menegoni et al. (2012) Menegoni, E., Archidiacono, M., Calabrese, E., Galli, S., Martins, C. J. A. P., & Melchiorri, A. 2012, arXiv:1202.1476, Phys. Rev. D, 85, 107301, Fine structure constant and the CMB damping scale
- Miller & Branch (1992) Miller, D. L. & Branch, D. 1992, AJ, 103, 379, Type 1a Supernovae and Cosmic Peculiar Velocities
- Miranda et al. (2016) Miranda, V., Hu, W., He, C., & Motohashi, H. 2016, arXiv:1510.07580, Phys. Rev. D, 93, 023504, Nonlinear excitations in inflationary power spectra
- Mirizzi et al. (2015) Mirizzi, A., Mangano, G., Pisanti, O., & Saviano, N. 2015, arXiv:1410.1385, Phys. Rev. D, 91, 025019, Collisional production of sterile neutrinos via secret interactions and cosmological implications
- Mirpoorian et al. (2024) Mirpoorian, S. H., Jedamzik, K., & Pogosian, L. 2024, arXiv:2411.16678, Modified recombination and the Hubble tension
- Miyatake et al. (2023) Miyatake, H., et al. 2023, arXiv:2304.00704, Phys. Rev. D, 108, 123517, Hyper Suprime-Cam Year 3 results: Cosmology from galaxy clustering and weak lensing with HSC and SDSS using the emulator based halo model
- Mollerach (1990) Mollerach, S. 1990, Phys. Rev. D, 42, 313, Isocurvature Baryon Perturbations and Inflation
- Moodley et al. (2004) Moodley, K., Bucher, M., Dunkley, J., Ferreira, P. G., & Skordis, C. 2004, astro-ph/0407304, Phys. Rev. D, 70, 103520, Constraints on isocurvature models from the WMAP first-year data
- More et al. (2023) More, S., et al. 2023, arXiv:2304.00703, Phys. Rev. D, 108, 123520, Hyper Suprime-Cam Year 3 results: Measurements of clustering of SDSS-BOSS galaxies, galaxy-galaxy lensing, and cosmic shear
- Moresco & Marulli (2017) Moresco, M. & Marulli, F. 2017, arXiv:1705.07903, Mon. Not. Roy. Astron. Soc., 471, L82, Cosmological constraints from a joint analysis of cosmic growth and expansion
- Moroi & Takahashi (2001) Moroi, T. & Takahashi, T. 2001, hep-ph/0110096, Phys. Lett. B, 522, 215, [Erratum: Phys.Lett.B 539, 303–303 (2002)], Effects of cosmological moduli fields on cosmic microwave background
- Mukhanov (2007) Mukhanov, S. 2007, Journal of Physics A: Mathematical and Theoretical, 40, 6561, Cosmological perturbations from inflation, https://dx.doi.org/10.1088/1751-8113/40/25/S01
- NA48/2 Collaboration (2007) NA48/2 Collaboration. 2007, Nucl. Phys. B Proc. Suppl., 169, 205, Testing LFV measuring the ratio R(K) between the branching ratio of K+- — e+- nu (gamma) and K+- — mu+- nu (gamma) in NA48/2 experiment: Measurement and perspectives
- Nadler et al. (2021) Nadler, E., et al. 2021, Physical Review Letters, 126, Constraints on Dark Matter Properties from Observations of Milky Way Satellite Galaxies, https://doi.org/10.1103%2Fphysrevlett.126.091101
- Nadler et al. (2024) Nadler, E. O., An, R., Gluscevic, V., Benson, A., & Du, X. 2024, arXiv:2410.03635, arXiv e-prints, arXiv:2410.03635, COZMIC. I. Cosmological Zoom-in Simulations with Initial Conditions Beyond CDM
- Nadler et al. (2019) Nadler, E. O., Gluscevic, V., Boddy, K. K., & Wechsler, R. H. 2019, The Astrophysical Journal, 878, L32, Constraints on Dark Matter Microphysics from the Milky Way Satellite Population, https://doi.org/10.3847%2F2041-8213%2Fab1eb2
- Naess et al. (2025) Naess, S., Guan, Y., Duivenvoorden, A., Hasselfield, M., et al. 2025, The Atacama Cosmology Telescope: DR6 Maps
- NEMO-3 Collaboration (2014) NEMO-3 Collaboration. 2014, arXiv:1311.5695, Phys. Rev. D, 89, 111101, Search for neutrinoless double-beta decay of with the NEMO-3 detector
- Nguyen et al. (2021) Nguyen, D. V., Sarnaaik, D., Boddy, K. K., Nadler, E. O., & Gluscevic, V. 2021, Phys. Rev. D, 104, 103521, Observational constraints on dark matter scattering with electrons, https://link.aps.org/doi/10.1103/PhysRevD.104.103521
- Nguyen et al. (2023) Nguyen, N.-M., Huterer, D., & Wen, Y. 2023, arXiv:2302.01331, Phys. Rev. Lett., 131, 111001, Evidence for Suppression of Structure Growth in the Concordance Cosmological Model
- Obied et al. (2017) Obied, G., Dvorkin, C., Heinrich, C., Hu, W., & Miranda, V. 2017, arXiv:1706.09412, Phys. Rev. D, 96, 083526, Inflationary features and shifts in cosmological parameters from Planck 2015 data
- O’Hare (2024) O’Hare, C. A. J. 2024, arXiv:2403.17697, PoS, COSMICWISPers, 040, Cosmology of axion dark matter
- Okumura et al. (2016) Okumura, T. et al. 2016, arXiv:1511.08083, Publ. Astron. Soc. Jap., 68, 38, The Subaru FMOS galaxy redshift survey (FastSound). IV. New constraint on gravity theory from redshift space distortions at
- Oldengott et al. (2019) Oldengott, I. M., Barenboim, G., Kahlen, S., Salvado, J., & Schwarz, D. J. 2019, arXiv:1901.04352, J. Cosmology Astropart. Phys, 2019, 049, How to relax the cosmological neutrino mass bound
- Oldengott et al. (2017) Oldengott, I. M., Tram, T., Rampf, C., & Wong, Y. Y. Y. 2017, arXiv:1706.02123, JCAP, 11, 027, Interacting neutrinos in cosmology: exact description and constraints
- Padmanabhan & Finkbeiner (2005) Padmanabhan, N. & Finkbeiner, D. P. 2005, astro-ph/0503486, Phys. Rev. D, 72, 023508, Detecting dark matter annihilation with CMB polarization: Signatures and experimental prospects
- Pagano et al. (2020) Pagano, L., Delouis, J. M., Mottet, S., Puget, J. L., & Vibert, L. 2020, arXiv:1908.09856, A&A, 635, A99, Reionization optical depth determination from Planck HFI data with ten percent accuracy
- Palanque-Delabrouille et al. (2020) Palanque-Delabrouille, N., Yèche, C., Schöneberg, N., Lesgourgues, J., Walther, M., Chabanier, S., & Armengaud, E. 2020, arXiv:1911.09073, J. Cosmology Astropart. Phys, 2020, 038, Hints, neutrino bounds, and WDM constraints from SDSS DR14 Lyman- and Planck full-survey data
- Pan et al. (2016) Pan, Z., Knox, L., Mulroe, B., & Narimani, A. 2016, arXiv:1603.03091, MNRAS, 459, 2513, Cosmic microwave background acoustic peak locations
- Park et al. (2019) Park, M., Kreisch, C. D., Dunkley, J., Hadzhiyska, B., & Cyr-Racine, F.-Y. 2019, arXiv:1904.02625, Phys. Rev. D, 100, 063524, CDM or self-interacting neutrinos: How CMB data can tell the two models apart
- Park et al. (2022) Park, S., Bak, D., Lee, J.-W., & Park, I. 2022, arXiv:2207.07192, J. Cosmology Astropart. Phys, 2022, 033, Analyzing planar galactic halo distributions with fuzzy/cold dark matter models
- Particle Data Group (2020) Particle Data Group. 2020, Progress of Theoretical and Experimental Physics, 2020, 083C01, Review of Particle Physics
- Particle Data Group (2024) —. 2024, Phys. Rev. D, 110, 030001, Review of particle physics
- Peebles (1968) Peebles, P. J. E. 1968, ApJ, 153, 1, Recombination of the Primeval Plasma
- Peiris et al. (2003) Peiris, H. V., et al. 2003, astro-ph/0302225, ApJS, 148, 213, First-Year Wilkinson Microwave Anisotropy Probe (WMAP) Observations: Implications For Inflation
- Percival & White (2009) Percival, W. J. & White, M. 2009, arXiv:0808.0003, MNRAS, 393, 297, Testing cosmological structure formation using redshift-space distortions
- Percival et al. (2002) Percival, W. J., et al. 2002, astro-ph/0206256, MNRAS, 337, 1068, Parameter constraints for flat cosmologies from cosmic microwave background and 2dFGRS power spectra
- Perlmutter et al. (1999) Perlmutter, S., et al. 1999, astro-ph/9812133, ApJ, 517, 565, Measurements of and from 42 High-Redshift Supernovae
- Pezzotta et al. (2017) Pezzotta, A. et al. 2017, arXiv:1612.05645, Astron. Astrophys., 604, A33, The VIMOS Public Extragalactic Redshift Survey (VIPERS): The growth of structure at from redshift-space distortions in the clustering of the PDR-2 final sample
- Philcox & Ivanov (2022) Philcox, O. H. E. & Ivanov, M. M. 2022, arXiv:2112.04515, Phys. Rev. D, 105, 043517, BOSS DR12 full-shape cosmology: CDM constraints from the large-scale galaxy power spectrum and bispectrum monopole
- Pitrou et al. (2018) Pitrou, C., Coc, A., Uzan, J.-P., & Vangioni, E. 2018, arXiv:1801.08023, Phys. Rep., 754, 1, Precision big bang nucleosynthesis with improved Helium-4 predictions
- Planck Collaboration (2014) Planck Collaboration. 2014, arXiv:1303.5076, A&A, 571, A16, Planck 2013 results. XVI. Cosmological parameters
- Planck Collaboration (2015) —. 2015, arXiv:1406.7482, A&A, 580, A22, Planck intermediate results. XXIV. Constraints on variations in fundamental constants
- Planck Collaboration (2016a) —. 2016a, arXiv:1502.01589, A&A, 594, A13, Planck 2015 results. XIII. Cosmological parameters
- Planck Collaboration (2016b) —. 2016b, arXiv:1502.01591, A&A, 594, A15, Planck 2015 results. XV. Gravitational lensing
- Planck Collaboration (2016c) —. 2016c, arXiv:1502.02114, A&A, 594, A20, Planck 2015 results. XX. Constraints on inflation
- Planck Collaboration (2020a) —. 2020a, arXiv:1807.06205, A&A, 641, A1, Planck 2018 results. I. Overview and the cosmological legacy of Planck
- Planck Collaboration (2020b) —. 2020b, arXiv:1907.12875, A&A, 641, A5, Planck 2018 results. V. CMB power spectra and likelihoods
- Planck Collaboration (2020c) —. 2020c, arXiv:1807.06209, A&A, 641, A6, Planck 2018 results. VI. Cosmological parameters
- Planck Collaboration (2020d) —. 2020d, arXiv:1807.06210, A&A, 641, A8, Planck 2018 results. VIII. Gravitational lensing
- Planck Collaboration (2020e) —. 2020e, arXiv:1807.06211, A&A, 641, A10, Planck 2018 results. X. Constraints on inflation
- Pogosian et al. (2019) Pogosian, L., Shimon, M., Mewes, M., & Keating, B. 2019, arXiv:1904.07855, Phys. Rev. D, 100, 023507, Future CMB constraints on cosmic birefringence and implications for fundamental physics
- Pogosian et al. (2024) Pogosian, L., Zhao, G.-B., & Jedamzik, K. 2024, arXiv:2405.20306, Astrophys. J. Lett., 973, L13, A Consistency Test of the Cosmological Model at the Epoch of Recombination Using DESI Baryonic Acoustic Oscillation and Planck Measurements
- Polarski & Starobinsky (1994) Polarski, D. & Starobinsky, A. A. 1994, astro-ph/9404061, Phys. Rev. D, 50, 6123, Isocurvature perturbations in multiple inflationary models
- Poudou et al. (2025) Poudou, A., Simon, T., Montandon, T., Teixeira, E. M., & Poulin, V. 2025, arXiv:2503.10485, arXiv e-prints, arXiv:2503.10485, Self-interacting neutrinos in light of recent CMB and LSS data
- Poulin et al. (2023a) Poulin, V., Bernal, J. L., Kovetz, E. D., & Kamionkowski, M. 2023a, arXiv:2209.06217, Phys. Rev. D, 107, 123538, Sigma-8 tension is a drag
- Poulin et al. (2021) Poulin, V., Smith, T. L., & Bartlett, A. 2021, arXiv:2109.06229, Phys. Rev. D, 104, 123550, Dark energy at early times and ACT data: A larger Hubble constant without late-time priors
- Poulin et al. (2018) Poulin, V., Smith, T. L., Grin, D., Karwal, T., & Kamionkowski, M. 2018, arXiv:1806.10608, Phys. Rev. D, 98, 083525, Cosmological implications of ultralight axionlike fields
- Poulin et al. (2023b) Poulin, V., Smith, T. L., & Karwal, T. 2023b, arXiv:2302.09032, Physics of the Dark Universe, 42, 101348, The Ups and Downs of Early Dark Energy solutions to the Hubble tension: A review of models, hints and constraints circa 2023
- Poulin et al. (2019) Poulin, V., Smith, T. L., Karwal, T., & Kamionkowski, M. 2019, Phys. Rev. Lett., 122, 221301, Early Dark Energy can Resolve the Hubble Tension
- Pouri et al. (2014) Pouri, A., Basilakos, S., & Plionis, M. 2014, arXiv:1402.0964, JCAP, 08, 042, Precision growth index using the clustering of cosmic structures and growth data
- Qu et al. (2024a) Qu, F. J., Surrao, K. M., Bolliet, B., Hill, J. C., Sherwin, B. D., & Jense, H. T. 2024a, arXiv:2404.16805, arXiv e-prints, arXiv:2404.16805, Accelerated inference on accelerated cosmic expansion: New constraints on axion-like early dark energy with DESI BAO and ACT DR6 CMB lensing
- Qu et al. (2024b) Qu, F. J., et al. 2024b, arXiv:2304.05202, ApJ, 962, 112, The Atacama Cosmology Telescope: A Measurement of the DR6 CMB Lensing Power Spectrum and Its Implications for Structure Growth
- Raffaelli & Ballardini (2025) Raffaelli, A. & Ballardini, M. 2025, arXiv:2503.10609, arXiv e-prints, arXiv:2503.10609, Knot reconstruction of the scalar primordial power spectrum with Planck, ACT, and SPT CMB data
- Rapetti et al. (2013) Rapetti, D., Blake, C., Allen, S. W., Mantz, A., Parkinson, D., & Beutler, F. 2013, arXiv:1205.4679, Mon. Not. Roy. Astron. Soc., 432, 973, A combined measurement of cosmic growth and expansion from clusters of galaxies, the CMB and galaxy clustering
- Rashkovetskyi et al. (2021) Rashkovetskyi, M., Muñoz, J. B., Eisenstein, D. J., & Dvorkin, C. 2021, arXiv:2108.02747, Phys. Rev. D, 104, 103517, Small-scale clumping at recombination and the Hubble tension
- Reid et al. (2010) Reid, B. A., et al. 2010, arXiv:0907.1659, MNRAS, 404, 60, Cosmological constraints from the clustering of the Sloan Digital Sky Survey DR7 luminous red galaxies
- Riemer-Sørensen et al. (2017) Riemer-Sørensen, S., Kotuš, S., Webb, J. K., Ali, K., Dumont, V., Murphy, M. T., & Carswell, R. F. 2017, arXiv:1703.06656, MNRAS, 468, 3239, A precise deuterium abundance: remeasurement of the z = 3.572 absorption system towards the quasar PKS1937-101
- Riemer-Sørensen et al. (2015) Riemer-Sørensen, S., et al. 2015, arXiv:1412.4043, MNRAS, 447, 2925, A robust deuterium abundance; re-measurement of the z = 3.256 absorption system towards the quasar PKS 1937-101
- Riess et al. (1998) Riess, A. G., et al. 1998, astro-ph/9805201, AJ, 116, 1009, Observational Evidence from Supernovae for an Accelerating Universe and a Cosmological Constant
- Riess et al. (2022) —. 2022, arXiv:2112.04510, ApJ, 934, L7, A Comprehensive Measurement of the Local Value of the Hubble Constant with 1 km s-1 Mpc-1 Uncertainty from the Hubble Space Telescope and the SH0ES Team
- Rocha et al. (2004) Rocha, G., Trotta, R., Martins, C. J. A. P., Melchiorri, A., Avelino, P. P., Bean, R., & Viana, P. T. P. 2004, astro-ph/0309211, MNRAS, 352, 20, Measuring in the early Universe: cosmic microwave background polarization, re-ionization and the Fisher matrix analysis
- Rogers et al. (2022) Rogers, K. K., Dvorkin, C., & Peiris, H. V. 2022, Physical Review Letters, 128, Limits on the Light Dark Matter–Proton Cross Section from Cosmic Large-Scale Structure, https://doi.org/10.1103%2Fphysrevlett.128.171301
- Rogers et al. (2023) Rogers, K. K., Hložek, R., Laguë, A., Ivanov, M. M., Philcox, O. H. E., Cabass, G., Akitsu, K., & Marsh, D. J. E. 2023, arXiv:2301.08361, J. Cosmology Astropart. Phys, 2023, 023, Ultra-light axions and the S 8 tension: joint constraints from the cosmic microwave background and galaxy clustering
- Rosenberg et al. (2022) Rosenberg, E., Gratton, S., & Efstathiou, G. 2022, arXiv:2205.10869, MNRAS, 517, 4620, CMB power spectra and cosmological parameters from Planck PR4 with CamSpec
- Roy Choudhury et al. (2021) Roy Choudhury, S., Hannestad, S., & Tram, T. 2021, arXiv:2012.07519, JCAP, 03, 084, Updated constraints on massive neutrino self-interactions from cosmology in light of the tension
- Rubin et al. (2015) Rubin, D., et al. 2015, in American Astronomical Society Meeting Abstracts, Vol. 225, American Astronomical Society Meeting Abstracts #225, 255.12
- Rubin et al. (2023) Rubin, D., et al. 2023, arXiv:2311.12098, arXiv e-prints, arXiv:2311.12098, Union Through UNITY: Cosmology with 2,000 SNe Using a Unified Bayesian Framework
- Rubira et al. (2023) Rubira, H., Mazoun, A., & Garny, M. 2023, arXiv:2209.03974, J. Cosmology Astropart. Phys, 2023, 034, Full-shape BOSS constraints on dark matter interacting with dark radiation and lifting the S8 tension
- Ruiz & Huterer (2015) Ruiz, E. J. & Huterer, D. 2015, arXiv:1410.5832, Phys. Rev. D, 91, 063009, Testing the dark energy consistency with geometry and growth
- Ruiz-Zapatero et al. (2022) Ruiz-Zapatero, J., García-García, C., Alonso, D., Ferreira, P. G., & Grumitt, R. D. P. 2022, arXiv:2201.07025, Mon. Not. Roy. Astron. Soc., 512, 1967, Model-independent constraints on m and H(z) from the link between geometry and growth
- Ruiz-Zapatero et al. (2021) Ruiz-Zapatero, J. et al. 2021, arXiv:2105.09545, Astron. Astrophys., 655, A11, Geometry versus growth - Internal consistency of the flat CDM model with KiDS-1000
- Sabti et al. (2022) Sabti, N., Muñoz, J. B., & Blas, D. 2022, arXiv:2110.13161, ApJ, 928, L20, New Roads to the Small-scale Universe: Measurements of the Clustering of Matter with the High-redshift UV Galaxy Luminosity Function
- Said et al. (2020) Said, K., Colless, M., Magoulas, C., Lucey, J. R., & Hudson, M. J. 2020, arXiv:2007.04993, Mon. Not. Roy. Astron. Soc., 497, 1275, Joint analysis of 6dFGS and SDSS peculiar velocities for the growth rate of cosmic structure and tests of gravity
- Schechter & Valle (1982) Schechter, J. & Valle, J. W. F. 1982, Phys. Rev. D, 25, 774, Neutrino Decay and Spontaneous Violation of Lepton Number
- Schöneberg (2024) Schöneberg, N. 2024, arXiv:2401.15054, J. Cosmology Astropart. Phys, 2024, 006, The 2024 BBN baryon abundance update
- Schöneberg et al. (2022) Schöneberg, N., Abellán, G. F., Sánchez, A. P., Witte, S. J., Poulin, V., & Lesgourgues, J. 2022, arXiv:2107.10291, Phys. Rep., 984, 1, The H0 Olympics: A fair ranking of proposed models
- Schöneberg et al. (2023) Schöneberg, N., Abellán, G. F., Simon, T., Bartlett, A., Patel, Y., & Smith, T. L. 2023, arXiv:2306.12469, Phys. Rev. D, 108, 123513, Comparative analysis of interacting stepped dark radiation
- Scóccola et al. (2009) Scóccola, C. G., Landau, S. J., & Vucetich, H. 2009, arXiv:0910.1083, Mem. Soc. Astron. Italiana, 80, 814, WMAP 5-year constraints on time variation of and m_e
- Scolnic et al. (2022) Scolnic, D., et al. 2022, arXiv:2112.03863, ApJ, 938, 113, The Pantheon+ Analysis: The Full Data Set and Light-curve Release
- Scolnic et al. (2018) Scolnic, D. M., et al. 2018, arXiv:1710.00845, ApJ, 859, 101, The Complete Light-curve Sample of Spectroscopically Confirmed SNe Ia from Pan-STARRS1 and Cosmological Constraints from the Combined Pantheon Sample
- Seager et al. (1999) Seager, S., Sasselov, D. D., & Scott, D. 1999, astro-ph/9909275, ApJ, 523, L1, A New Calculation of the Recombination Epoch
- Secco et al. (2022) Secco, L. F., et al. 2022, arXiv:2105.13544, Phys. Rev. D, 105, 023515, Dark Energy Survey Year 3 results: Cosmology from cosmic shear and robustness to modeling uncertainty
- Seckel & Turner (1985) Seckel, D. & Turner, M. S. 1985, Phys. Rev. D, 32, 3178, Isothermal Density Perturbations in an Axion Dominated Inflationary Universe
- Sekiguchi & Takahashi (2021) Sekiguchi, T. & Takahashi, T. 2021, arXiv:2007.03381, Phys. Rev. D, 103, 083507, Early recombination as a solution to the H0 tension
- Shao et al. (2024) Shao, H., Givans, J. J., Dunkley, J., Madhavacheril, M., Qu, F., Farren, G., & Sherwin, B. 2024, arXiv:2409.02295, arXiv e-prints, arXiv:2409.02295, Cosmological limits on the neutrino mass sum for beyond-CDM models
- Shlivko & Steinhardt (2024) Shlivko, D. & Steinhardt, P. J. 2024, arXiv:2405.03933, Physics Letters B, 855, 138826, Assessing observational constraints on dark energy
- Sievers et al. (2013) Sievers, J. L., et al. 2013, arXiv:1301.0824, J. Cosmology Astropart. Phys, 2013, 060, The Atacama Cosmology Telescope: cosmological parameters from three seasons of data
- Sigurdson et al. (2004) Sigurdson, K., Doran, M., Kurylov, A., Caldwell, R. R., & Kamionkowski, M. 2004, Phys. Rev. D, 70, 083501, Dark-matter electric and magnetic dipole moments, https://link.aps.org/doi/10.1103/PhysRevD.70.083501
- Simons Observatory Collaboration (2019) Simons Observatory Collaboration. 2019, arXiv:1808.07445, J. Cosmology Astropart. Phys, 2019, 056, The Simons Observatory: science goals and forecasts
- Simpson (2010) Simpson, F. 2010, arXiv:1007.1034, Phys. Rev. D, 82, 083505, Scattering of dark matter and dark energy
- Slatyer (2016a) Slatyer, T. R. 2016a, arXiv:1506.03811, Phys. Rev. D, 93, 023527, Indirect dark matter signatures in the cosmic dark ages. I. Generalizing the bound on s -wave dark matter annihilation from Planck results
- Slatyer (2016b) —. 2016b, arXiv:1506.03812, Phys. Rev. D, 93, 023521, Indirect dark matter signatures in the cosmic dark ages. II. Ionization, heating, and photon production from arbitrary energy injections
- Slatyer & Wu (2018) Slatyer, T. R. & Wu, C.-L. 2018, Physical Review D, 98, Early-Universe constraints on dark matter-baryon scattering and their implications for a global 21 cm signal, https://doi.org/10.1103%2Fphysrevd.98.023013
- Smith et al. (2007) Smith, K. M., Zahn, O., & Doré, O. 2007, arXiv:0705.3980, Phys. Rev. D, 76, 043510, Detection of gravitational lensing in the cosmic microwave background
- Smith et al. (2003) Smith, R. E., et al. 2003, astro-ph/0207664, MNRAS, 341, 1311, Stable clustering, the halo model and non-linear cosmological power spectra
- Smith et al. (2022) Smith, T. L., Lucca, M., Poulin, V., Abellan, G. F., Balkenhol, L., Benabed, K., Galli, S., & Murgia, R. 2022, arXiv:2202.09379, Phys. Rev. D, 106, 043526, Hints of early dark energy in Planck, SPT, and ACT data: New physics or systematics?
- Smith & Poulin (2024) Smith, T. L. & Poulin, V. 2024, arXiv:2309.03265, Phys. Rev. D, 109, 103506, Current small-scale CMB constraints to axionlike early dark energy
- Smith et al. (2020) Smith, T. L., Poulin, V., & Amin, M. A. 2020, arXiv:1908.06995, Phys. Rev. D, 101, 063523, Oscillating scalar fields and the Hubble tension: a resolution with novel signatures
- SNO Collaboration (2002) SNO Collaboration. 2002, nucl-ex/0204008, Phys. Rev. Lett., 89, 011301, Direct Evidence for Neutrino Flavor Transformation from Neutral-Current Interactions in the Sudbury Neutrino Observatory
- Song & Percival (2009) Song, Y.-S. & Percival, W. J. 2009, arXiv:0807.0810, J. Cosmology Astropart. Phys, 2009, 004, Reconstructing the history of structure formation using redshift distortions
- Spergel et al. (2003) Spergel, D. N., et al. 2003, astro-ph/0302209, ApJS, 148, 175, First-Year Wilkinson Microwave Anisotropy Probe (WMAP) Observations: Determination of Cosmological Parameters
- Spurio Mancini et al. (2022) Spurio Mancini, A., Piras, D., Alsing, J., Joachimi, B., & Hobson, M. P. 2022, arXiv:2106.03846, MNRAS, 511, 1771, COSMOPOWER: emulating cosmological power spectra for accelerated Bayesian inference from next-generation surveys
- Stahl et al. (2021) Stahl, B. E., de Jaeger, T., Boruah, S. S., Zheng, W., Filippenko, A. V., & Hudson, M. J. 2021, arXiv:2105.05185, MNRAS, 505, 2349, Peculiar-velocity cosmology with Types Ia and II supernovae
- Starobinskij (1992) Starobinskij, A. A. 1992, Soviet Journal of Experimental and Theoretical Physics Letters, 55, 489, Spectrum of adiabatic perturbations in the universe when there are singularities in the inflationary potential.
- Starobinsky (1980) Starobinsky, A. A. 1980, Physics Letters B, 91, 99, A new type of isotropic cosmological models without singularity
- Steigman (2013) Steigman, G. 2013, arXiv:1303.0049, Phys. Rev. D, 87, 103517, Equivalent neutrinos, light WIMPs, and the chimera of dark radiation
- Stompor et al. (1996) Stompor, R., Banday, A. J., & Gorski, K. M. 1996, astro-ph/9511087, Astrophys. J., 463, 8, Flat dark matter dominated models with hybrid adiabatic plus isocurvature initial conditions
- Sugiyama et al. (2023) Sugiyama, S., et al. 2023, arXiv:2304.00705, Phys. Rev. D, 108, 123521, Hyper Suprime-Cam Year 3 results: Cosmology from galaxy clustering and weak lensing with HSC and SDSS using the minimal bias model
- Super-Kamiokande Collaboration (1998) Super-Kamiokande Collaboration. 1998, hep-ex/9807003, Phys. Rev. Lett., 81, 1562, Evidence for Oscillation of Atmospheric Neutrinos
- Takahashi et al. (2012) Takahashi, R., Sato, M., Nishimichi, T., Taruya, A., & Oguri, M. 2012, arXiv:1208.2701, ApJ, 761, 152, Revising the Halofit Model for the Nonlinear Matter Power Spectrum
- Tegmark & Zaldarriaga (2002) Tegmark, M. & Zaldarriaga, M. 2002, astro-ph/0207047, Phys. Rev. D, 66, 103508, Separating the early universe from the late universe: Cosmological parameter estimation beyond the black box
- Tegmark et al. (2004) Tegmark, M., et al. 2004, astro-ph/0310725, ApJ, 606, 702, The Three-Dimensional Power Spectrum of Galaxies from the Sloan Digital Sky Survey
- Thiele et al. (2021) Thiele, L., Guan, Y., Hill, J. C., Kosowsky, A., & Spergel, D. N. 2021, arXiv:2105.03003, Phys. Rev. D, 104, 063535, Can small-scale baryon inhomogeneities resolve the Hubble tension? An investigation with ACT DR4
- Torrado & Lewis (2021) Torrado, J. & Lewis, A. 2021, arXiv:2005.05290, J. Cosmology Astropart. Phys, 2021, 057, Cobaya: code for Bayesian analysis of hierarchical physical models
- Tristram et al. (2024) Tristram, M., et al. 2024, A&A, 682, A37, Cosmological parameters derived from the final Planck data release (PR4), https://doi.org/10.1051/0004-6361/202348015
- Troxel et al. (2018) Troxel, M. A., et al. 2018, arXiv:1708.01538, Phys. Rev. D, 98, 043528, Dark Energy Survey Year 1 results: Cosmological constraints from cosmic shear
- Tully et al. (2016) Tully, R. B., Courtois, H. M., & Sorce, J. G. 2016, arXiv:1605.01765, AJ, 152, 50, Cosmicflows-3
- Turnbull et al. (2012) Turnbull, S. J., Hudson, M. J., Feldman, H. A., Hicken, M., Kirshner, R. P., & Watkins, R. 2012, arXiv:1111.0631, MNRAS, 420, 447, Cosmic flows in the nearby universe from Type Ia supernovae
- Turner & Wilczek (1991) Turner, M. S. & Wilczek, F. 1991, Phys. Rev. Lett., 66, 5, Inflationary axion cosmology
- Turner et al. (1983) Turner, M. S., Wilczek, F., & Zee, A. 1983, Phys. Lett. B, 125, 35, [Erratum: Phys.Lett.B 125, 519 (1983)], Formation of Structure in an Axion Dominated Universe
- Turner et al. (2022) Turner, R. J., Blake, C., & Ruggeri, R. 2022, arXiv:2207.03707, Mon. Not. Roy. Astron. Soc., 518, 2436, A local measurement of the growth rate from peculiar velocities and galaxy clustering correlations in the 6dF Galaxy Survey
- Valerdi et al. (2021) Valerdi, M., Peimbert, A., & Peimbert, M. 2021, arXiv:2105.12260, MNRAS, 505, 3624, Chemical abundances in seven metal-poor H II regions and a determination of the primordial helium abundance
- Valerdi et al. (2019) Valerdi, M., Peimbert, A., Peimbert, M., & Sixtos, A. 2019, arXiv:1904.01594, ApJ, 876, 98, Determination of the Primordial Helium Abundance Based on NGC 346, an H II Region of the Small Magellanic Cloud
- van Engelen et al. (2012) van Engelen, A., et al. 2012, arXiv:1202.0546, ApJ, 756, 142, A Measurement of Gravitational Lensing of the Microwave Background Using South Pole Telescope Data
- Verde et al. (2024) Verde, L., Schöneberg, N., & Gil-Marín, H. 2024, arXiv:2311.13305, ARA&A, 62, 287, A Tale of Many H 0
- Vogt et al. (2023) Vogt, S. M. L., Marsh, D. J. E., & Laguë, A. 2023, arXiv:2209.13445, Phys. Rev. D, 107, 063526, Improved mixed dark matter halo model for ultralight axions
- Wang & Steinhardt (1998) Wang, L. & Steinhardt, P. J. 1998, The Astrophysical Journal, 508, 483–490, Cluster Abundance Constraints for Cosmological Models with a Time‐varying, Spatially Inhomogeneous Energy Component with Negative Pressure
- Wang et al. (2007) Wang, S., Hui, L., May, M., & Haiman, Z. 2007, arXiv:0705.0165, Phys. Rev. D, 76, 063503, Is Modified Gravity Required by Observations? An Empirical Consistency Test of Dark Energy Models
- Weinberg et al. (2013) Weinberg, D. H., Mortonson, M. J., Eisenstein, D. J., Hirata, C., Riess, A. G., & Rozo, E. 2013, arXiv:1201.2434, Phys. Rep., 530, 87, Observational probes of cosmic acceleration
- Weinberg (1978) Weinberg, S. 1978, Phys. Rev. Lett., 40, 223, A New Light Boson?, https://link.aps.org/doi/10.1103/PhysRevLett.40.223
- Weinberg (2013) Weinberg, S. 2013, arXiv:1305.1971, Phys. Rev. Lett., 110, 241301, Goldstone Bosons as Fractional Cosmic Neutrinos
- Wen et al. (2021) Wen, Y., Scott, D., Sullivan, R., & Zibin, J. P. 2021, arXiv:2011.09616, Phys. Rev. D, 104, 043516, Role of T0 in CMB anisotropy measurements
- White et al. (2022) White, M. et al. 2022, arXiv:2111.09898, JCAP, 02, 007, Cosmological constraints from the tomographic cross-correlation of DESI Luminous Red Galaxies and Planck CMB lensing
- Xu et al. (2013) Xu, Y., Takahashi, K., Goriely, S., Arnould, M., Ohta, M., & Utsunomiya, H. 2013, arXiv:1310.7099, Nucl. Phys. A, 918, 61, NACRE II: an update of the NACRE compilation of charged-particle-induced thermonuclear reaction rates for nuclei with mass number A¡16
- Zhou & Weiner (2024) Zhou, Z. & Weiner, N. 2024, arXiv:2409.06771, arXiv e-prints, arXiv:2409.06771, Searching for Dark Matter Interactions with ACT, SPT and DES
Appendix A Theory specifications
For the results presented in this paper, we use multiple Einstein-Boltzmann codes to calculate theory predictions. We explore and define settings for both camb and class to ensure that the uncertainty in the theory calculations is well below the statistical error bars of the DR6 power spectra on all scales. In particular, some of the settings defined for the Planck baseline analyses require revision to give unbiased results with our new small-scale measurements, as pointed out in, e.g., Hill et al., 2022; McCarthy et al., 2022. For this work, we revise precision parameters for the calculation of the lensed CMB spectra, as well as baseline choices for non-linear modeling of the matter power spectrum, effects of baryonic feedback in the non-linear matter power spectrum model, recombination calculations, and the choice of BBN calculations (the latter is described in detail in §6.2). We obtain the baseline settings summarized in §3 and reported in Figs. 47 and 48 below.
To assess robustness of the theory specifications with respect to the data, we consider both cosmological parameter posteriors using different assumptions and single likelihood evaluations to study the impact on the of a reference best-fit model. In general, we find that parameter posteriors are unbiased, but values can vary across the parameter space, for both and extended models. We summarize the results of these investigations here:
- •
-
•
Recombination— For recombination modeling, we compare the (previously-used-as-default) RecFast code with the alternative HyRec and CosmoRec codes, both of which can be manually installed within camb. When evaluating the DR6 CMB-only likelihood ACT-lite at the best-fit point from L25, we find and , and with HyRec and CosmoRec agreeing within . Moving away from the best-fit point, the differences increase and vary across parameter space, with RecFast calculations compared to either HyRec or CosmoRec reaching . Looking at the contributions to this difference across multipoles, we find that it mostly comes from TT at . No significant difference in parameter posteriors is found. Given that Recfast relies on fudge factors optimized for the Planck sensitivity but not beyond, and given that CosmoRec and HyRec have been proven to be consistent for precise calculations of hydrogen recombination — with CosmoRec implementing also more complex helium recombination (Chluba et al., 2012) — we choose to use CosmoRec as our baseline for use with camb. Since CosmoRec is not available with class, we use HyRec for models using this code.
-
•
Non-linear matter power spectrum— Previous CMB analyses (e.g., Choi et al., 2020; Planck Collaboration, 2020c) used Halofit or the 2016 version of HMcode to compute the non-linear matter power spectrum, which is necessary for modeling CMB lensing. Here, we switch to the updated 2020 version of HMcode. We adopt the dark-matter-only model with the default parameters. At the best-fit point, we find .
-
•
Baryonic feedback in non-linear modeling— To assess the impact of parameters describing baryonic feedback in HMcode, we run calculations with dark-matter-only versus dark-matter-plus-baryons, with the default settings for baryonic feedback. At the best-fit point, this gives . We also test the impact of the strength of baryonic feedback, comparing our baseline with DM+baryons and with baryons having HMcode_logT_AGN=8.0 (rather than 7.8), thus corresponding to a stronger feedback model with larger suppression of the small-scale matter power spectrum at late times. This gives . For future analyses with Simons Observatory and CMB-S4 data, this effect will likely need to be accounted for in the modeling (as found in McCarthy et al., 2022).
Figures 47 and 48 give code snippets from our Cobaya yaml files summarizing the baseline analysis settings. These configurations give results within . Figure 49 shows validation across Einstein-Boltzmann codes for our baseline parameter constraints, including camb, class, and CosmoPower-based emulators; similar agreement is found also for extended models that are accessible in the three codes. In Table 4 we list all the models explored in this work and enumerate the theory and likelihood codes used for each analysis.
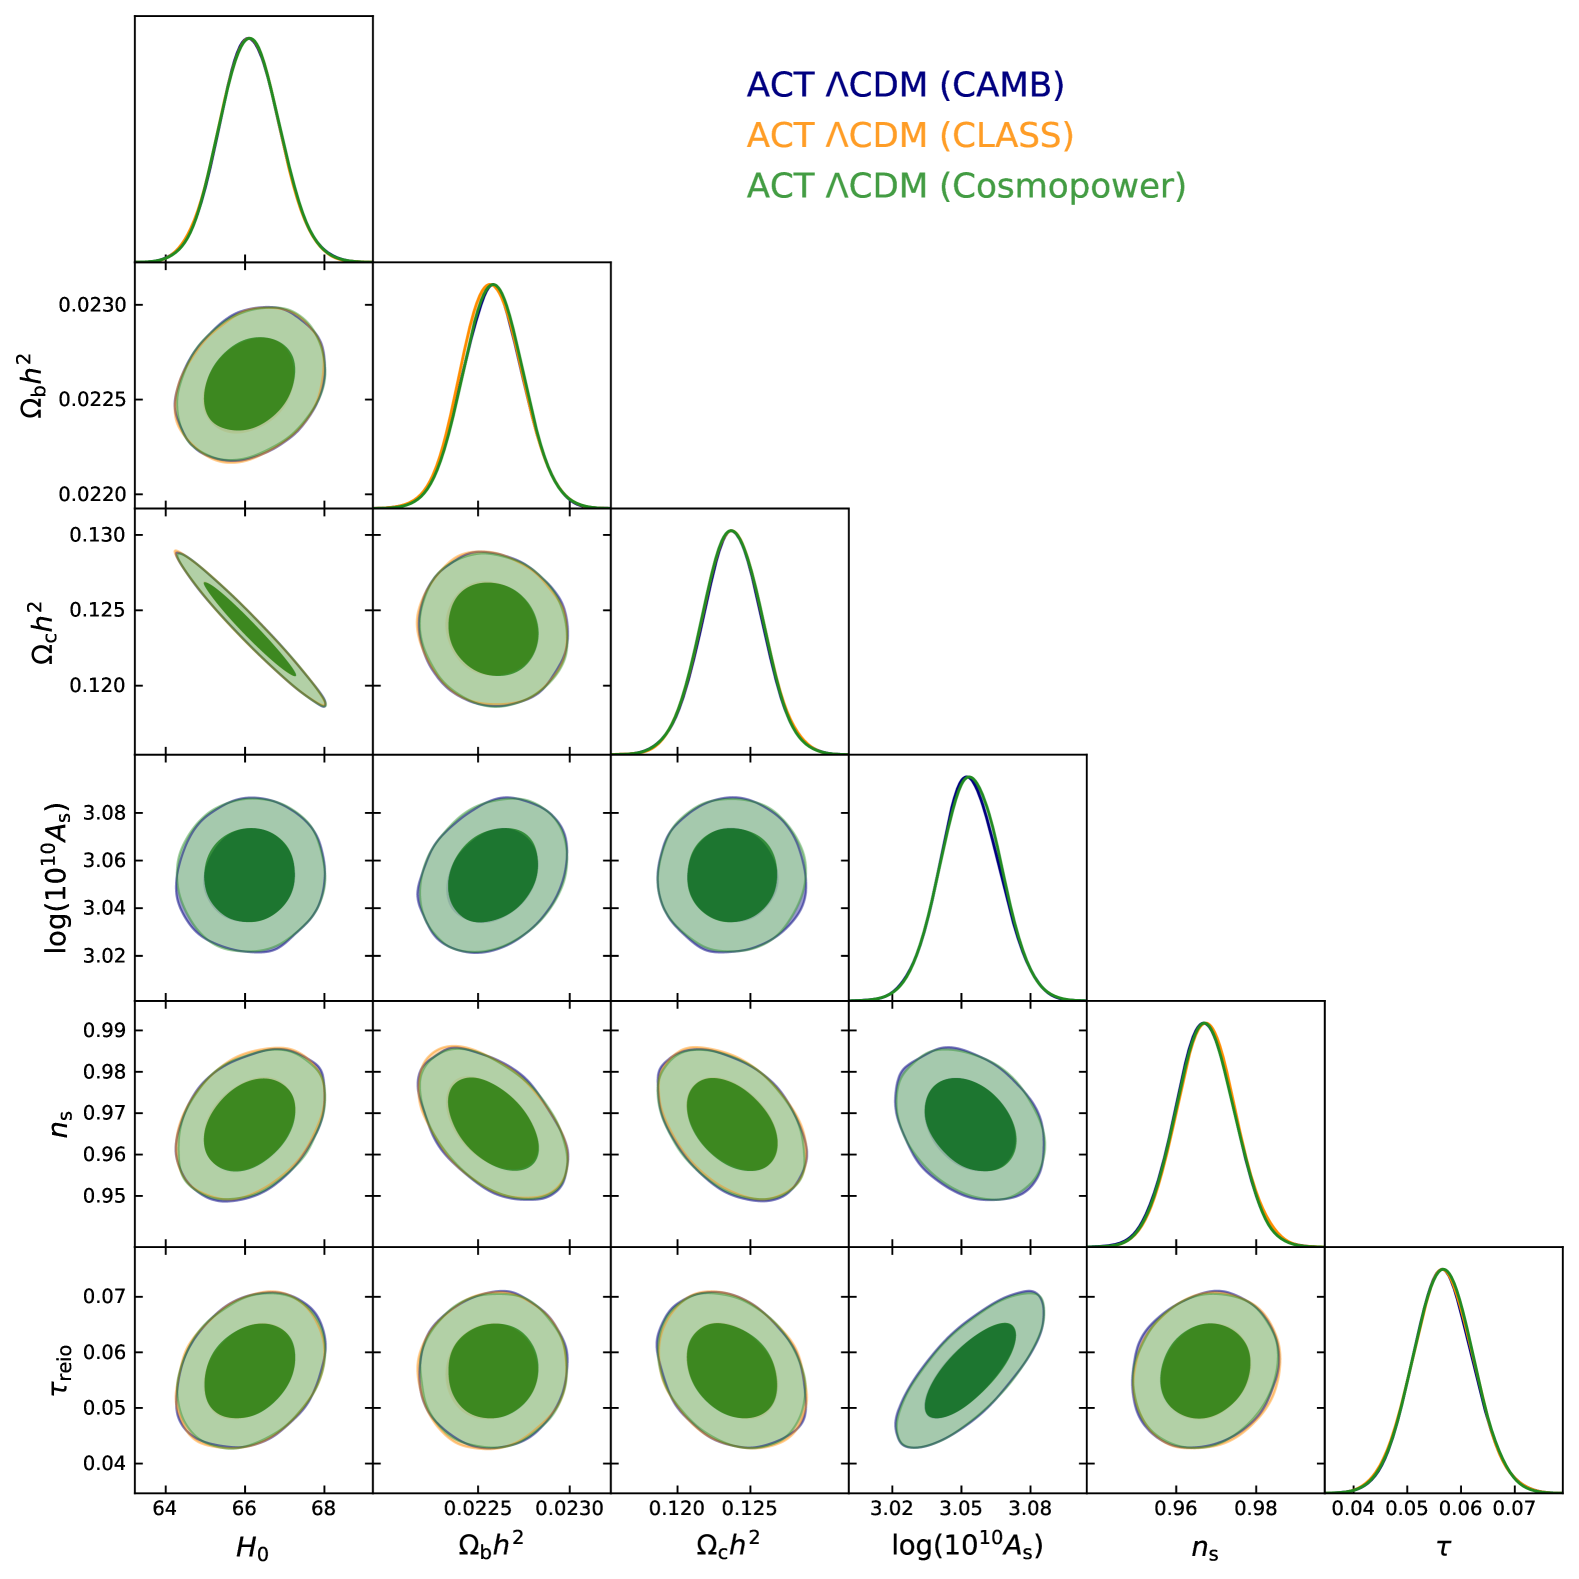
| Model | Section | Theory Code | Likelihood |
| Running of scalar spectral index | §4.1 | camb | MFLike/ACT-lite |
| §4.2 | camb | ACT-lite | |
| Isocurvature perturbations | §4.3 | class | MFLike |
| Tensor modes | §4.4 | camb | ACT-lite |
| Early dark energy | §5.1 | class/camb/ | MFLike |
| class emulators (Qu et al., 2024a) | |||
| Varying electron mass | §5.2.1 | class | MFLike |
| Varying electron mass and curvature | §5.2.2 | class | MFLike |
| Varying fine-structure constant | §5.2.3 | class | MFLike |
| Varying fine-structure constant and curvature | §5.2.4 | class | MFLike |
| Primordial magnetic fields | §5.3 | modified class | MFLike |
| CMB temperature | §5.4 | class | MFLike |
| Modified recombination history | §5.5 | modified class | MFLike |
| Neutrino number, | §6.1.1 | camb/ | MFLike/ACT-lite |
| camb emulators (Jense et al., 2025) | |||
| Neutrino mass, | §6.1.1 | camb/ | MFLike/ACT-lite |
| camb emulators (Jense et al., 2025) | |||
| §6.1.1 | camb/ | ACT-lite | |
| camb emulators (Jense et al., 2025) | |||
| Neutrino self-interactions | §6.1.2 | modified camb | MFLike |
| Helium and deuterium | §6.2 | camb | MFLike/ACT-lite |
| Axion-like particles | §6.3 | modified camb/ | ACT-lite |
| camb emulators | |||
| DM-baryon interactions | §6.4.1 | modified class | MFLike |
| DM annihilation | §6.4.2 | class | MFLike |
| Self-interacting DR | §6.5.1 | class | MFLike |
| Interacting DR-DM | §6.5.2 | class | MFLike |
| Spatial curvature | §7.1 | camb | MFLike/ACT-lite |
| Dark energy equation of state, | §7.2 | camb | MFLike/ACT-lite |
| Dark energy equation of state, | §7.2 | camb | MFLike |
| Interacting DE-DM | §7.3 | modified class | MFLike |
| Modified gravity | §7.4 | modified camb | MFLike |
Appendix B ACT DR6 versus DR4 cosmology
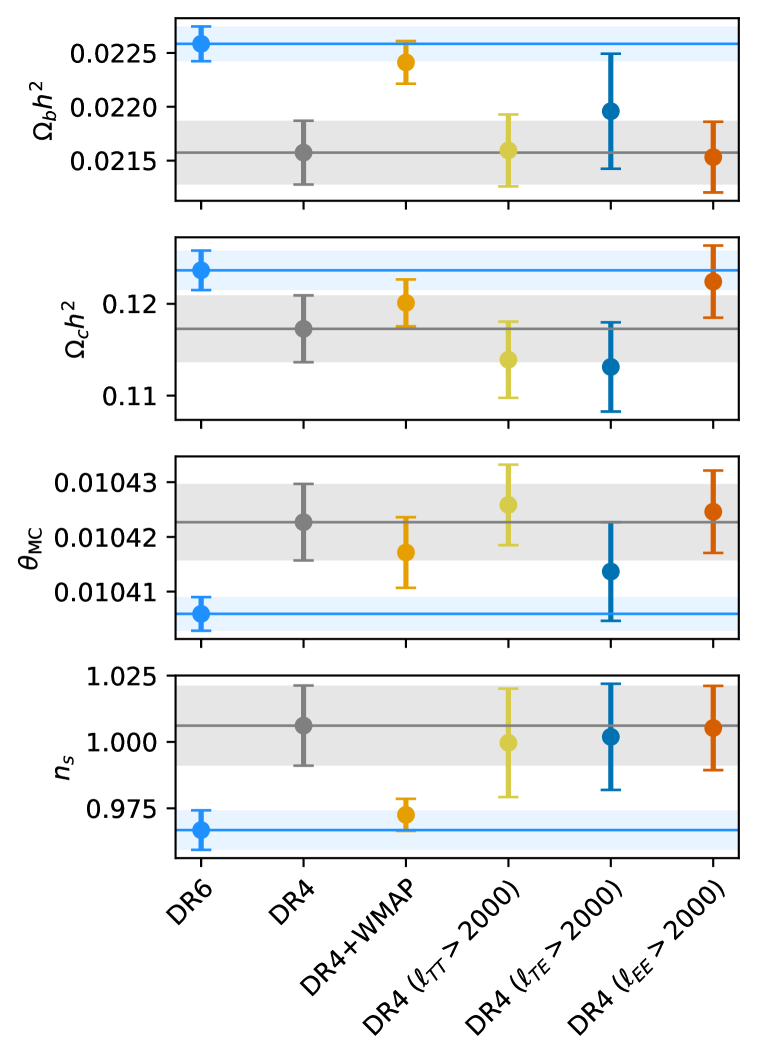
Here we compare results for the baseline model derived in L25 from the DR6 maps with those from DR4 presented in Choi et al. (2020); Aiola et al. (2020). Figure 50 shows the subset of cosmological parameters measured by ACT for DR6 (L25) and DR4 (Choi et al., 2020), with the latter explored also in combination with WMAP and for different subsets of the data. Considering the 4-dimensional space of these parameters, we find that the DR6 and DR4 ACT-alone parameters differ at the 2.8 level if we ignore correlations between the two datasets. This is therefore a lower limit on the difference if covariance were included. In particular, we find that the DR6 measurement of shifts upwards by compared to DR4. When ACT DR4 is combined with large-scale modes from WMAP, which was the nominal combination in Aiola et al. (2020), we find that DR6 agrees with the DR4 + WMAP best-fit model to within .424242Comparison of EDE constraints from DR4 and DR6 can be found in Appendix E.
In terms of understanding the difference between the cosmology preferred by ACT-alone for DR4 and the best-fit model for DR6 (or DR4 + WMAP), we note that Aiola et al. (2020) found that an artificial 5% re-calibration of TE compared to TT (dividing the DR4 TE bandpowers by 1.05) would bring the ACT-alone DR4 parameters into better agreement with DR4 + WMAP or Planck. This re-calibration had the effect of moving parameters along the degeneracy direction for (see Fig. 14 of Aiola et al. 2020). In comparing CMB power spectra for DR4 and DR6, shown in Fig. 51, we find good agreement in TT and EE, and note that the TE residuals at with respect to the DR6 best-fit model are predominantly negative, indicating less power in the DR4 spectra compared to DR6. The DR6 TE spectra are more consistent with the model preferred by DR4 + WMAP and Planck. Although we have not re-analyzed the DR4 data at this stage, we speculate that our improved modeling of temperature-to-polarization leakage between DR4 and DR6 could impact the TE measurement. During the DR6 beam calibration analysis, we determined that the DR4 leakage estimation method was insensitive to low- () leakage. Given that in DR6 we find significant leakage at these large angular scales, we have reason to speculate that the leakage in DR4 could have been underestimated, both in central value and in uncertainty. A rough estimate suggests that the from underestimating the leakage has an RMS value between and K2 for and between and K2 for — more details are given in Duivenvoorden et al., in prep. These numbers are estimated from the difference between the nominal DR6 leakage estimate and an estimate made using the DR4 leakage estimation method. Other factors that might have contributed to a difference in TE between DR6 and DR4 are improvements in the map-making procedure (see N25): in DR6 we have not subtracted an estimate of the pickup (due to the ground and potential other sources) during map-making and we have upgraded to a pointing matrix that uses bilinear interpolation instead of nearest-neighbor interpolation. Although it is not understood how these two changes could influence the TE spectrum, it has not been verified that these upgrades would leave the DR4 TE spectrum unchanged. Figure 50 and the bottom right panel of Fig. 51 also show that simply removing data in TE at moves the DR4 limits into closer agreement with DR6. Cutting TT or EE at (Fig. 50) does not yield the same agreement, expanding parameter degeneracies in different directions. This exploration of TT and EE subsets also tests other aspects noted in the DR4 analyses, including the impact of the DR4 lack of power in TT and the region in EE where some deviations from (e.g., early dark energy and self-interacting neutrinos) were moderately preferred.
This assessment has been done assuming that the underlying model is ; we do not rule out the possibility that the difference between DR4 and DR6 is due to the true model not being , as the two datasets do not fully overlap in angular scale, with DR4 having more statistical weight at smaller angular scales than DR6.
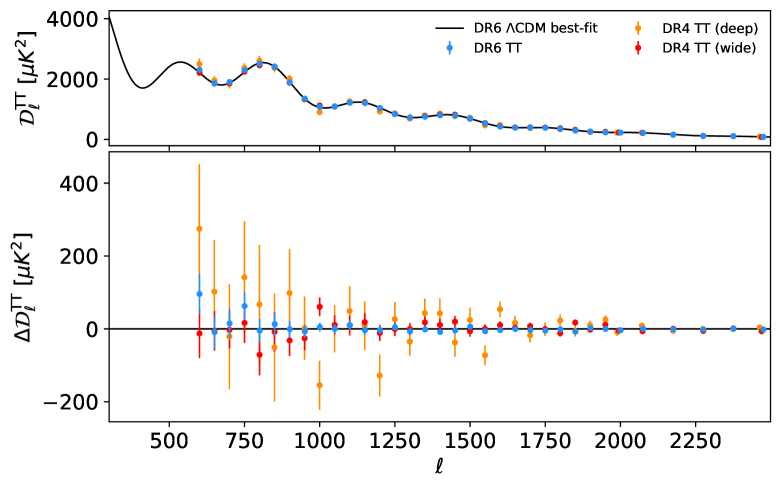
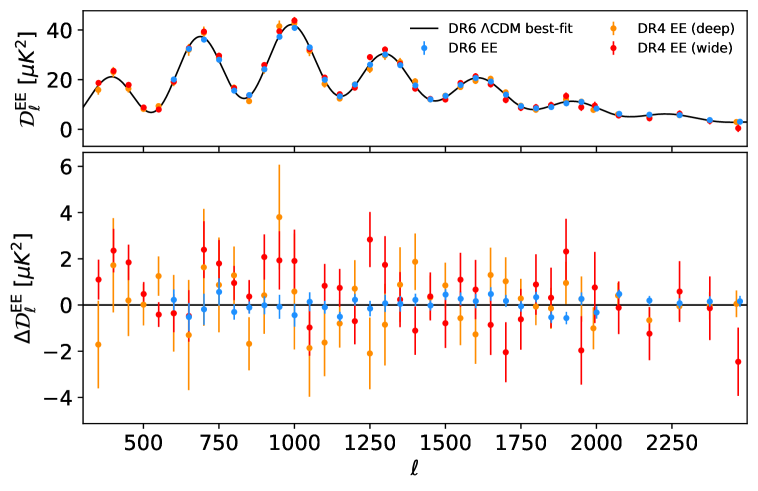
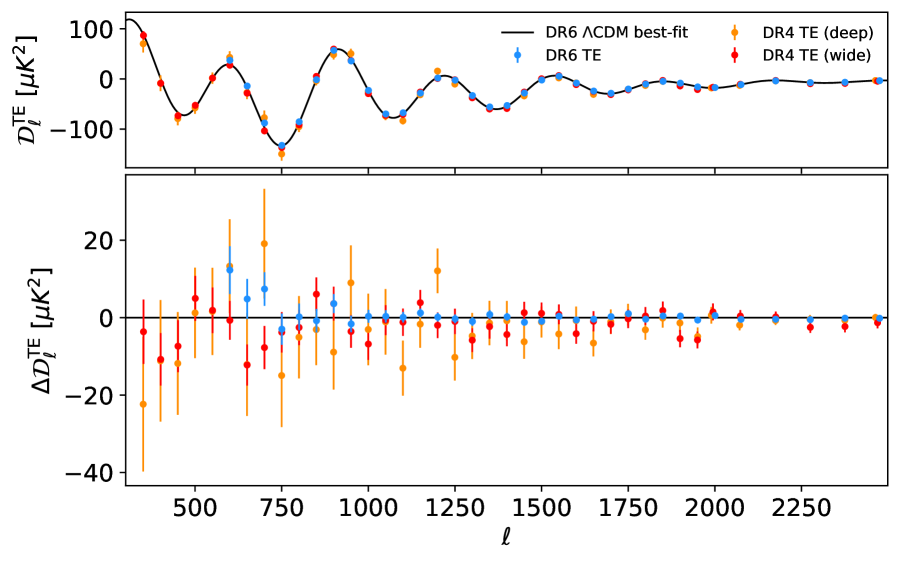
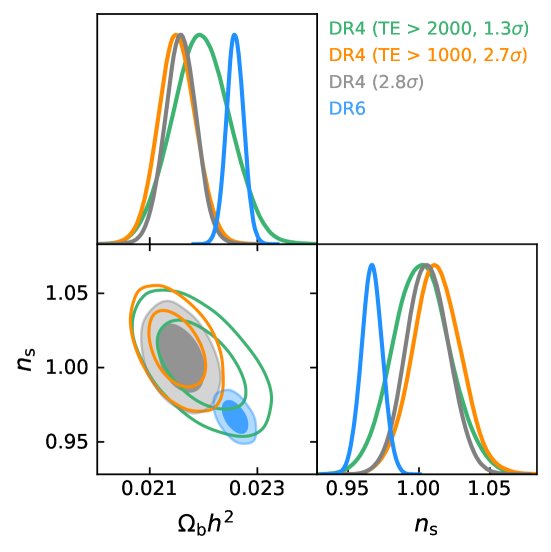
Appendix C Primordial matter power spectrum compilation
| [Mpc-1] | Prior Range |
|---|---|
| 0.01 | 0.00 – 15.0 |
| 0.03 | 0.10 – 10.0 |
| 0.10 | 0.30 – 9.00 |
| 0.32 | 0.50 – 8.00 |
| 1.06 | 1.40 – 2.60 |
| 1.23 | 1.40 – 2.40 |
| 1.43 | 1.40 – 2.40 |
| 1.66 | 1.60 – 3.30 |
| 1.92 | 1.60 – 2.30 |
| 2.23 | 1.60 – 2.20 |
| 2.59 | 1.60 – 2.20 |
| 3.00 | 1.60 – 2.20 |
| 3.48 | 1.68 – 2.14 |
| 4.03 | 1.75 – 2.06 |
| 4.68 | 1.50 – 2.10 |
| 5.42 | 1.50 – 2.10 |
| 6.29 | 1.80 – 2.05 |
| 7.29 | 1.70 – 2.00 |
| 8.45 | 1.75 – 2.00 |
| 9.81 | 1.76 – 1.95 |
| 11.4 | 1.70 – 2.00 |
| 13.2 | 1.70 – 1.93 |
| 15.3 | 1.65 – 2.00 |
| 17.7 | 1.51 – 2.12 |
| 20.6 | 1.32 – 2.30 |
| 23.8 | 1.04 – 2.55 |
| 27.7 | 0 – 4.26 |
| 32.1 | 0 – 10.7 |
| 37.2 | 0 – 20.0 |
| 43.1 | 0 – 8.46 |
The primordial power spectrum constraints presented in §4.2 are derived sampling the primordial power over 30 bins centered on specific wavenumbers, with individual flat uninformative priors as summarized in Table 5.
The measurement across bins presented in §4.2 can be mapped onto the linear matter power spectrum through the matter transfer function via
| (C1) |
where the dimensionless primordial power is converted to units of Mpc3 through the prefactor (note that is dimensionless). As done in previous works, we use this relationship to show the CMB constraints on the primordial power spectrum alongside those from late-time probes such as galaxy surveys (e.g., Tegmark & Zaldarriaga, 2002; Tegmark et al., 2004; Hlozek et al., 2012; Planck Collaboration, 2020a; Chabanier et al., 2019). Our main results for the binned posterior distributions from P-ACT-LB (Fig. 6) are projected onto the linear matter power spectrum in Fig. 52. From Fig. 6 we note that P-ACT would give similar projections. We also show the P-ACT-LB best-fit CDM model for both the linear and non-linear matter power spectrum.434343We use the HMcode-2020 (Mead et al., 2021) dark-matter-only model of the non-linear power spectrum. Other constraints are shown from the Dark Energy Survey (DES) (Troxel et al., 2018), the Sloan Digital Sky Survey (SDSS) (Reid et al., 2010), the extended Baryon Oscillation Spectroscopic Survey (eBOSS) (Abolfathi et al., 2018), and the Hubble Space Telescope (HST) measurements of the UV galaxy luminosity function (UV LF) (Sabti et al., 2022). Note that P-ACT-LB detects non-zero power at CL up to whereas the Planck-alone constraints cut off at . The bottom panel shows the residuals with respect to the P-ACT-LB best-fit linear power spectrum. At scales Mpc-1, neighboring bins are more than 50% correlated. The fact that the highest bins have mostly positive residuals is precisely why we find a slightly positive best-fit value for the running of the spectral index (in §4.1), although this is not statistically significant.
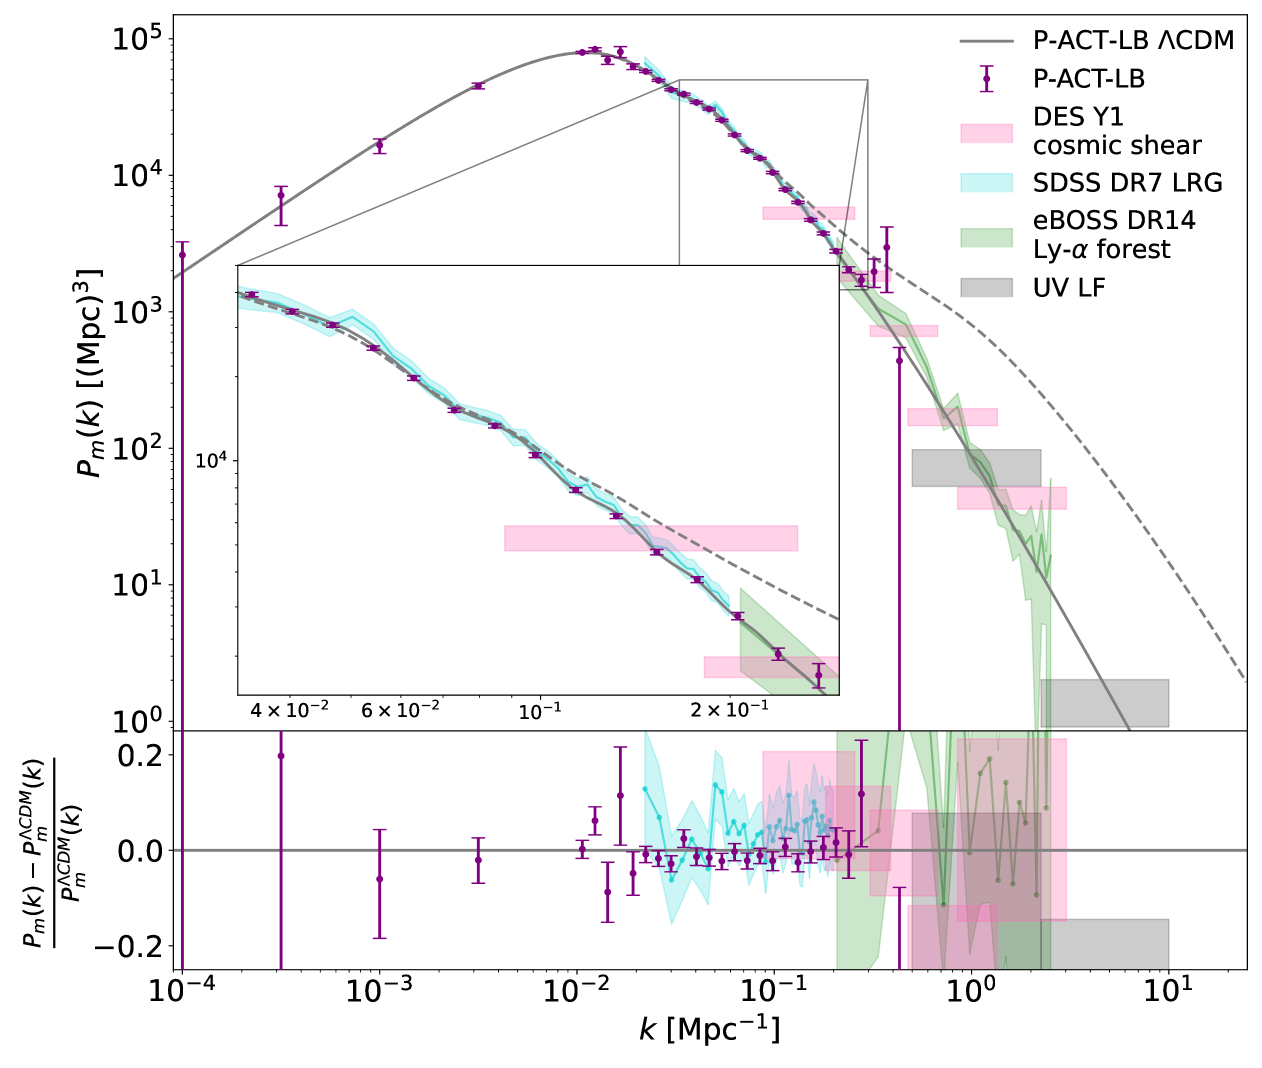
Appendix D Additional constraints on isocurvature
Table 6 presents the constraints on isocurvature models. In addition to the constraints on the amplitude of the primordial isocurvature power spectrum at two scales, we present constraints on the isocurvature power spectrum spectral index and the primordial isocurvature fraction,
| (D1) |
Overall, we find no evidence of isocurvature perturbations and impose stringent constraints on a range of isocurvature scenarios.
| Model and dataset | |||||
|---|---|---|---|---|---|
| Uncorrelated: (=1) | |||||
| CDI: Planck | |||||
| CDI: P-ACT | |||||
| CDI: P-ACT-LB | |||||
| NDI: Planck | |||||
| NDI: P-ACT | |||||
| NDI: P-ACT-LB | |||||
| Uncorrelated: (free ) | |||||
| CDI: Planck | |||||
| CDI: P-ACT | |||||
| CDI: P-ACT-LB | |||||
| NDI: Planck | |||||
| NDI: P-ACT | |||||
| NDI: P-ACT-LB | |||||
| Fully correlated: () | |||||
| CDI: Planck | |||||
| CDI: P-ACT | |||||
| CDI: P-ACT-LB | |||||
| Fully anti-correlated: () | |||||
| CDI: Planck | |||||
| CDI: P-ACT | |||||
| CDI: P-ACT-LB |
Appendix E Additional constraints on early dark energy models
Here we compare the constraints for EDE models with (our baseline) and . Figure 53 shows the marginalized posterior comparisons for various dataset combinations, and Table 8 provides the numerical constraints. As for , we find no evidence of EDE. The model is analyzed using CosmoPower-based emulators of class, whereas the model is run using camb due to instability of class for this model. These Boltzmann codes handle the EDE model in different ways: class solves the full perturbed Klein-Gordon equation, whereas camb uses an effective fluid approximation, described in Poulin et al. (2018). Some of the differences in these two approaches are described in Agrawal et al. (2023). We check that the two codes yield very similar constraints for the model.
To facilitate comparisons with earlier work, we also compare constraints on the EDE model from ACT DR4 (Hill et al., 2022) to those obtained here from ACT DR6, as shown in Fig. 54. We show results for ACT alone (DR6 versus DR4), P-ACT versus the combination of ACT DR4 with Planck 2018 TT data up to , and P-ACT-LB versus the combination of ACT DR4 with Planck 2018 TT data (), Planck 2018 CMB lensing data, and BAO data from BOSS (and pre-BOSS surveys). We consider results using BOSS BAO data here to ease the DR4-DR6 comparison. Significant portions of parameter space allowed by the DR4 data are excluded by the DR6 data, and the moderate hint of non-zero EDE in DR4 is no longer present in the more-sensitive DR6 dataset (see also Appendix B). However, we also see a narrow degeneracy direction in the parameter posteriors (e.g., in the – panel) that is difficult to probe. Future experiments, such as the Simons Observatory and CMB-S4, will be needed to fully break this degeneracy and robustly detect or exclude pre-recombination EDE (see, e.g., Kou & Lewis 2025).
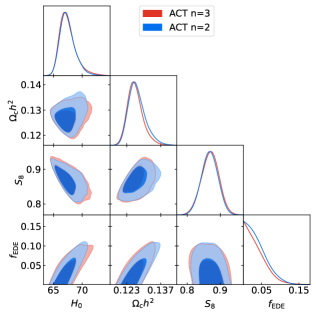
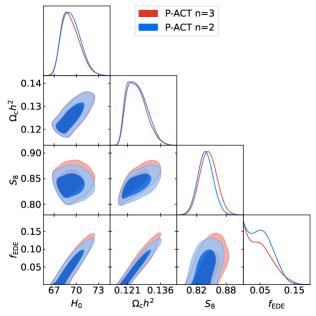
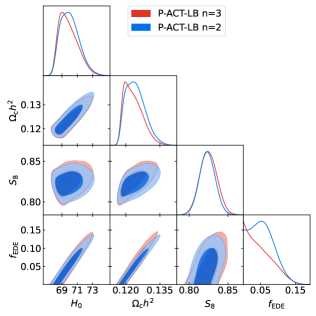
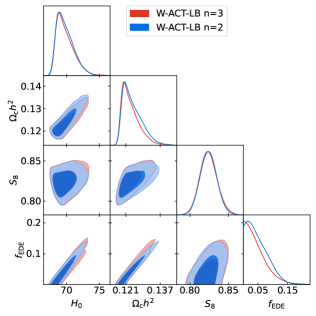
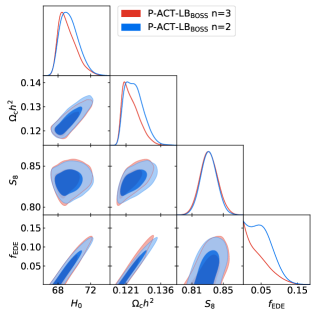
| Pref. (in ) | |||||
|---|---|---|---|---|---|
| ACT | 3.04 | ||||
| P-ACT | 3.52 | ||||
| P-ACT-LB | 3.50 | ||||
| W-ACT-LB | 3.49 |
| Dataset | |||||||
|---|---|---|---|---|---|---|---|
| ACT | |||||||
| P-ACT | |||||||
| P-ACT-LB | |||||||
| W-ACT-LB | |||||||
| P-ACT-LB | |||||||
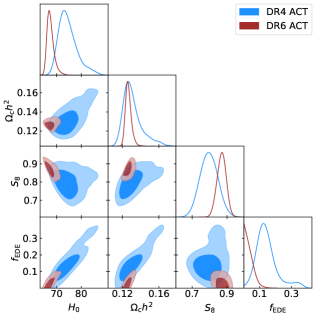
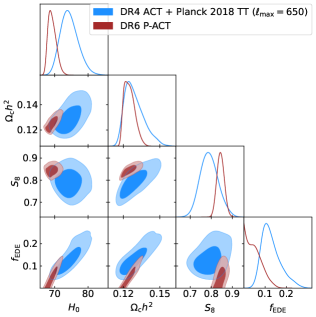
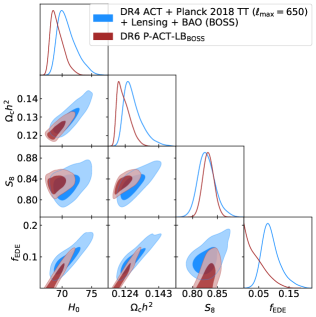
Appendix F Additional constraints on modified recombination
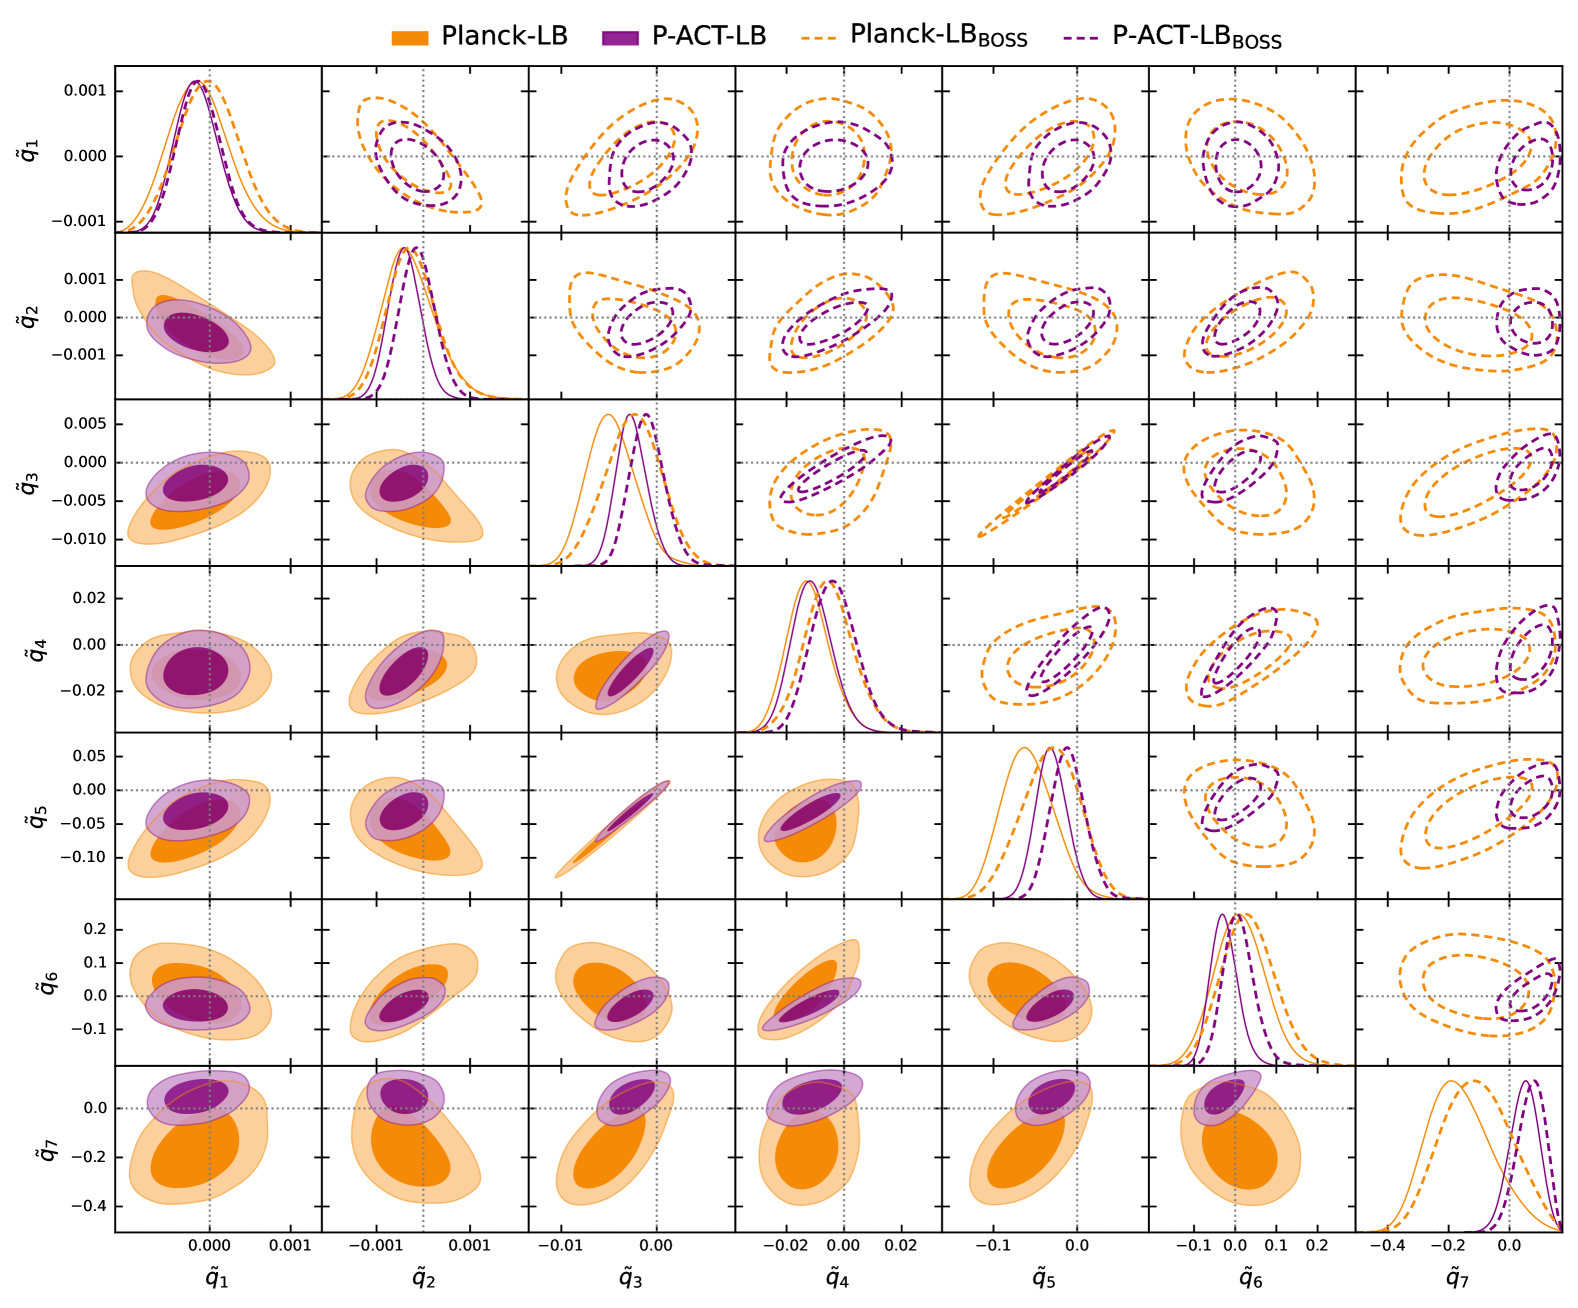
Figure 55 shows the marginalized parameter posteriors for the control points444444See Lynch et al. (2024b) for the definition of . varied in the ModRec scenario studied in §5.5. The lower triangle plot, shown with solid contours, compares the constraints from Planck-LB (orange) and P-ACT-LB (purple). The upper triangle plot, shown with dashed contours, compares the constraints from (orange) and P-ACT-LB (purple). Including ACT data significantly improves the constraints on the control points, yielding stringent bounds on the cosmological recombination history, which we find to be consistent with the standard recombination scenario (=0; dotted gray lines) within 2 across all control points analyzed in the ModRec model. Note that the control points in neighboring redshift bins can be highly correlated.