11email: szaszi@titan.physx.u-szeged.hu 22institutetext: MTA-ELTE Lendület ”Momentum” Milky Way Research Group, Szent Imre H. st. 112, 9700 Szombathely, Hungary 33institutetext: Department of Physics and Astronomy, Johns Hopkins University, Baltimore, MD 21218, USA 44institutetext: Space Telescope Science Institute, 3700 San Martin Drive, Baltimore, MD 21218, USA 55institutetext: DARK, Niels Bohr Institute, University of Copenhagen, Jagtvej 128, 2200 Copenhagen, Denmark 66institutetext: Department of Astrophysical Sciences, Princeton University, Princeton, NJ 08544, USA 77institutetext: Sterrenkundig Observatorium, Ghent University, Krijgslaan 281 – S9, 9000 Gent, Belgium 88institutetext: Steward Observatory, University of Arizona, 933 N. Cherry St, Tucson, AZ 85721, USA 99institutetext: Department of Astronomy, University of California, Berkeley, CA 94720-3411, USA 1010institutetext: Caltech/IPAC, Mailcode 100-22, Pasadena, CA 91125, USA 1111institutetext: Gemini Observatory, 670 N. Aohoku Place, Hilo, Hawaii, 96720, USA 1212institutetext: Department of Physics, Virginia Tech, Blacksburg, VA 24061, USA 1313institutetext: Department of Physics & Astronomy, Louisiana State University, Baton Rouge, LA, 70803 USA 1414institutetext: Institut d’Astrophysique de Paris, CNRS–Sorbonne Université, 98 bis boulevard Arago, F-75014 Paris, France 1515institutetext: NASA at Goddard Space Flight Center, Code 665, Greenbelt, MD 20771, USA 1616institutetext: Center for Astrophysics — Harvard & Smithsonian, 60 Garden Street, Cambridge, MA 02138-1516, USA 1717institutetext: Oskar Klein Centre, Department of Physics, Stockholm University, AlbaNova, SE-10691 Stockholm, Sweden 1818institutetext: Purdue University, Department of Physics and Astronomy, 525 Northwestern Ave, West Lafayette, IN 47907, USA 1919institutetext: Integrative Data Science Initiative, Purdue University, West Lafayette, IN 47907, USA 2020institutetext: Department of Astronomy and Astrophysics, University of California, Santa Cruz, CA 95064, USA 2121institutetext: National Astronomical Research Institute of Thailand, 260 Moo 4, Donkaew, Maerim, Chiang Mai, 50180, Thailand 2222institutetext: MIT-Kavli Institute for Astrophysics and Space Research, 77 Massachusetts Ave., Cambridge, MA 02139, USA 2323institutetext: Cahill Center for Astrophysics, California Institute of Technology, 1200 E. California Blvd. Pasadena, CA 91125, USA 2424institutetext: NSF’s NOIRLab, 950 N. Cherry Avenue, Tucson, 85719, AZ, USA 2525institutetext: European Space Agency (ESA), ESAC, 28692 Villanueva de la Canada, Madrid, Spain 2626institutetext: Department of Astronomy, University of Virginia, Charlottesville, VA 22904-4325, USA 2727institutetext: X-ray Astrophysics Laboratory, NASA / Goddard Space Flight Center (GSFC), Greenbelt, MD 20771, USA 2828institutetext: Department of Physics, College of Physical Sciences and Technology, Hebei University, Wusidong Road 180, Baoding 071002, China 2929institutetext: Department of Physics, College of Physical Sciences and Technology, Hebei University, Wusidong Road 180, Baoding 071002, China
JWST/MIRI detects the dusty SN1993J about 30 years after explosion
Abstract
Context. Core-collapse supernovae (CCSNe) have long been considered to contribute significantly to the cosmic dust budget. New dust cools quickly and is therefore detectable at mid-infrared (mid-IR) wavelengths. However, before the era of the James Webb Space Telescope (JWST), direct observational evidence for dust condensation was found in only a handful of nearby CCSNe, and dust masses ( M⊙, generally limited to yr and to K temperatures) have been 2–3 orders of magnitude smaller than either theoretical predictions or dust amounts found by far-IR/submm observations of Galactic SN remnants and in the very nearby SN 1987A.
Aims. As recently demonstrated, the combined angular resolution and mid-IR sensitivity of JWST finally allow us to reveal hidden cool (–200 K) dust reservoirs in extragalactic SNe beyond SN 1987A. Our team received JWST/MIRI time for studying a larger sample of CCSNe to fill the currently existing gap in their dust formation histories. The first observed target of this program is the well-known Type IIb SN 1993J appeared in M81.
Methods. We generated its spectral energy distribution (SED) from the current JWST/MIRI F770W, F1000W, F1500W, and F2100W fluxes. We fit single- and two-component silicate and carbonaceous dust models to the SED in order to determine the dust parameters.
Results. We found that SN 1993J still contains a significant amount ( M⊙) of dust yr after explosion. Comparing these results to those of the analysis of earlier Spitzer Space Telescope data, we see a similar amount of dust now that was detected –20 yr ago, but at a lower temperature (noting that the modeling results of the earlier Spitzer SEDs have strong limitations). We also find residual background emission near the SN site (after point-spread-function subtraction on the JWST/MIRI images) that may plausibly be attributed to an IR echo from more distant interstellar dust grains heated by the SN shock-breakout luminosity or ongoing star formation in the local environment.
Key Words.:
supernovae: general – supernovae: individual: SN 1993J – dust, extinction1 Introduction
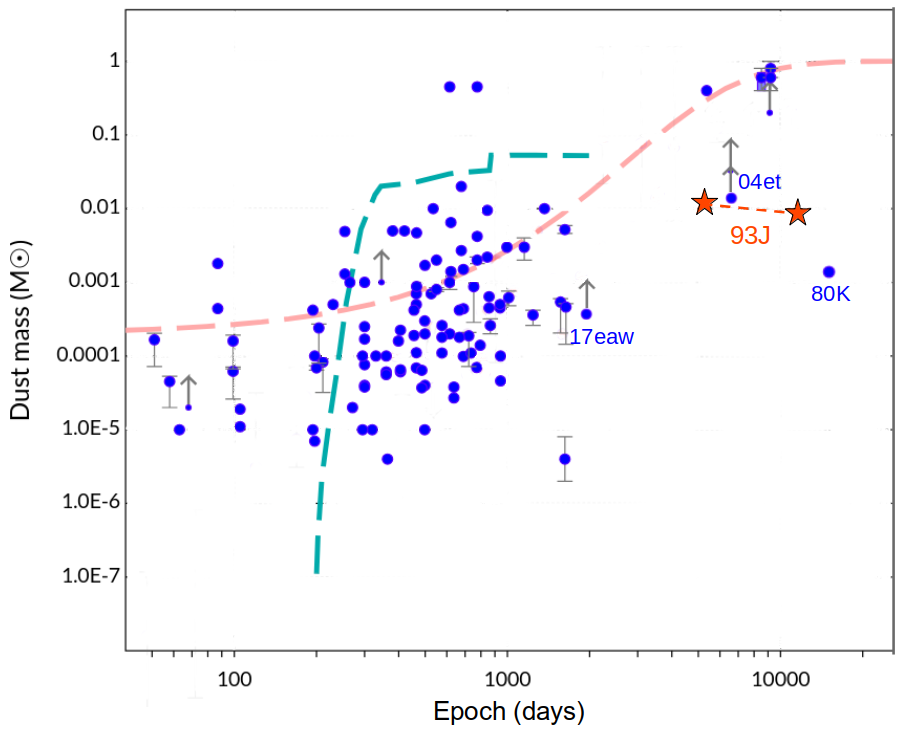
Core-collapse supernovae (CCSNe), the energetic final explosions of evolved massive ( M⊙) stars, offer unique possibilities to (i) study extreme physical processes, (ii) uncover details about pre-explosion stellar evolution, and (iii) measure cosmic distances. While most CCSNe fade over the course of several months to years, the Spitzer Space Telescope (Spitzer) “Warm” (post-cryogenic) mission (i.e., 3.6 and 4.5 m) highlighted a subset of dusty SNe that can remain bright for many years, even decades, post-explosion (e.g., Fox et al. 2010, 2011, 2013; Tinyanont et al. 2016; Szalai et al. 2019, 2021). The increased sensitivity of the James Webb Space Telescope (JWST) and its access to even longer wavelengths (e.g., 25 m) has resurrected the transient community’s interest in such dusty SNe. The origin and heating mechanism of the dust can have several important implications. If the dust is newly formed in the ejecta, the inferred dust masses could provide the much sought-after evidence supporting SNe as significant sources of dust in the Universe (e.g., Dwek et al. 2007). If there is also or only pre-existing dust in the circumstellar medium (CSM) at the time of explosion, it can be used as a proxy to trace the pre-SN mass-loss history and constrain the progenitor system (e.g., Fox et al. 2011).
Up to the beginning of the JWST era, there have been only a few objects also observed at longer mid-IR wavelengths: several Type II-P SNe up to a few years old (e.g., Kotak et al. 2009; Fabbri et al. 2011; Meikle et al. 2011; Szalai et al. 2011; Szalai & Vinkó 2013), as well as older objects like SNe 1978K (Tanaka et al. 2012), 1980K (Sugerman et al. 2012), or 1995N Van Dyk (2013). However, only the famous, nearby SN 1987A in the Large Magellanic Cloud was possible to study in detail not just by Spitzer (Bouchet et al. 2006; Dwek et al. 2010; Arendt et al. 2020), but also in the far-IR/submm regime (via Herschel and ALMA, see Matsuura et al. 2011, 2019; Indebetouw et al. 2014). Thus, for the most dusty extragalactic SNe, we have no information on temperatures K, where the bulk of the dust is thought to reside — as was also shown by recent far-IR and submm observations of old Galactic SN remnants (SNRs) like Cassiopeia A (Barlow et al. 2010; Sibthorpe et al. 2010; Arendt et al. 2014) and the Crab (Gomez et al. 2012; Temim & Dwek 2013; De Looze et al. 2019). A number of questions remain and the phase space of such observations (in terms of mass/temperature of dust vs. SN age) remains relatively unpopulated. Moreover, it should be noted that while Spitzer had good mid-IR sensitivity, its angular resolution was too poor to separate most extragalactic SNe from their nearby host-galaxy emission from star-forming regions, H ii regions, etc. (especially at 20 m).
JWST offers a new opportunity to detect the late phases of cool (–200 K) dust in extragalactic SNe beyond SN 1987A. JWST has the potential to detect (i) cooler dust grains at wavelengths m, (ii) the 10 m silicate feature that can distinguish grain compositions, and (iii) faint emission from the SN at very late epochs that would have gone undetected by Spitzer and any other mid-IR spacecraft. Only a few months after the start of its scientific mission, JWST has achieved important results in this field. Our team has already detected a significant amount of cool dust in SNe IIP 2004et and 2017eaw (Shahbandeh et al. 2023), as well as in SN IIL 1980K (Zs´ıros et al. 2024). In SN 2004et, the observations have uncovered the largest newly formed ejecta dust masses in an extragalactic SN other than SN 1987A, with M⊙ of dust at a temperature of K.
In this paper, we present JWST observations of another nearby, famous event, SN 1993J. This object is the prototype of Type IIb explosions, which form a transitional group between H-rich Type II and H-free Type Ib/c CCSNe (see, e.g., Filippenko 1988, 1997; Filippenko et al. 1993; Nomoto et al. 1993) and constitute about 10% of core-collapse SNe (Smith et al. 2011). Owing to its proximity ( Mpc; Freedman et al. 2001) and its fortunate location in the outskirts of the host galaxy, M81, SN 1993J has become one of the best-observed SNe, possessing various long-term multiwavelength datasets and detailed analyses published in the literature. We also know much about its progenitor system. The exploding star, likely a K0-type red supergiant (RSG), was directly identified in pre-explosion images (Aldering et al. 1994; Cohen et al. 1995), and had disappeared years after explosion (Maund & Smartt 2009). The progenitor may have been a member of a massive binary system (Maund et al. 2004) with a hotter (B2 type) companion that likely was directly detected (Fox et al. 2014).
SN 1993J also showed various signs of ongoing interaction between the shock and the circumstellar material (CSM) from early to late phases in the optical, radio, and X-ray bands (e.g., Matheson et al. 2000; Weiler et al. 2007; Chandra et al. 2009; Smith et al. 2017); see Zs´ıros et al. (2022, hereafter Z22) for a recent review. Note that SN 1993J is one of the very few extragalactic SNe besides SN 1987A where, via very-long-baseline radio interferometry, it was possible to resolve how the expanding SN shock is running into the CSM (Bietenholz et al. 2001, 2003; Bartel et al. 2002). Signs of dust formation have been published based on early-time near-IR observations (Matthews et al. 2002) and late-time optical spectral analysis (Smith et al. 2017; Bevan et al. 2017). In Z22, some of us presented a detailed analysis of the complete Spitzer mid-IR light curve (LC) and spectral energy distribution (SED), and modeling of the object (part of the Spitzer LC was also published by Tinyanont et al. 2016).
With the recent JWST data, SN 1993J becomes one of the few SNe for which a dust-formation history can be followed during the first decades after explosion. In Section 2, we describe the steps of data reduction, while Section 3 presents the results of our analysis based on modeling the recent mid-IR SED. We discuss our findings in Section 4 and summarize our conclusions in Section 5.
2 Observations and data reduction
JWST observing program #3921 (PI O. D. Fox) 111https://www.stsci.edu/jwst/science-execution/program-information?id=3921 is designed as a SURVEY to image a large, diverse sample of SNe with the Mid-Infrared Instrument (MIRI; Bouchet et al. 2015; Ressler et al. 2015; Rieke et al. 2015; Rieke & Wright 2022). The observations are being acquired in the F770W, F1000W, F1500W, and F2100W filter bands, using the FASTR1 readout pattern in the FULL array mode and a 4-point extended source dither pattern. A description of our detailed calibration process of the JWST/MIRI images was recently published by Shahbandeh et al. (2023). We use the JWST HST Alignment Tool (JHAT; Rest et al. 2023) to align JWST and HST images of the fields (when available) with each other.
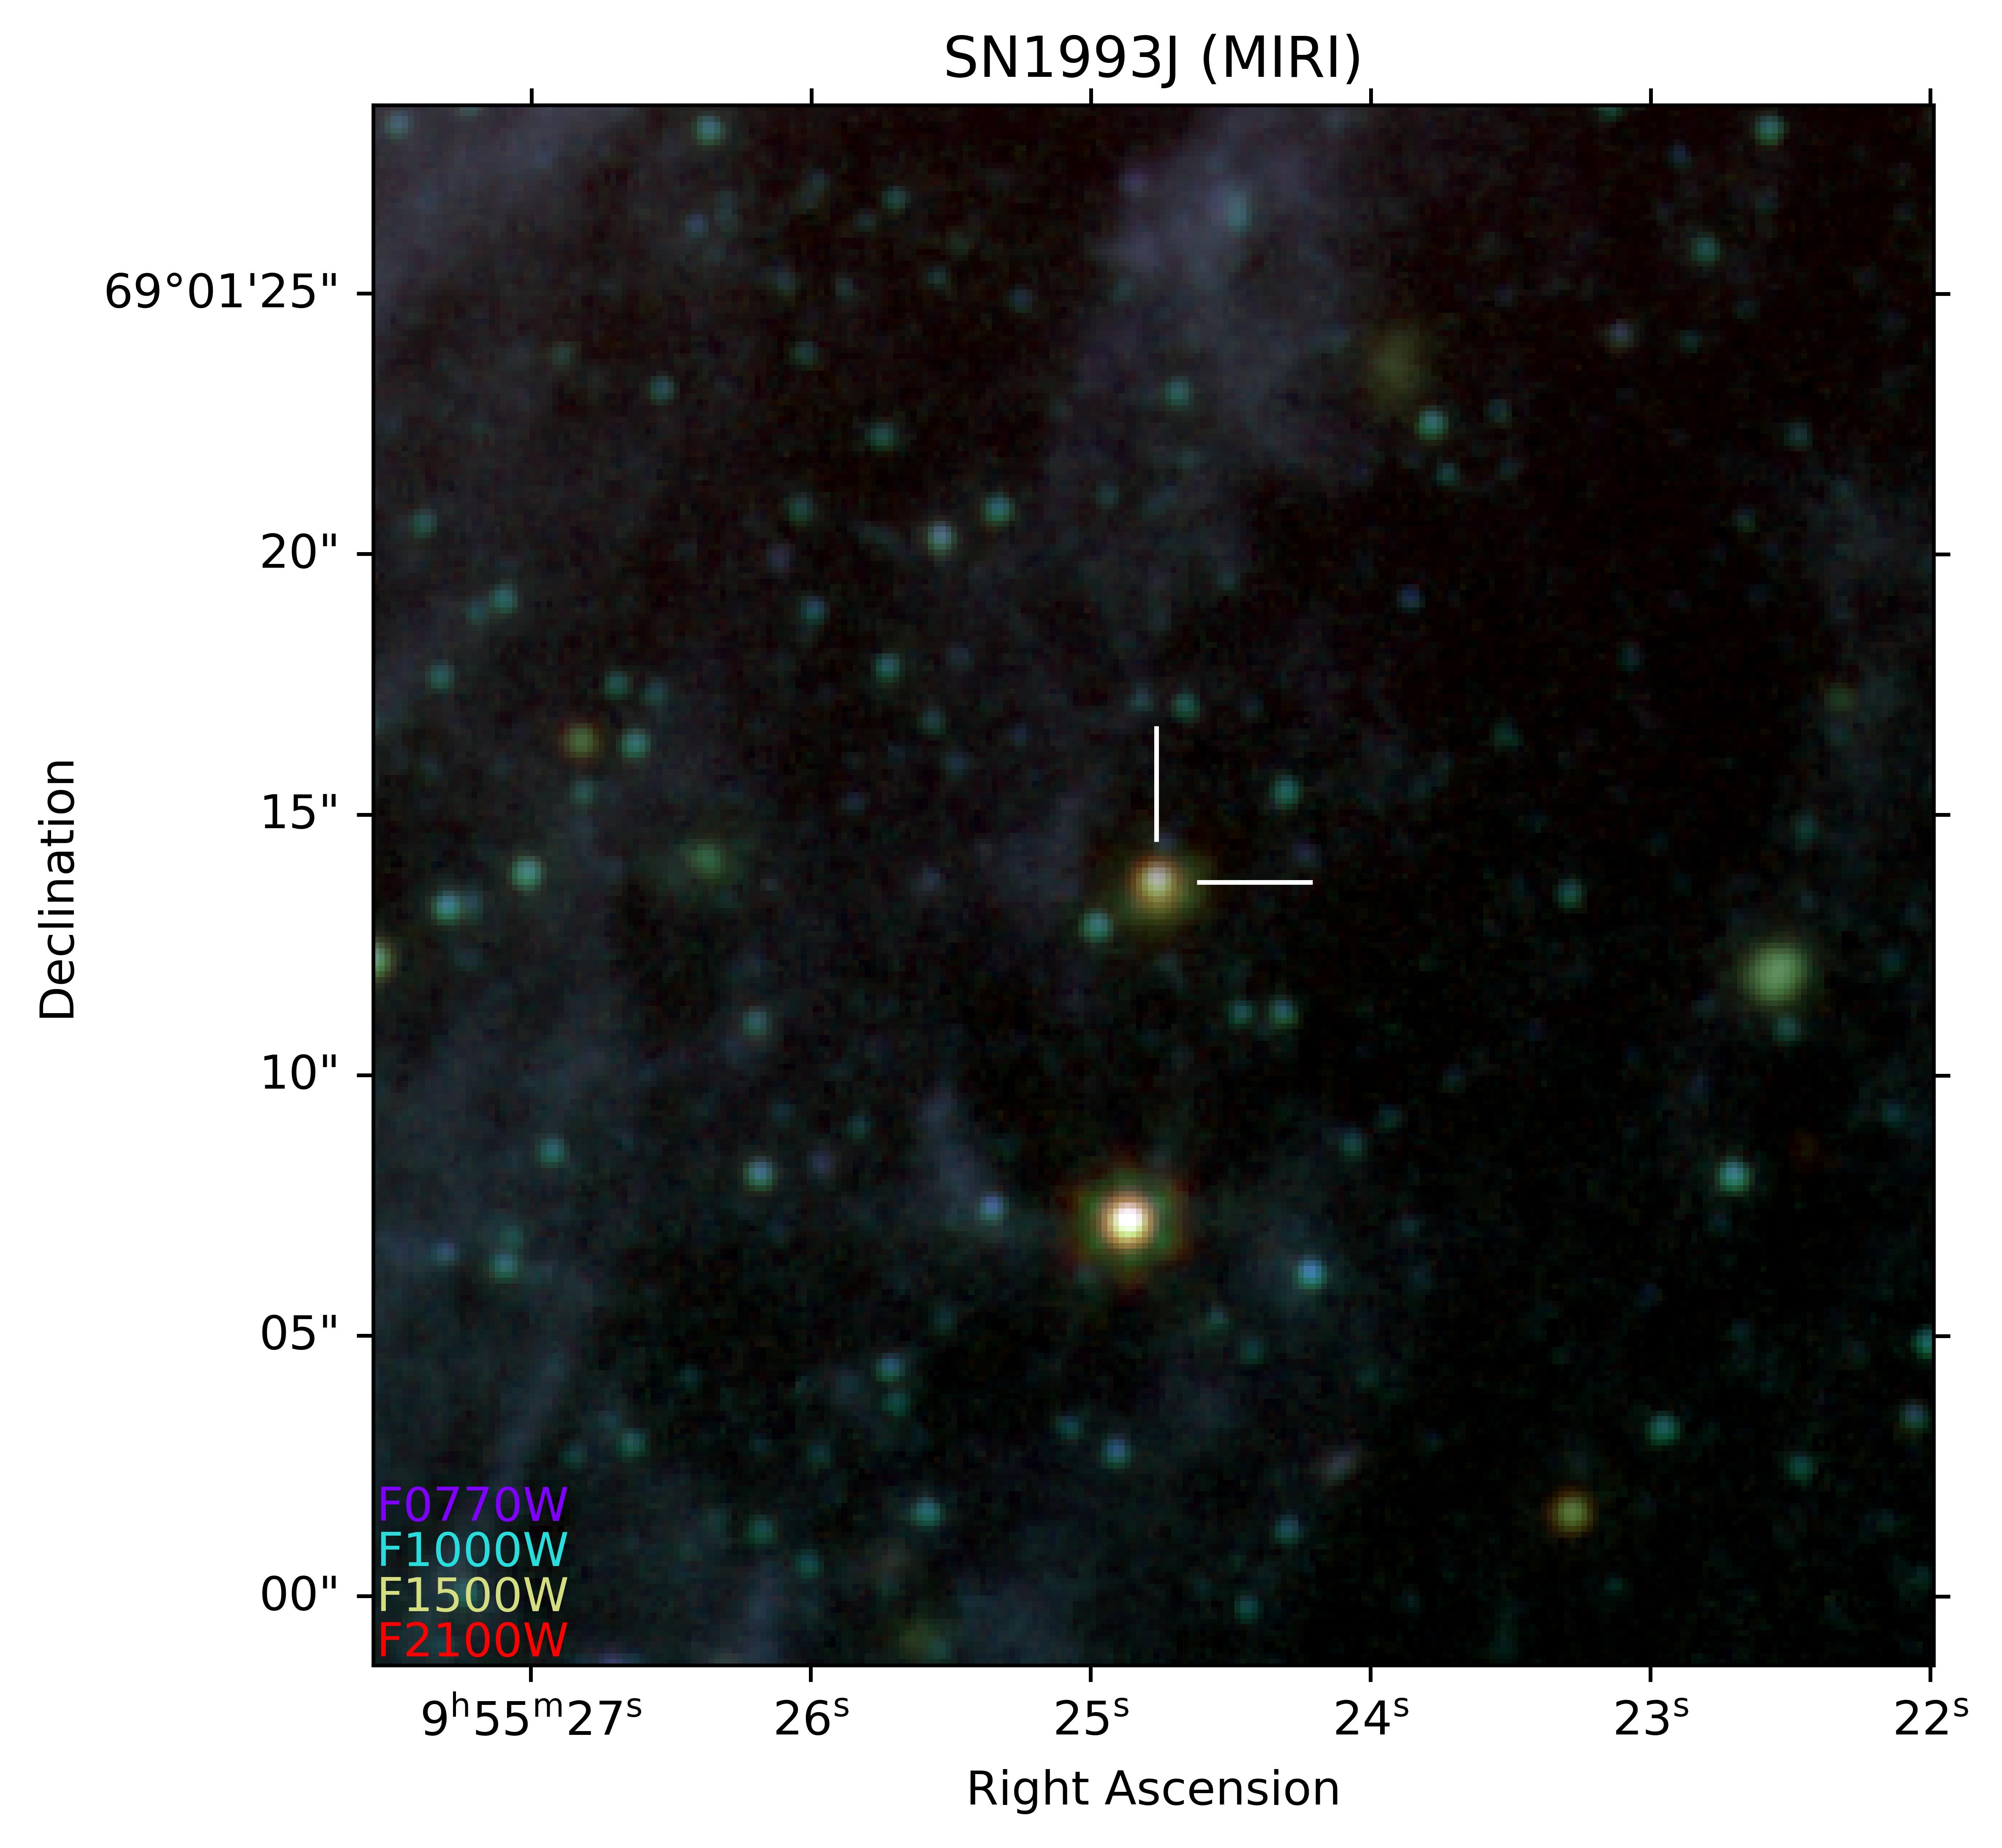
The first observed target of the SURVEY 3921 program was SN 1993J; MIRI images were obtained on 2024 Feb. 13.6 UTC (11,280 days after explosion, = 49074.0 MJD, Lewis et al. 1994). The SN can be identified as a clear and bright point source at all wavelengths from 7.7 to 21.0 m; see a composite image of the field in Fig. 1.
To measure the fluxes of SN 1993J in JWST/MIRI images, we followed the method described in detail by Shahbandeh et al. (2023). We performed point-spread-function (PSF) photometry on background-subtracted level-two data products using WebbPSF (Perrin et al. 2014) implemented in the space-phot package222https://zenodo.org/records/12100100 (Pierel 2024). We experimented with multiple PSF sizes in the fitting that variably resulted in underestimation or overestimation of the local background emission. The resulting fluxes of all four dithers of each filter were then averaged, and we incorporate the variations seen from using multiple PSF sizes into our estimates of the measurement uncertainties. We examine the local background emission from the PSF-fitting residuals in more detail in Section 3.3. The total (Galactic + host) reddening value of = 0.190.09 mag (Richardson et al. 2006) implies that the extinction is negligible in the mid-IR range. The final results of our JWST/MIRI photometry of SN 1993J are presented in Table 1.
| Filter | AB mag | ||
|---|---|---|---|
| (Jy) | erg s-1 cm-2 Å-1 | ||
| F770W | 20.520.04 | 22.51.0 | (1.140.04) |
| F1000W | 19.880.05 | 40.61.9 | (1.220.06) |
| F1500W | 18.390.18 | 160.026.5 | (2.130.35) |
| F2100W | 17.430.06 | 387.321.4 | (2.630.15) |
During the analysis described in Sect. 3.2, we also used a single unpublished late-time optical spectrum of SN 1993J obtained with the Keck Low Resolution Imaging Spectrometer (LRIS; Oke et al. 1995) on 2018 Dec. 03 (at epoch 9381 days), see Fig. 2. The spectrum was acquired with the slit oriented at or near the parallactic angle to minimise slit losses caused by atmospheric dispersion (Filippenko 1982). The LRIS observation utilised the -wide slit, 600/4000 grism, and 400/8500 grating to produce a similar spectral resolving power (–1200) in the red and blue channels. Data reduction followed standard techniques for CCD processing and spectrum extraction using the LPipe data-reduction pipeline (Perley 2019). Low-order polynomial fits to comparison-lamp spectra were used to calibrate the wavelength scale, and small adjustments derived from night-sky lines in the target frames were applied. The spectrum was flux calibrated using observations of appropriate spectrophotometric standard stars observed on the same night, at similar airmasses, and with an identical instrument configuration.

3 Analysis
3.1 Modeling of the mid-IR SEDs of SN 1993J
Mid-IR (continuum) excess relative to the Rayleigh-Jeans tail in the late-time SED of an SN typically indicates the presence of dust. As described above, this dust may be (i) newly formed, in either the inner unshocked ejecta or in the cool dense shell (CDS) of post-shocked gas lying between the forward and reverse shocks, and/or (ii) pre-existing, formed in a steady wind from the progenitor or during a short-duration pre-SN outburst. In either case, different heating mechanisms, geometries, grain composition and size distribution, and dust clumpiness effects should be taken into account to find a proper description of the physical background of the observed mid-IR radiation; see more details provided by for example, Shahbandeh et al. (2023, and references therein).
A detailed analysis of the properties of the dust content and its possible origin and heating effects is described by Z22, based on the full Spitzer dataset of the event obtained between 2003 and 2019 (10–26 yr after explosion). The conclusion of this study was that all the dust suggested by Spitzer data can be newly formed and is located in the inner ejecta and/or in the CDS; this picture is also strengthened by the modeling of red-blue line-profile asymmetries found in late-time optical spectra of the object (Bevan et al. 2017; Smith et al. 2017). At the same time, the results of Z22 also allow for the presence of pre-existing dust, heated collisionally by hot gas in the reverse shock (assuming a possible range of 5000–15,000 km s-1 for the shock velocity), or (more likely) radiatively by energetic photons from shock-CSM interaction.

Here we do not repeat all the steps presented by Z22 but examine (i) the validity of the conclusions of the previous work, and (ii) the points where new JWST data allow us to carry out an even more detailed analysis.
First, we compare the fluxes of SN 1993J measured by JWST/MIRI (day 11,280 post-explosion) to those measured by Spitzer (between days 3893 and 5359) and published by Z22. The evolution of the mid-IR SEDs of the object between days 3893 and 11,280 is shown in Fig. 3. JWST fluxes are an order of magnitude lower than the earlier ones and the shape of the SED seems to shift toward lower temperatures. Note that there are further Spitzer/IRAC 3.6 and 4.5 m data up to days; the SN shows continuously decreasing fluxes at both wavelengths (see Tinyanont et al. 2016, and Z22). We also note that recent JWST imaging strengthens our previous assumption that the environment of SN 1993J is relatively smooth with a low local IR background (see Fig. 1). It gives further justification for the reliability of our previously published Spitzer photometry (there was no possibility for subtracting pre-explosion images; see Z22).
Next, we carry out a simple analytic modeling of the JWST/MIRI SED of SN 1993J described by Hildebrand (1983) (similarly to the work of Z22 on Spitzer SEDs). This method assumes only the thermal emission of an optically thin dusty shell at a single equilibrium temperature , with a dust mass of and particle radius of . The observed flux of the dust can then be written as
| (1) |
where is the Planck function, is the dust mass absorption coefficient, and is the distance to the source.
For building the model SEDs, we calculated filter-integrated fluxes using Eq. 1 convolved with the JWST/MIRI filter transmission profiles and fit them to the JWST data. Note that, while our group (Shahbandeh et al. 2023) adopted a more general formalism from Dwek et al. (2019) allowing for the presence of optically thick dust, we focus here only on the optically thin case because of the decades-long age of the SNR (just as we did in the case of SN 1980K; Zs´ıros et al. 2024). We also note that using only Eq. 1 does not allow us to take into account various geometries or clumpiness factors; this avoids the overinterpretation of a four-point SED and leads us rather to draw conclusions based on the parameters determined from the simplest assumptions. Nevertheless, we must handle all the constraints of this model carefully.
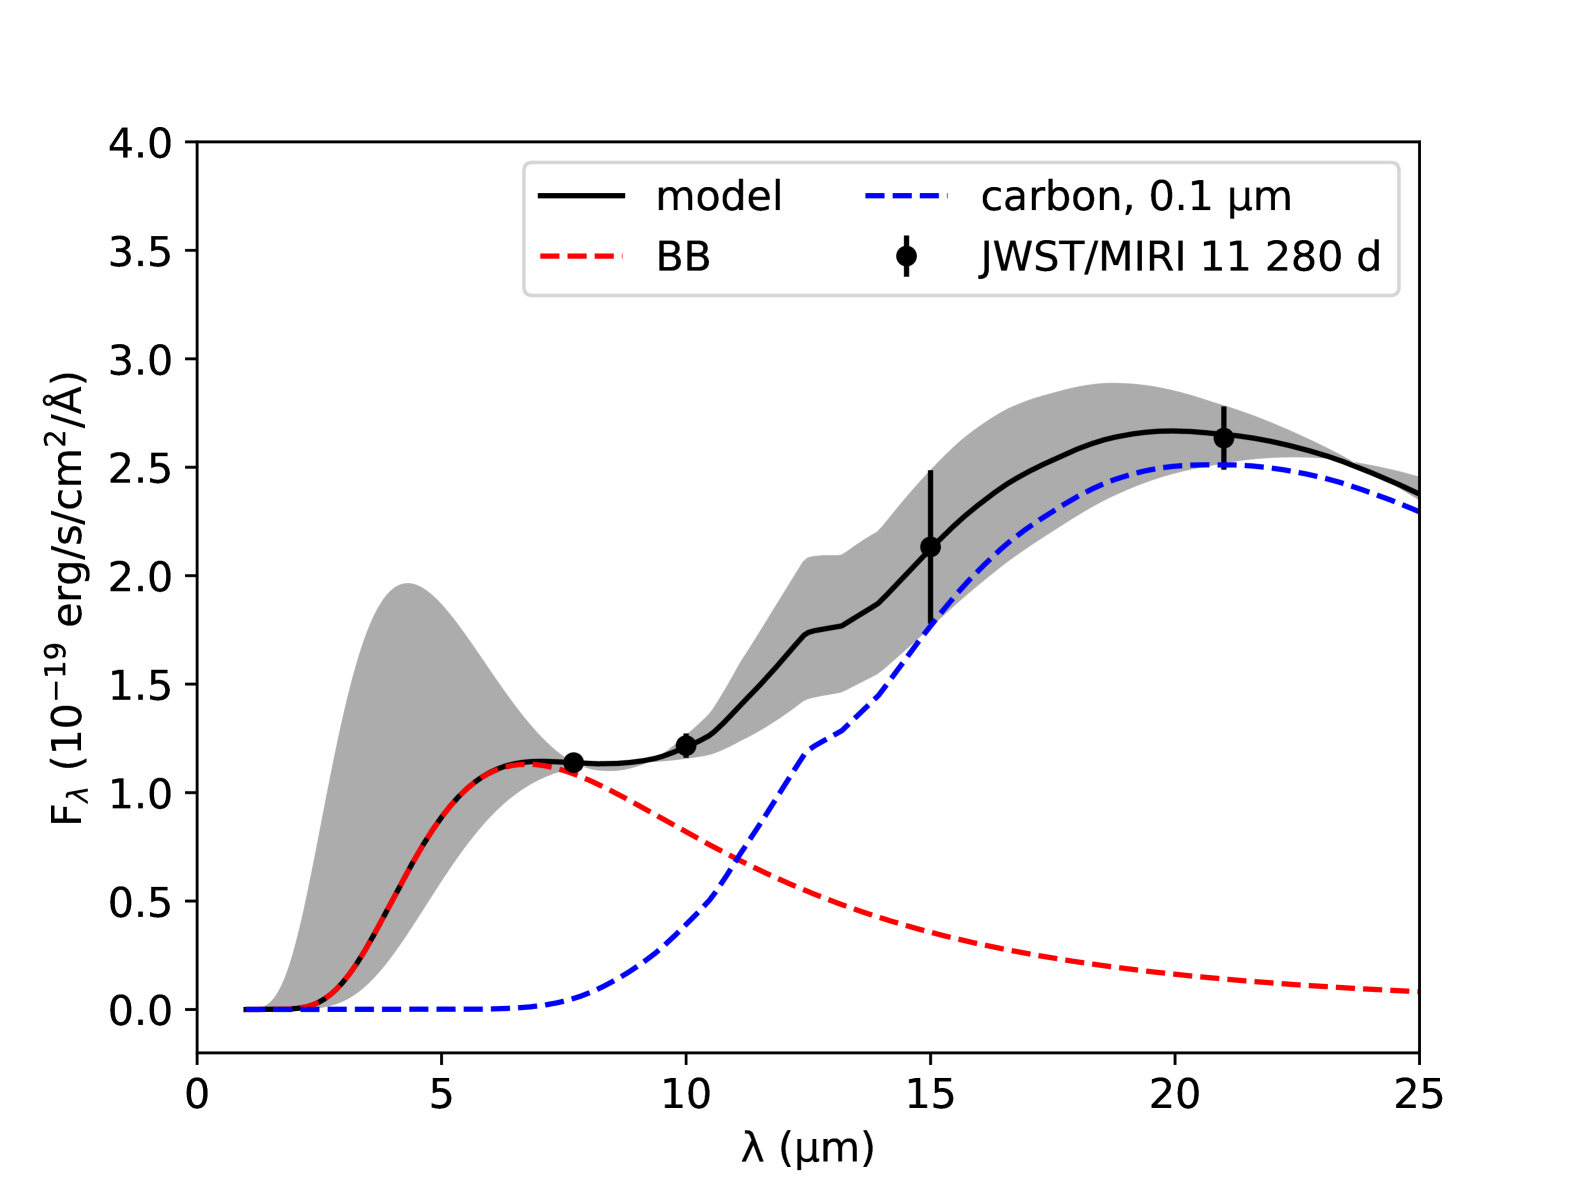
From the previously published Spitzer dataset, it was difficult to infer the dust composition in SN 1993J. These data do not cover the 8–24 m range (except for a single, noisy Spitzer/IRS spectrum obtained in 2008), which could have been critical for disentangling the spectral features of Si-rich and carbonaceous dust. Thus, in Z22, both amorphous carbon and silicate dust models were fitted to the Spitzer SEDs. In the case of the current JWST dataset, fluxes measured with the F1000W, F1500W, and F2100W filters could be more helpful in revealing the true dust composition.
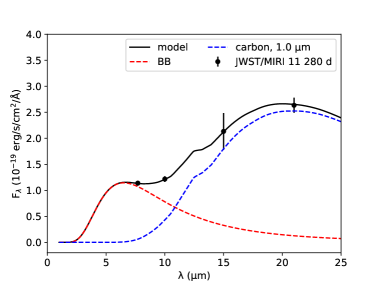
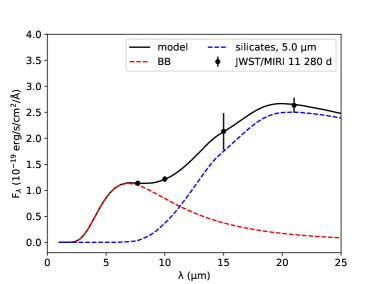
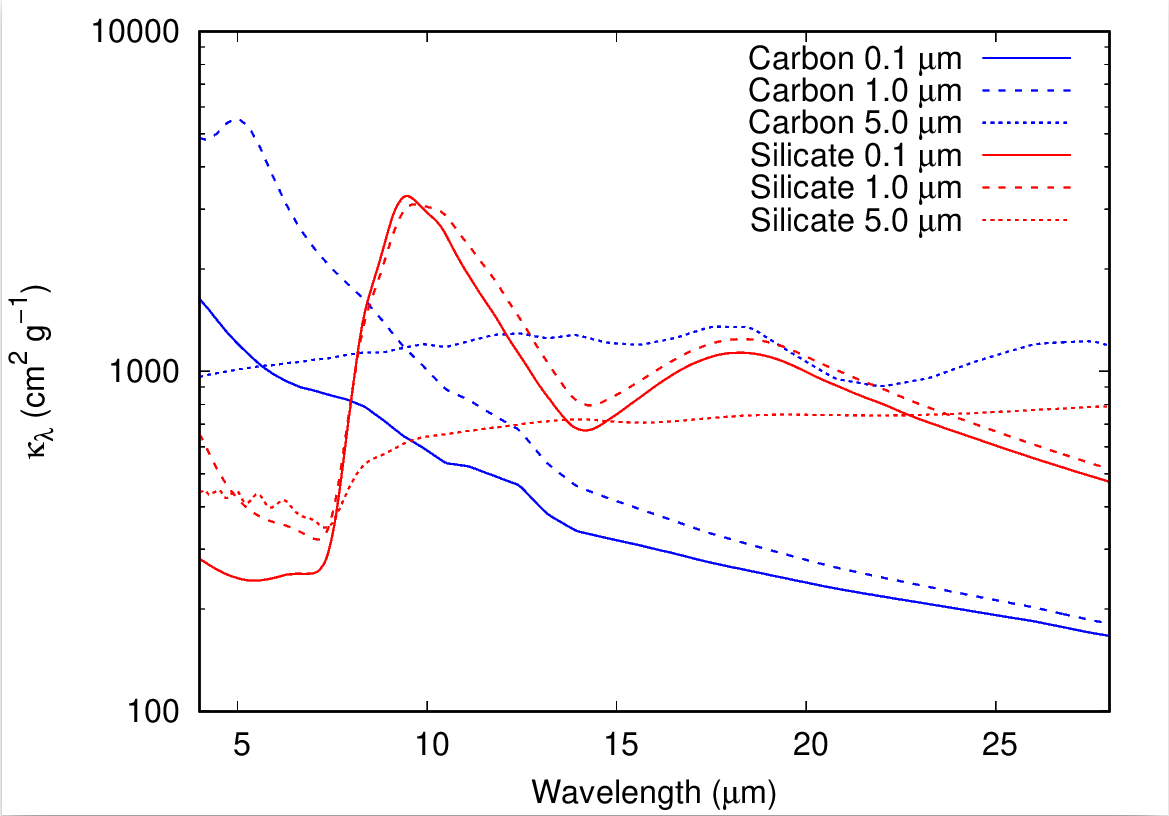
Following Shahbandeh et al. (2023), the absorption and emission properties for amorphous carbon (amC) and silicate grains are obtained from Zubko et al. (2004) and Draine & Li (2007), respectively (see Sarangi 2022 for the values of absorption coefficients ). As a first step, we applied a 0.1 m grain size, just as we did before in our previous JWST/MIRI data papers (Shahbandeh et al. 2023; Zs´ıros et al. 2024) (and as also did by Z22 for the Spitzer data analysis of SN 1993J). We found that the four-point day-11,280 JWST/MIRI SED of SN 1993J cannot be properly fitted with any single-component amC or silicate dust models. While the measured 7.7 m flux appears to show an excess with respect to each single-component model, we added a hot blackbody (BB) component and obtained an adequate fit assuming a cold amC dust component associated with a hot BB (see Fig. 4). m silicate models do not result in reasonable fits even in the two-component cases.
Following our referee’s advice, we also performed the SED fitting assuming larger (=1.0 and 5.0 m) grain radii. We found that even this choice does not allow us to find good single-component solutions; nevertheless, two-component models work if we use =1.0/5.0 m amC or =5.0 m silicate dust associated with a hot BB (see Fig. 8 in Appendix A). Note, however, that such large grains are not expected in SNe at this phase (especially in SNe IIb, see in Sect. 4); furthermore, this dataset does not allow us to truly disentangle models with different grain-size distributions. Thus, from now on, we refer to the results of the original fit assuming a cold =0.1 m amC dust + a hot BB.
Since fitting a two-component model to only four SED points leads to unphysically low parameter uncertainties, we repeated the fit based on the upper and lower constraints placed on the JWST/MIRI fluxes by the photometric uncertainties in Table 1. Thus, the cold dust component has an inferred mass of = (8.9) M⊙ and a temperature of K. For the average flux values, we also calculated the luminosity and the BB radius of the cold components (i.e., the minimum size of an optically thin, spherical dust-forming region), finding erg s-1 and cm. As Fig. 3 already suggested, the current value of is well below those measured from Spitzer SEDs from yr prior [(10.0–15.6) erg s-1; see Z22].
As can be recognized from Fig. 4, how the assumed hot component affects the parameters of the cold dust component can be an important question here. A similar hot gas/dust component has been previously detected in other decades-old SNe such as SN 1980K (Zs´ıros et al. 2024), SN 1987A (Dwek et al. 2010; Arendt et al. 2016, 2020), and SN 2004et (Shahbandeh et al. 2023). The general assumption is ongoing circumstellar interaction in the close environment of these SNe, and this is the case for SN 1993J as well: as mentioned above, SN 1993J has shown various signs of CSM interaction and, based on long-term monitoring of its optical spectra, this level remains strong even yr after explosion (see Milisavljevic et al. 2012; Smith et al. 2017, and Fig. 5 of this work).
Nevertheless, based on JWST data alone, we cannot conclusively determine the current temperature of the hot component. Unfortunately, we are not aware of any near-IR data from the past few years (the last Spitzer data at 3.6 and 4.5 m were obtained in 2019; note, however, that the SN was then very faint at these wavelengths, so we cannot follow the real steepness of its decline after that). If we fit our two-component model using free parameters, we get K for the temperature of the hot component. Between days 3893 and 5359, we do not see a clear evolution of (its value varies between 640 and 780 K; see Z22); note, however, that these SEDs are also unconstrained below 3.6 m. Thus, following the method described by Zs´ıros et al. (2024), we repeated the fitting procedure, fixing K to see how it affects the parameters of the cold dust component. As shown in Table 2, these differences are essentially small. Since the nature of the hot component is not necessarily thermal, we also run a test assuming that the hot component has a power-law nature (, fitted to the day 5359 3.6–5.8 m Spitzer fluxes). However, in this case, we see that this function declines quickly below erg s-1cm beyond 10 m; thus, its influence on the cold dust component is even smaller than that of the tested hot dust/BB components.
We note that Z22 used older absorption coefficients during the modeling of Spitzer SEDs. Hence, for an improved comparison, we also repeated the fitting of two-component amC dust models to the last (day 5359) Spitzer SED using the values adopted from Sarangi (2022). Results of this repeated fitting are shown in Table 2. We discuss in detail the evolution of dust parameters in Section 4.
Note, furthermore, that we examined the potential contribution of the long-wavelength synchrotron radiation to the mid-IR SED (emerging from shock-CSM interaction), just as done recently by Larsson et al. (2023) and Jones et al. (2023) in the case of SN 1987A. Since SN 1993J has also been a target of long-term radio observations, we followed their method and extrapolated the radio LC model parameters of SN 1993J from Weiler et al. (2007) (see their Eq. (1), including both nonthermal synchrotron self-absorption and thermal free-free absorbing components) to the mid-IR range at the epoch of 11,280 days. We found that the original model values may give a 10 Jy contribution at 25.5 m and even lower amounts at shorter wavelengths. Also note that the real contribution may be even smaller, since the general model of Weiler et al. (2007), as the authors discuss, gives an overestimation of the measured radio fluxes after days (the achromatic break in the radio LCs of SN 1993J was also described by, e.g., Mart´ı-Vidal et al. 2011; Kundu et al. 2019). So, unlike in the case of SN 1987A, the contribution of the synchrotron emission to the very-late-time mid-IR SED of SN 1993J seems to be negligible.
| Data | Epoch | |||||
| (days) | (K) | () | (1038 erg s-1) | (1016 cm) | (K) | |
| Spitzer (3.6–8.0 + 24 m) | 5359 | 1674 | 14.32.9 | 10.0 | 2.9 | 90152 |
| JWST (7.7, 10.0, 15.0, 21.0 m) | 11,280 | 11610 | 8.9 | 1.0 | 1.3 | 430 |
| 1282 | 5.20.5 | – | – | 1000 (fixed) |
3.2 Comparison of late-time multiwavelength data
It is also worth comparing the mid-IR evolution of SN 1993J to published late-time UV/optical flux changes (see e.g. Fransson & Kozma 2002; Dessart & Hillier 2022; Dessart et al. 2023). This step could help reveal the role of CSM interaction in the potential heating of the dust content of the SN shown by recent JWST measurements.
First, we examine the late-time HST photometry of the object. Based on the results presented by Baer-Way et al. (2024) — which also contain previously published data from Van Dyk et al. (2002) and Fox et al. (2014) — the F336W fluxes show a moderate decline by 0.026 and 0.036 mag (100 d)-1 in the ranges 6903–8022 d and 8022–10,123 d, respectively. In the F814W filter, there is a steeper decline of 0.073 mag (100 d)-1 during days 6903–10,123, preceded by a slower decrease of 0.029 mag (100 d)-1 during days 2990–6903 (note, however, that these decline rates are determined from single pairs of data points).
We can also do a similar analysis of previously published, well-sampled Spitzer/IRAC LCs (Tinyanont et al. 2016; Z22). While there are 3.6 and 4.5 m data up to days, the object seems to fade into the background at these wavelengths after days. Thus, we only use days 3875–5345 data here, and determine a decline of 0.039, 0.057, 0.060, and 0.071 mag (100 d)-1 for 3.6, 4.5, 5.8, and 8.0 m Spitzer LCs, respectively. Thus, while Spitzer data have quite large uncertainties (0.2–0.3 mag), it seems that fading is slower at shorter wavelengths (and the decline rate of HST F814W data during days 2990–6903 also fits this trend; see Baer-Way et al. 2024). This seems to further strengthen the importance of the ongoing CSM interaction in the environment of SN 1993J.
Using the data published by Z22 and the decline rates reported above, we also did an extrapolation of the 8.0 m Spitzer/IRAC LC to day 11,280 (17.25 mag) and compared to the measured JWST/MIRI 7.7 m brightness (16.19 mag, both values in Vega magnitudes). While the difference between the spatial resolution of the two telescopes and the (slightly) different transmission curves of the two filters should make us careful, we suggest that the mag difference really implies a slowing decline rate after day 5345.

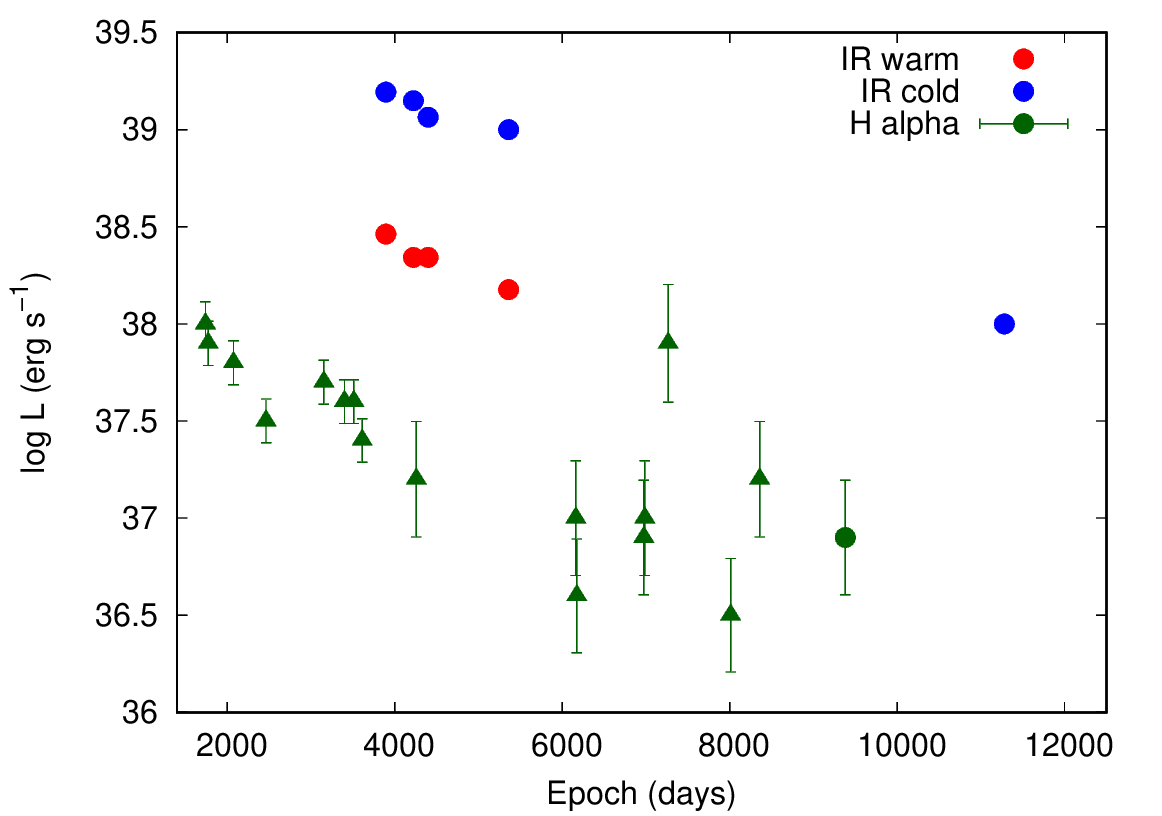
Finally, we refer here to the results of Smith et al. (2017), who give the long-term evolution of H luminosities of SN 1993J (also adopting earlier-time data from Chandra et al. 2009). They found a slow, continuous decline of log from to erg s-1 during days –8300 days (note, however, that while line profiles seem to be similar, log values show large scatter after days). We highlight here that the breadth of the late-time H feature ( 5000 km s-1) makes this gas in SN 1993J associated with ejecta being excited by the reverse shock; this is different from the strongly interacting SNe IIn where the persistent H emission ( 2500 km s-1) is associated with progenitor wind swept up by the forward shock (see a detailed description by, e.g., Smith et al. 2017; Milisavljevic & Fesen 2017). We added one more point measured from the previously unpublished Keck/LRIS optical spectrum obtained at the epoch of day 9381 (see Sec. 2), which also seems to fit into this trend (we apply a 30% uncertainty for the calculated line flux, following the Smith et al. 2017 estimation of earlier Keck/LRIS data). Fig. 5 shows the comparison of H line luminosities and IR luminosities calculated from cold and warm dust SED components (the latter values are adopted from Z22). The declining trends of all these curves seem similar, which may suggest that longstanding (but continuously weakening) interaction has a role in heating both cold and warm dust components in the environment of SN 1993J. We discuss the details of possible dust-heating mechanisms in Sec. 4.
3.3 Local background emission at the SN site: Star formation or an IR echo?
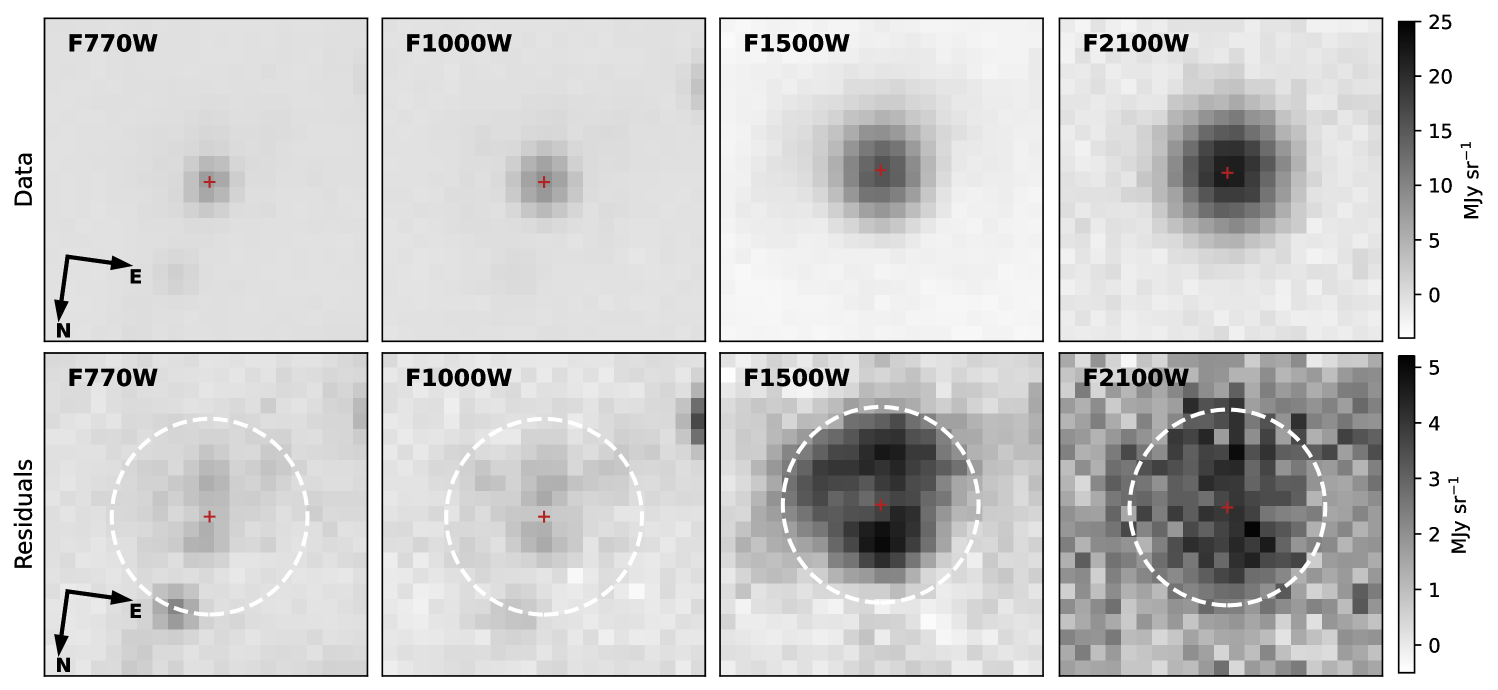
As described above in Section 2, we also examine the local background environment of SN 1993J based on our detailed photometric PSF-fitting analysis. The morphology and integrated fluxes of the residual emission are largely robust for appropriate choices of box sizes during the PSF-fitting procedure. Originally, we first fit the SN with the background flux as a free parameter using a small box (with a 5-pixel width) so that the underlying background is approximately uniform. Then, we fixed the background level to this value and used a larger (21-pixel) box to allow us to integrate the total residual fluxes with the SN removed. In Fig. 6, we show the residual emission after removal of the PSF profiles obtained from these fits. The background emission is apparent in all four filters, with the strongest emission at F1500W and F2100W. Comparison with the higher resolution F770W and F1000W suggests the emission may be the result of a combination of multiple, blended point-like sources as well as extended sources. To test the robustness of this procedure, we repeated it with small box sizes of 5, 7, and 9 pixels, and large box sizes of 15, 19, and 21 pixels, and find generally consistent results for the integrated residual fluxes of F1500W = mJy and F2100W = mJy. As shown in Appendix B (Fig. 10), using too large a box for the first fit such that the background residuals are nonuniform within the fitting region, results in a spurious ring-like morphology due to oversubtraction of the core of the PSF.
Based on a simple BB fit to the residual fluxes and upper limits, the nature of the detected background emission seems to be consistent with dust at K (see Appendix B for more details). The heating source of this dust could be local, ongoing star formation in the vicinity of SN 1993J or alternatively, a thermal IR echo powered by the SN itself.
We note that Sugerman & Crotts (2002) and Liu et al. (2003) identified optical light echoes (LEs) in HST images obtained in 2001. These LEs are assumed to scatter from interstellar dust sheets lying and pc in front of the SN, respectively. The bulk of the emission in JWST/MIRI F1500W and F2100W images is within ″, firmly below the radii of the two known optical echoes (″and –1.95″). Thus, this emission would correspond to a new echo from dust that, given a delay time of 31 yr, lies largely behind the SN at physical distances of –13 pc (see, e.g., Eq. 1 of Dwek & Arendt 2008 for the relevant light-echo geometry). We note here that similar but more extended IR echoes have been observed around the Galactic SNR Cassiopeia A (Cas A; K, e.g., Krause et al. 2005; Dwek & Arendt 2008), which has been found to be the result of a SN 1993J-like Type IIb explosion that occurred yr ago (Krause et al. 2008). Dwek & Arendt (2008) found that a short ( day) burst of UV radiation with a luminosity of L⊙ from the SN shock breakout was needed to power the observed Cas A echo spectra from dust lying pc from the SN. Given the proximity of the dust in the case of SN 1993J, even a less extreme burst could plausibly power the observed emission as an IR echo, but a detailed examination of this possibility is beyond the scope of this work. Additional observations to better constrain the spectrum of the emission or detect variations in its apparent size or brightness would be necessary, for example, to characterize or rule out contributions from ongoing, local star formation to heating the dust.
4 Discussion
As presented above, the model fitting of the current JWST/MIRI SED is consistent with the presence of carbonaceous rather than Si-dominated dust, while this was not as clear from the earlier-phase (3893–5359 days) Spitzer data (Z22). Assuming thus the presence of pure amorphous carbon dust in SN 1993J and applying updated values (Sarangi 2022) for both recent JWST and earlier Spitzer data, we get a similar amount ( M⊙) of dust for now as for yr ago; see Table 2). Fig. 7 shows the determined dust masses in SN 1993J compared to other literature values based on mid-IR SED analyses.
Note, however, that the modeled SED parameters determined from the previously obtained Spitzer data should be handled carefully, since the 8–24 m range was not covered then and the spatial resolution of data at those wavelengths is also lower (especially that of the MIPS 24 m images). Moreover, given the lack of any high-quality mid-IR spectra of SN 1993J (or any other SNe of similar type and age), the line-emission contribution to the measured fluxes is also still uncertain. It seems, however, that the temperature of the cold dust component is significantly lower now than it was yr ago ( K vs. K; see Table 2) — but note again that the modeling results of the Spitzer SEDs have strong limitations.
As shown in Table 2, we calculate the current luminosity of the cold dust component and obtain erg s-1. This value, while definitely lower than yr ago, is still far above the total luminosity expected from the radioactive decay of 44Ti 57Co 60Co (a total of – erg s-1), which is assumed to be the dominant energy source in CCSN ejecta several years or decades after explosion (see, e.g., Tanaka et al. 2012; Seitenzahl et al. 2014). Thus, an extra energy source is needed to heat the ejecta dust up to the observed temperature. Known longstanding CSM interaction in the environment of SN 1993J is the primary explanation. As we show in Fig. 5, mid-IR luminosities have a long-term evolution very similar to that measured in H, and the latter is a well-known tracer of the level of shock-CSM interaction. Note, furthermore, that the majority of the interaction luminosity emerges in the form of X-ray and UV photons; as was shown by (for example) Smith et al. (2017) in the case of some strongly interacting SNe, the X-ray luminosity can achieve a factor of higher level than the optical (H) luminosity. Thus, since the latest measured values of SN 1993J are in the range – erg s-1, the UV/X-ray output from shock-ejecta interaction can be enough to power the observed dust luminosity ( erg s-1) measured by JWST on day 11,280. Furthermore, as found by Dessart & Hillier (2022) and Dessart et al. (2023), even modest stellar winds can build up and result in a relatively large UV flux at late times, generating a constant shock power of about 1040 erg s-1 in a standard Type II SN. Depending on the optical depth of the ejecta, back-scattered UV photons may be able to effectively heat not only circumstellar (pre-existing) dust but also newly-formed grains located in the inner ejecta, as we discussed in more detail by Shahbandeh et al. (2023). Nevertheless, note that collecting direct observational UV evidence for the latter option seems to be quite challenging at such late epochs.
Finally, taking a closer look at the Galactic SNR Cas A could be helpful for understanding the dust origin and heating mechanisms in the case of SN 1993J (and in other Type IIb explosions). Studying the dust content of Cas A was the topic of numerous studies (e.g., Dwek & Arendt 2008; Dunne et al. 2009; Barlow et al. 2010; Arendt et al. 2014; Bevan et al. 2017; De Looze et al. 2017; Priestley et al. 2019, 2022; Kirchschlager et al. 2023, 2024) and the object has also been a target of recent JWST observations (Milisavljevic et al. 2024). While we see many exciting details in the structure and ongoing interaction processes of this nearby SNR, there are efforts to understand its past and the fate of SNe IIb in general. SN 1993J, already in the transitional phase between an SN and an SNR, is an ideal object for follow-up studies from this perspective as well.
The cited studies present detailed investigations of the physical composition of the dust in both the ejecta and the ambient swept-up medium of Cas A. A general conclusion of these investigations is that the mid-IR component of Cas A’s spectrum basically emerges from the post-shocked ejecta region, which contains a few M⊙ of dust. This value is in good agreement with the one we found during the analysis of our current JWST data of SN 1993J. It may indicate that the dust we see now in SN 1993J can also be in the post-shocked ejecta. Furthermore, as these studies suggest, a much larger amount (–1.0 M⊙) of very cold ( K) dust is located within the unshocked ejecta of Cas A. Following the arguments we described above, it could be possible that we do see part of the heated unshocked ejecta dust in the mid-IR data of SN 1993J now, and this dust can cool well below 100 K after several decades (as the intensity of the CSM interaction decreases, suggested by the current trend seen in Fig. 5).
In the case of ejecta dust, the effect of grain-destruction processes caused by the reverse shock should be taken into account as well. This topic has been actively studied in the case of Cas A (e.g., Micelotta et al. 2016; De Looze et al. 2017; Priestley et al. 2022; Kirchschlager et al. 2023, 2024), especially because theoretical studies predict a small average grain size ( m) in SN IIb ejecta (Nozawa et al. 2010; Biscaro & Cherchneff 2014, 2016). While all these studies predict a very low survival rate of grains, the estimated rate values depend on various parameters (grain-size distribution, density contrast between the dust clumps and the ambient medium, magnetic field strength, etc.) and seem to increase after some time; see the most recent calculations by Kirchschlager et al. (2023, 2024). However, as can be inferred from these studies, note that the reverse shock may have hit only the outermost part of the ejecta of SN 1993J by now; thus, the dust content in the inner part should not be affected yet. This is in agreement with our finding of similar dust masses in SN 1993J at and yr after explosion.
We also remark that the dust composition used to describe Cas A’s IR-submm spectra is mainly based on Al2O3 and various types of magnesium silicates (e.g., Arendt et al. 2014), but dust-synthesis models also allow for the presence of larger amounts of carbonaceous grains in SN IIb explosions (Nozawa et al. 2010; Biscaro & Cherchneff 2014, 2016). Note, however, that lack of the characteristic silicate features does not necessarily mean that we do really see carbonaceous dust. It could also be very large silicate grains or high optical depths that quash the signs of silicate emission. A future JWST spectrum would be the necessary further step in revealing the true composition of dust in SN 1993J.
5 Conclusions
To summarize, analysis of recent JSWT/MIRI photometric data of SN 1993J suggests that it still contains a significant amount of dust yr after explosion. Comparing the current results to those of the analysis of earlier Spitzer data, we see a similar amount ( M⊙) of carbonaceous dust to that detected –20 yr ago, but at a lower temperature ( K vs. K).
There are still open questions regarding whether we see the same dust, and whether this dust has formed post-explosion (and is located in the inner or the post-shocked ejecta) or is pre-existing. As shown by Z22, this amount of dust can be entirely in the inner (unshocked) ejecta of SN 1993J, supported also by the red–blue line-profile asymmetries of late-time optical spectra. In this case, it is possible that we see the same dust now (since we expect no grain destruction in the unshocked region). This dust, if located in the inner ejecta, has presumably cooled over the years. This is also in agreement with the continuously decreasing intensity of the CSM interaction, which is assumed to be the main heating mechanism even for ejecta dust (the presence of still ongoing CSM interaction is revealed not just in the form of the long-lived H emission-line profile but also as a hot component in the recent JWST/MIRI SED of SN 1993J).
As another possibility (also shown by Z22), part or all of the observed dust (either pre-existing or newly formed) can be in the post-shocked regions of the SN. We see such dust in the mid-IR in the yr-old remnant of Cas A, in an amount similar to what was found in SN 1993J at a much younger age. In general, we barely have any information on the dust evolution in the SN-SNR transitional phase; however, one can assume (for example) continuous destruction and condensation of grains. Note, furthermore, that the dust amount ( M⊙) found in SN 1993J based on JWST/MIRI data is comparable to dust masses seen in strongly interacting Type IIn SNe (e.g., Fox et al. 2011, 2013, 2020). Since we assume much lower mass-loss rates in SN IIb progenitors than in SN IIn ones, it may be an argument against entirely pre-existing dust in SN 1993J. Note, however, that most of the known SN IIn IR dust masses were determined from short-wavelength Spitzer data — upcoming JWST observations of SNe IIn and uniform dust-modeling methods (especially on grain properties) are expected to achieve further progress in this field.
Moreover, beyond the local dust assumed in the close environment of SN 1993J, we may have identified signs of a potential IR echo (found as residual background emission in JWST/MIRI images after PSF subtraction) — that is, radiation of a more-distant dust shell heated by the SN shock-breakout luminosity. Nevertheless, to get a full picture of the dusty SN 1993J, it would be useful to obtain a complete near-IR and mid-IR spectrum at the same SN phase. Such a dataset would allow us to take into account further important aspects such as the effects of atomic and molecular line emission on the IR spectrum (see Milisavljevic et al. 2024, for the case of Cas A), or how the progenitor’s binary companion affects the CSM geometry and the dust formation/heating processes (e.g., Fox et al. 2014; Kochanek 2017). All these arguments, along with the results presented above, should make SN 1993J a promising spectroscopic target in future JWST cycles and the subject of further detailed studies.
Data availability
Data are available at the Barbara A. Mikulski Archive for Space Telescopes (MAST).
Acknowledgements.
We thank our anonymous referee for valuable comments. This work is based on observations made with the NASA/ESA/CSA James Webb Space Telescope. The data were obtained from the Mikulski Archive for Space Telescopes at the Space Telescope Science Institute, which is operated by the Association of Universities for Research in Astronomy, Inc., under NASA contract NAS 5-03127 for JWST. These observations are associated with program GO-3921. This project has been supported by the NKFIH OTKA FK-134432 grant of the National Research, Development and Innovation (NRDI) Office of Hungary. S.Z. is supported by the ÚNKP-23-4-SZTE-574 New National Excellence Program of the Ministry for Culture and Innovation from the source of the NRDI Fund, Hungary. I.D.L. has received funding from the European Research Council (ERC) under the European Union’s Horizon 2020 research and innovation programme DustOrigin (ERC-2019-StG-851622) and the Belgian Science Policy Office (BELSPO) through the PRODEX project “JWST/MIRI Science exploitation” (C4000142239). A.V.F. is grateful for financial support from the Christopher R. Redlich Fund and many other donors. C.A. acknowledges support by NASA JWST grants GO-02114, GO-02122, GO-03726, GO-04436, and GO-04522. Some of the data presented herein were obtained at the W. M. Keck Observatory, which is operated as a scientific partnership among the California Institute of Technology, the University of California, and NASA; the observatory was made possible by the generous financial support of the W. M. Keck Foundation.References
- Aldering et al. (1994) Aldering, G., Humphreys, R. M., & Richmond, M. 1994, AJ, 107, 662
- Arendt et al. (2016) Arendt, R. G., Dwek, E., Bouchet, P., et al. 2016, AJ, 151, 62
- Arendt et al. (2020) Arendt, R. G., Dwek, E., Bouchet, P., et al. 2020, ApJ, 890, 2
- Arendt et al. (2014) Arendt, R. G., Dwek, E., Kober, G., Rho, J., & Hwang, U. 2014, ApJ, 786, 55
- Baer-Way et al. (2024) Baer-Way, R., DeGraw, A., Zheng, W., et al. 2024, ApJ, 964, 172
- Barlow et al. (2010) Barlow, M. J., Krause, O., Swinyard, B. M., et al. 2010, A&A, 518, L138
- Bartel et al. (2002) Bartel, N., Bietenholz, M. F., Rupen, M. P., et al. 2002, ApJ, 581, 404
- Bevan et al. (2017) Bevan, A., Barlow, M. J., & Milisavljevic, D. 2017, MNRAS, 465, 4044
- Bietenholz et al. (2001) Bietenholz, M. F., Bartel, N., & Rupen, M. P. 2001, ApJ, 557, 770
- Bietenholz et al. (2003) Bietenholz, M. F., Bartel, N., & Rupen, M. P. 2003, ApJ, 597, 374
- Biscaro & Cherchneff (2014) Biscaro, C. & Cherchneff, I. 2014, A&A, 564, A25
- Biscaro & Cherchneff (2016) Biscaro, C. & Cherchneff, I. 2016, A&A, 589, A132
- Bouchet et al. (2006) Bouchet, P., Dwek, E., Danziger, J., et al. 2006, ApJ, 650, 212
- Bouchet et al. (2015) Bouchet, P., García-Marín, M., Lagage, P. O., et al. 2015, PASP, 127, 612
- Brooker et al. (2022) Brooker, E. S., Stangl, S. M., Mauney, C. M., & Fryer, C. L. 2022, ApJ, 931, 85
- Chandra et al. (2009) Chandra, P., Dwarkadas, V. V., Ray, A., Immler, S., & Pooley, D. 2009, ApJ, 699, 388
- Cohen et al. (1995) Cohen, J. G., Darling, J., & Porter, A. 1995, AJ, 110, 308
- De Looze et al. (2019) De Looze, I., Barlow, M. J., Bandiera, R., et al. 2019, MNRAS, 488, 164
- De Looze et al. (2017) De Looze, I., Barlow, M. J., Swinyard, B. M., et al. 2017, MNRAS, 465, 3309
- Dessart et al. (2023) Dessart, L., Gutiérrez, C. P., Kuncarayakti, H., Fox, O. D., & Filippenko, A. V. 2023, A&A, 675, A33
- Dessart & Hillier (2022) Dessart, L. & Hillier, D. J. 2022, A&A, 660, L9
- Draine & Li (2007) Draine, B. T. & Li, A. 2007, ApJ, 657, 810
- Dunne et al. (2009) Dunne, L., Maddox, S. J., Ivison, R. J., et al. 2009, MNRAS, 394, 1307
- Dwek & Arendt (2008) Dwek, E. & Arendt, R. G. 2008, ApJ, 685, 976
- Dwek et al. (2010) Dwek, E., Arendt, R. G., Bouchet, P., et al. 2010, ApJ, 722, 425
- Dwek et al. (2007) Dwek, E., Galliano, F., & Jones, A. P. 2007, The Astrophysical Journal, 662, 927
- Dwek et al. (2019) Dwek, E., Sarangi, A., & Arendt, R. G. 2019, ApJ, 871, L33
- Dwek et al. (2021) Dwek, E., Sarangi, A., Arendt, R. G., et al. 2021, ApJ, 917, 84
- Fabbri et al. (2011) Fabbri, J., Otsuka, M., Barlow, M. J., et al. 2011, MNRAS, 418, 1285
- Filippenko (1982) Filippenko, A. V. 1982, PASP, 94, 715
- Filippenko (1988) Filippenko, A. V. 1988, AJ, 96, 1941
- Filippenko (1997) Filippenko, A. V. 1997, ARA&A, 35, 309
- Filippenko et al. (1993) Filippenko, A. V., Matheson, T., & Ho, L. C. 1993, ApJ, 415, L103
- Fox et al. (2014) Fox, O. D., Azalee Bostroem, K., Van Dyk, S. D., et al. 2014, ApJ, 790, 17
- Fox et al. (2010) Fox, O. D., Chevalier, R. A., Dwek, E., et al. 2010, ApJ, 725, 1768
- Fox et al. (2011) Fox, O. D., Chevalier, R. A., Skrutskie, M. F., et al. 2011, ApJ, 741, 7
- Fox et al. (2013) Fox, O. D., Filippenko, A. V., Skrutskie, M. F., et al. 2013, AJ, 146, 2
- Fox et al. (2020) Fox, O. D., Fransson, C., Smith, N., et al. 2020, MNRAS, 498, 517
- Fransson & Kozma (2002) Fransson, C. & Kozma, C. 2002, New A Rev., 46, 487
- Freedman et al. (2001) Freedman, W. L., Madore, B. F., Gibson, B. K., et al. 2001, ApJ, 553, 47
- Gall et al. (2014) Gall, C., Hjorth, J., Watson, D., et al. 2014, Nature, 511, 326
- Gomez et al. (2012) Gomez, H. L., Krause, O., Barlow, M. J., et al. 2012, The Astrophysical Journal, 760, 96
- Hildebrand (1983) Hildebrand, R. H. 1983, QJRAS, 24, 267
- Indebetouw et al. (2014) Indebetouw, R., Matsuura, M., Dwek, E., et al. 2014, ApJL, 782, L2
- Jones et al. (2023) Jones, O. C., Kavanagh, P. J., Barlow, M. J., et al. 2023, ApJ, 958, 95
- Kirchschlager et al. (2024) Kirchschlager, F., Sartorio, N. S., De Looze, I., et al. 2024, MNRAS, 528, 5364
- Kirchschlager et al. (2023) Kirchschlager, F., Schmidt, F. D., Barlow, M. J., De Looze, I., & Sartorio, N. S. 2023, MNRAS, 520, 5042
- Kochanek (2017) Kochanek, C. S. 2017, MNRAS, 471, 3283
- Kotak et al. (2009) Kotak, R., Meikle, W. P. S., Farrah, D., et al. 2009, ApJ, 704, 306
- Krause et al. (2008) Krause, O., Birkmann, S. M., Usuda, T., et al. 2008, Science, 320, 1195
- Krause et al. (2005) Krause, O., Rieke, G. H., Birkmann, S. M., et al. 2005, Science, 308, 1604
- Kundu et al. (2019) Kundu, E., Lundqvist, P., Sorokina, E., et al. 2019, ApJ, 875, 17
- Larsson et al. (2023) Larsson, J., Fransson, C., Sargent, B., et al. 2023, ApJ, 949, L27
- Lewis et al. (1994) Lewis, J. R., Walton, N. A., Meikle, W. P. S., et al. 1994, MNRAS, 266, L27
- Liu et al. (2003) Liu, J.-F., Bregman, J. N., & Seitzer, P. 2003, ApJ, 582, 919
- Mart´ı-Vidal et al. (2011) Martí-Vidal, I., Marcaide, J. M., Alberdi, A., et al. 2011, A&A, 526, A142
- Matheson et al. (2000) Matheson, T., Filippenko, A. V., Ho, L. C., Barth, A. J., & Leonard, D. C. 2000, AJ, 120, 1499
- Matsuura et al. (2019) Matsuura, M., De Buizer, J. M., Arendt, R. G., et al. 2019, MNRAS, 482, 1715
- Matsuura et al. (2011) Matsuura, M., Dwek, E., Meixner, M., et al. 2011, Science, 333, 1258
- Matthews et al. (2002) Matthews, K., Neugebauer, G., Armus, L., & Soifer, B. T. 2002, AJ, 123, 753
- Maund & Smartt (2009) Maund, J. R. & Smartt, S. J. 2009, Science, 324, 486
- Maund et al. (2004) Maund, J. R., Smartt, S. J., Kudritzki, R. P., Podsiadlowski, P., & Gilmore, G. F. 2004, Nature, 427, 129
- Meikle et al. (2011) Meikle, W. P. S., Kotak, R., Farrah, D., et al. 2011, ApJ, 732, 109
- Micelotta et al. (2016) Micelotta, E. R., Dwek, E., & Slavin, J. D. 2016, A&A, 590, A65
- Milisavljevic & Fesen (2017) Milisavljevic, D. & Fesen, R. A. 2017, in Handbook of Supernovae, ed. A. W. Alsabti & P. Murdin, 2211
- Milisavljevic et al. (2012) Milisavljevic, D., Fesen, R. A., Chevalier, R. A., et al. 2012, ApJ, 751, 25
- Milisavljevic et al. (2024) Milisavljevic, D., Temim, T., De Looze, I., et al. 2024, ApJ, 965, L27
- Nomoto et al. (1993) Nomoto, K., Suzuki, T., Shigeyama, T., et al. 1993, Nature, 364, 507
- Nozawa et al. (2010) Nozawa, T., Kozasa, T., Tominaga, N., et al. 2010, ApJ, 713, 356
- Oke et al. (1995) Oke, J. B., Cohen, J. G., Carr, M., et al. 1995, PASP, 107, 375
- Perley (2019) Perley, D. A. 2019, PASP, 131, 084503
- Perrin et al. (2014) Perrin, M. D., Sivaramakrishnan, A., Lajoie, C.-P., et al. 2014, in Society of Photo-Optical Instrumentation Engineers (SPIE) Conference Series, Vol. 9143, Space Telescopes and Instrumentation 2014: Optical, Infrared, and Millimeter Wave, ed. J. Oschmann, Jacobus M., M. Clampin, G. G. Fazio, & H. A. MacEwen, 91433X
- Pierel (2024) Pierel, J. 2024, Space-Phot: Simple Python-Based Photometry for Space Telescopes, Zenodo 12100100
- Priestley et al. (2022) Priestley, F. D., Arias, M., Barlow, M. J., & De Looze, I. 2022, MNRAS, 509, 3163
- Priestley et al. (2019) Priestley, F. D., Barlow, M. J., & De Looze, I. 2019, MNRAS, 485, 440
- Ressler et al. (2015) Ressler, M. E., Sukhatme, K. G., Franklin, B. R., et al. 2015, PASP, 127, 675
- Rest et al. (2023) Rest, A., Pierel, J., Correnti, M., et al. 2023, arminrest/jhat: The JWST HST Alignment Tool (JHAT)
- Richardson et al. (2006) Richardson, D., Branch, D., & Baron, E. 2006, AJ, 131, 2233
- Rieke & Wright (2022) Rieke, G. & Wright, G. 2022, Nature Astronomy, 6, 891
- Rieke et al. (2015) Rieke, G. H., Wright, G. S., Böker, T., et al. 2015, PASP, 127, 584
- Sarangi (2022) Sarangi, A. 2022, A&A, 668, A57
- Seitenzahl et al. (2014) Seitenzahl, I. R., Timmes, F. X., & Magkotsios, G. 2014, ApJ, 792, 10
- Shahbandeh et al. (2023) Shahbandeh, M., Sarangi, A., Temim, T., et al. 2023, MNRAS, 523, 6048
- Sibthorpe et al. (2010) Sibthorpe, B., Ade, P. A. R., Bock, J. J., et al. 2010, The Astrophysical Journal, 719, 1553
- Smith et al. (2017) Smith, N., Kilpatrick, C. D., Mauerhan, J. C., et al. 2017, MNRAS, 466, 3021
- Smith et al. (2011) Smith, N., Li, W., Filippenko, A. V., & Chornock, R. 2011, MNRAS, 412, 1522
- Sugerman et al. (2012) Sugerman, B. E. K., Andrews, J. E., Barlow, M. J., et al. 2012, ApJ, 749, 170
- Sugerman & Crotts (2002) Sugerman, B. E. K. & Crotts, A. P. S. 2002, ApJ, 581, L97
- Szalai et al. (2021) Szalai, T., Fox, O. D., Arendt, R. G., et al. 2021, ApJ, 919, 17
- Szalai & Vinkó (2013) Szalai, T. & Vinkó, J. 2013, A&A, 549, A79
- Szalai et al. (2011) Szalai, T., Vinkó, J., Balog, Z., et al. 2011, A&A, 527, A61
- Szalai et al. (2019) Szalai, T., Zsíros, S., Fox, O. D., Pejcha, O., & Müller, T. 2019, ApJS, 241, 38
- Tanaka et al. (2012) Tanaka, M., Nozawa, T., Sakon, I., et al. 2012, ApJ, 749, 173
- Temim & Dwek (2013) Temim, T. & Dwek, E. 2013, ApJ, 774, 8
- Tinyanont et al. (2016) Tinyanont, S., Kasliwal, M. M., Fox, O. D., et al. 2016, ApJ, 833, 231
- Van Dyk (2013) Van Dyk, S. D. 2013, AJ, 145, 118
- Van Dyk et al. (2002) Van Dyk, S. D., Garnavich, P. M., Filippenko, A. V., et al. 2002, PASP, 114, 1322
- Vasiliev & Shchekinov (2024) Vasiliev, E. O. & Shchekinov, Y. A. 2024, MNRAS, 527, 8755
- Weiler et al. (2007) Weiler, K. W., Williams, C. L., Panagia, N., et al. 2007, ApJ, 671, 1959
- Zs´ıros et al. (2022) Zsíros, S., Nagy, A. P., & Szalai, T. 2022, MNRAS, 509, 3235
- Zs´ıros et al. (2024) Zsíros, S., Szalai, T., De Looze, I., et al. 2024, MNRAS, 529, 155
- Zubko et al. (2004) Zubko, V., Dwek, E., & Arendt, R. G. 2004, ApJS, 152, 211
Appendix A Modeling the JWST/MIRI SED of SN 1993J assuming large dust grains
In Fig. 8, we present the best-fit two-component models assuming a hot BB and a cold dust component consists of large grains (=1.0 and 5.0 m amorphous carbon, and =5.0 m silicate dust, respectively), together with the adopted curves. We applied this set of fittings only to the average values of the observed JWST/MIRI fluxes. Models using =1.0 amC dust result in very similar parameters to that of the basic set we used (=0.1 amC dust, see Table 2), while both =5.0 m amC and silicate dust models also result in similar cold dust and hot BB temperatures ( K, and K, respectively), but in smaller cold dust masses ( M⊙). Nevertheless, as we described above, such large grains are not expected in SN 1993J at this phase and, furthermore, this dataset does not allow us to truly disentangle models with different grain-size distributions.

Appendix B PSF residuals in JWST/MIRI images
The two figures we present here refer to the potential local background emission we identified at the SN site as residuals after PSF subtraction (see Sec. 3.3). We first examine the quality of the PSF subtraction for multiple isolated stars to ensure the residual emission is not a result of inaccuracies in the PSF models obtained with WebbPSF.
Figure 9 compares the results of PSF removal from a bright star and a faint star, located at respective positions of (, ) = (, ) and (, ), along with SN 1993J in the F1500W images. While the bright star shows noticeable PSF residuals, these are % of the peak of the star and do not show the prominent “ring” pattern that is evident in the SN 1993J residuals at up to % of the source flux. The faint-star PSF subtracts cleanly, with any PSF residuals below the noise level. This comparison clearly indicates that the residuals around SN 1993J are not due to inaccuracies in the PSF model, but instead arise from real emission in the local SN environment. We note that the “ring”/doughnut morphology seen here is an artefact of using a large fitting box that results in oversubtraction of the background in the core of the PSF (see Sec. 3.3 for more careful background estimation and PSF fitting).
In Fig. 10, we show the integrated residual fluxes (F1500W=0.110.01 mJy and F2100W = 0.140.01 mJy, see Sec. 3.3) and upper limits (20 Jy for both F770W and F1000W filter images) for the background emission around SN 1993J, together with a fitted BB curve to estimate the temperature of the emitting source. Residual fluxes and upper limits were determined by a simple summation of fluxes within pixel boxes that cover the residual structures of the PSF in the F1500W and F2100W images, but exclude light from nearby point sources. The BB fit suggests a dust temperature of K.

