Superconducting dome and structural changes in LaRu3Si2 under pressure
Abstract
LaRu3Si2 is of current research interest as a kagome metal with a superconducting transition temperature, 7 K and higher temperature charge density wave (CDW) orders. Here we report electrical transport and X-ray diffraction measurements on LaRu3Si2 under pressure up to 65 GPa and 35 GPa respectively. The superconducting transition temperature first gets slightly enhanced and reaches a maximum 8.7 K at 8.5 GPa. With further applied pressure, is initially gradually suppressed, then more rapidly suppressed, followed by gradual suppression, revealing a superconducting dome. Two possible pressure-induced structural phase transitions are also observed at room temperature, from original hexagonal phase to another hexagonal structure above 11.5 GPa, and further to a structure with lower symmetry above 23.5 GPa. These transition pressures roughly correlate with features found in our pressure dependent transport data.
I Introduction
Superconductivity in hexagonal LaRu3Si2 with a transition temperature , 7 K, was discovered more than 40 years ago [1, 2]. Initial studies of superconductivity in this compound were performed via La substitution by other (magnetic or strongly correlated) rare earths [3, 4, 5]. It should be noted, that the observed suppression with heavy rare earth substitution (Gd, Tm) does not scale with the de Gennes factor [4, 5]. More recent studies of chemical doping in LaRu3Si2 [6, 7, 8] show that Y, Lu and Ce doping on La site as well as Cr, Co, Ni, Cu, Ir, and Rh doping on Ru site suppress very slowly, whereas Fe substitution for Ru causes fast suppression. That can be described by Abrikosov - Gor’kov theory since Fe ions presented as strong magnetic scattering centers [9, 7].
In 139La-NQR measurements [10, 11] a clear coherence peak in the spin relaxation rate, , just below superconducting transition temperature, , was observed. It was followed, on further cooling, by the exponential behavior of . These results indentified LaRu3Si2 as a conventional strong coupled BCS superconductor. The energy gap was estimated as . The somewhat high was presumed to be due to the high density of states at the Fermi level combined with strong electron - phonon interaction.
This point of view was reexamined recently [12], and based on muon spin rotation (SR) experiments and first principles calculations, other factors were suggested to explain the enhanced , such as correlation effects from the kagome flat band or the van Hove point on the kagome lattice. Further SR measurements on La(Ru1-xFex)3Si2 [13] proposed that the superconductivity is unconventional and that the Fe doping introduces nodes in the superconducting gap structure. Altogether these studies point to interesting questions related to kagome superconductivity and balance between competing orders associated with it [14, 15, 16].
Pressure is known as a ‘clean’alternative to chemical substitution—a way to induce controlled perturbation in materials. A large body of work has studied the effects of pressure in kagome superconductors [17]. For LaRu3Si2, though, we are aware only of SR studies up to just under 2 GPa [12, 18]. The main conclusion was that both and the superfluid density of LaRu3Si2 are relativly insensitive to hydrostatic pressure in this range. Similarly, pressure-independent and superfluid density were observed in the SR measurements on La(Ru0.98Fe0.02)3Si2 [13] up to 1.94 GPa.
Being puzzled by apparent robust behavior of in the 2 GPa pressure range, and keeping in mind recently discovered charge order at ambient pressure in La(Ru1-xFex)3Si2 [19], in this work we study superconductivity in LaRu3Si2 by measuring electrical transport in a diamond anvil cell (DAC) at pressures up to 65.5 GPa, as well as its room temperature structure by X-ray diffraction up to 35 GPa, thus exceeding the literature pressure range by more than an order of magnitude. We find that is actually resolvably pressure sensitive, reaching a peak near 8.5 GPa at 8.7 K and then dropping to 2 K or below at 40 GPa. In addition, we can correlate the structural changes with features in the diagram as well as features in the transport data.
II Experimental Details
Polycrystalline LaRu3Si2 was prepared via arc melting elemental La (ingot, Material Preparation Center - Ames National Laboratory 99.99%), Ru (lump, Alfa Aesar 99.95% (metal basis)), and Si (lump, Material Preparation Center - Ames National Laboratory 99.999%) on a water cooled copper hearth using Zr pellets as an oxygen getter. In order to suppress the second phase LaRu2Si2, excess Ru was added to reach the starting composition LaRu3.15Si2 [1]. The melted button was flipped and thoroughly remelted five times to ensure a homogeneous melt. The total mass of the pellet was 1.86 g after the final melting, losing less than 1% mass than before arc melting. Part of the arcmelted button was then broken manually into pieces for further measurements.
The ambient pressure crystal structure was examined by powder X-ray diffraction (PXRD) using a Rigaku MiniFlex II powder diffractometer with Cu K radiation ( = 1.5406 Å). The pieces from arcmelted button were crushed and ground to fine powder, dispersed evenly on a single-crystal Si zero-background holder, with the aid of small amount of vacuum grease. Intensities were collected for 2 ranging from 15∘ to 100∘, in step size of 0.015∘, counting for 4 s at each angle. Rietveld refinement was preformed on as collected PXRD data using the GSAS II software package [20].
Compositional analysis and elemental mapping were carried out using the JEOL NeoScope JCM-7000 Benchtop scanning electron microscope (SEM) on a polished sample piece, under an accelerating voltage of 15 kV. Elemental mapping was performed at 2500 magnification, with the resolution of 7681024 pixels. Quantitative analysis of X-ray spectrum was done with built-in software SMILE VIEW Map with factory standards.
Magnetization measurements were done in a Quantum Design Magnetic Property Measurement System (MPMS) superconducting quantum interference device (SQUID) magnetometer (operated in the temperature range from 1.8 K to 300 K and magnetic field from -70 kOe to 70 kOe). An irregularly shaped sample was measured under both zero field cooling (ZFC) an field cooling (FC) protocols. This sample was placed in between two uniform plastic straws.
High pressure electrical transport measurements were done in DAC [21], with 350 m culet size standard cut type Ia diamonds. A piece of broken arcmelted sample was polished into 20 m thick flake and cut into 60 m 60 m size plate, and loaded into here DAC. The sample was loaded together with two 10 m diameter ruby spheres into an apertured stainless-steel gasket covered by cubic-BN. Platinum foil was used to make electrical contacts on a sample flake to perform van der Pauw method resistance measurement. Nujol mineral oil was used as pressure transmitting medium (PTM). Two samples (S#1 and S#2) from same batch were measured under same high pressure configuration and protocols.
Pressure was changed and determined by ruby fluorescence at room temperature [22, 23] before each run. Low temperature alternating current (AC) resistance measurements down to 1.8 K were conducted in a Quantum Design Physical Property Measurement System (PPMS), with the Lake Shore AC resistance bridges (models 370 and 372), and a frequency of 17 Hz and 1 mA excitation current.
Room-temperature high-pressure PXRD experiments were conducted at the GSECARS 13-BM-C Beamline of the Advanced Photon Source (APS) at Argonne National Laboratory (ANL). X-rays with a wavelength of 0.4271 Å were focused to a 10 m (vertical) × 10 m (horizontal) spot size. The polycrystalline sample was ground into powder, and loaded into a wide-opening BX-90 DAC with 300 m culet type Ia diamond anvils, a pre-indented Re gasket, and two 10 m ruby spheres as the pressure manometer. Neon was used as PTM. Pressure was determined in situ using the calibrated pressure-dependence of the line in the ruby fluorescence spectra [22, 23]. The two-dimensional diffraction images were integrated using the DIOPTAS software [24] and both Rietveld and LeBail refinements were performed in GSAS-II [20].
III Data Presentation and Analysis
III.1 Ambient Pressure
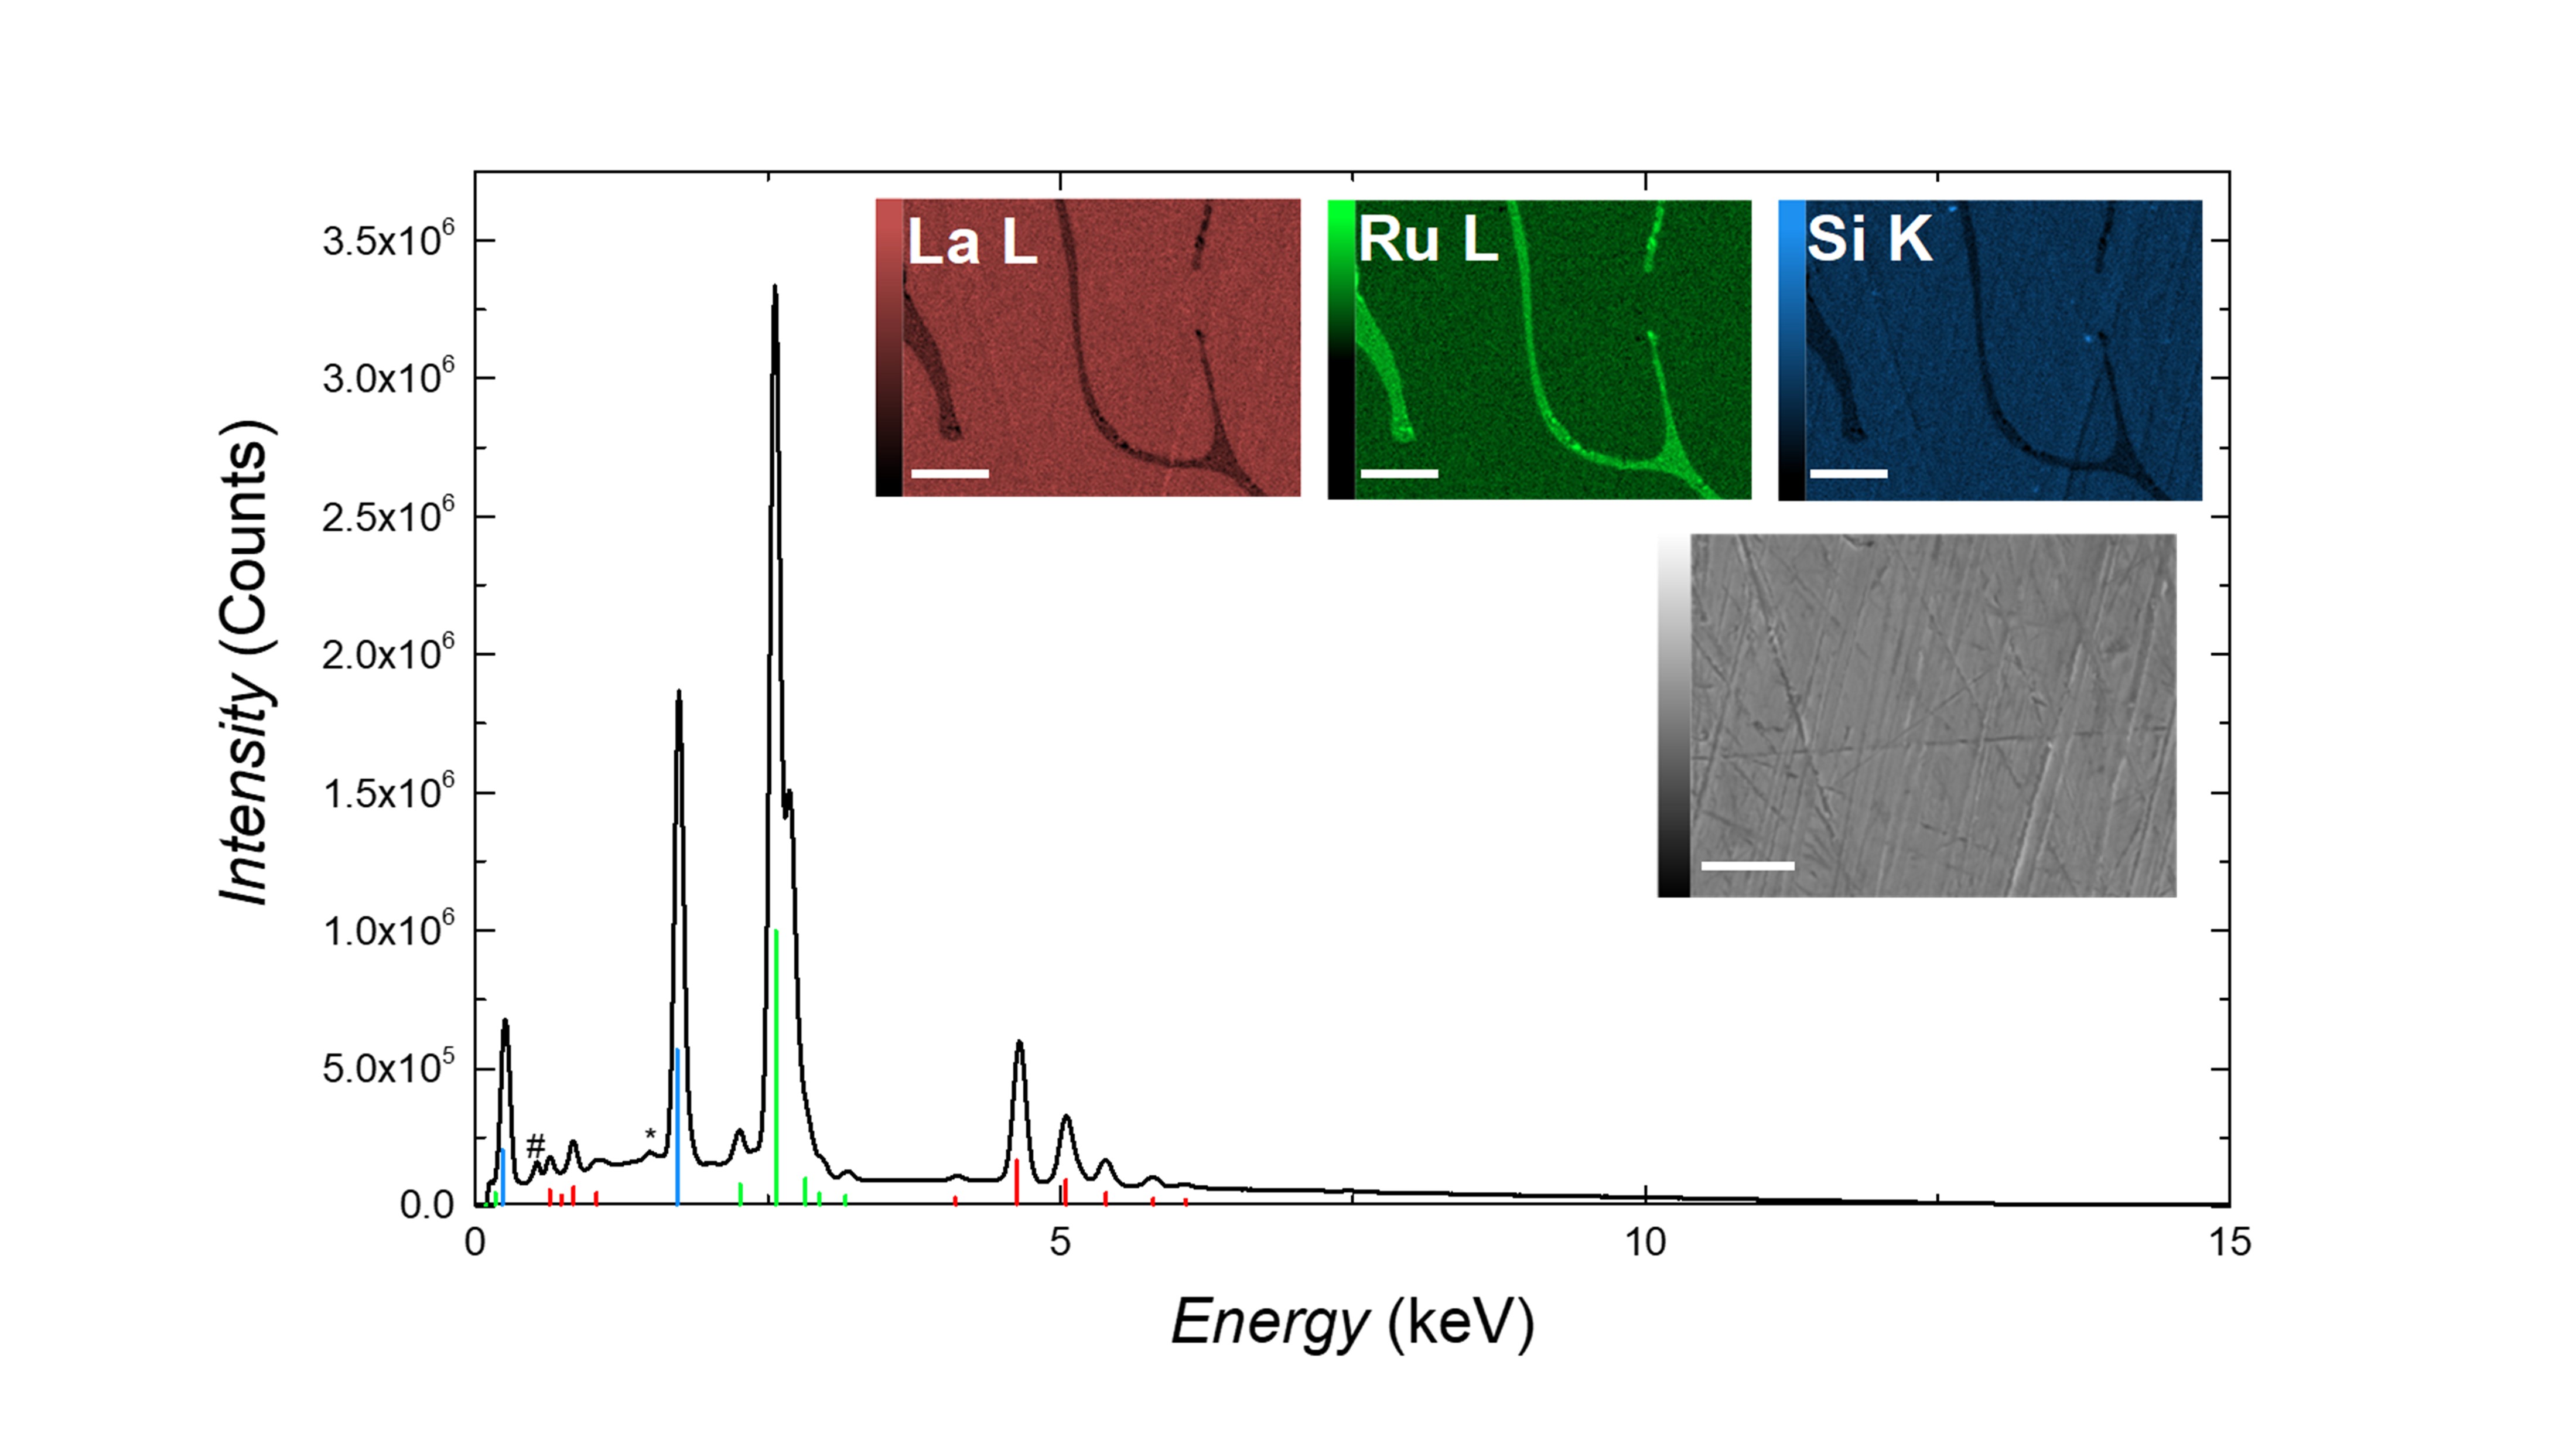
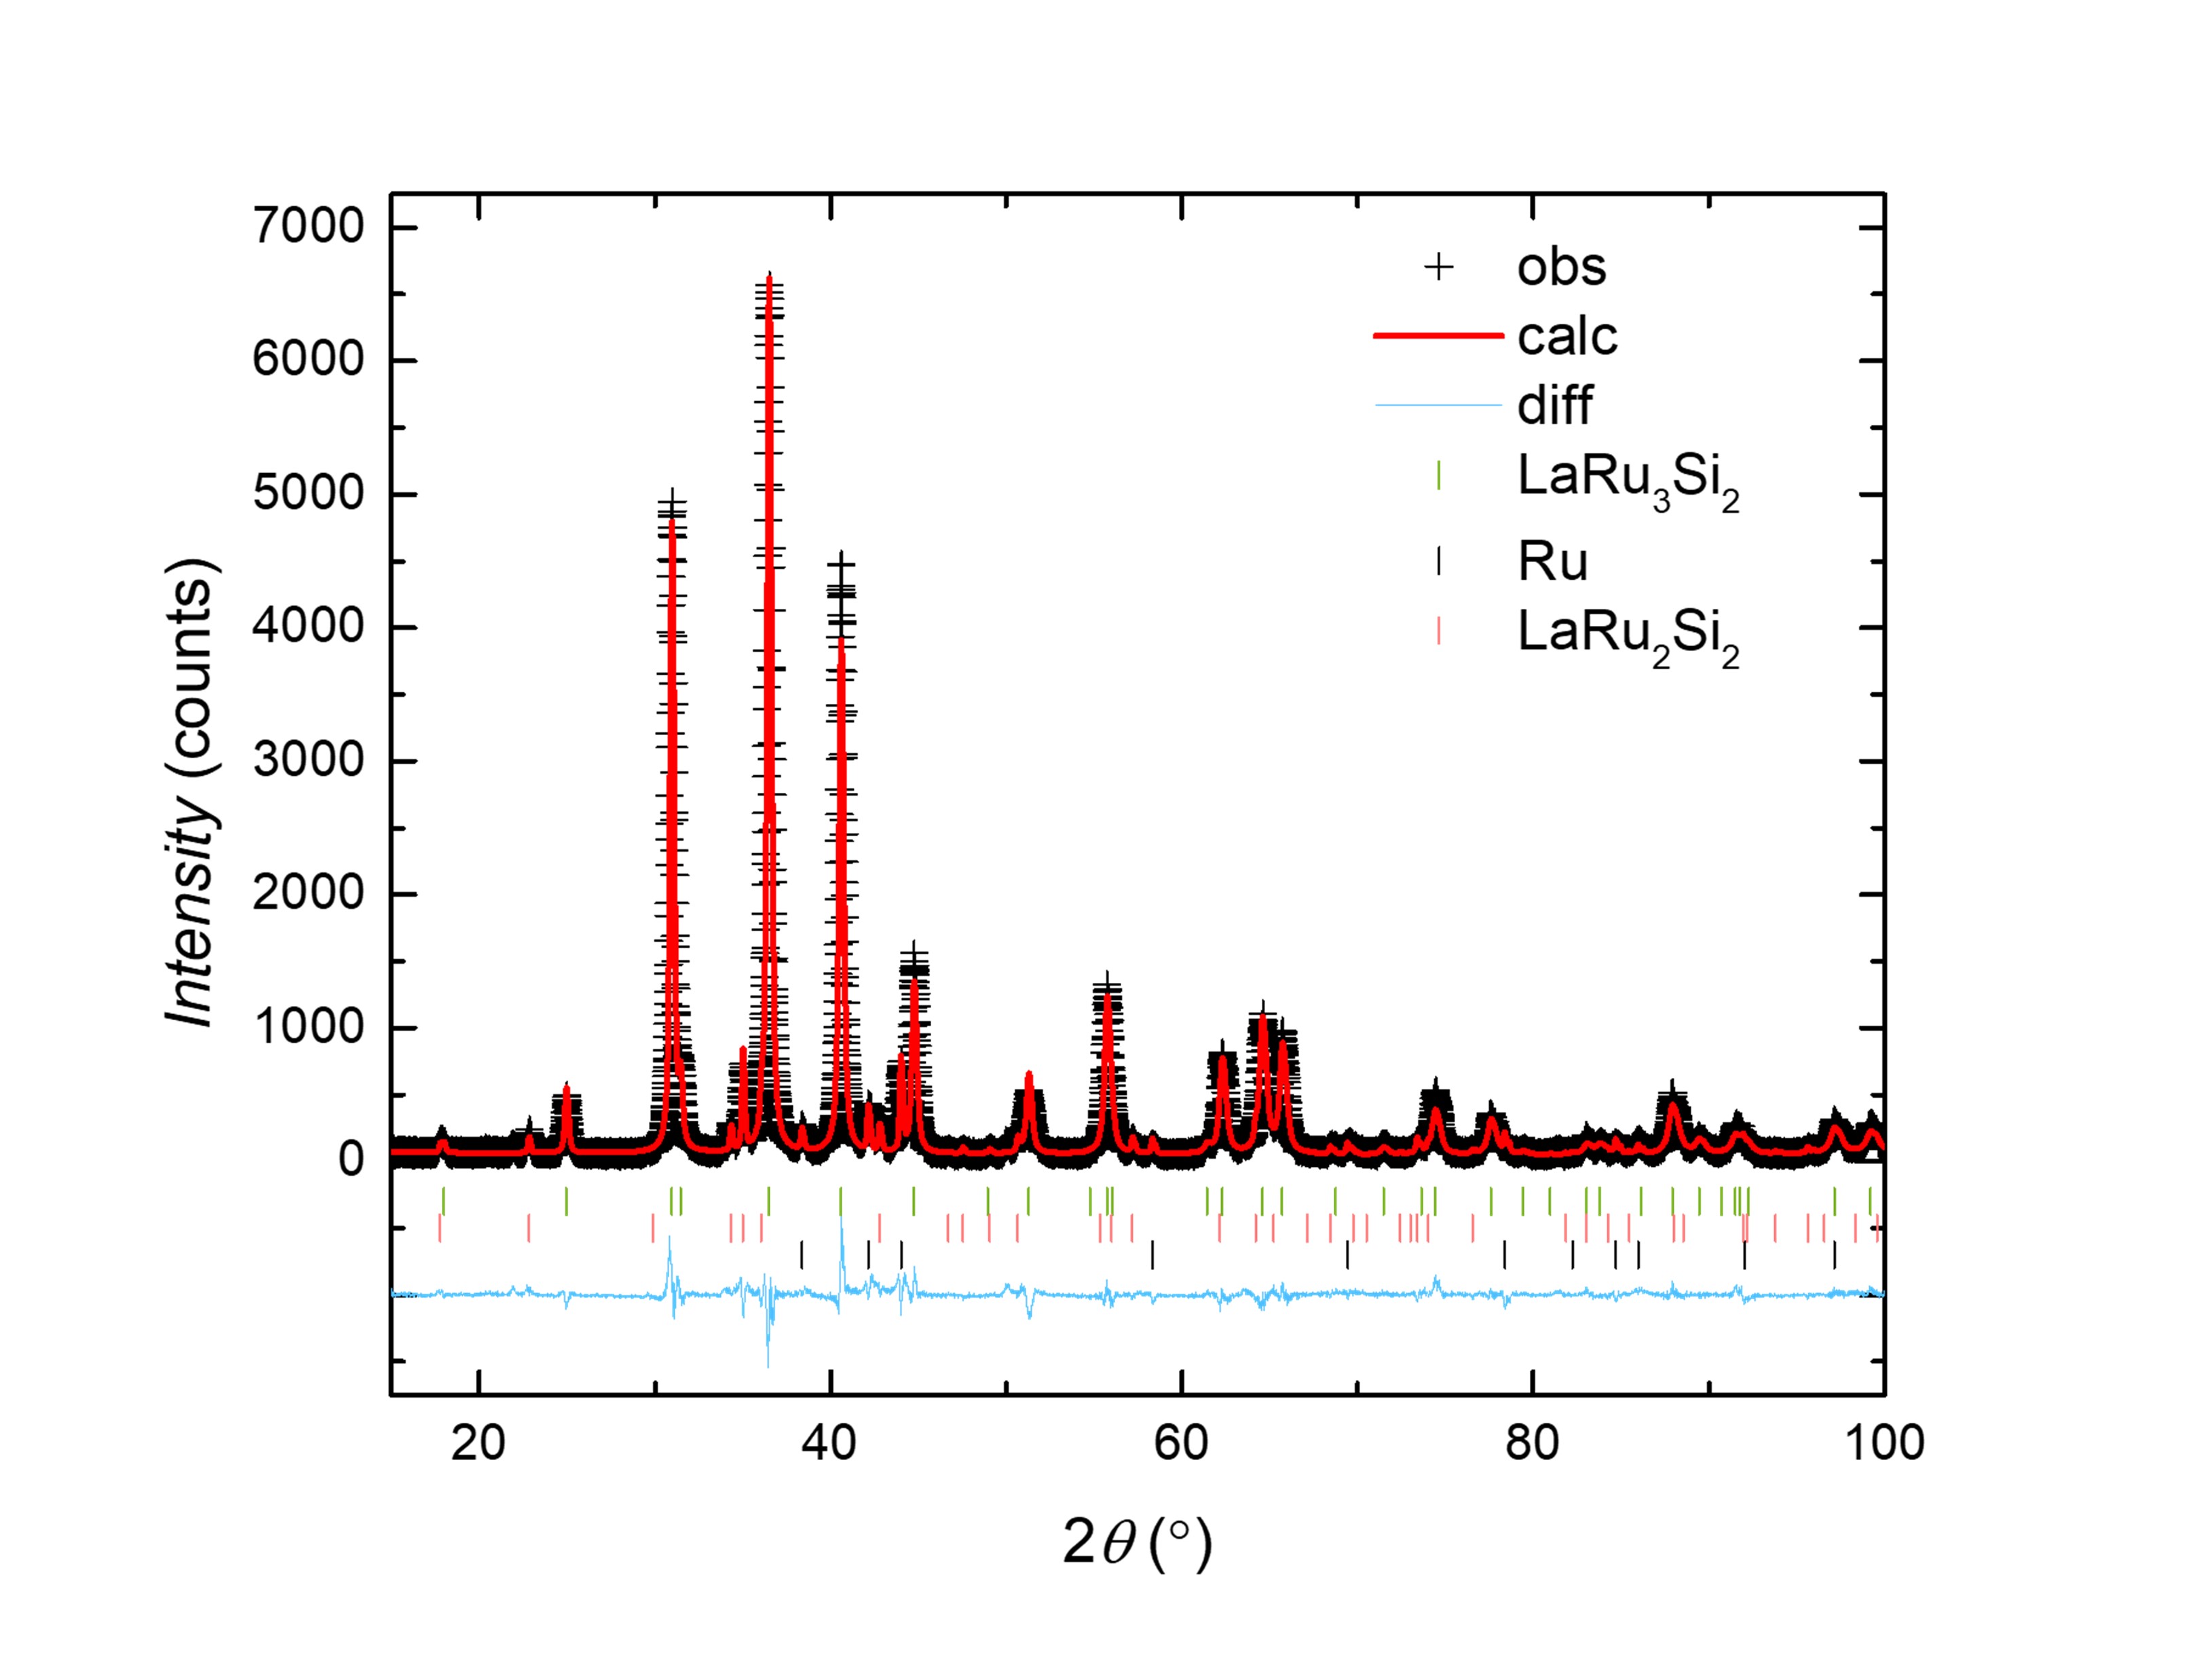
FIG.1 shows the PXRD pattern of an as prepared sample at ambient pressure-temperature () conditions, alongside the calculated pattern. Most of the diffraction peaks can be indexed to the hexagonal structure of LaRu3Si2, P6/, with lattice parameter Å, Å, which is consistent with previous report [6]. Weak impurity peaks were detected from excess Ru and LaRu2Si2. Energy dispersive spectroscopy along with mapping is shown in FIG. 2. From insets of FIG. 2, there are several stripe like region where there is more concentrated Ru, while La and Si show deficiency. Leaving aside such Ru rich regions, constituent elements (La, Ru and Si) are well distributed. Some uniform streaks of La and Si are due to the scratches from polishing, which can be seen in the grey color inset of sample’s morphology. Such inhomogeneity indicates pure Ru as an impurity phase is not evenly distributed in our sample. We noted that the uniform distribution region shows La:Ru:Si ratio as 18.4: 50.7: 30.9, in fair agreement with the main phase LaRu3Si2 stoichiometry (La:Ru:Si = 16.7: 50: 33.3). Considering that we have used ‘factory standards’rather than our own specific ones and given our rather high values, 6-9 (see below), sharp superconducting transition and the value of consistent with the literature, we thus take that the sample is stoichiometric LaRu3Si2 and consider the studied properties of the sample to be intrinsic. The absence of the LaRu2Si2 phase in EDS and further in high pressure PXRD (shown in FIG. 9 below) is in contrast with our ambient PXRD result, where a significantly larger amount of crushed arc melted sample was examined. Altogether this suggests that LaRu2Si2 could be more irregularly dispersed.
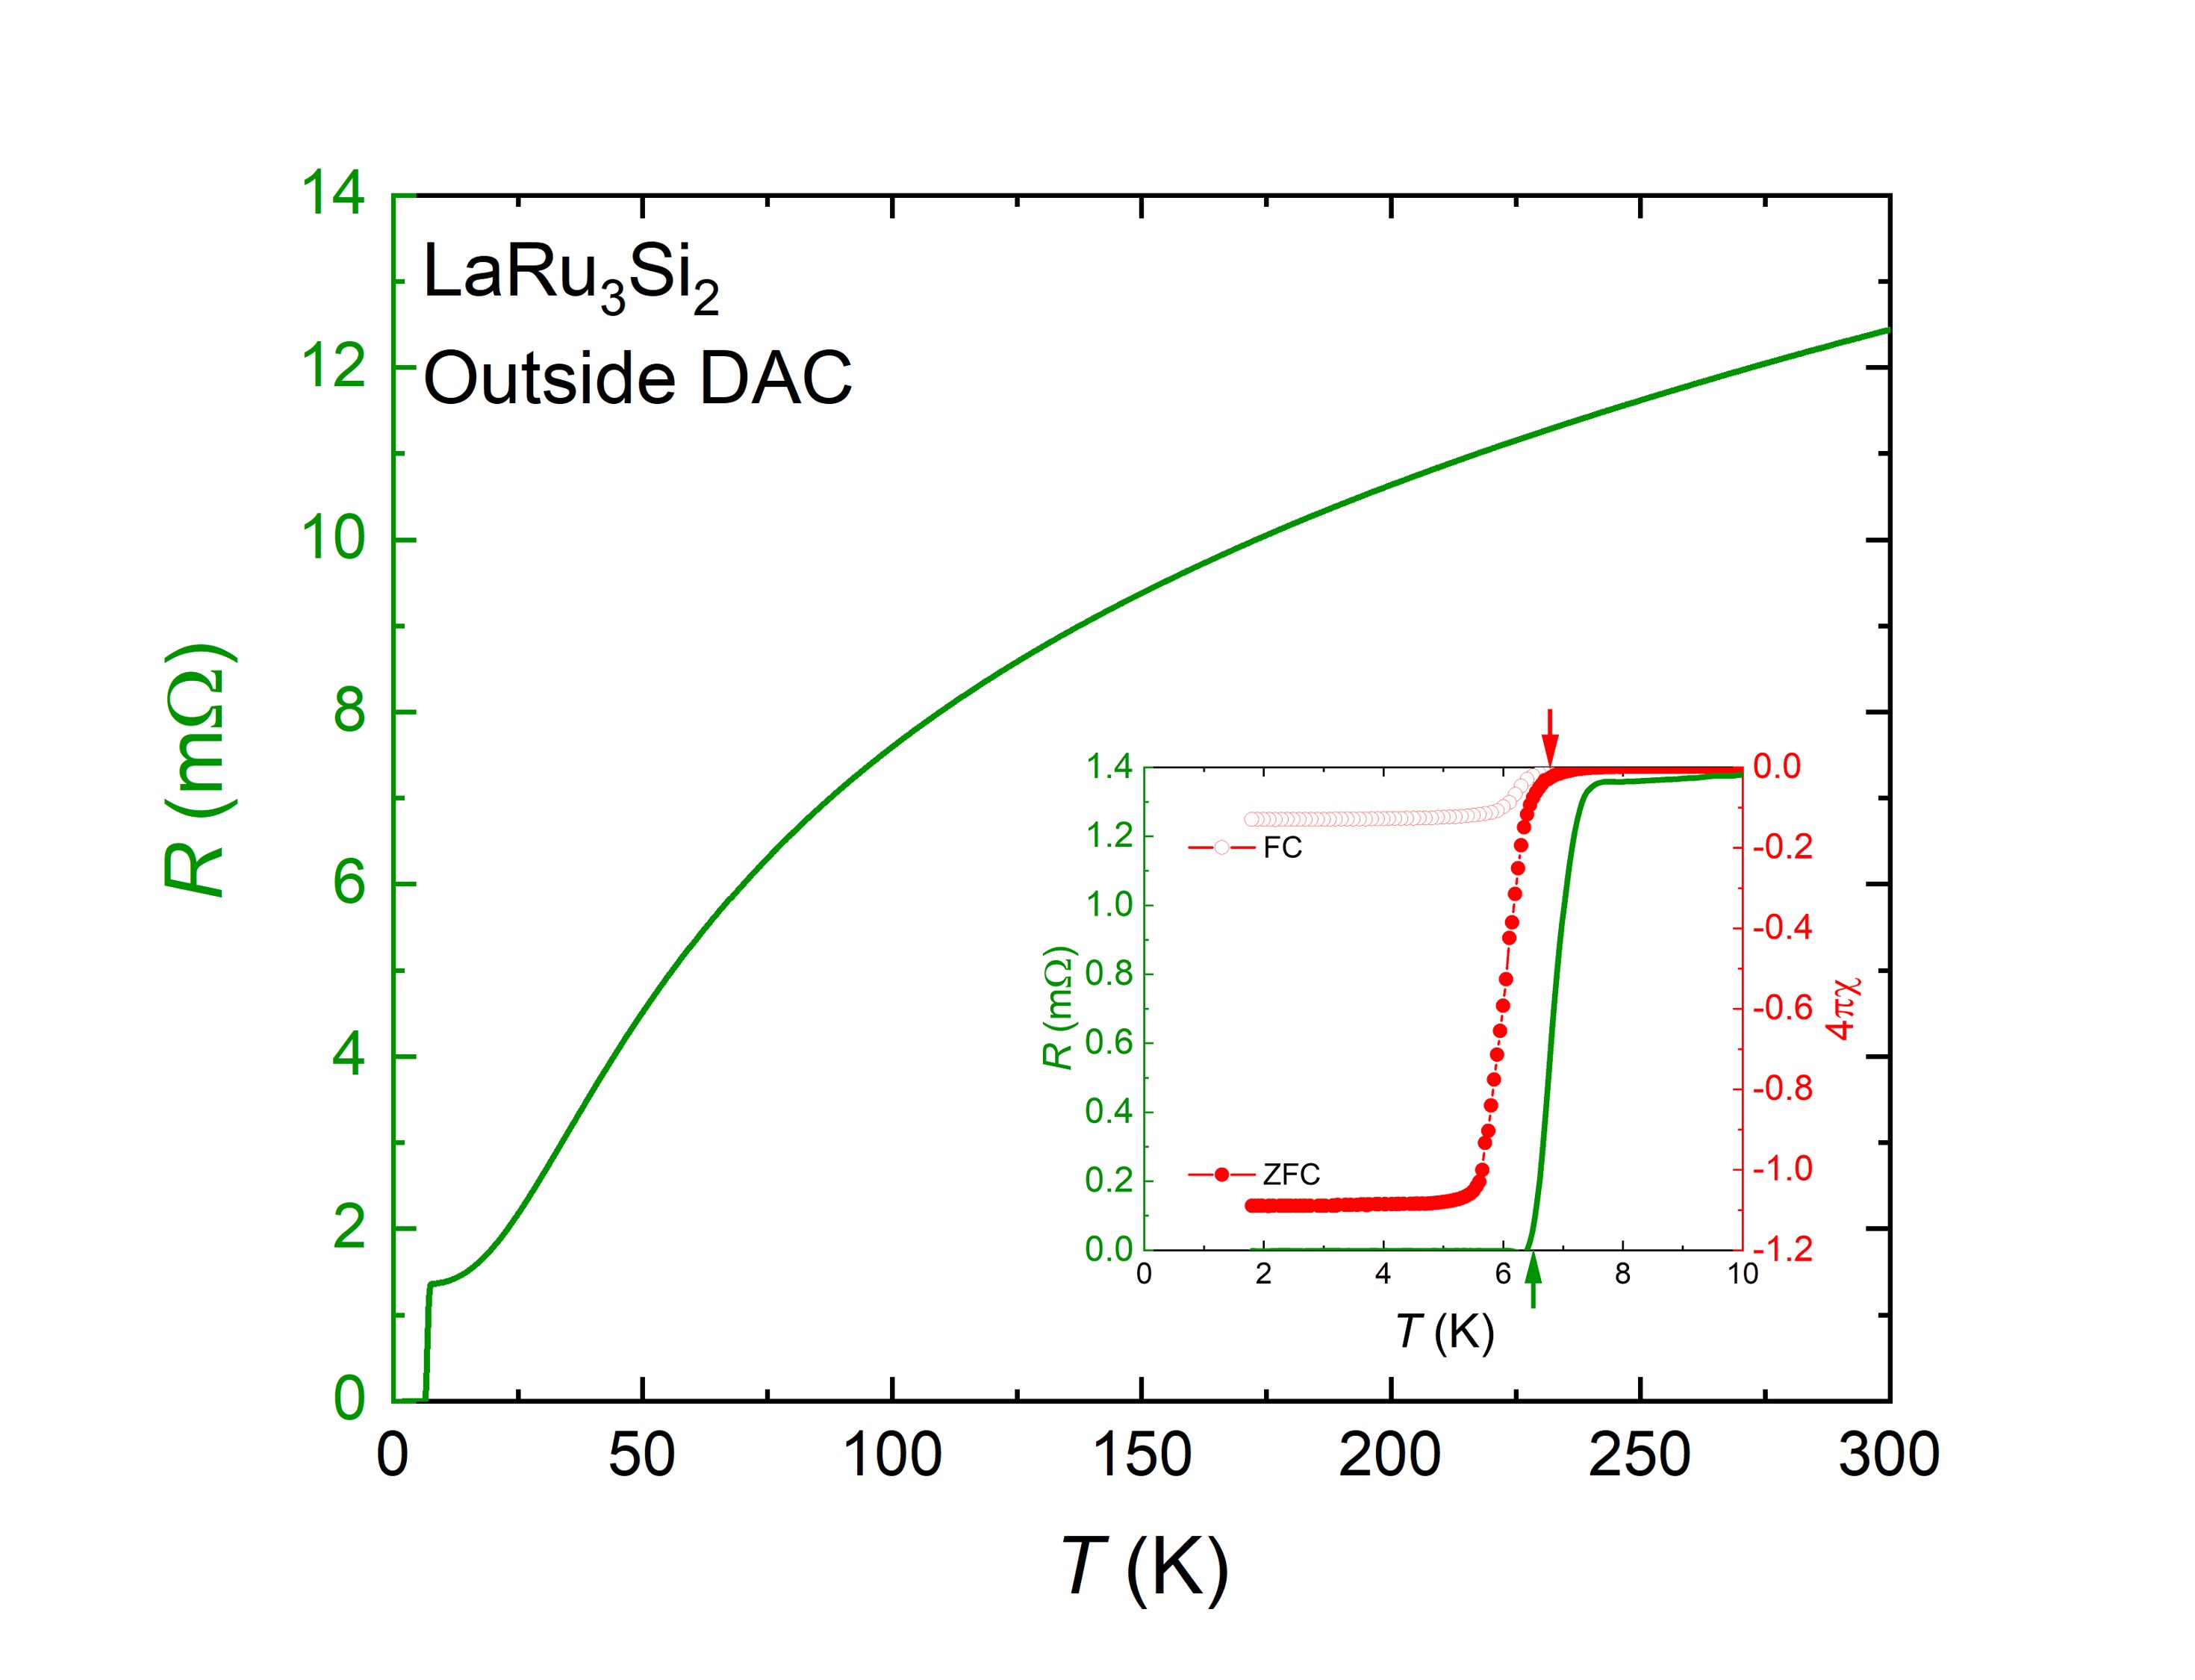
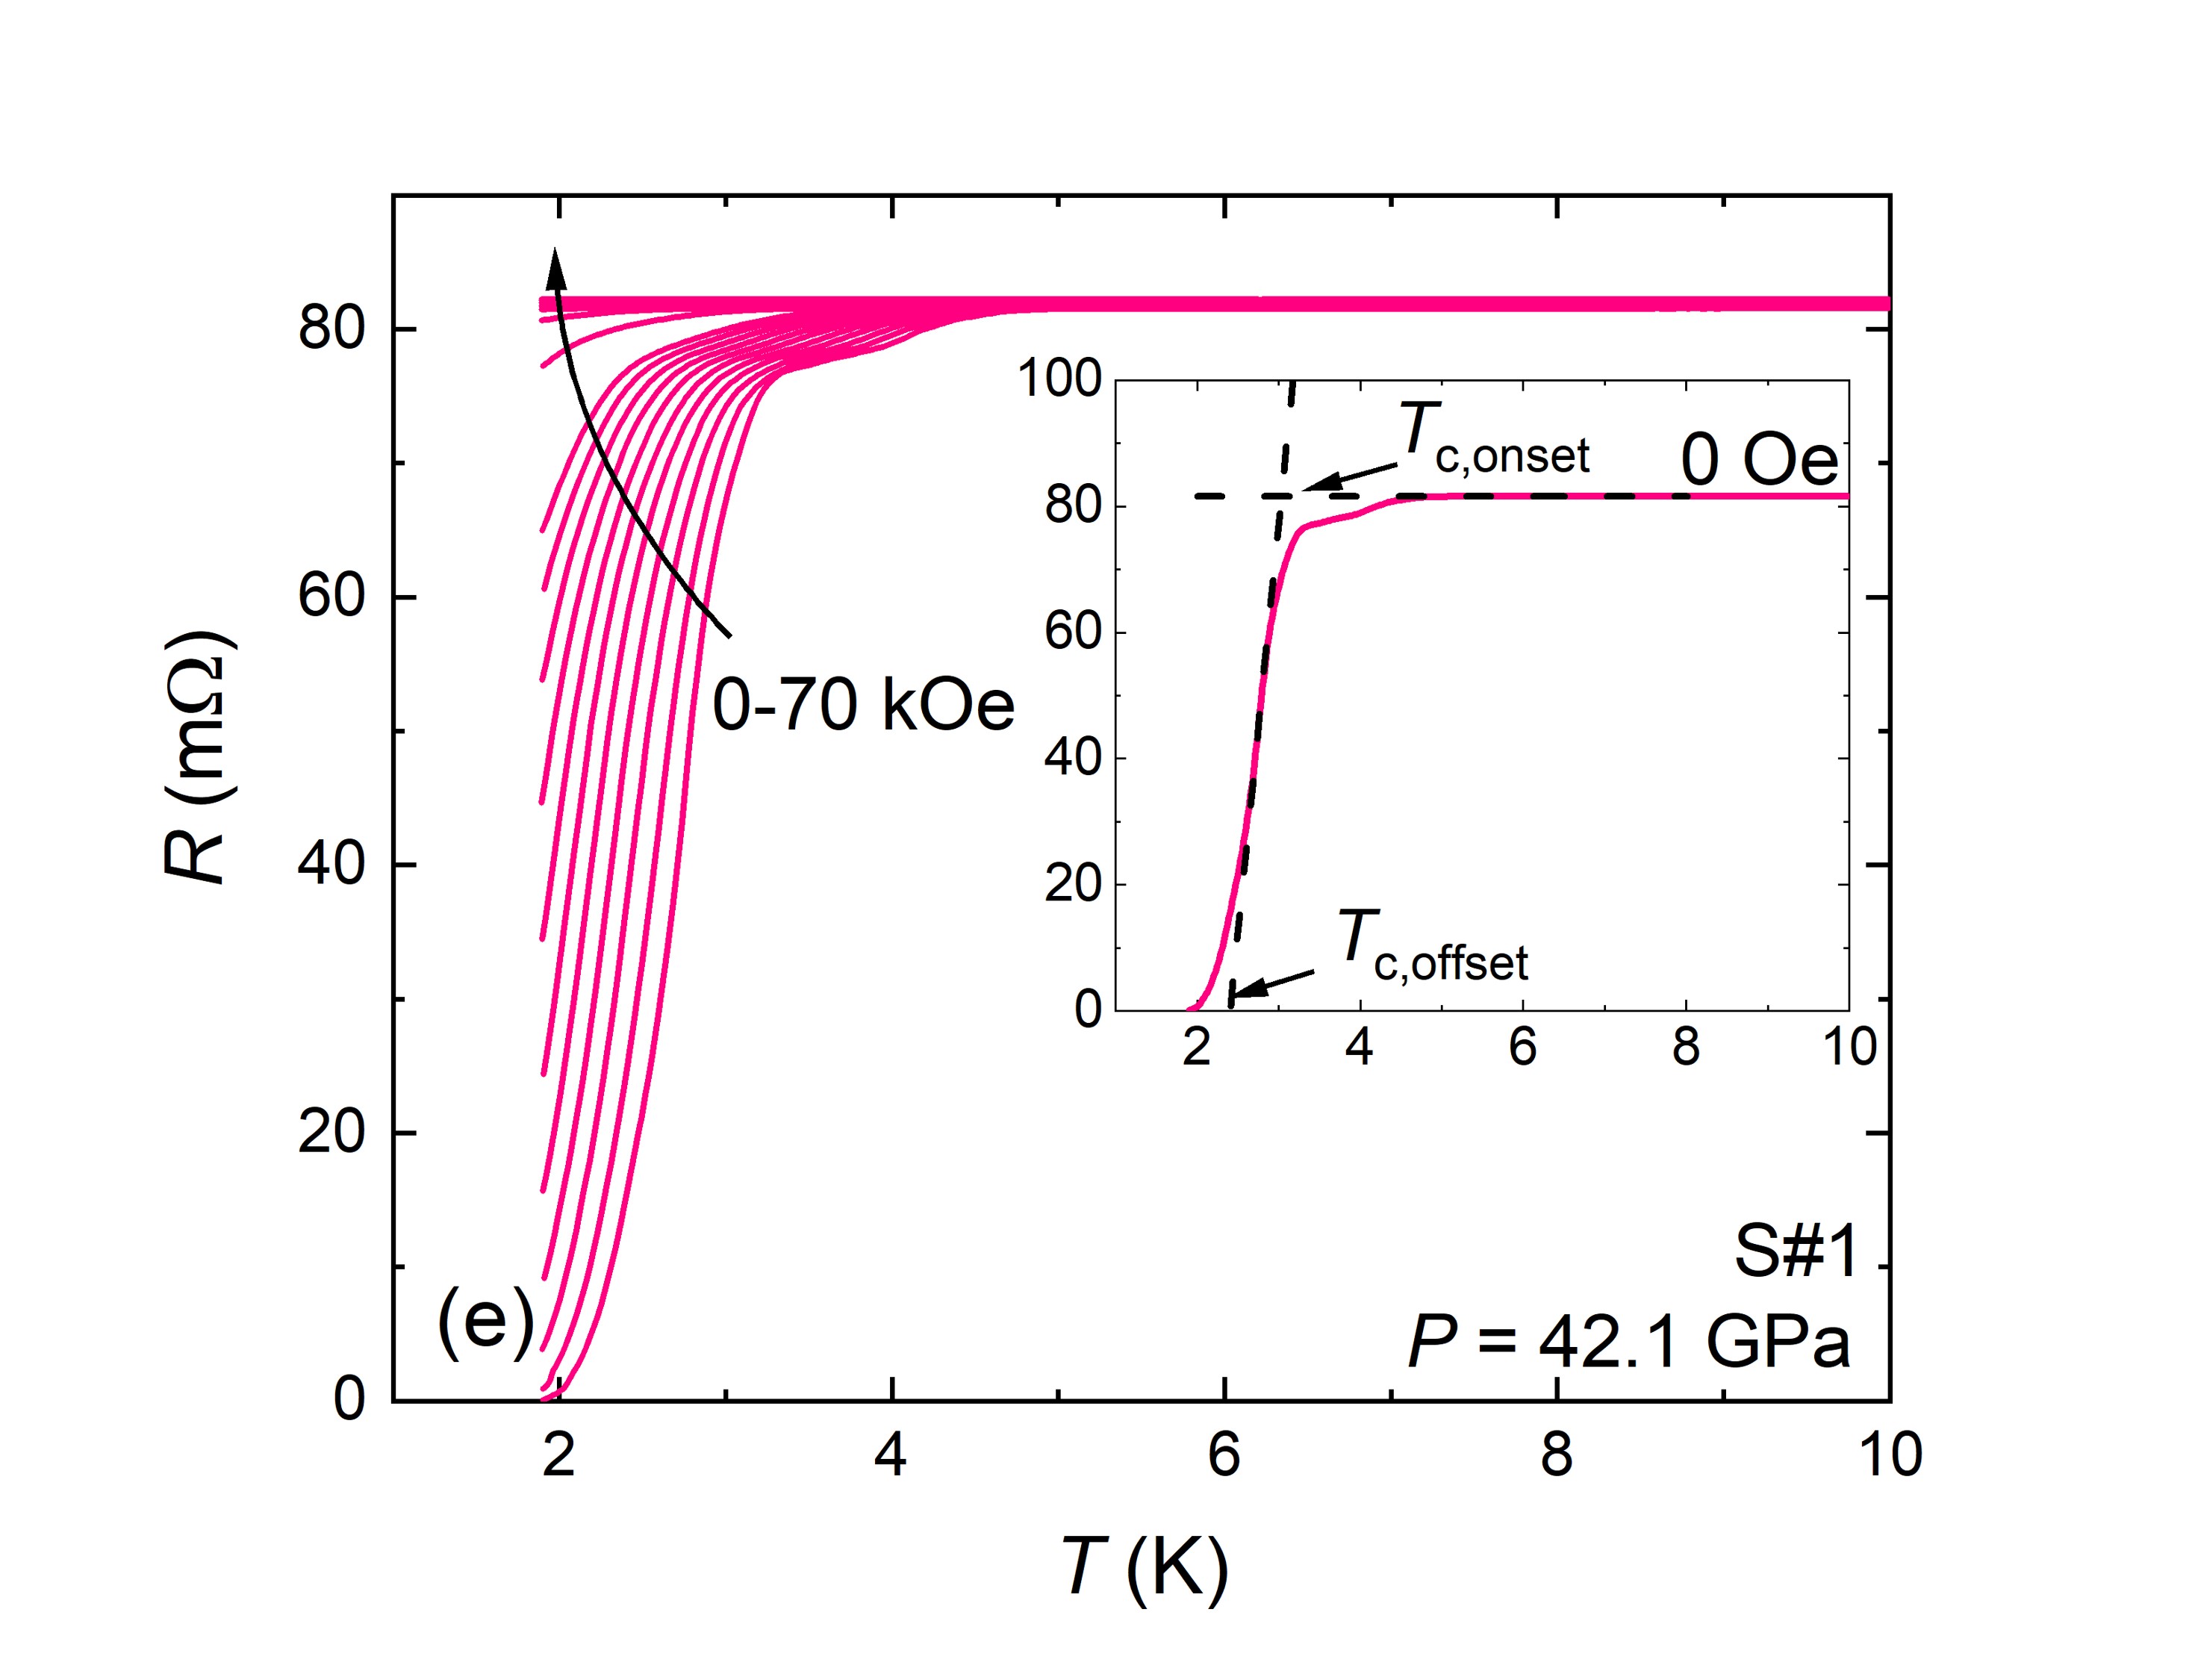
To characterize the superconducting (SC) state, temperature dependent magnetization measurement and electrical resistance measurement were performed at ambient pressure. FIG. 3 shows the zero field resistance measurement from 1.8 K to 300 K, revealing metallic behavior of decreasing resistance upon cooling along with a sharp superconducting transition starting at 7.1 K along with an unusual shoulder-like curve shape in good agreement with the previous report [12]. FIG. 3 inset presents the zero-field-cooled (ZFC) and field-cooled (FC) magnetization measurements of a three dimensional, irregularly shaped sample in an applied field of 20 Oe. The susceptibility was calculated by approximating a spherical sample geometry, thus demagnetization factor taken as , . At 1.8 K, ZFC susceptibility reaches -1.09, close to -1, consistent with the 100% volume fraction of the as prepared LaRu3Si2 sample, although there remains small amount of secondary phases of Ru and LaRu2Si2. The offset of superconducting transition in is determined by the intersection of maximum slope and axis, whereas the onset of superconducting transition in is determined based on the initial deviation of the curve from starts, as indicated in the FIG. 3 inset. Both of them agrees well and give K, which is consistent with in previous report [25].
III.2 Resistance under Pressure
We performed high pressure resistance measurements on two samples from the same batch, denoted by sample S#1 and S#2. Sample S#1 was measured with higher pressure density up to 65.5 GPa, whereas S#2 was measured up to 60.5 GPa. Both samples show a SC dome under pressure but with minor differences at high pressure. A detailed discussion of the resistance measurements of the two samples can be found in the Appendix A. It should be noted that upon cooling, the DAC could experience pressure change due thermal contraction of cell components. Based on the previous report of a similar design DAC [26], we expect not more than 1-2 GPa increase of pressure in the cell on cooling.
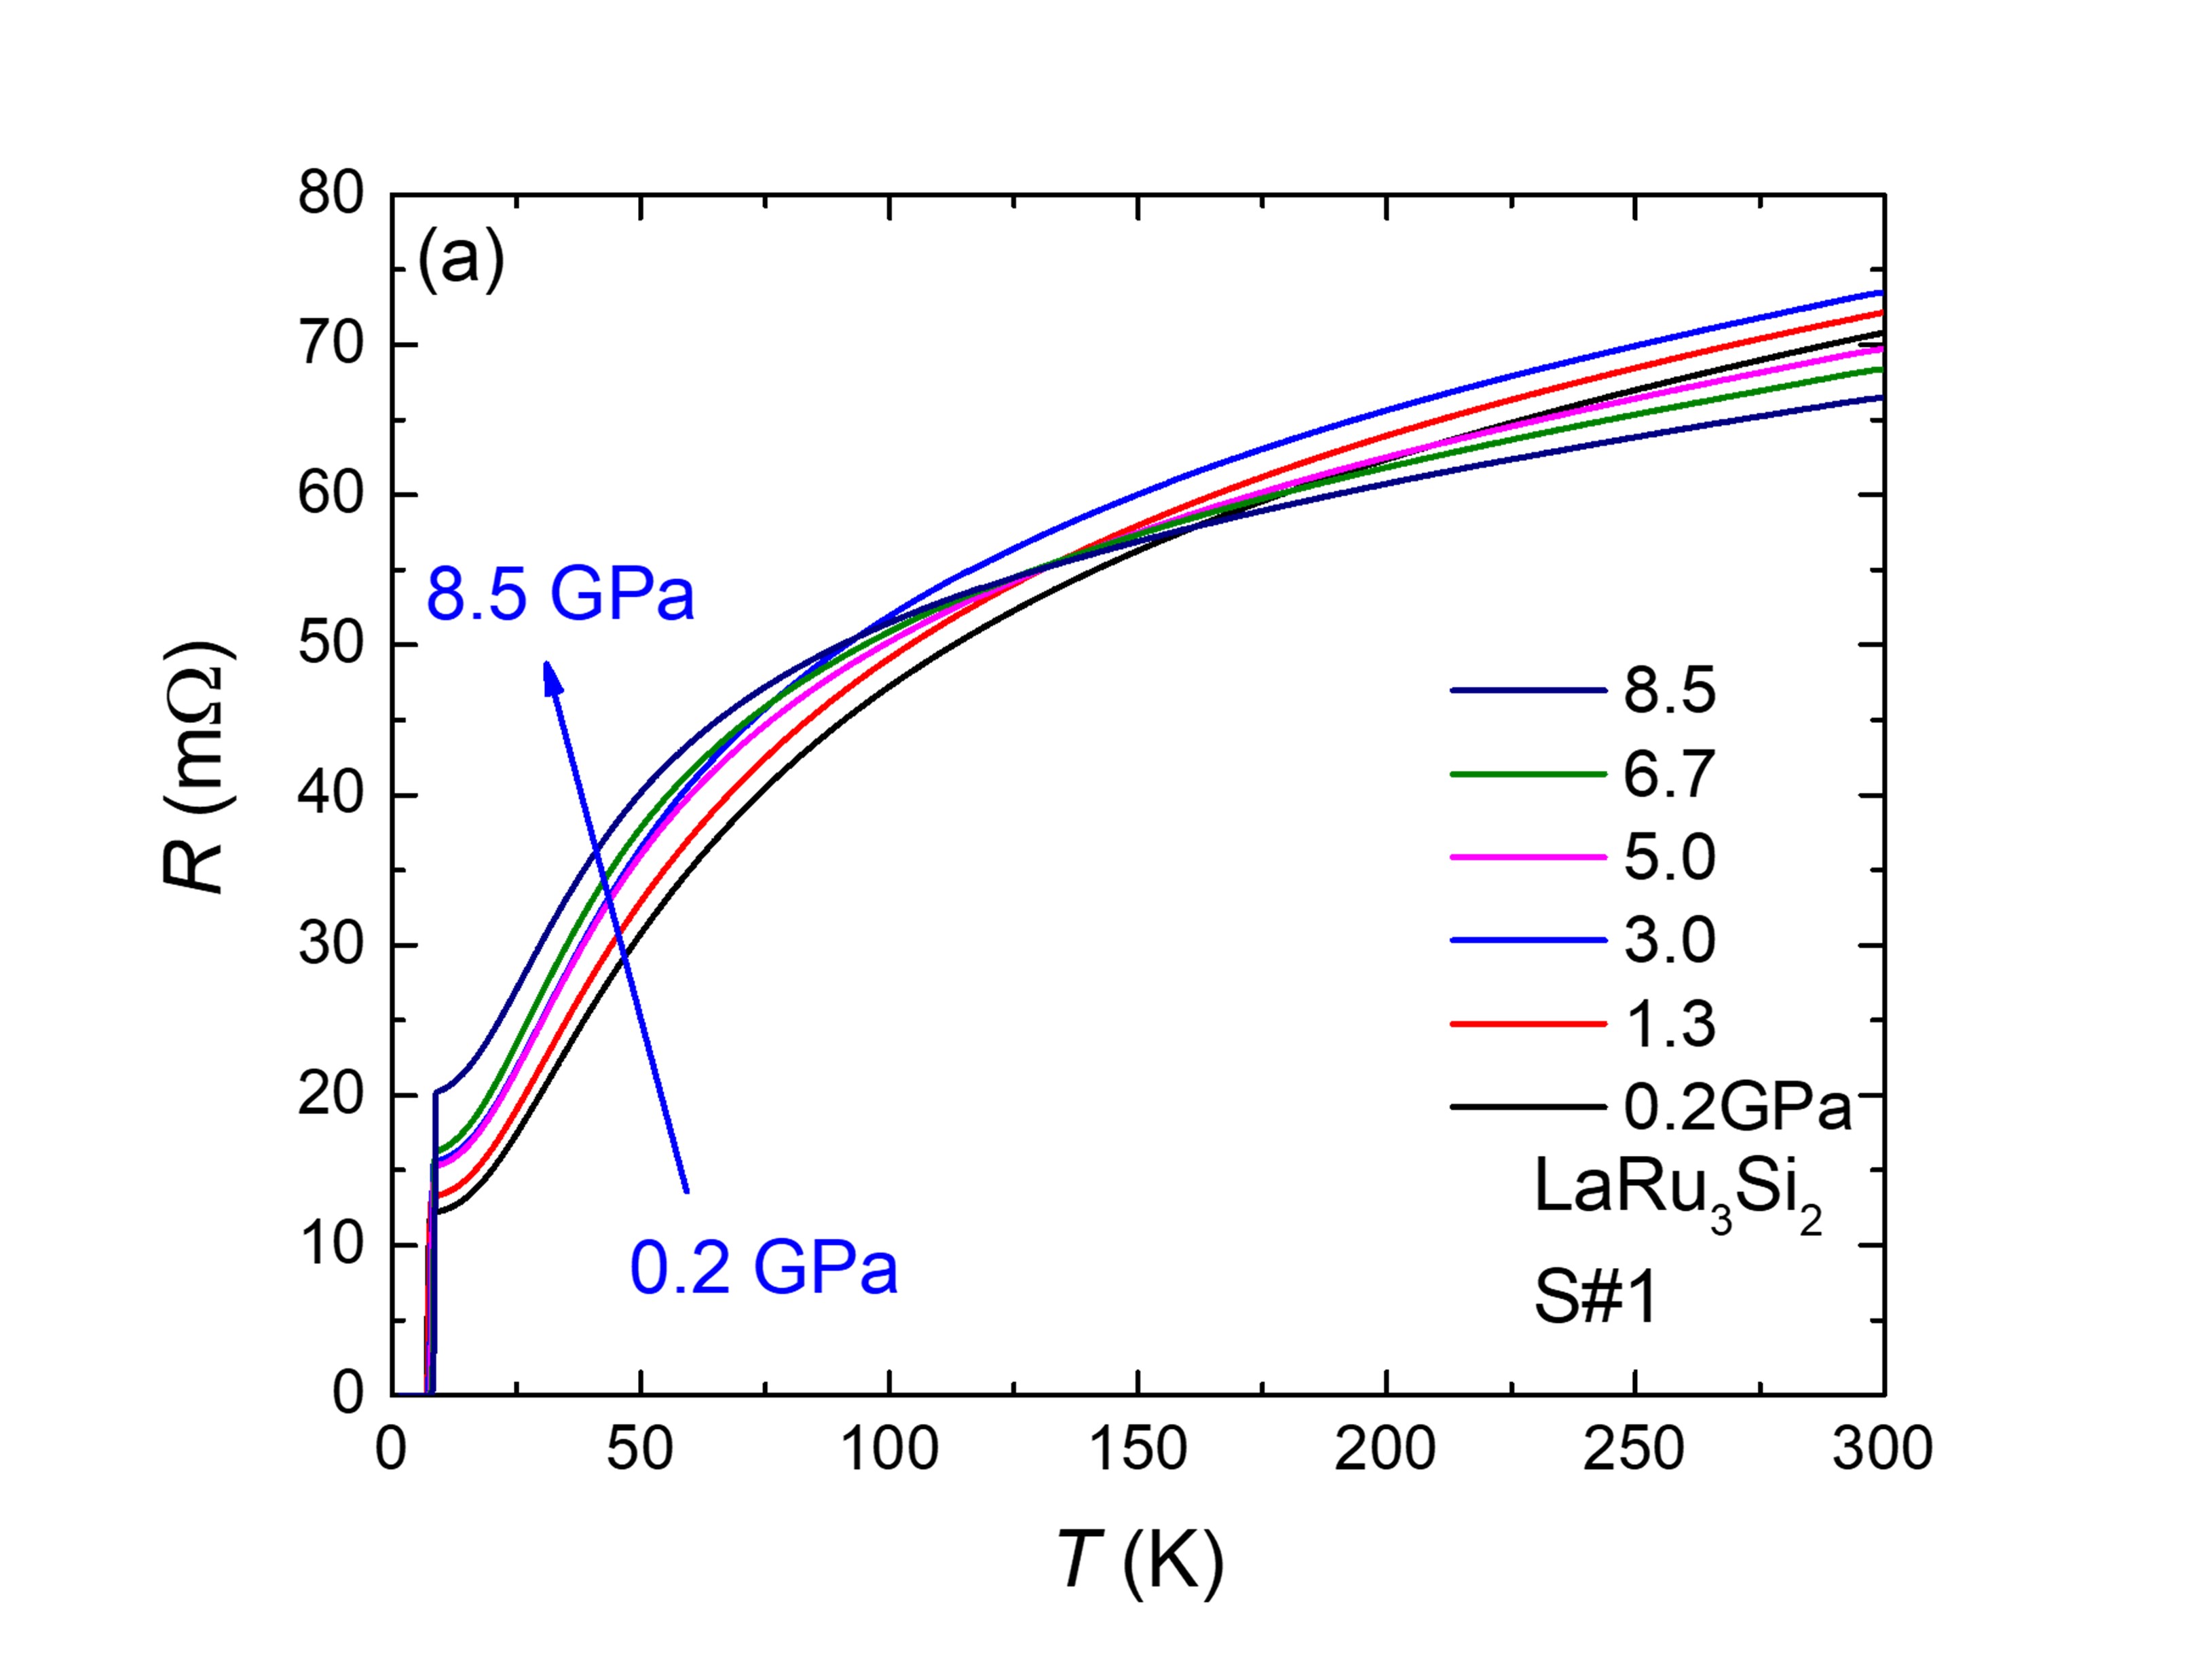
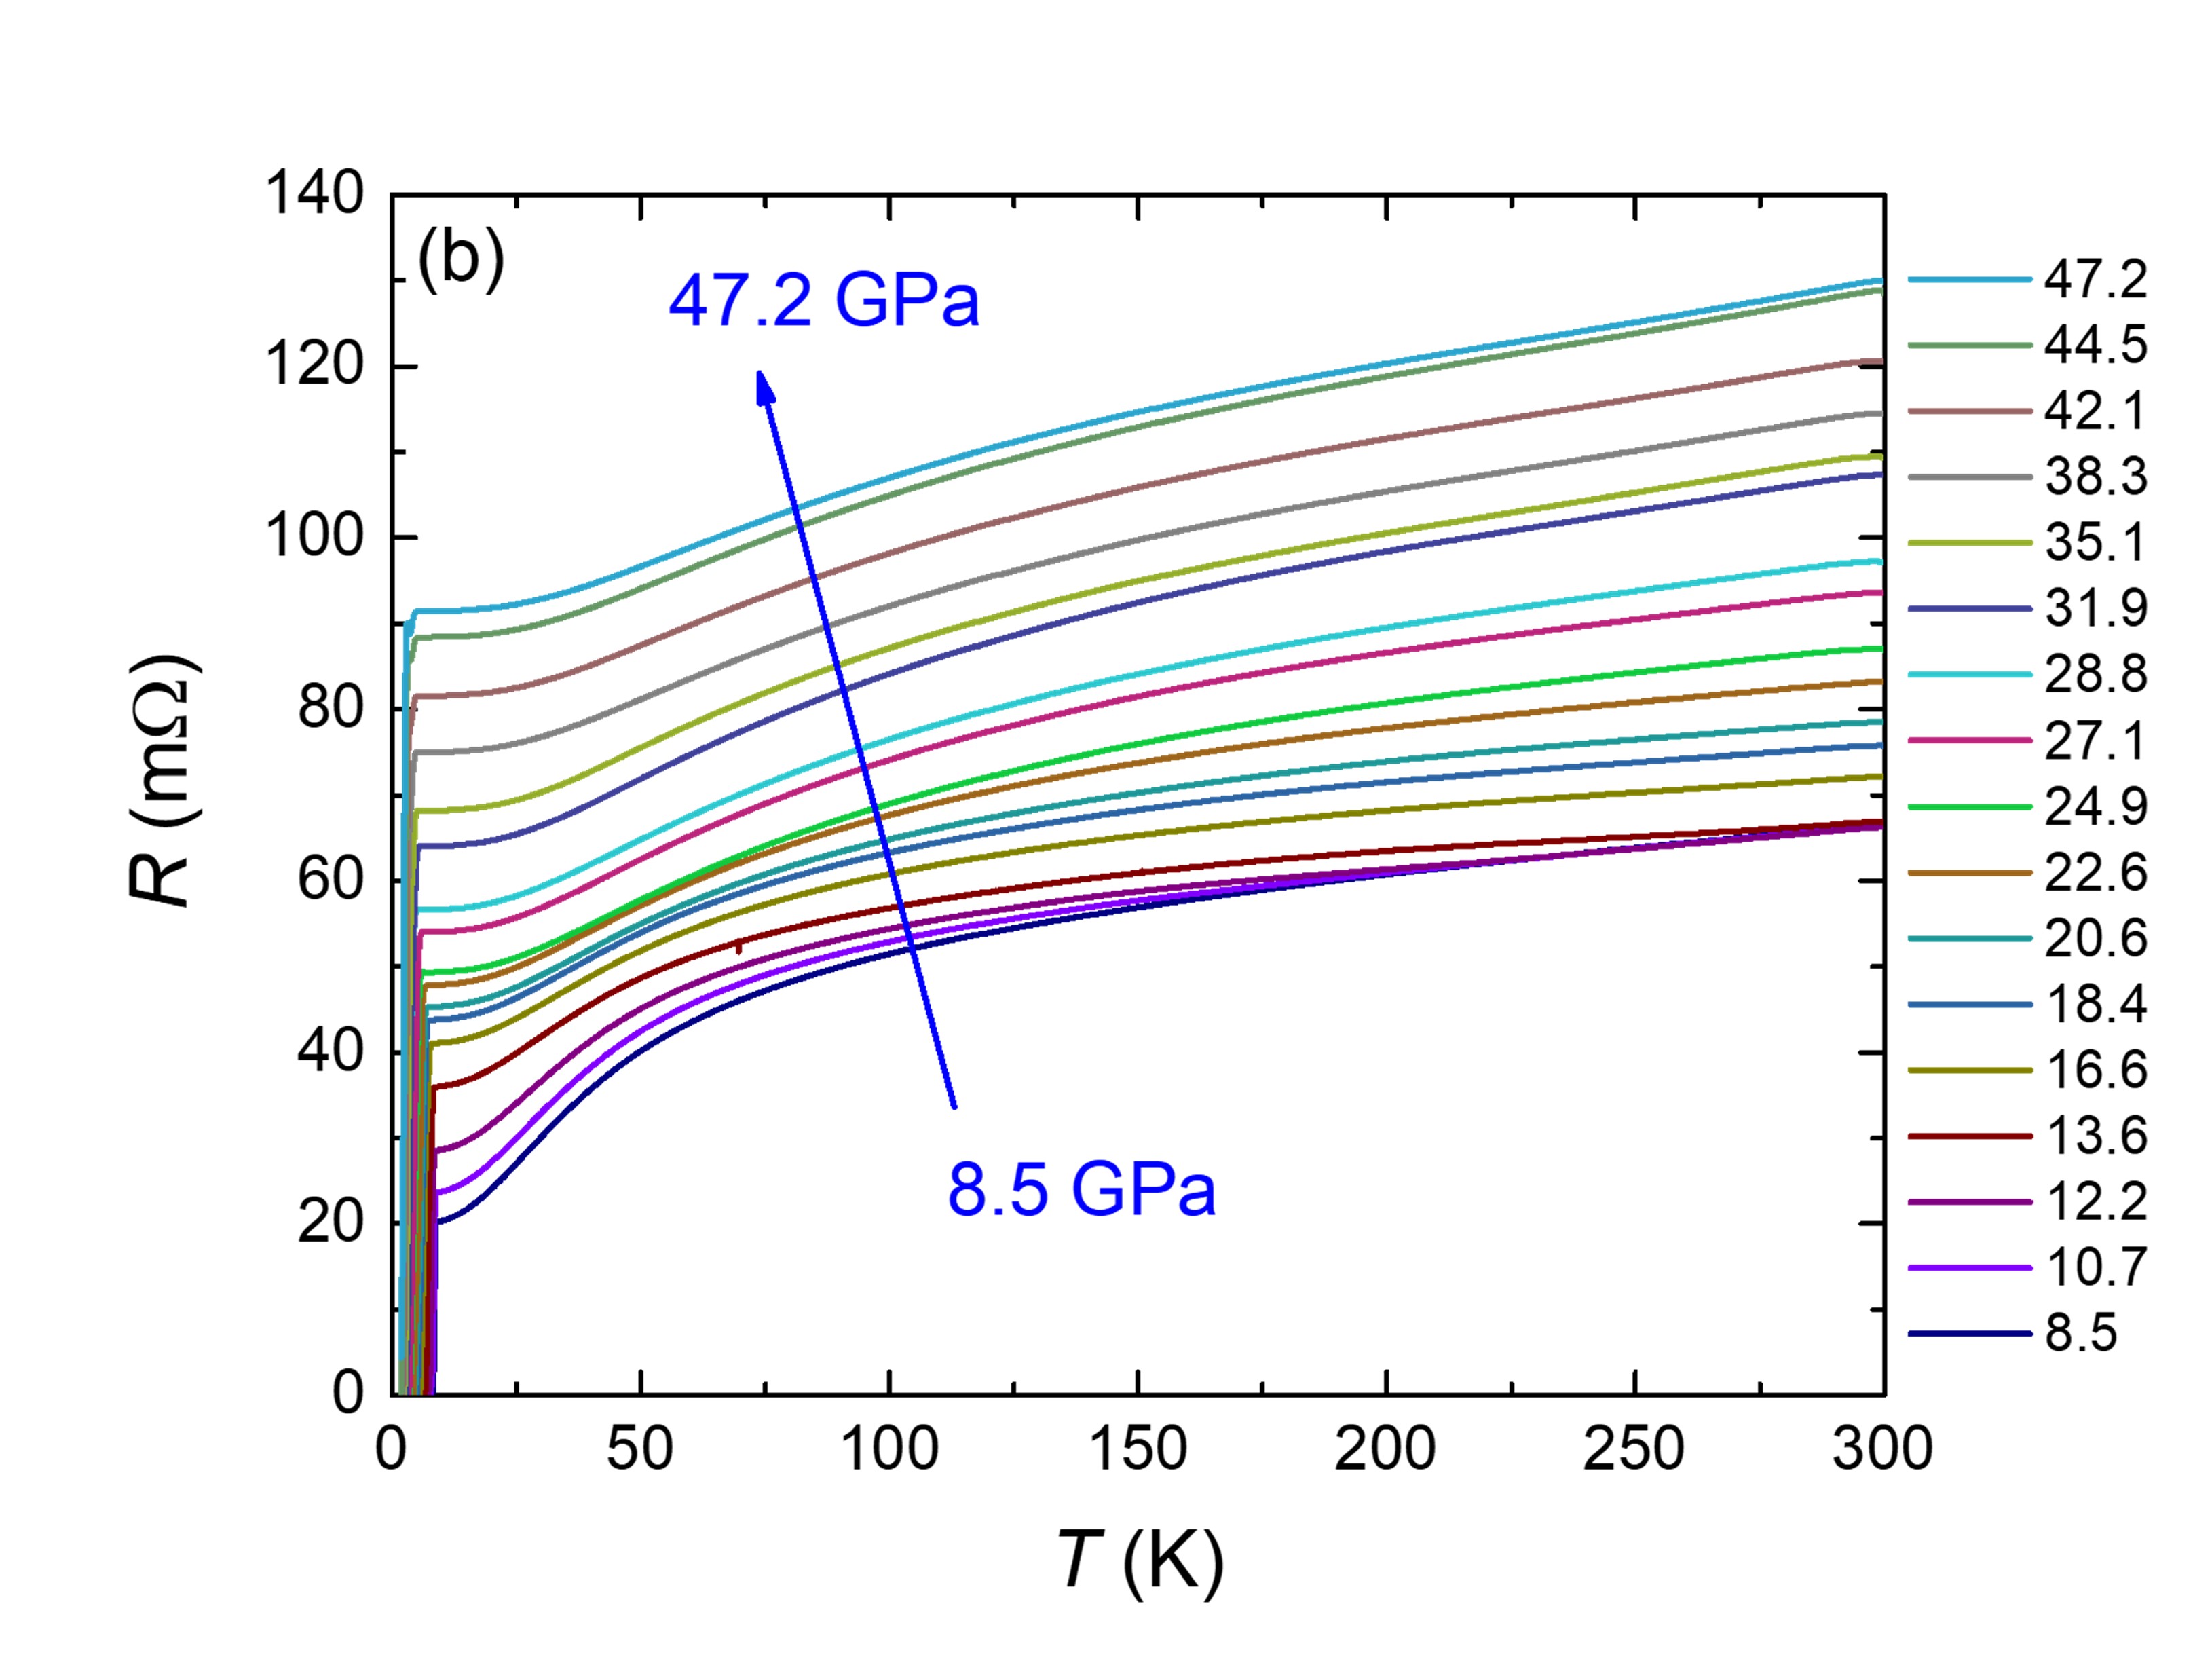
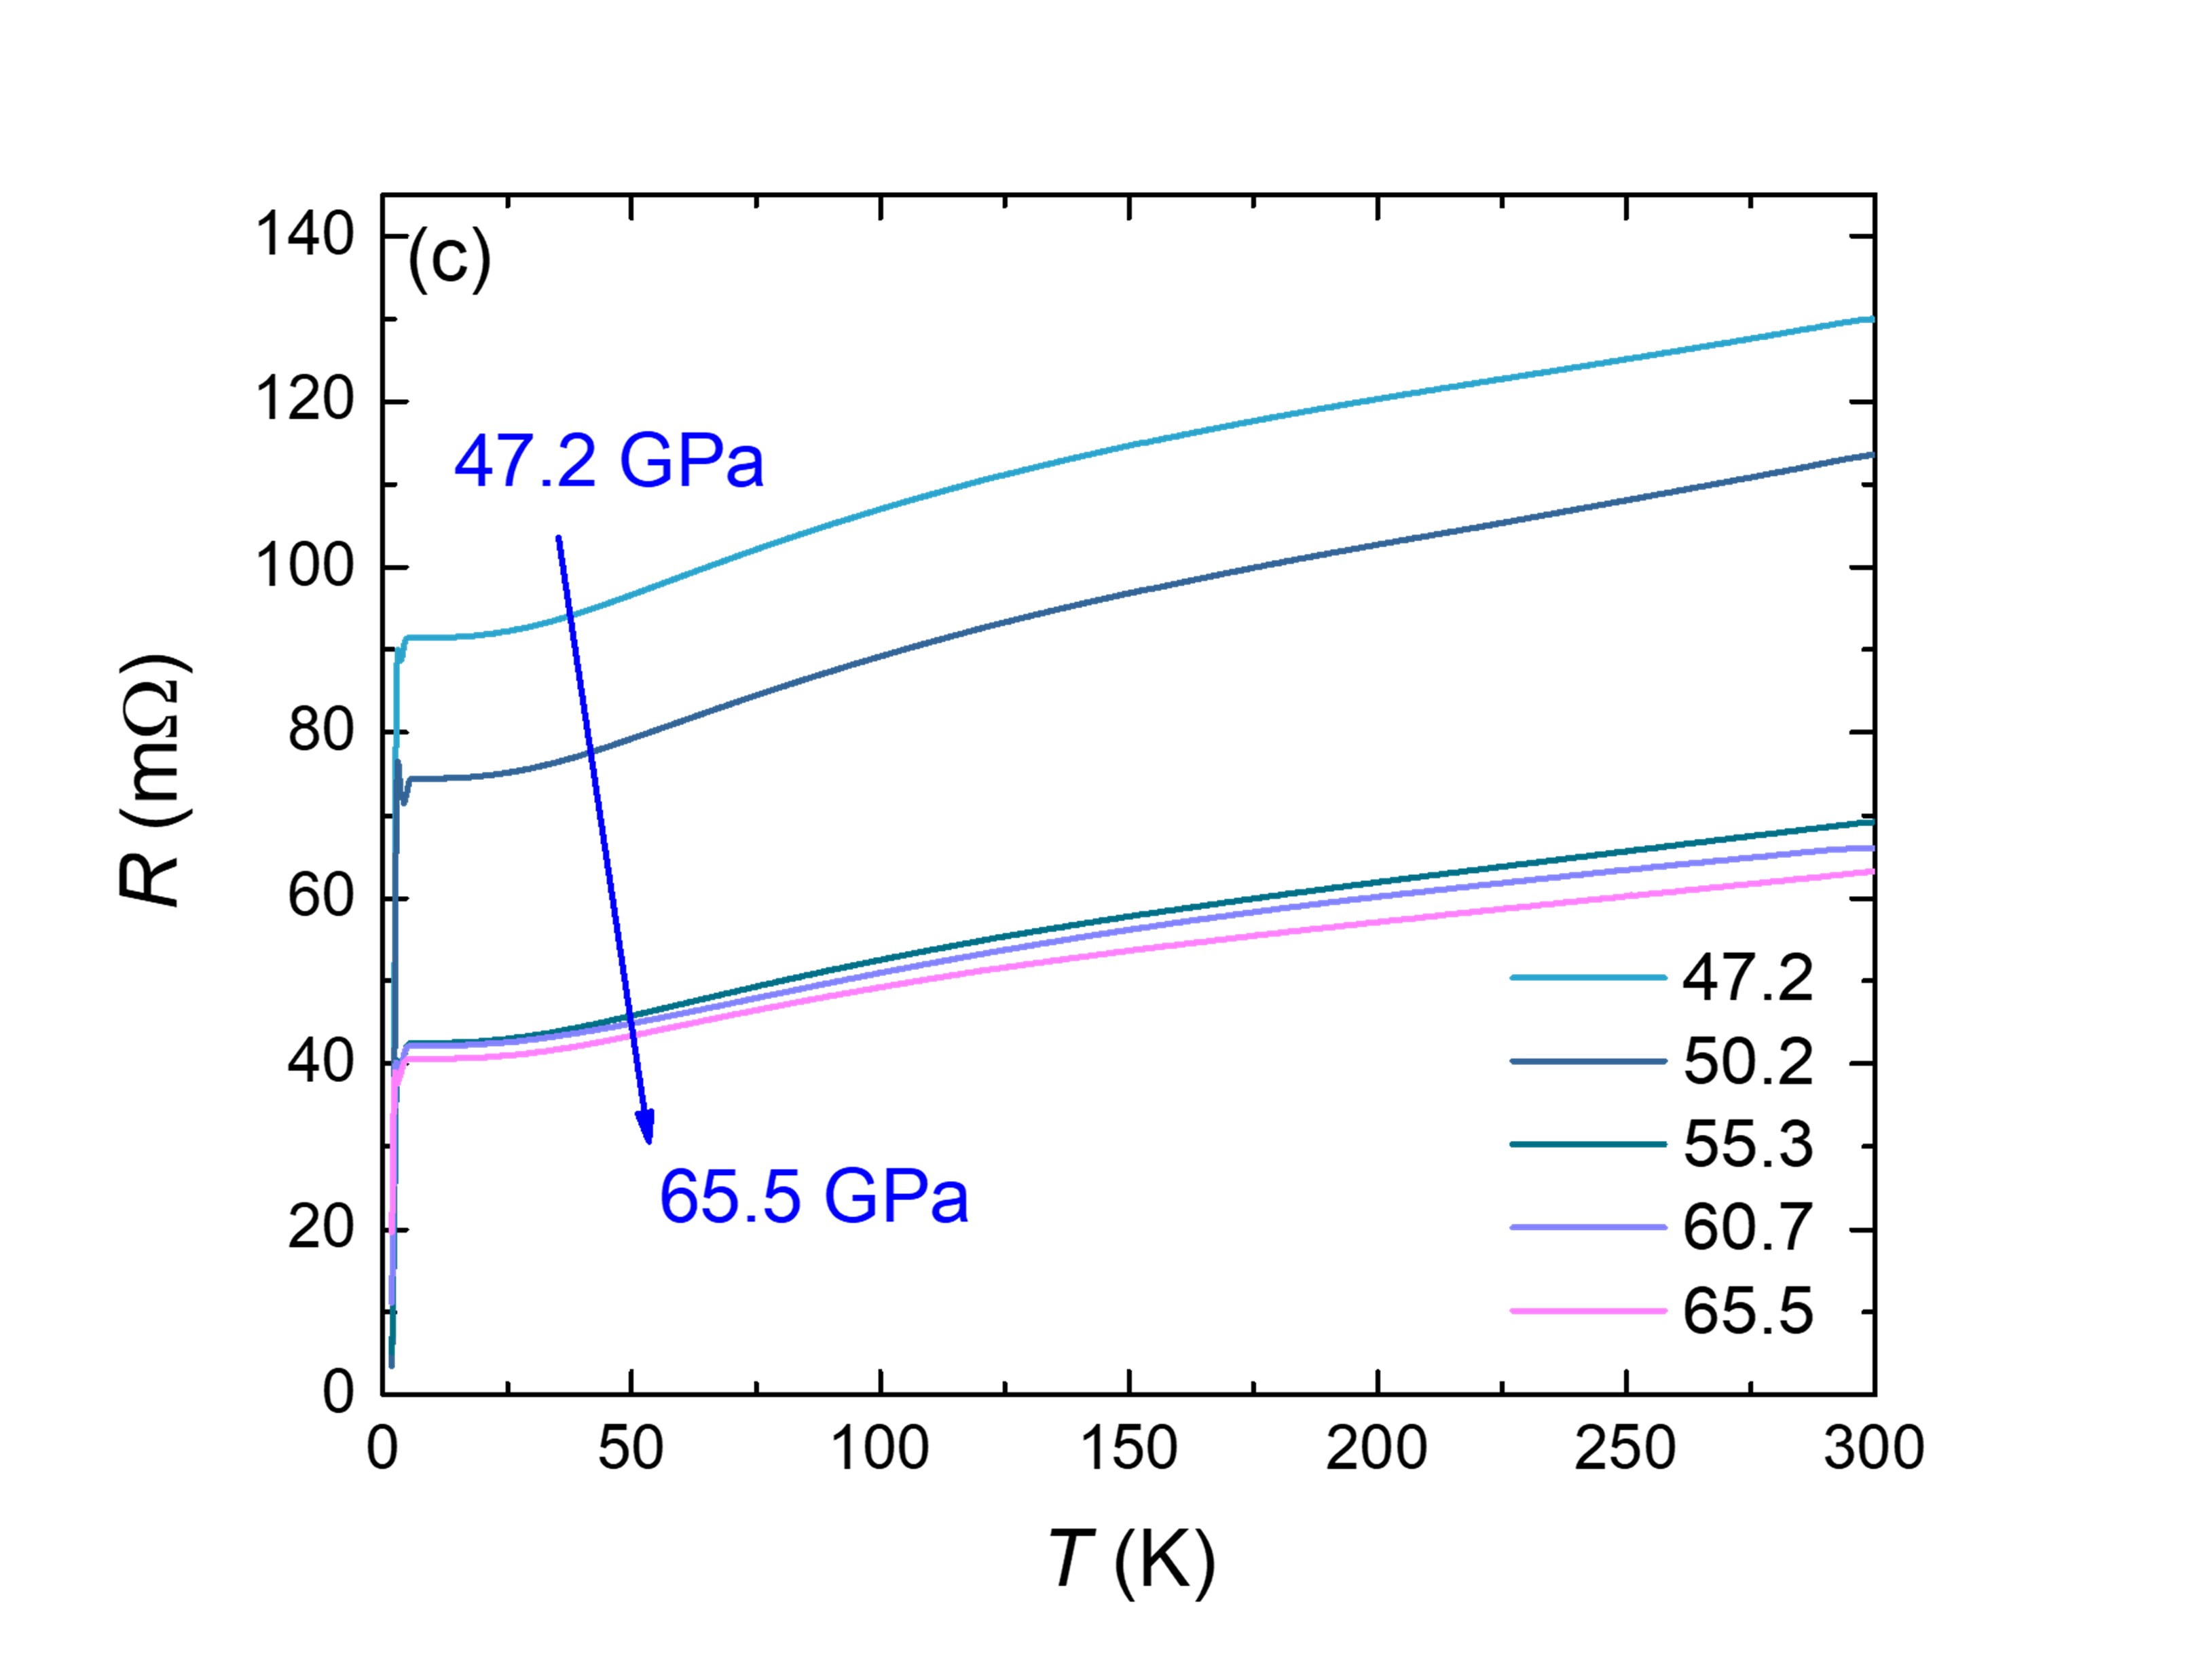
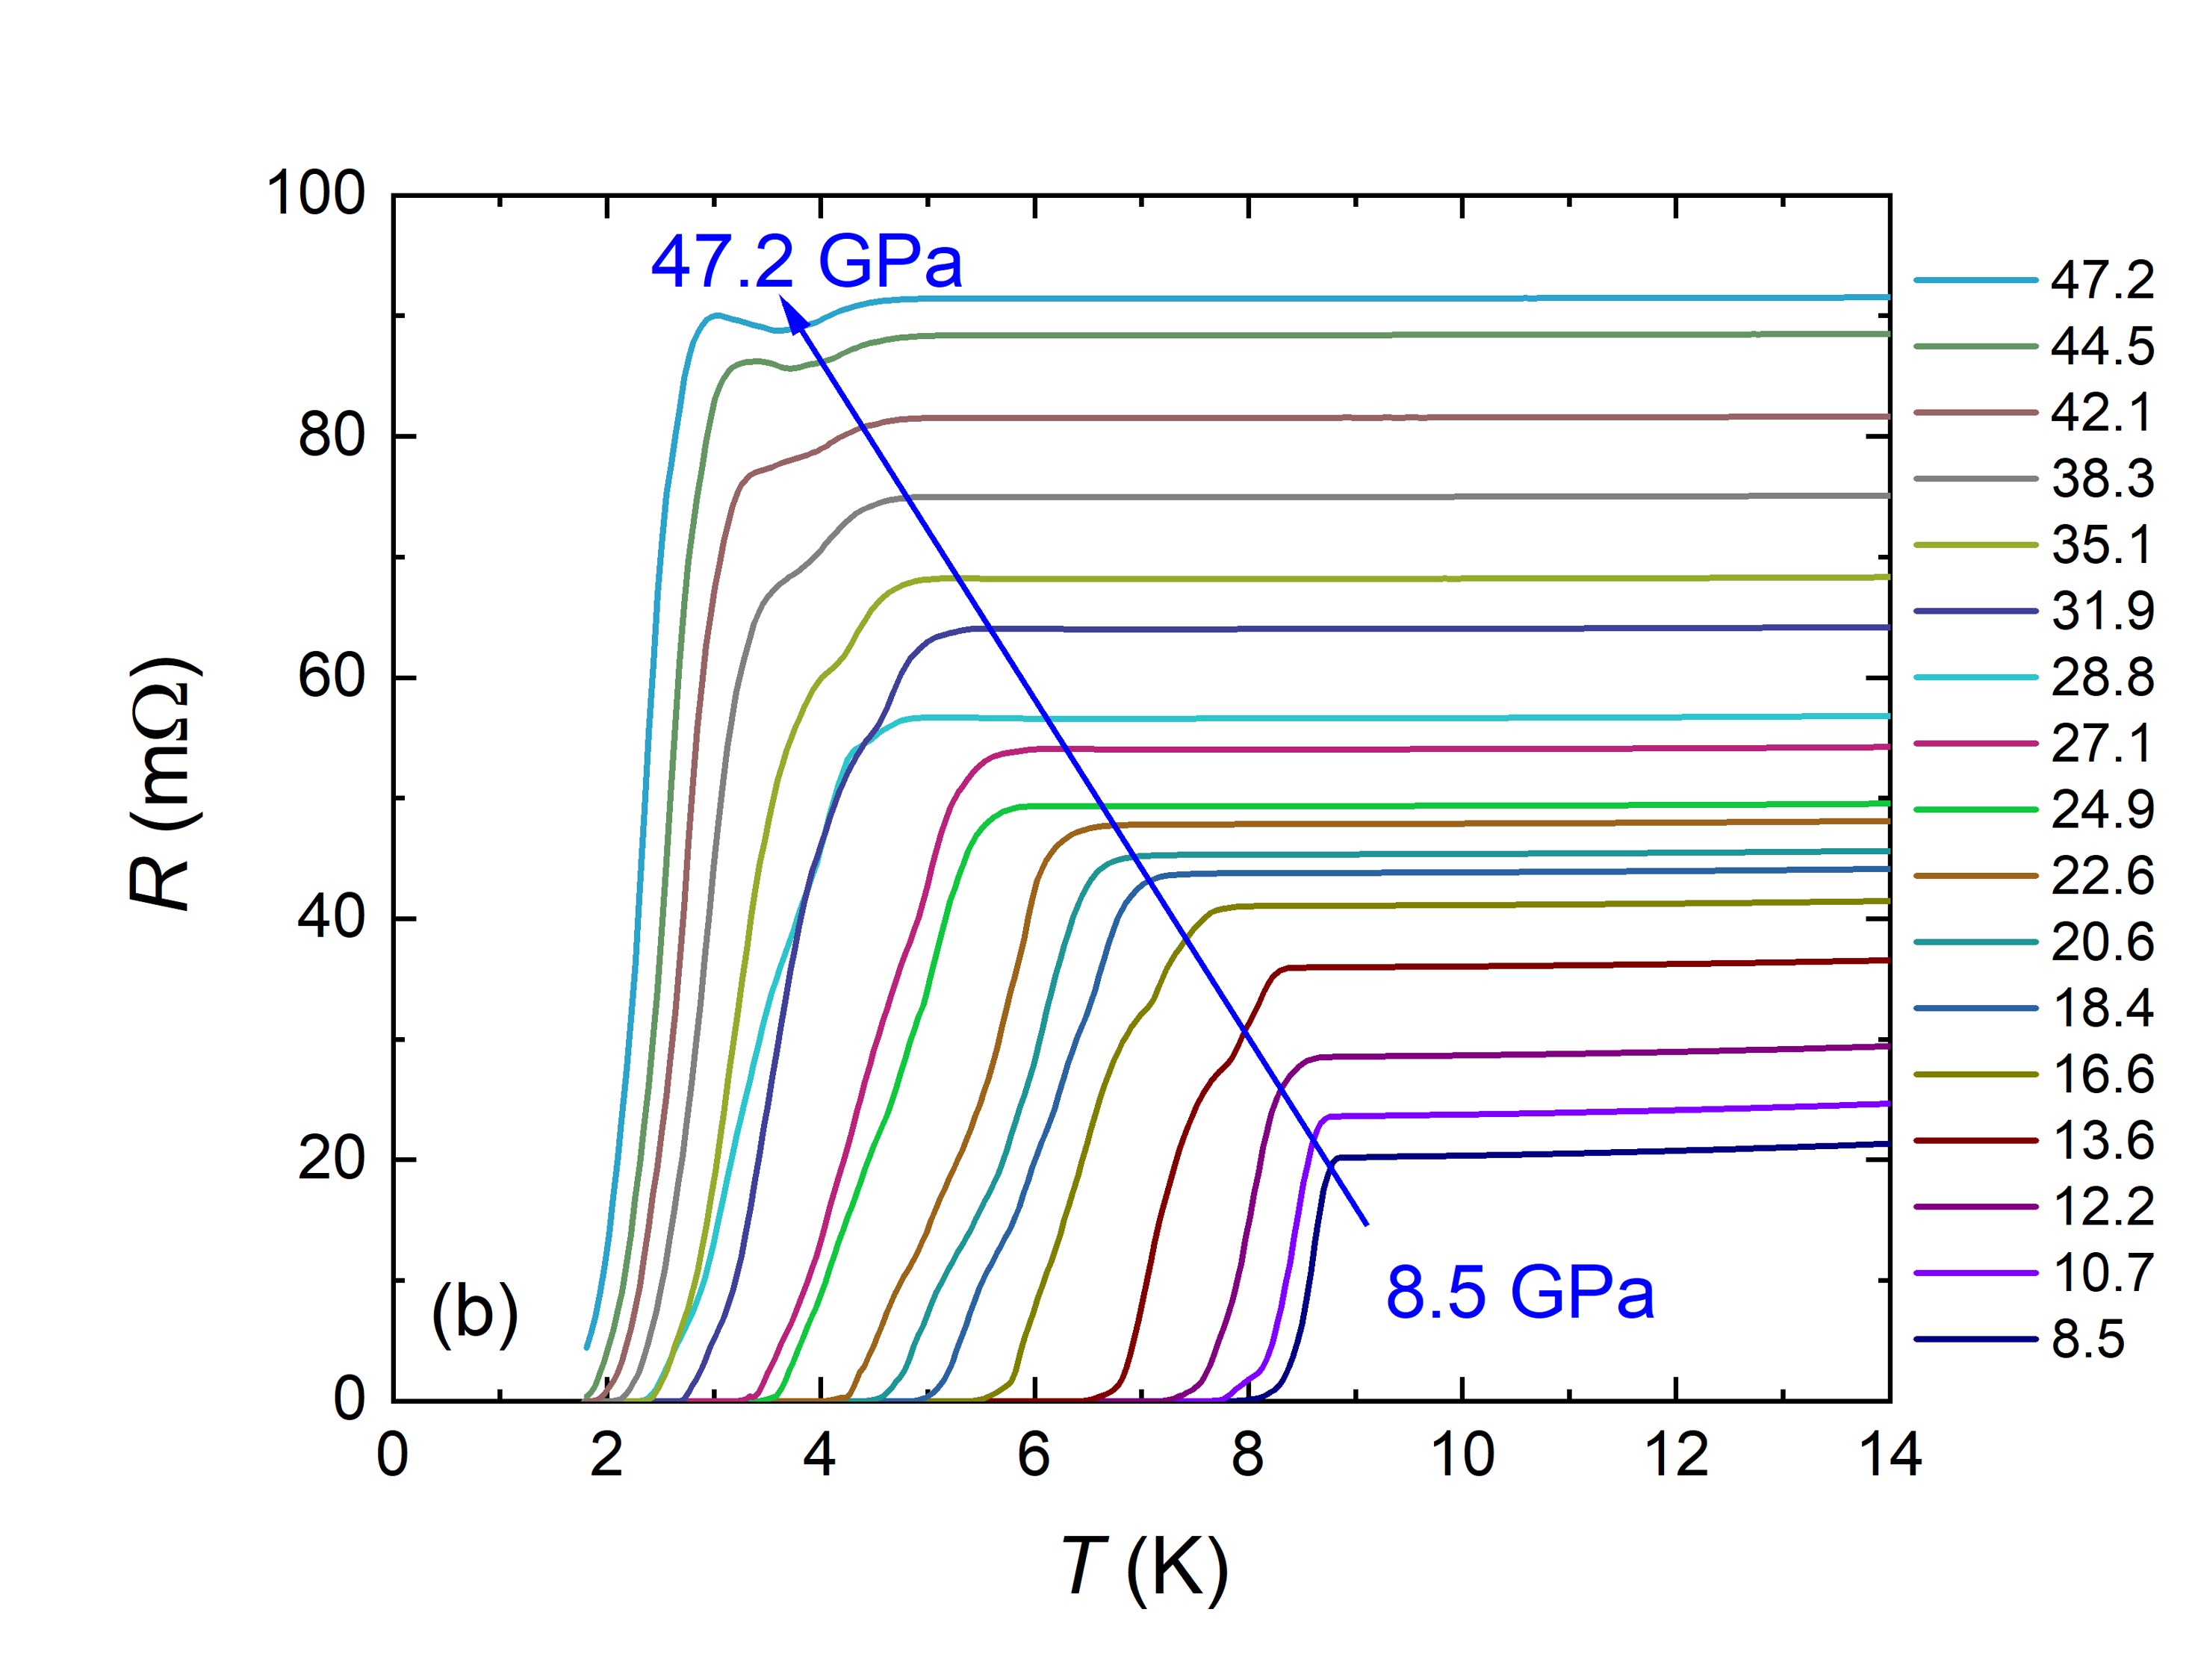
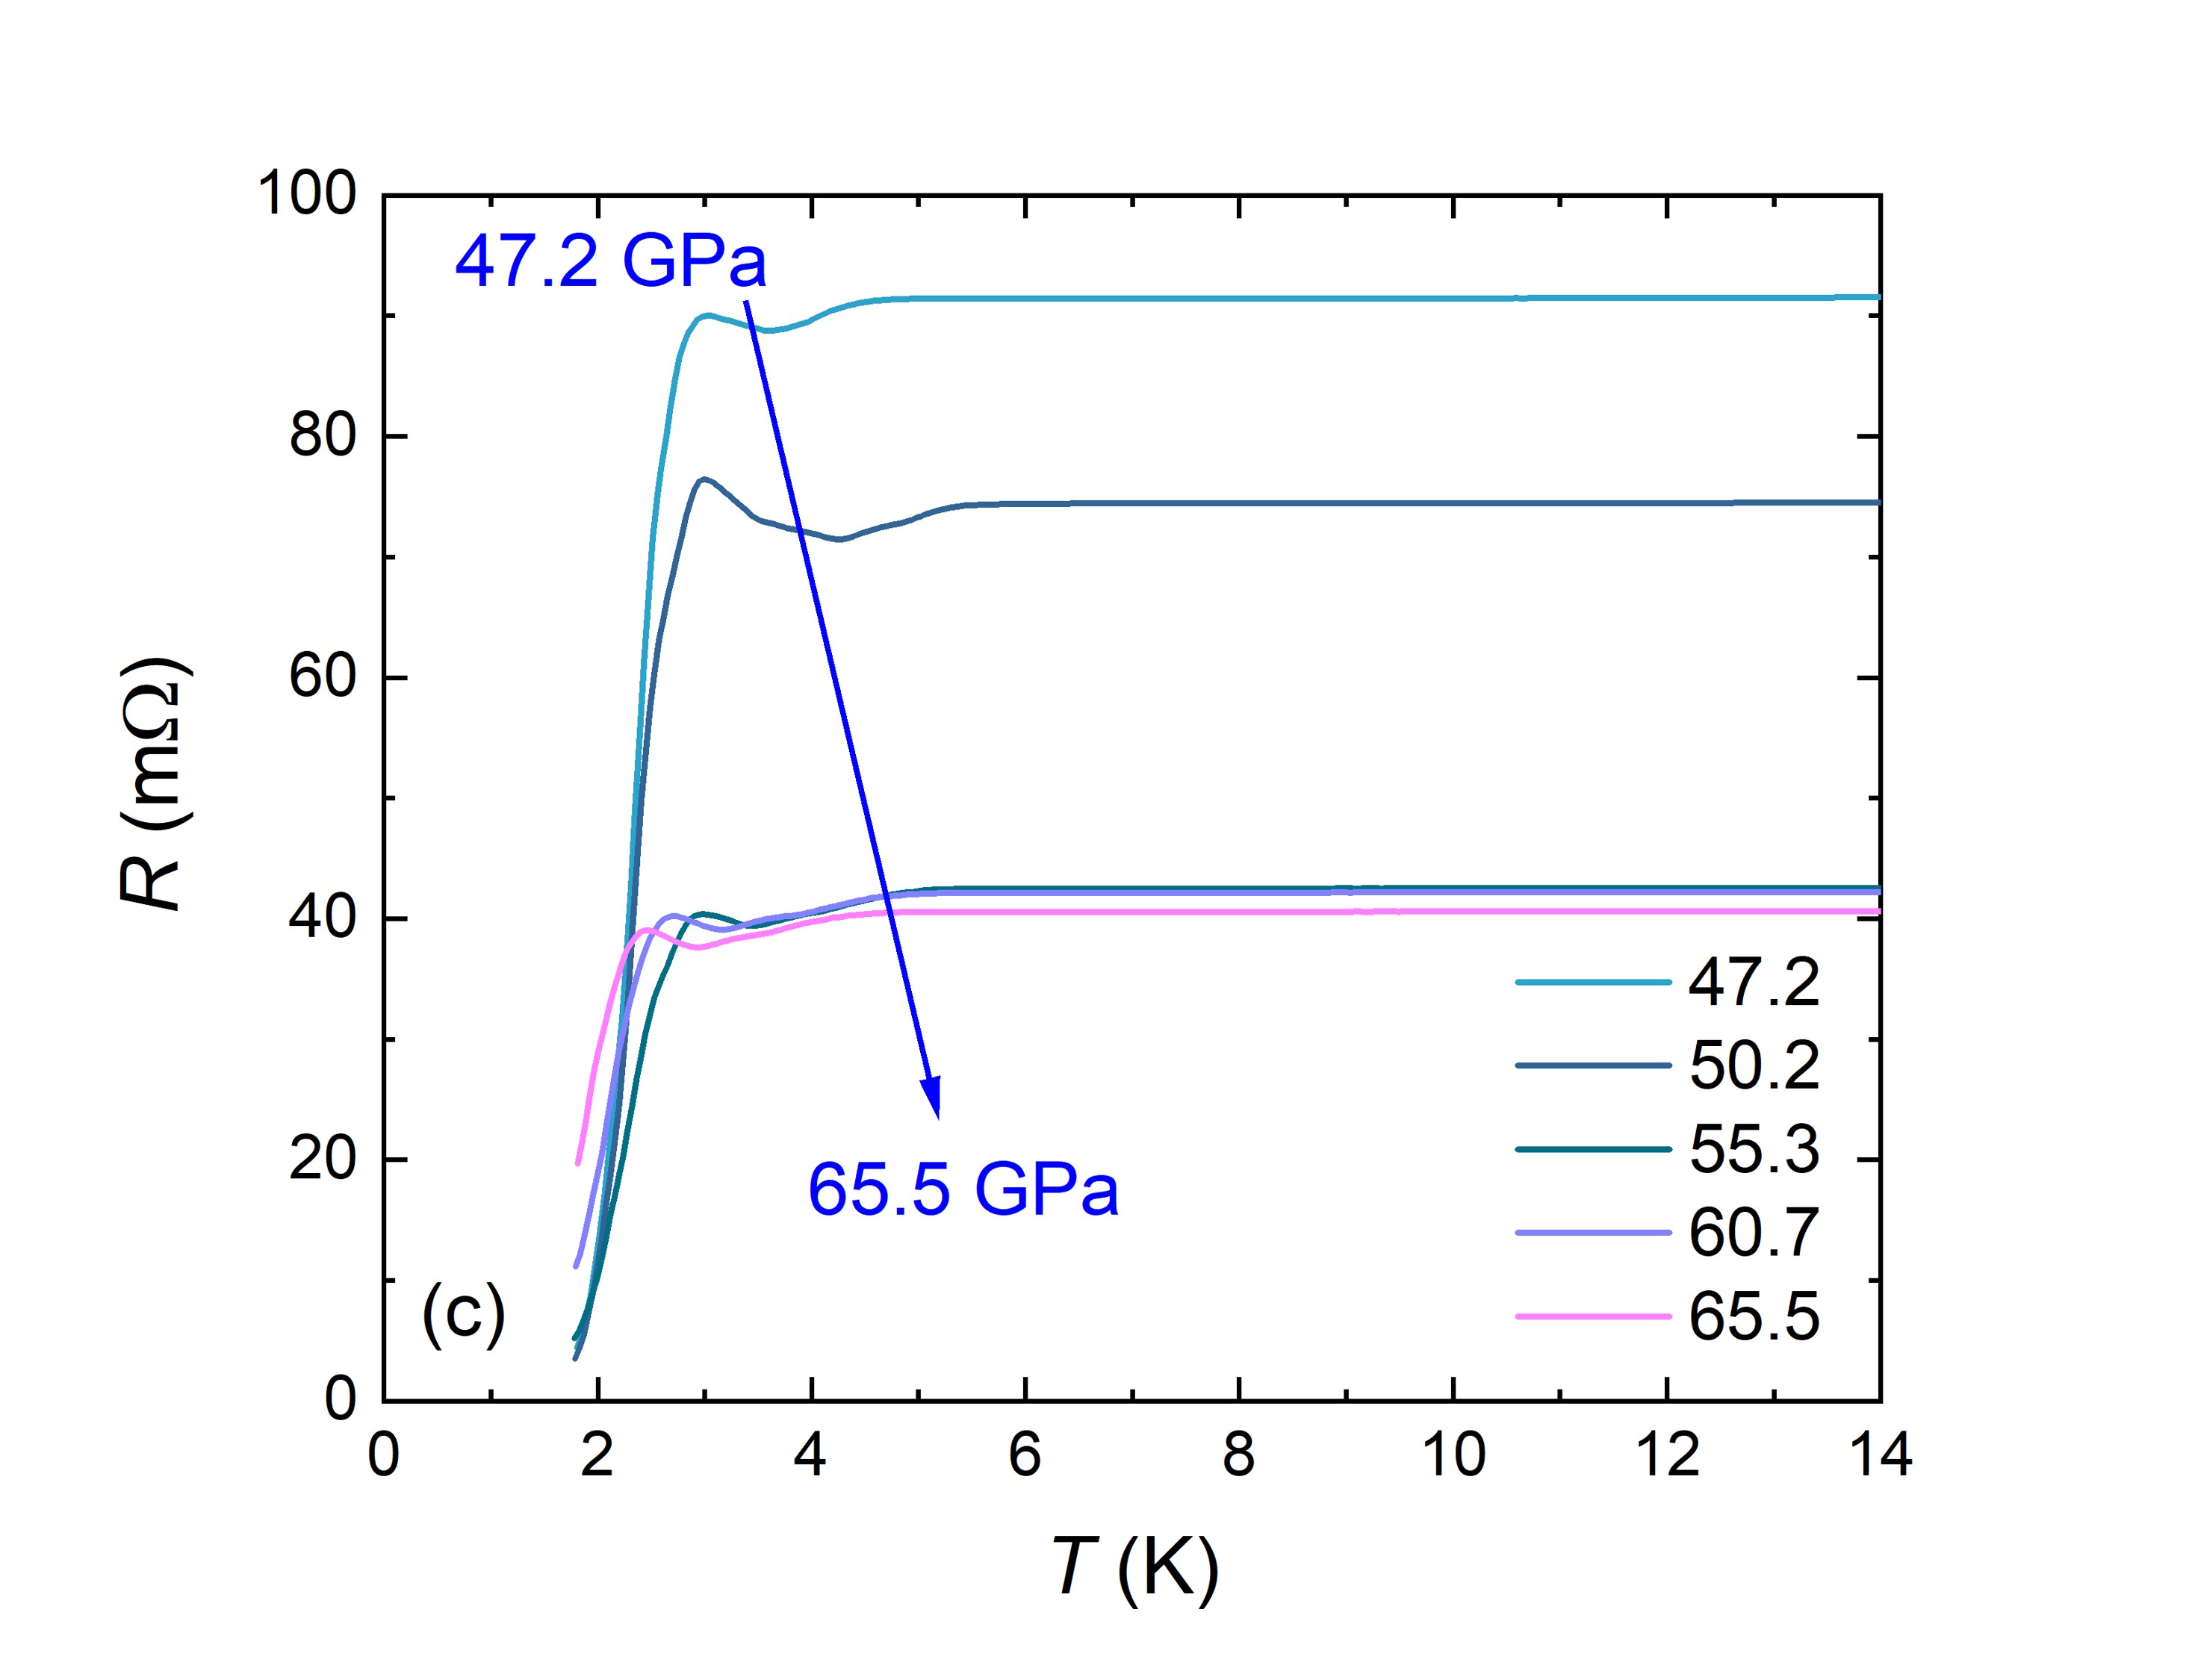
Temperature dependent resistance, , data from 0.2 GPa to 65.5 GPa of sample S#1 are shown in FIG. 4 (a-c), ranging from 1.8 K to 300 K. For clarity, we present our results over three panels. Whereas for pressures up to 8.5 GPa there is relatively little change in the curves (FIG. 4 (a)), for pressures above 8.5 GPa there is a clear change both in the size of the resistance, the shape of the plot and the value of the residual resistivity ratio (). The residual resistance is taken as the intercept from a linear fit of plateau before superconducting transition. With further increasing pressure from 47.2 GPa to 65.5 GPa, shown in FIG. 4 (c), the curve shifts downwards with an abrupt drop from 55.3 GPa to 60.7 GPa, and the curvature in the normal state becomes less pronounced. Note that such a drop motivated the measurement of sample S#2 and was not reproduced. As such, this anomaly is most likely associated with some combination of sample and contact damage and/or shifting rather than being an intrinsic property of LaRu3Si2.
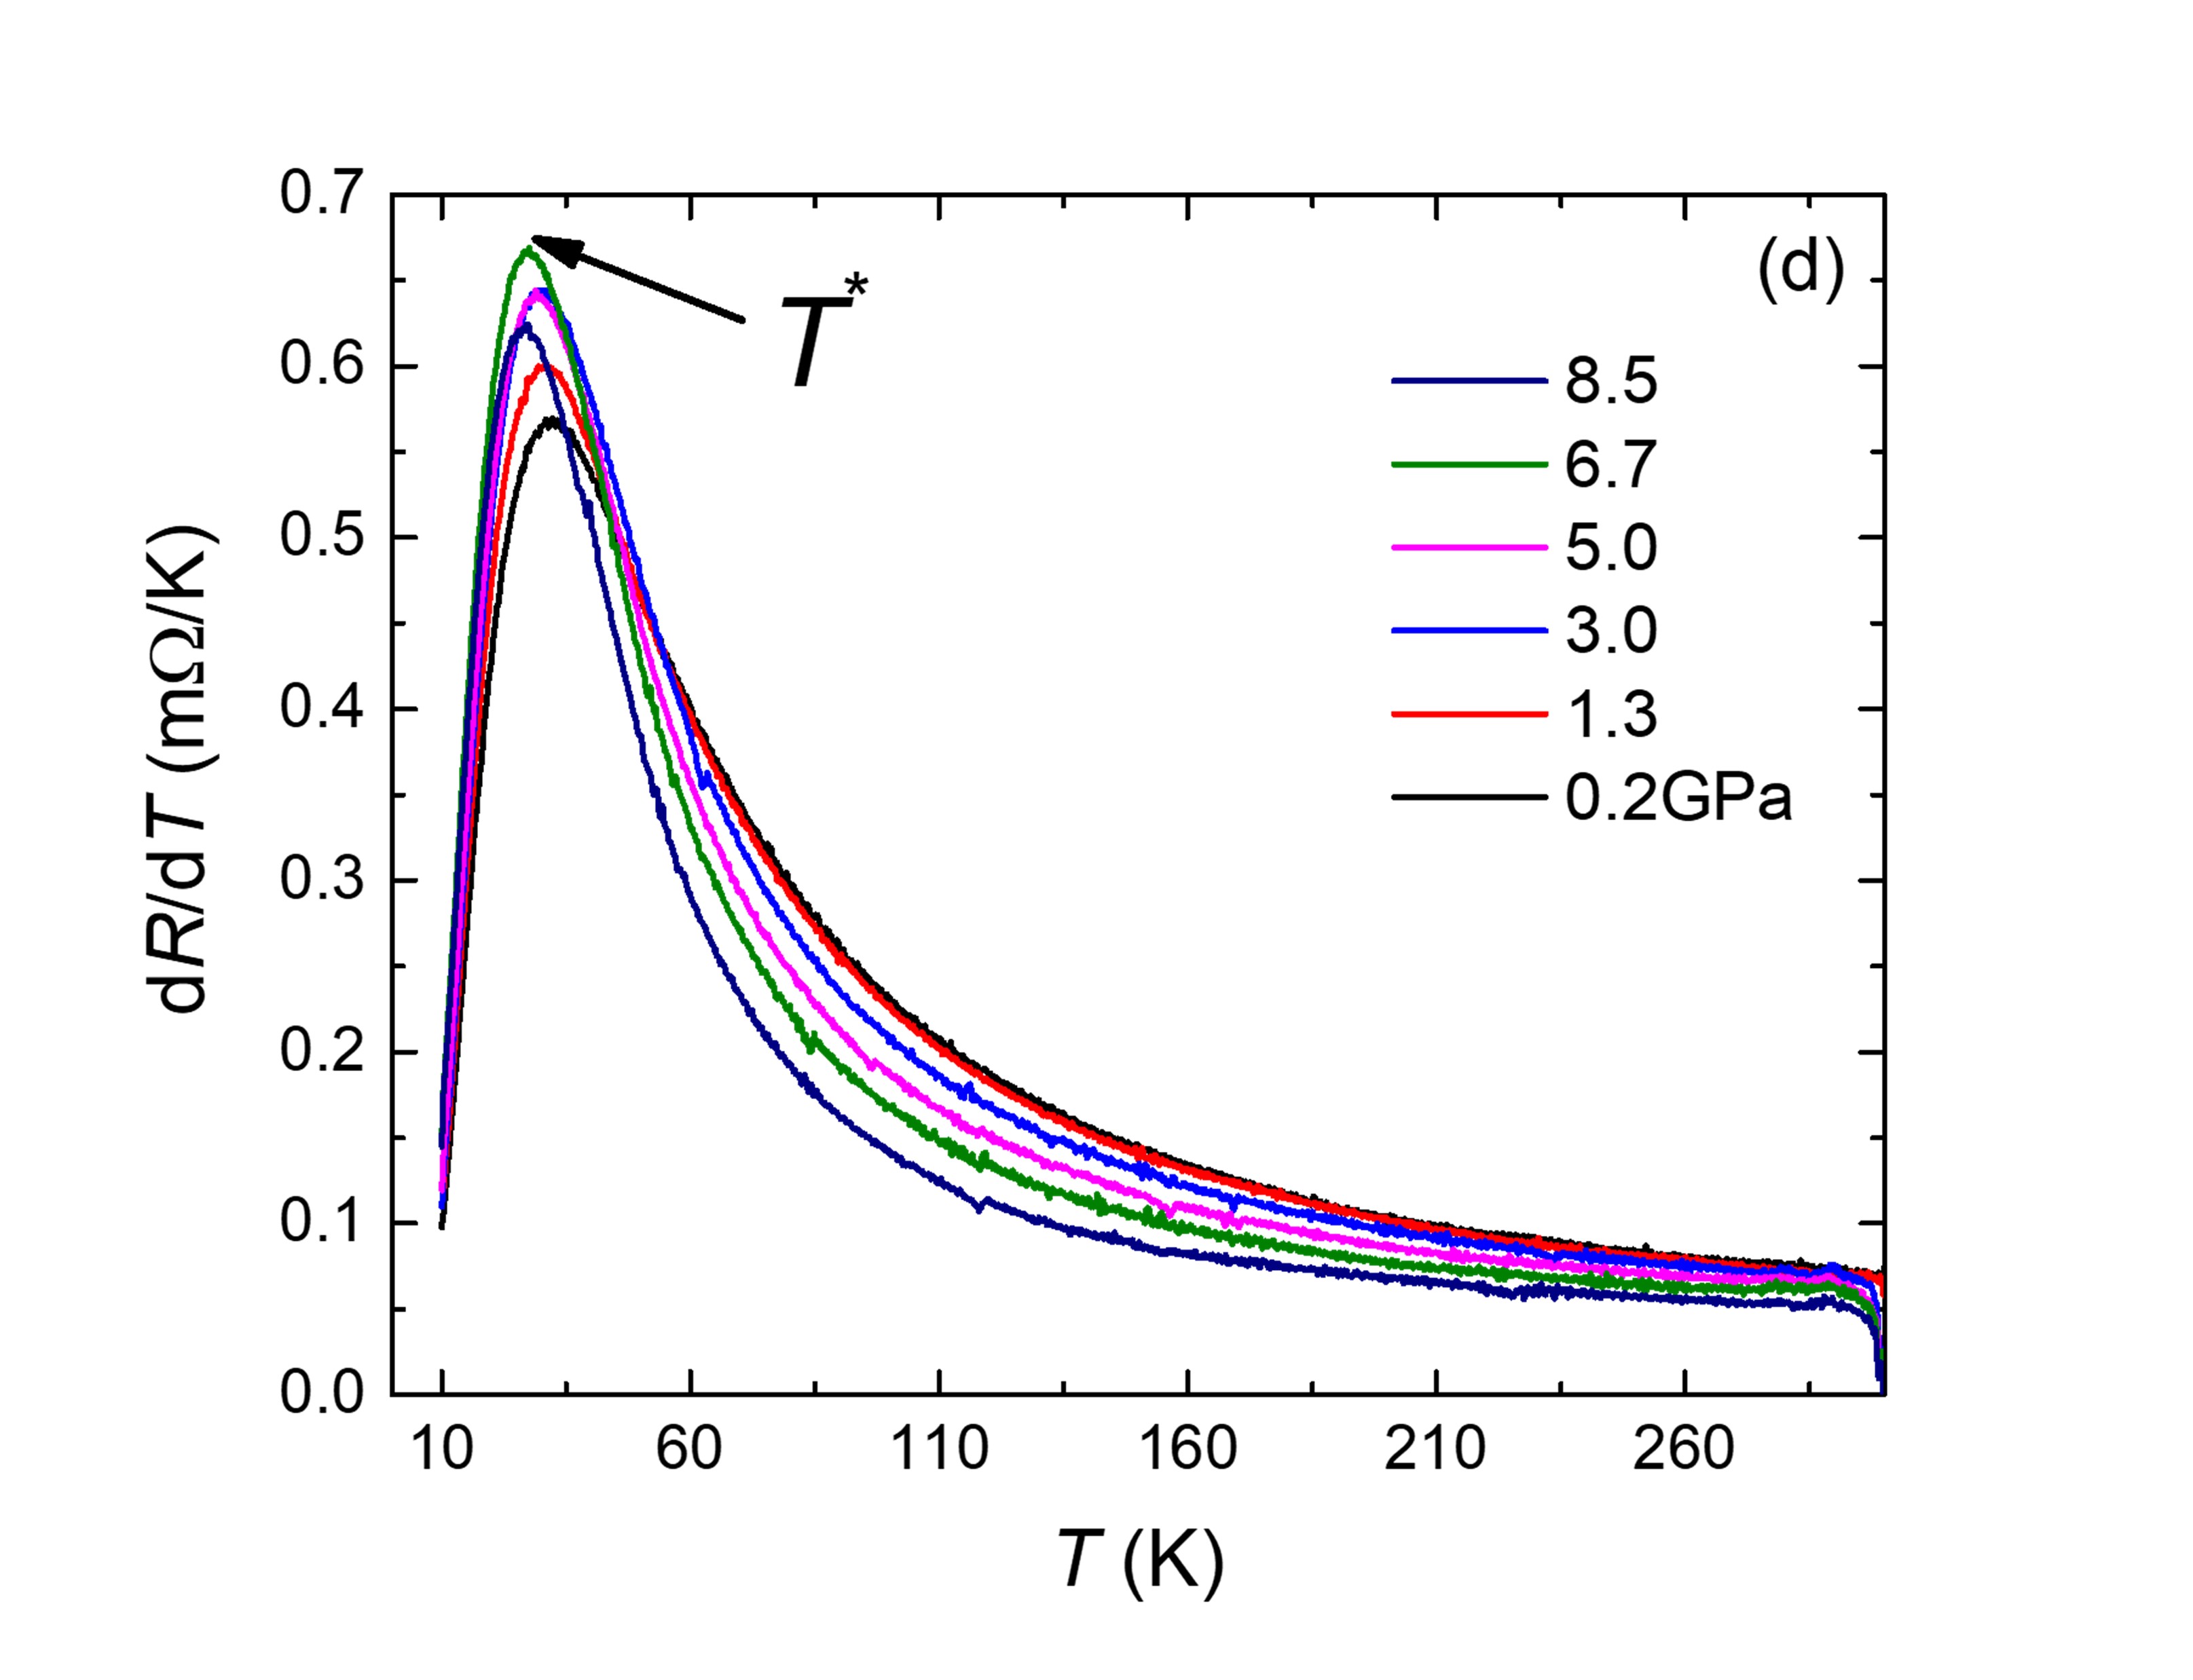
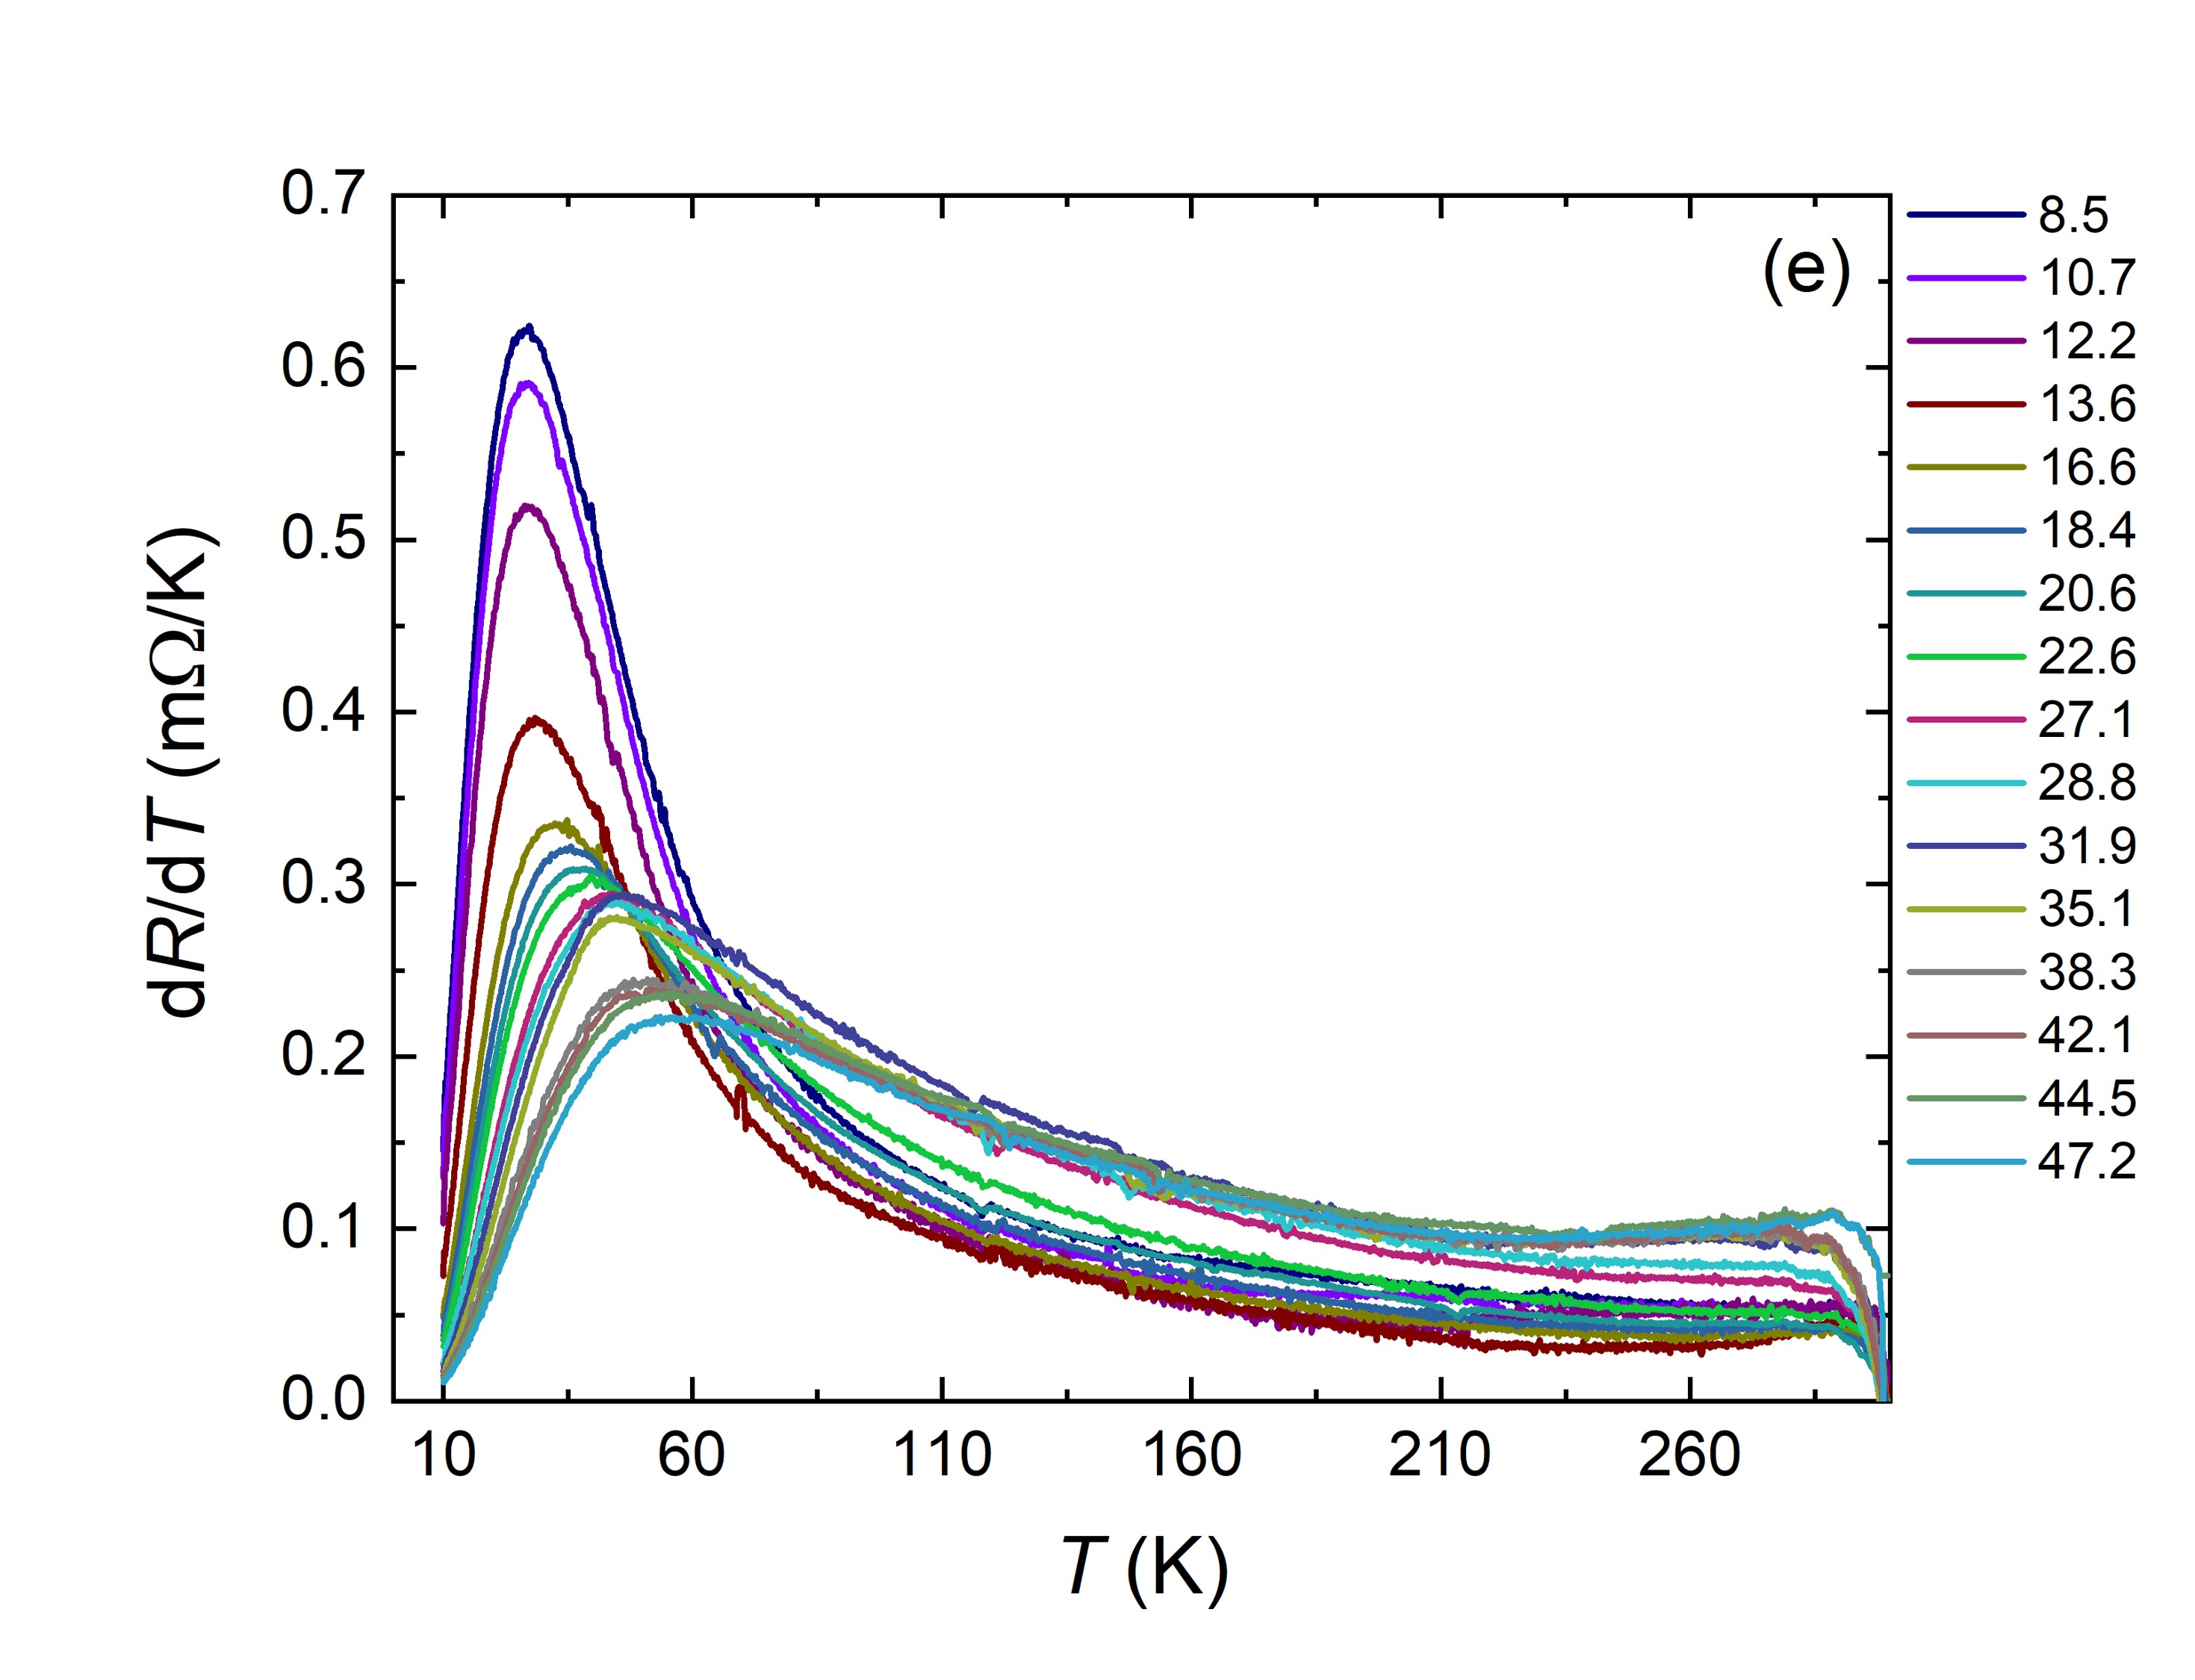
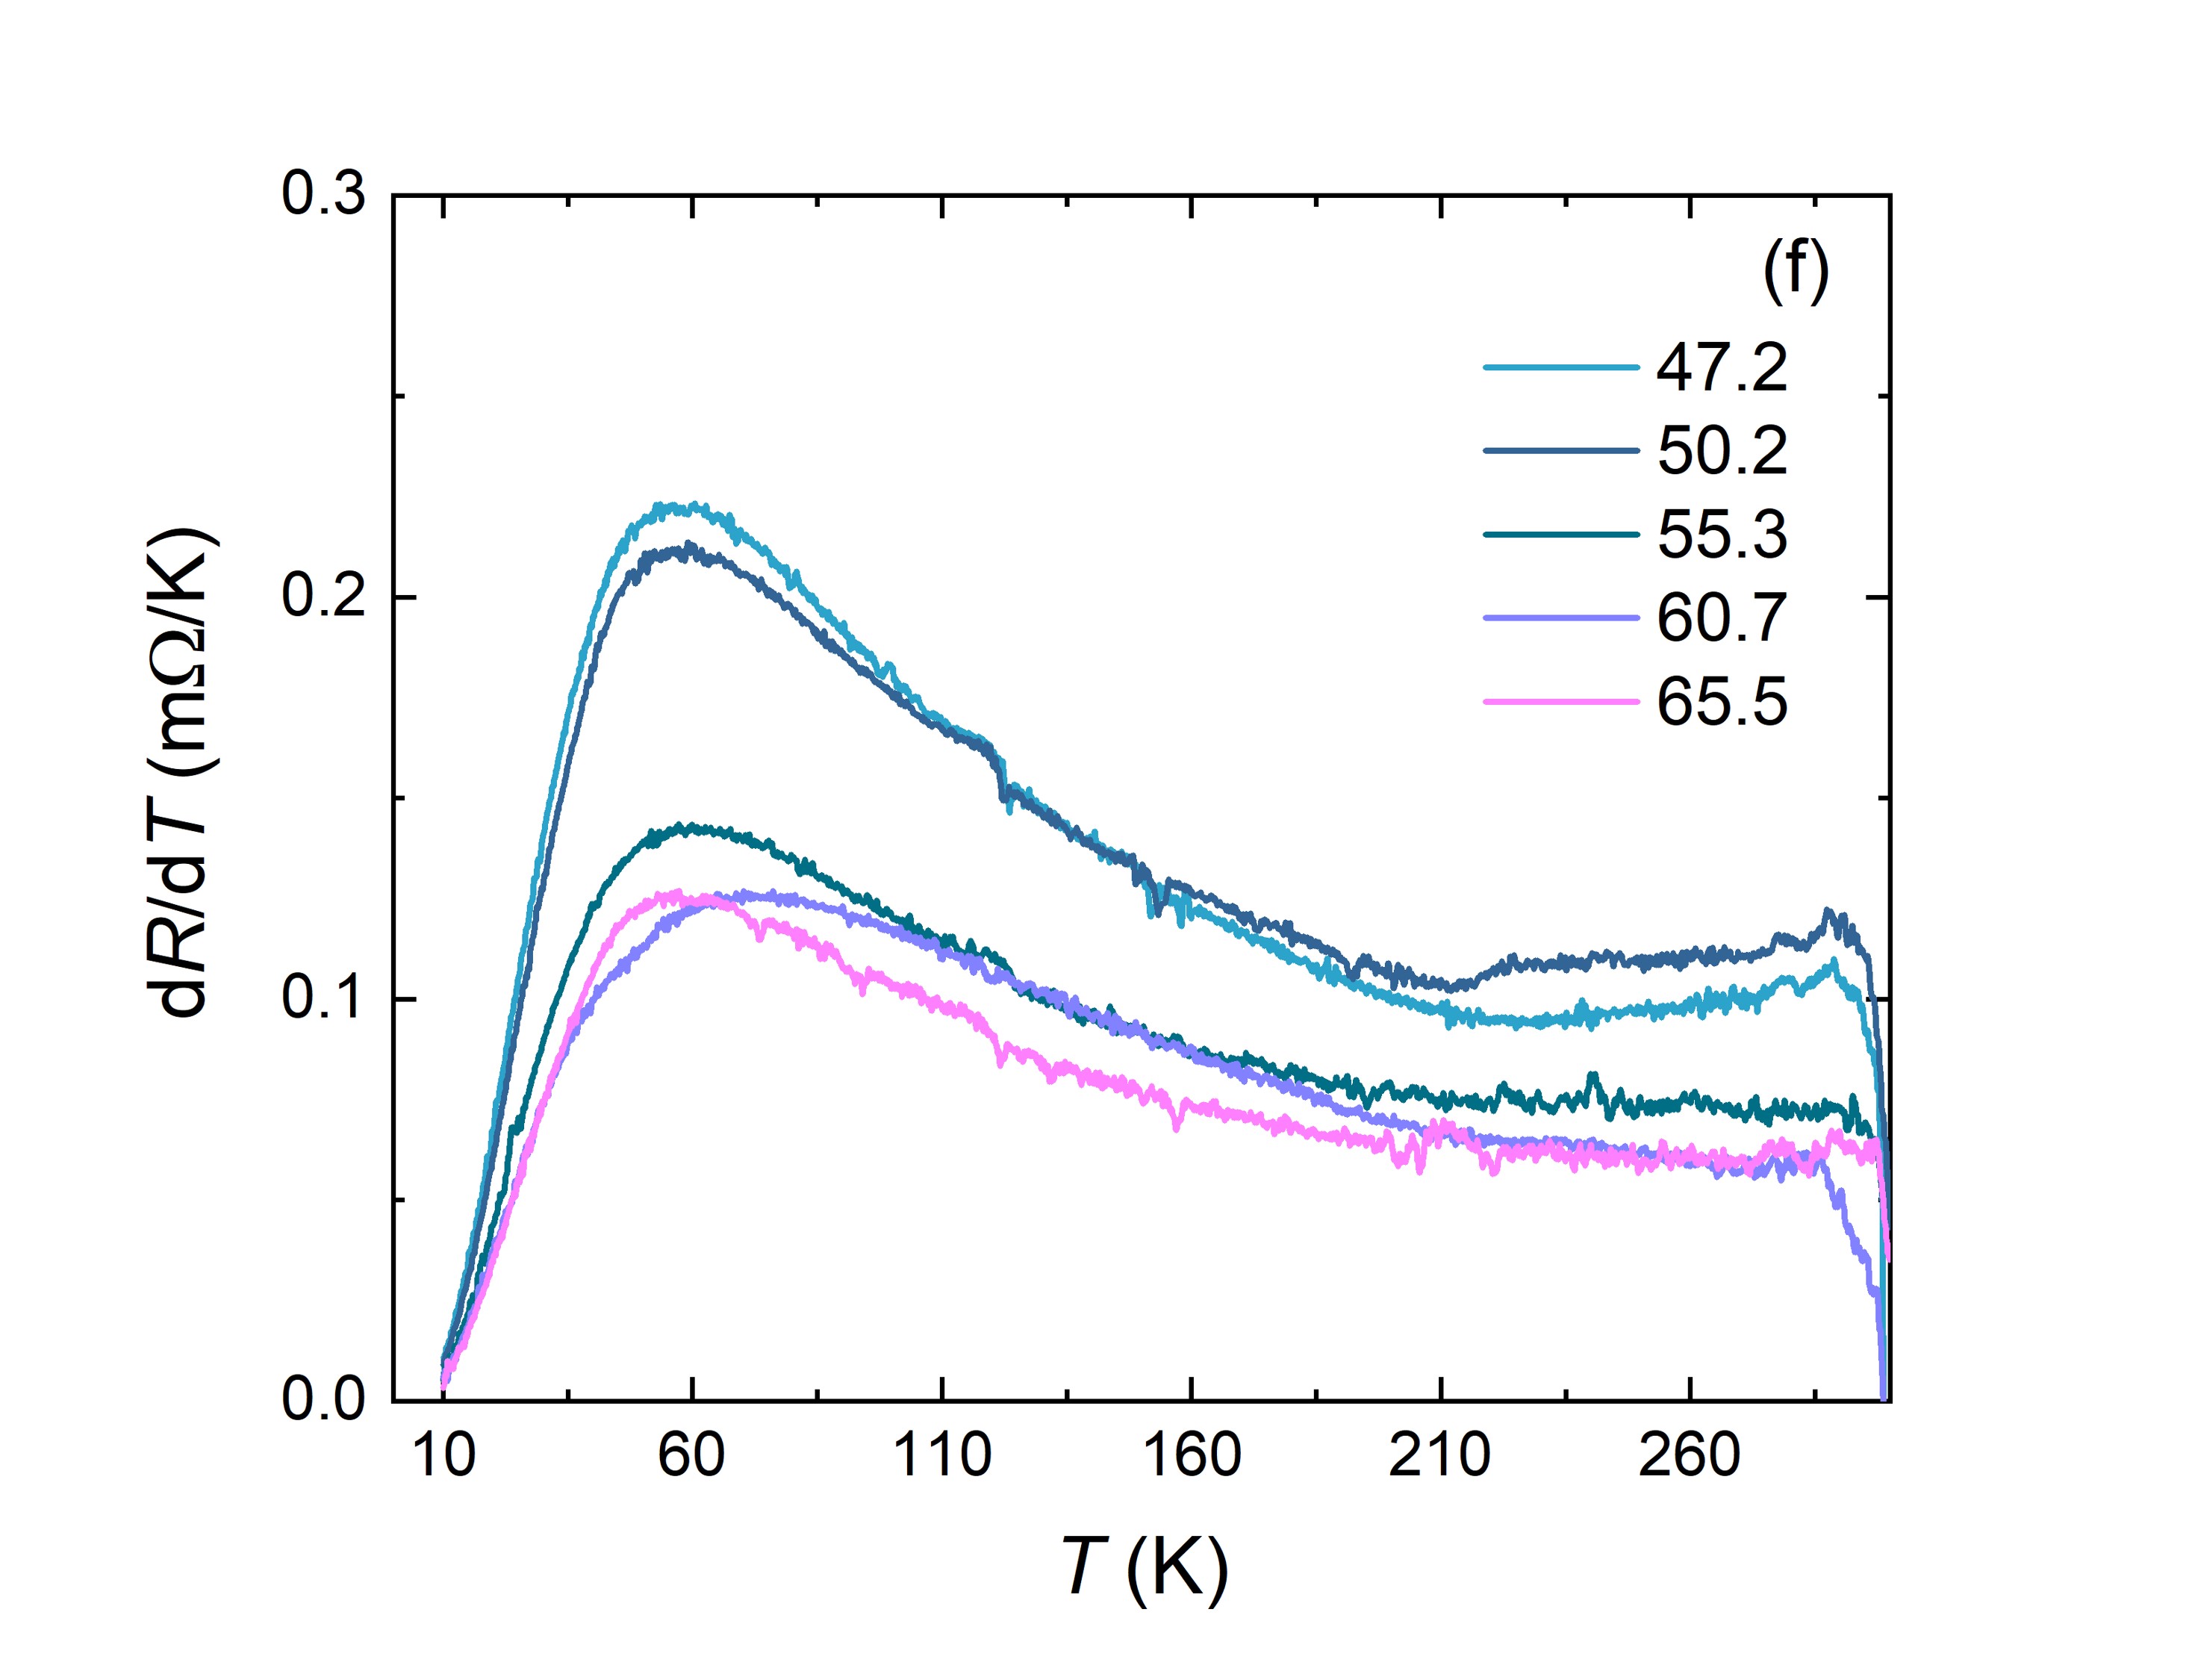
The derivatives of temperature dependent resistance, , from 10 K to 300 K are presented in FIG. 4 (d-f) to characterize the shoulder-like behavior of resistance. A peak is observed over the whole pressure range. is then defined as the peak position of before superconducting transition, i.e. 10 K. FIG. 4 (d) shows an arrow for at 6.7 GPa. This peak tends to broaden upon increasing pressure, with shifting to lower temperature first and then increasing. Previously, this anomaly temperature was identified as being where the sign changes for Hall signal from positive (holes) to negative (electrons), and was argued to be indicating a complex interplay of electronic states [27]. We found the evolution of is correlated with , which will be further discussed after presenting phase diagram in FIG. 11 below.
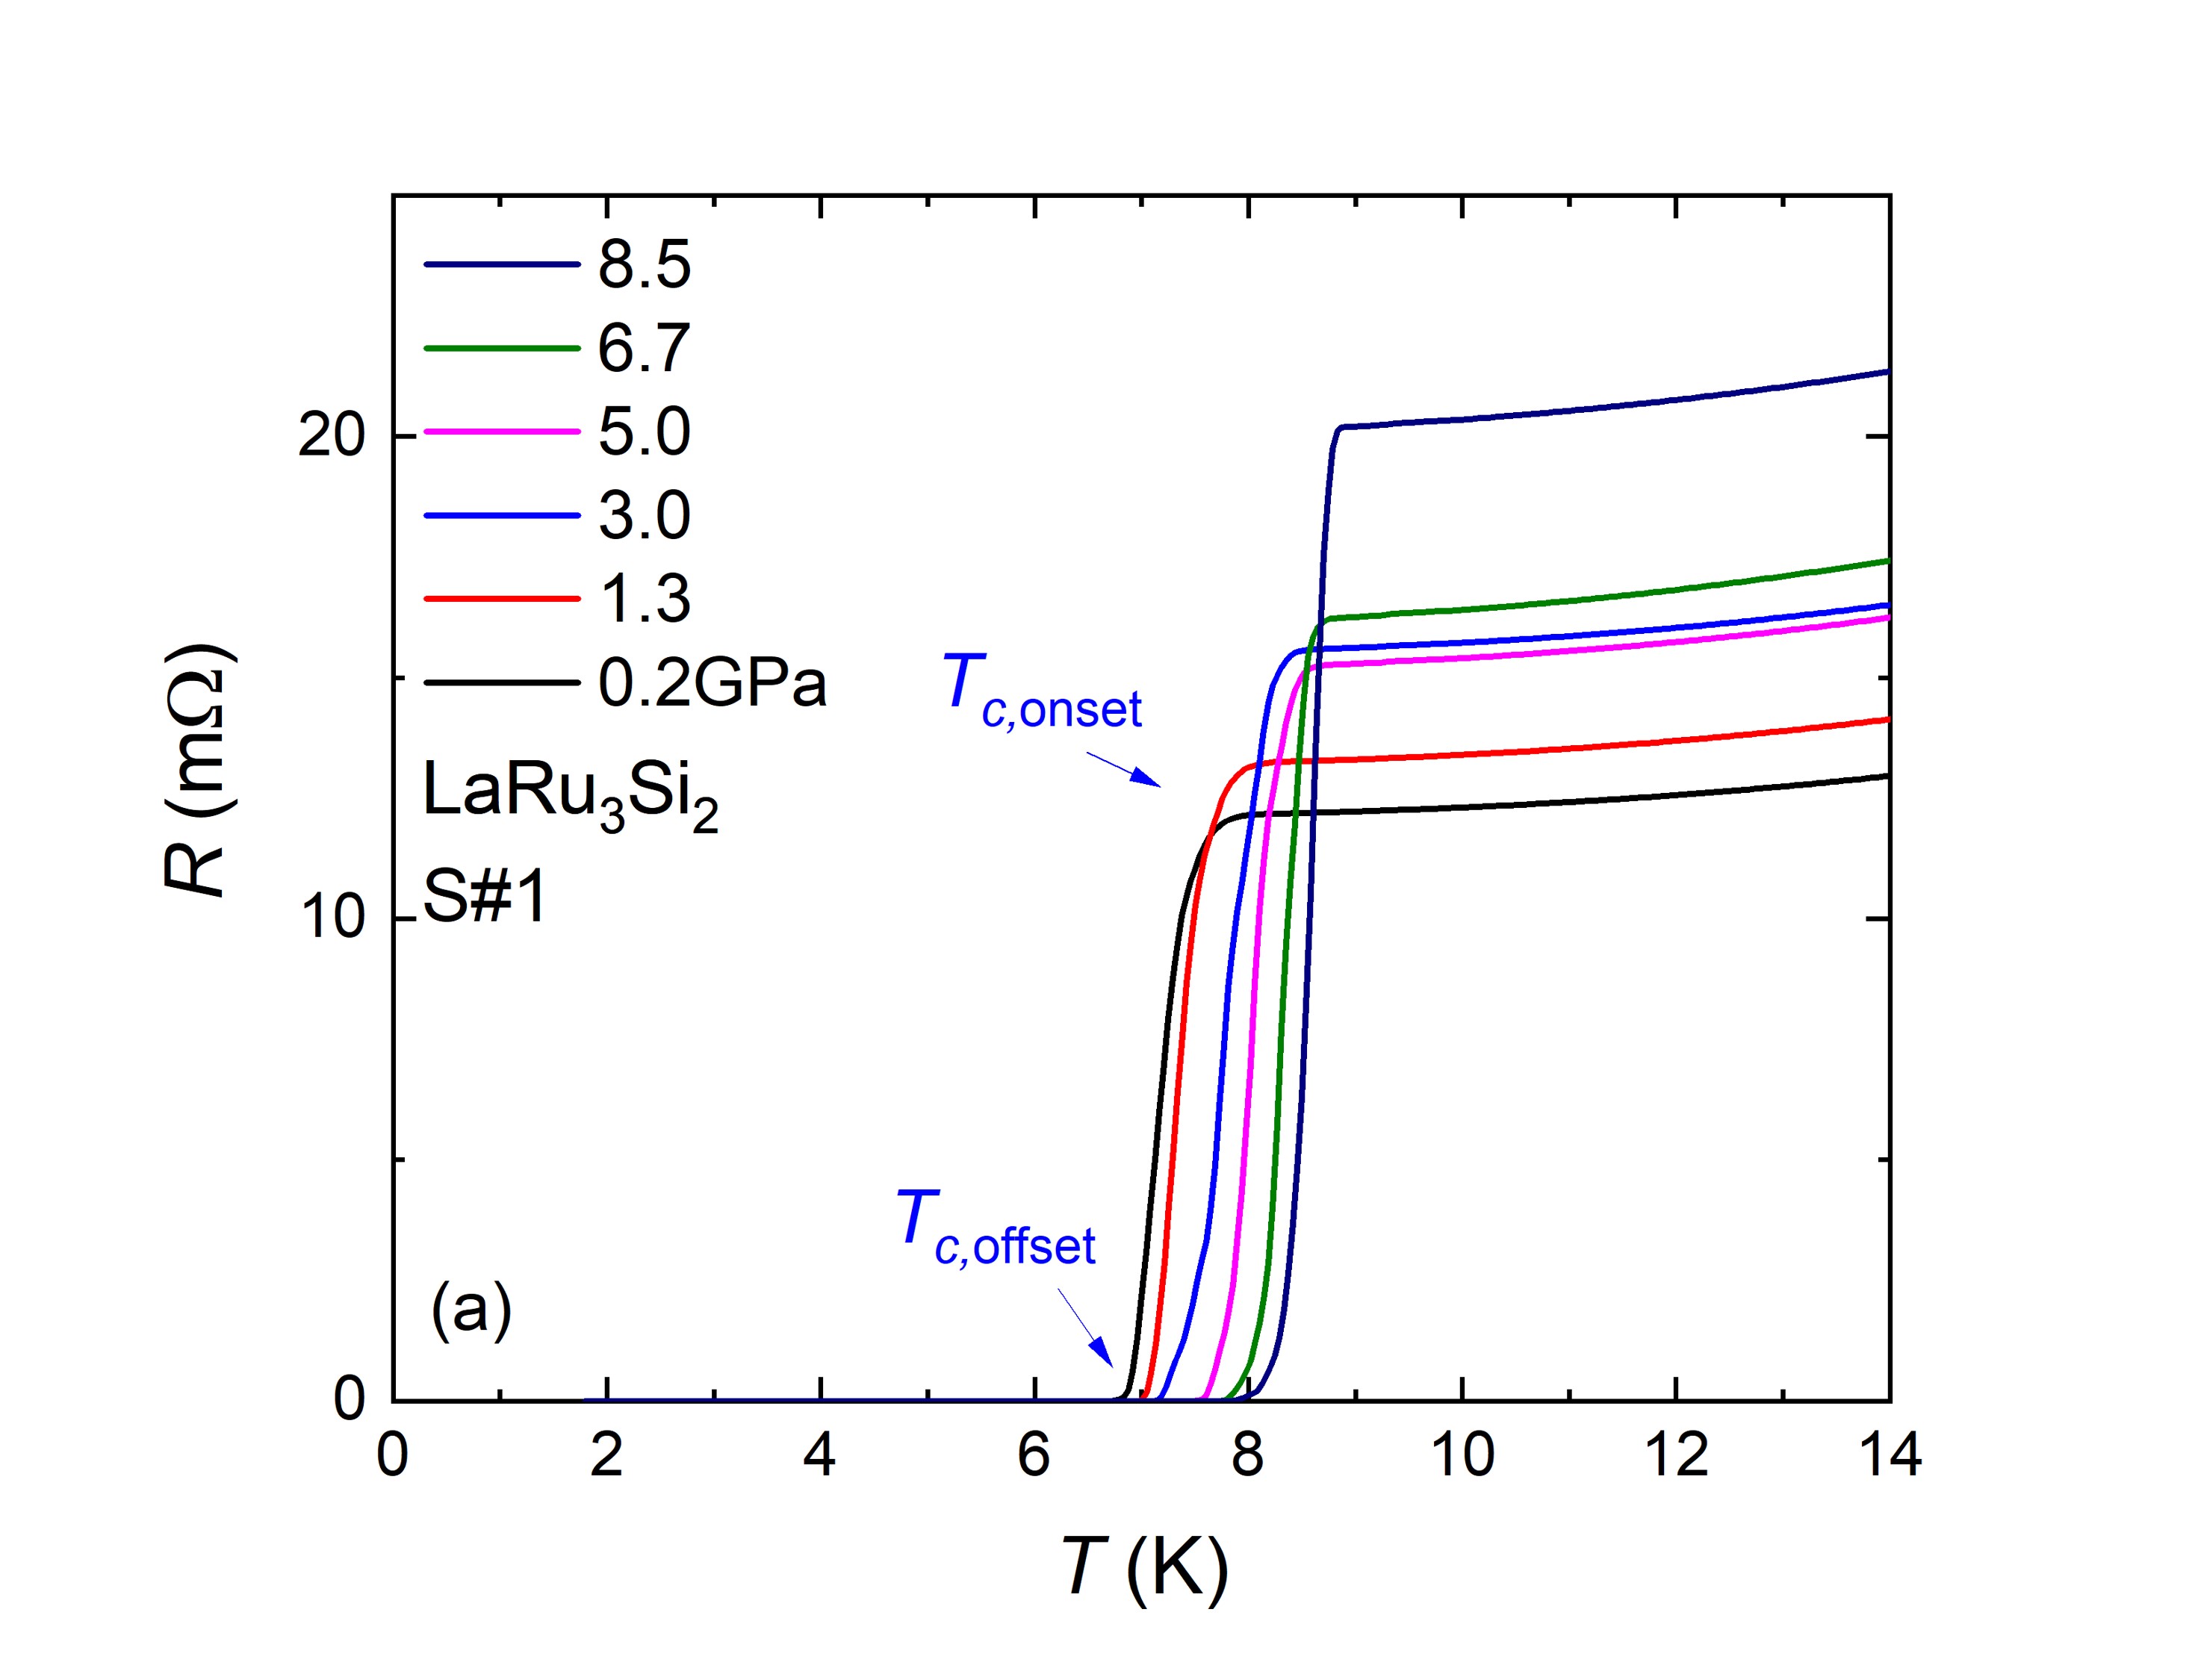
FIG. 5 (a-c) presents the low temperature ( K) resistance versus temperature data over the same pressure ranges as in FIG. 4. In FIG. 5 (a), we define the criteria of superconducting transition temperature onset , as the intersection between the maximum slope and the upper plateau before the superconducting transition, and the offset of the superconducting transition as the intersection between the maximum slope and the axis. At pressures where the superconducting transition exhibits multi-step like behavior (see below), only the sharpest transition is taken as the characteristic transition for maximum slope.
In FIG. 5 (a), from 0.2 GPa to 8.5 GPa, both and increase by more than 1 K. and are then suppressed with more pressure being applied, as shown in FIG. 5 (b,c). It is also worth noting that the original, single, sharp SC transition gets broader and evolves to be multi-step like, resulting in a hump-like curve beyond 44.5 GPa. It has been reported of the good connection between SC grains of arc-melted LaRu3Si2 [25, 8], despite the presence of minimal secondary phases. Such multi-step like behavior could due to be some degree of stoichiometric variation and/or pressure inhomogeneity.
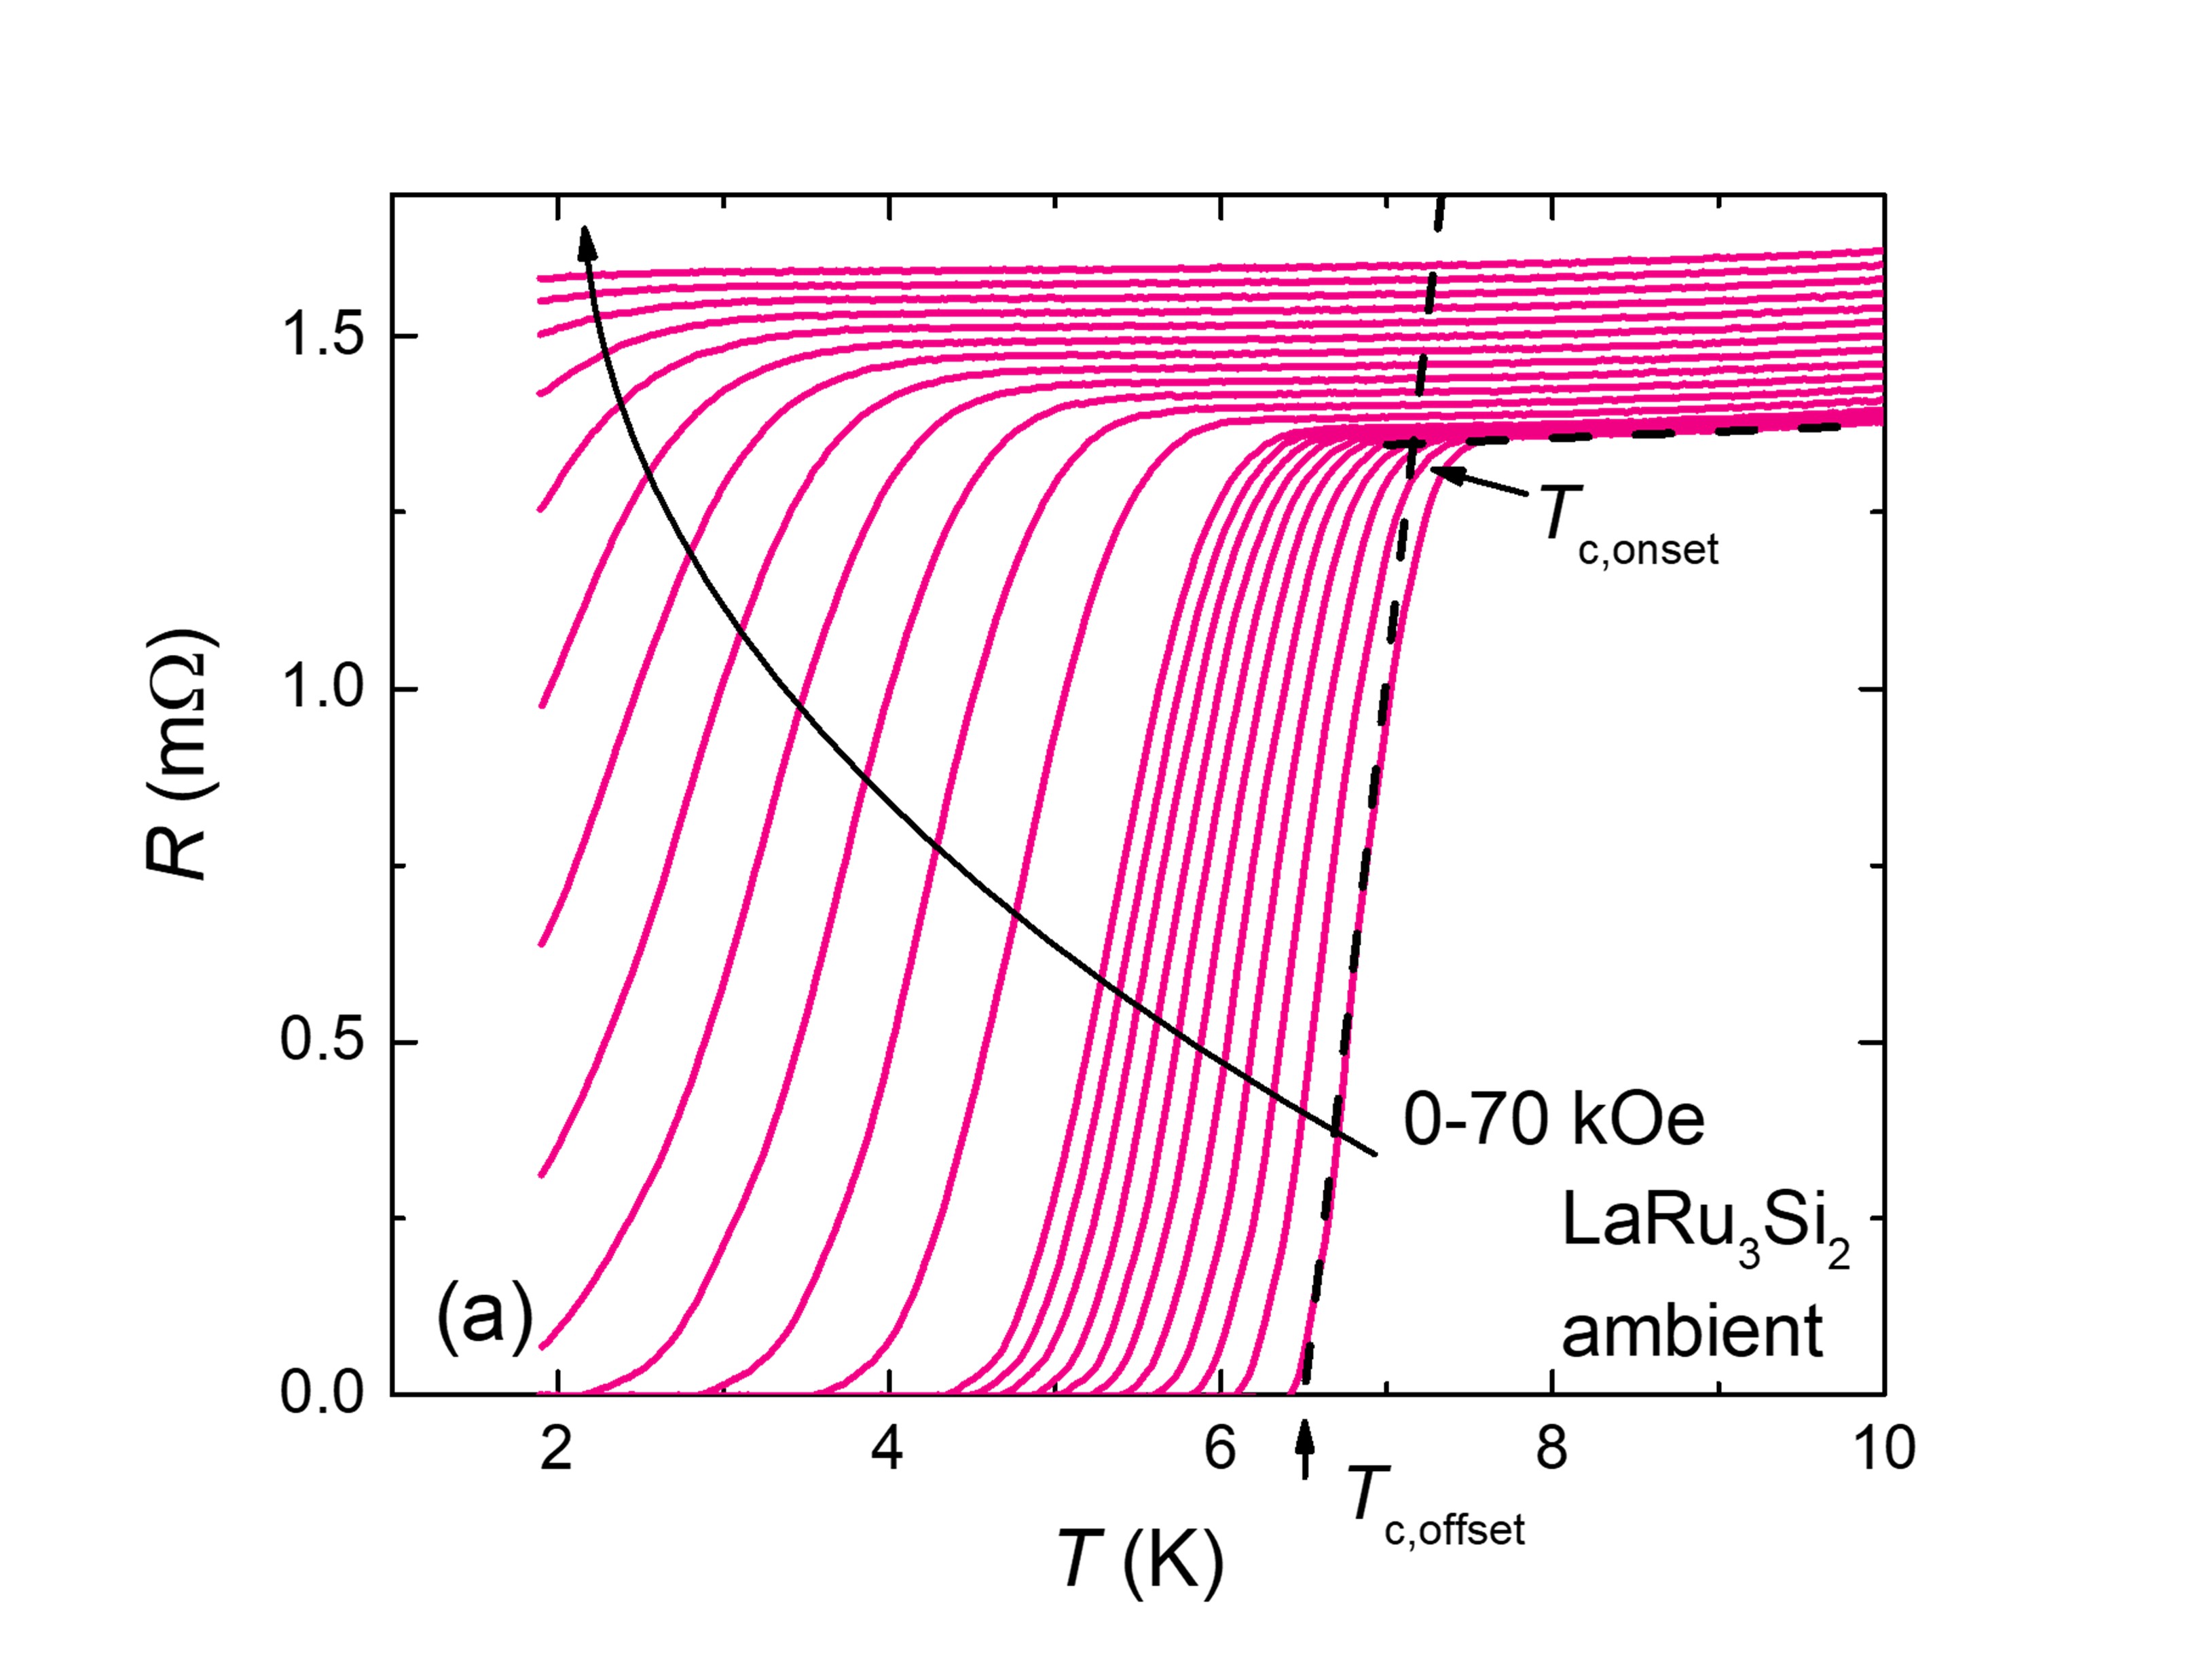
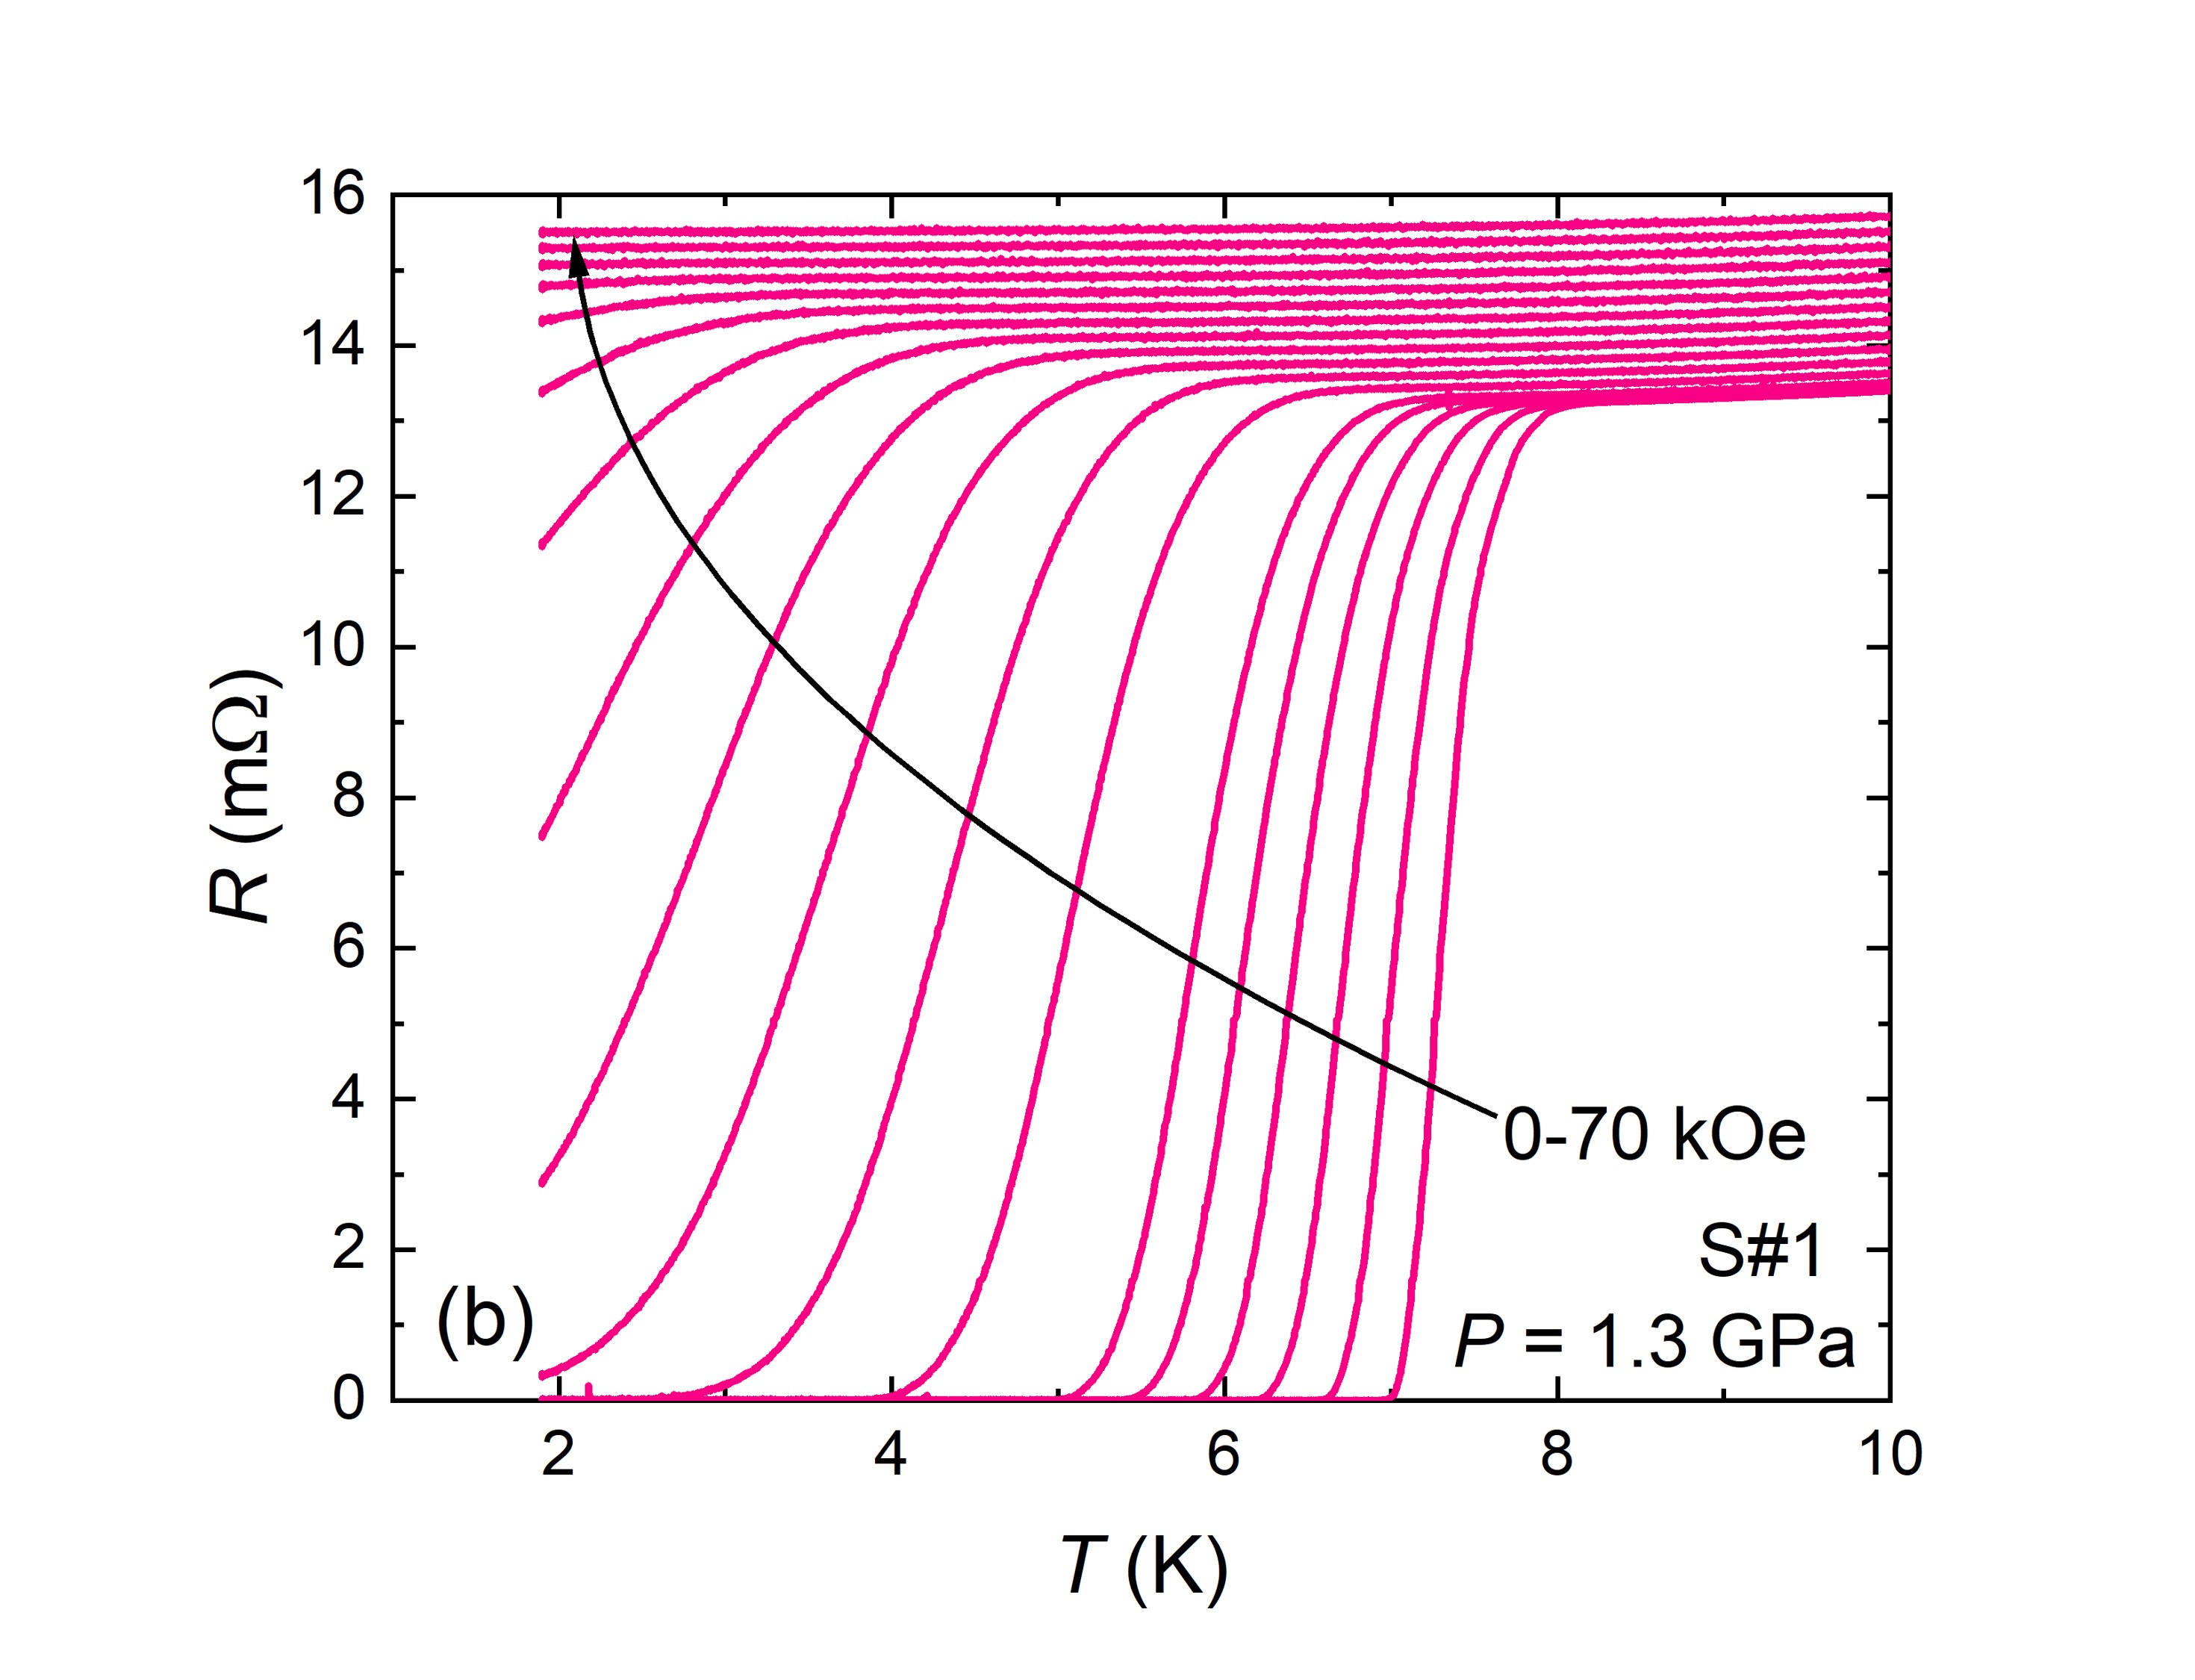
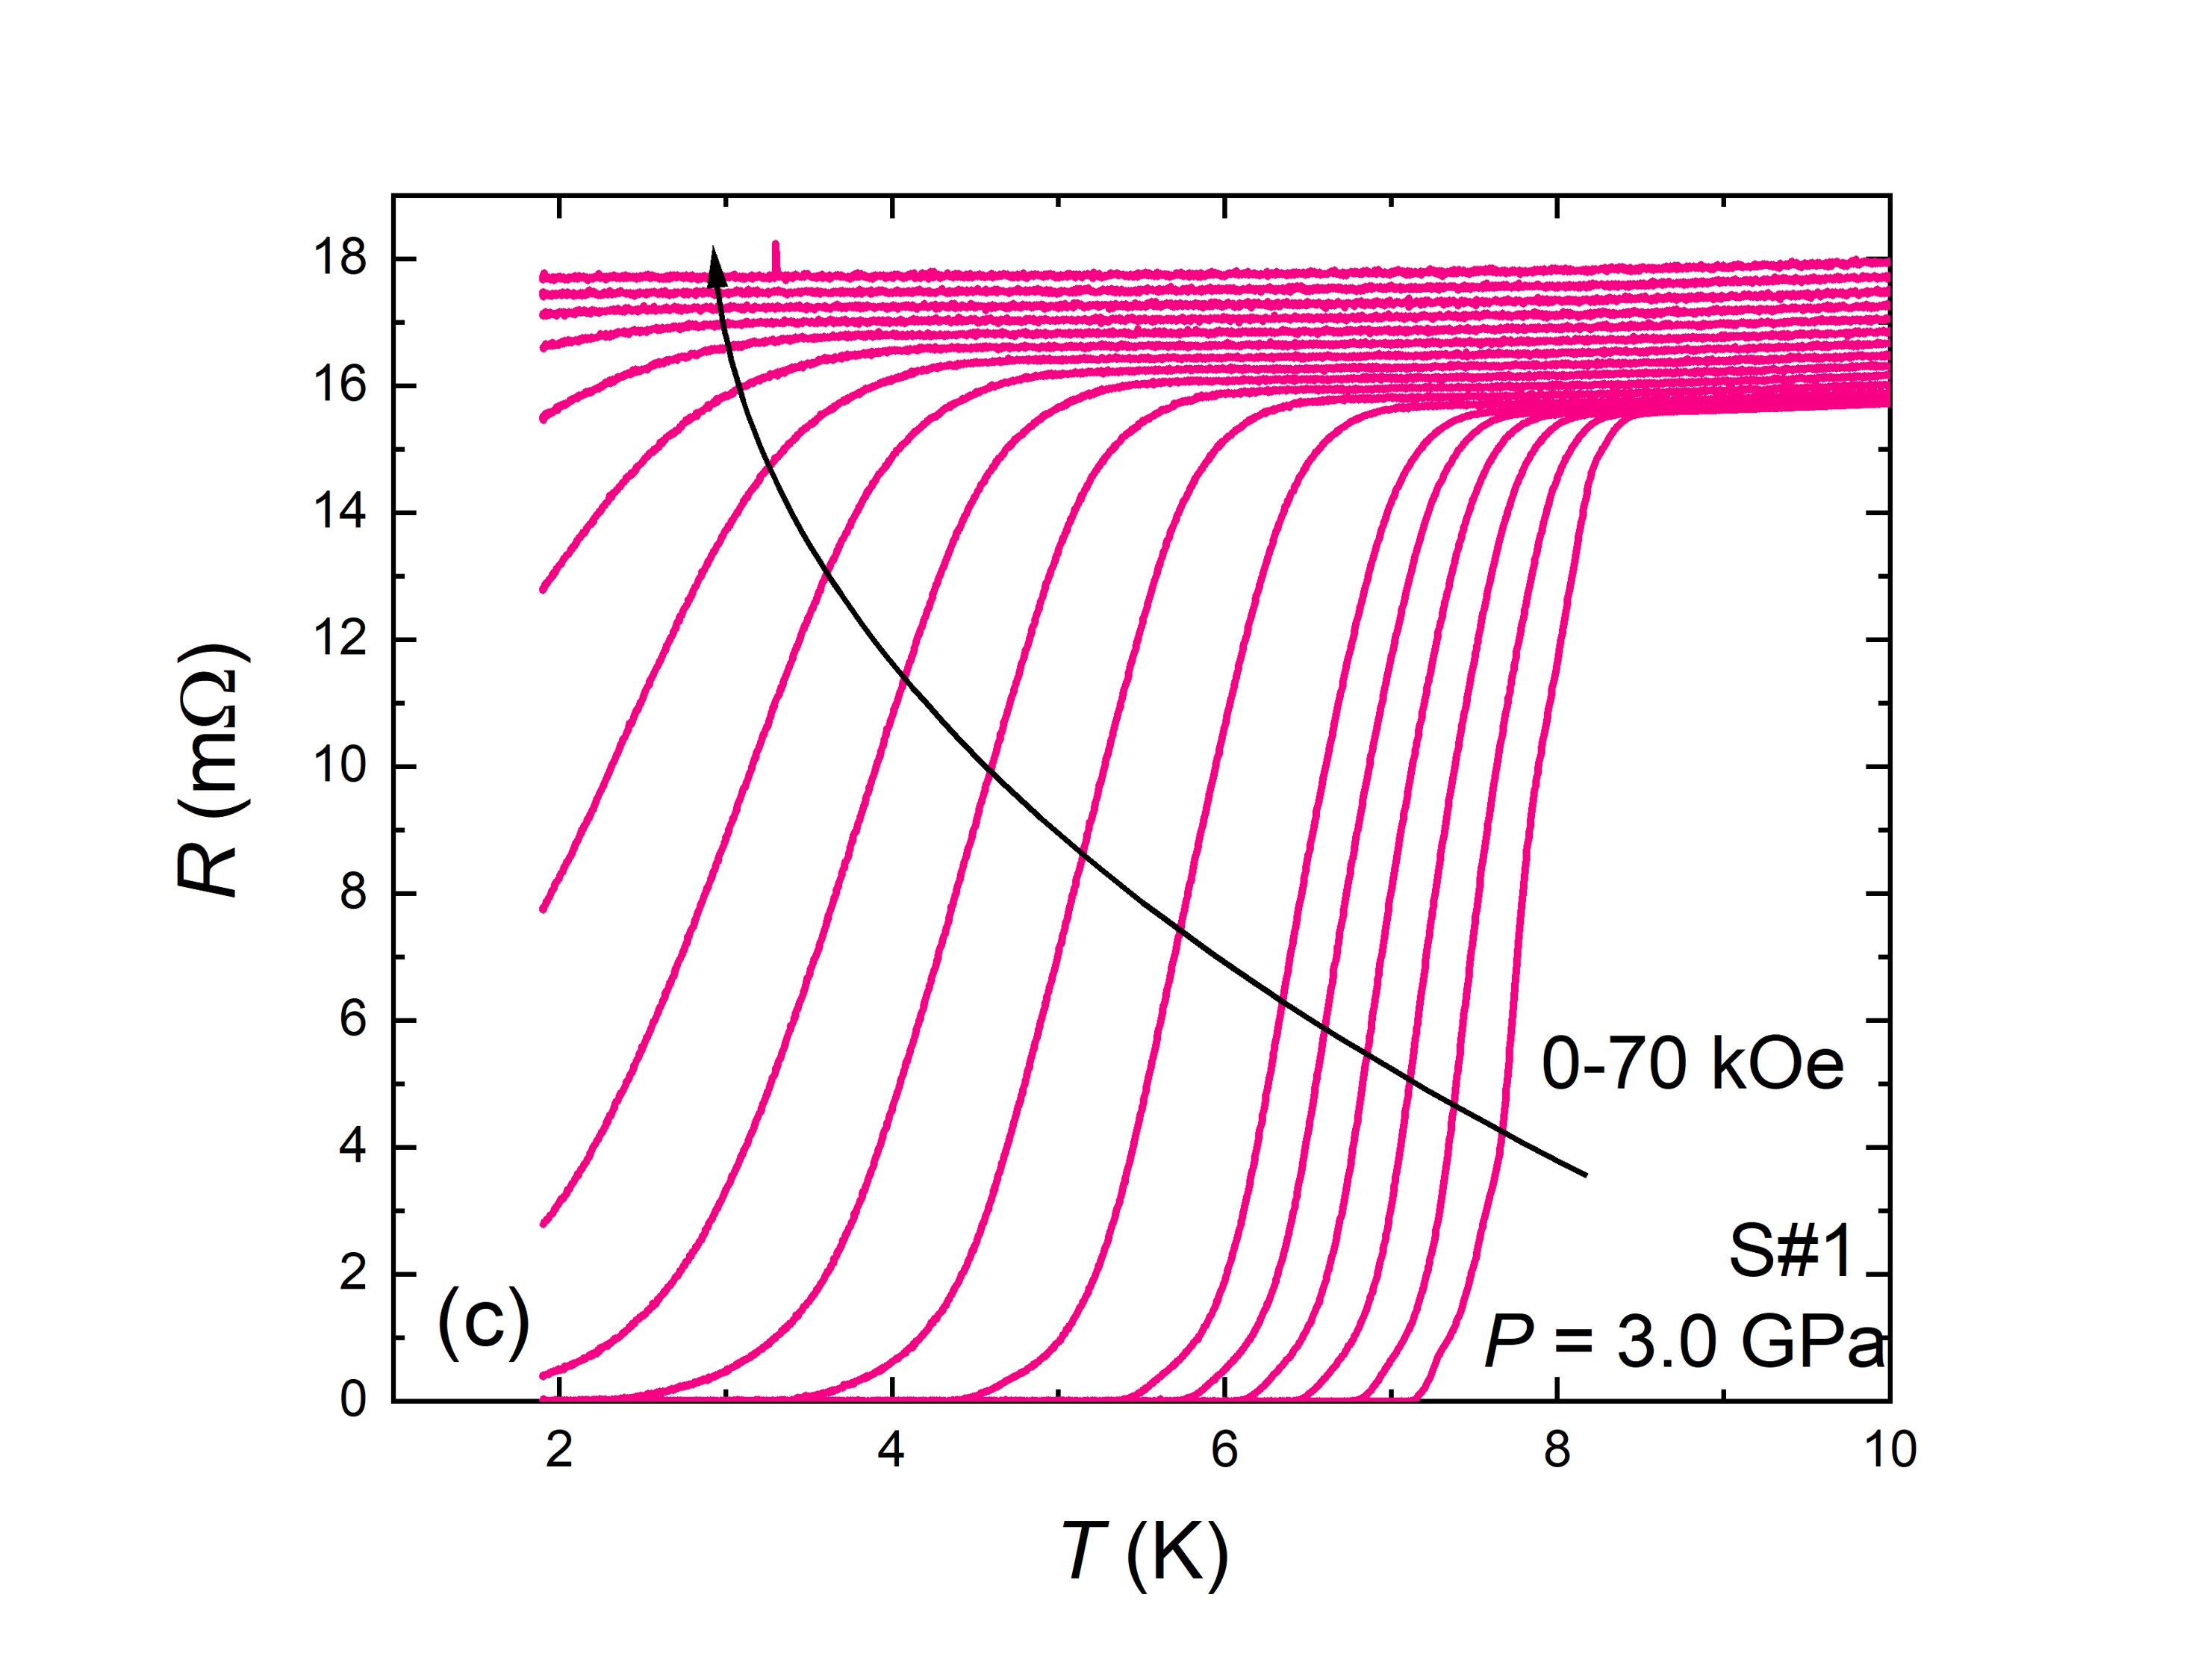
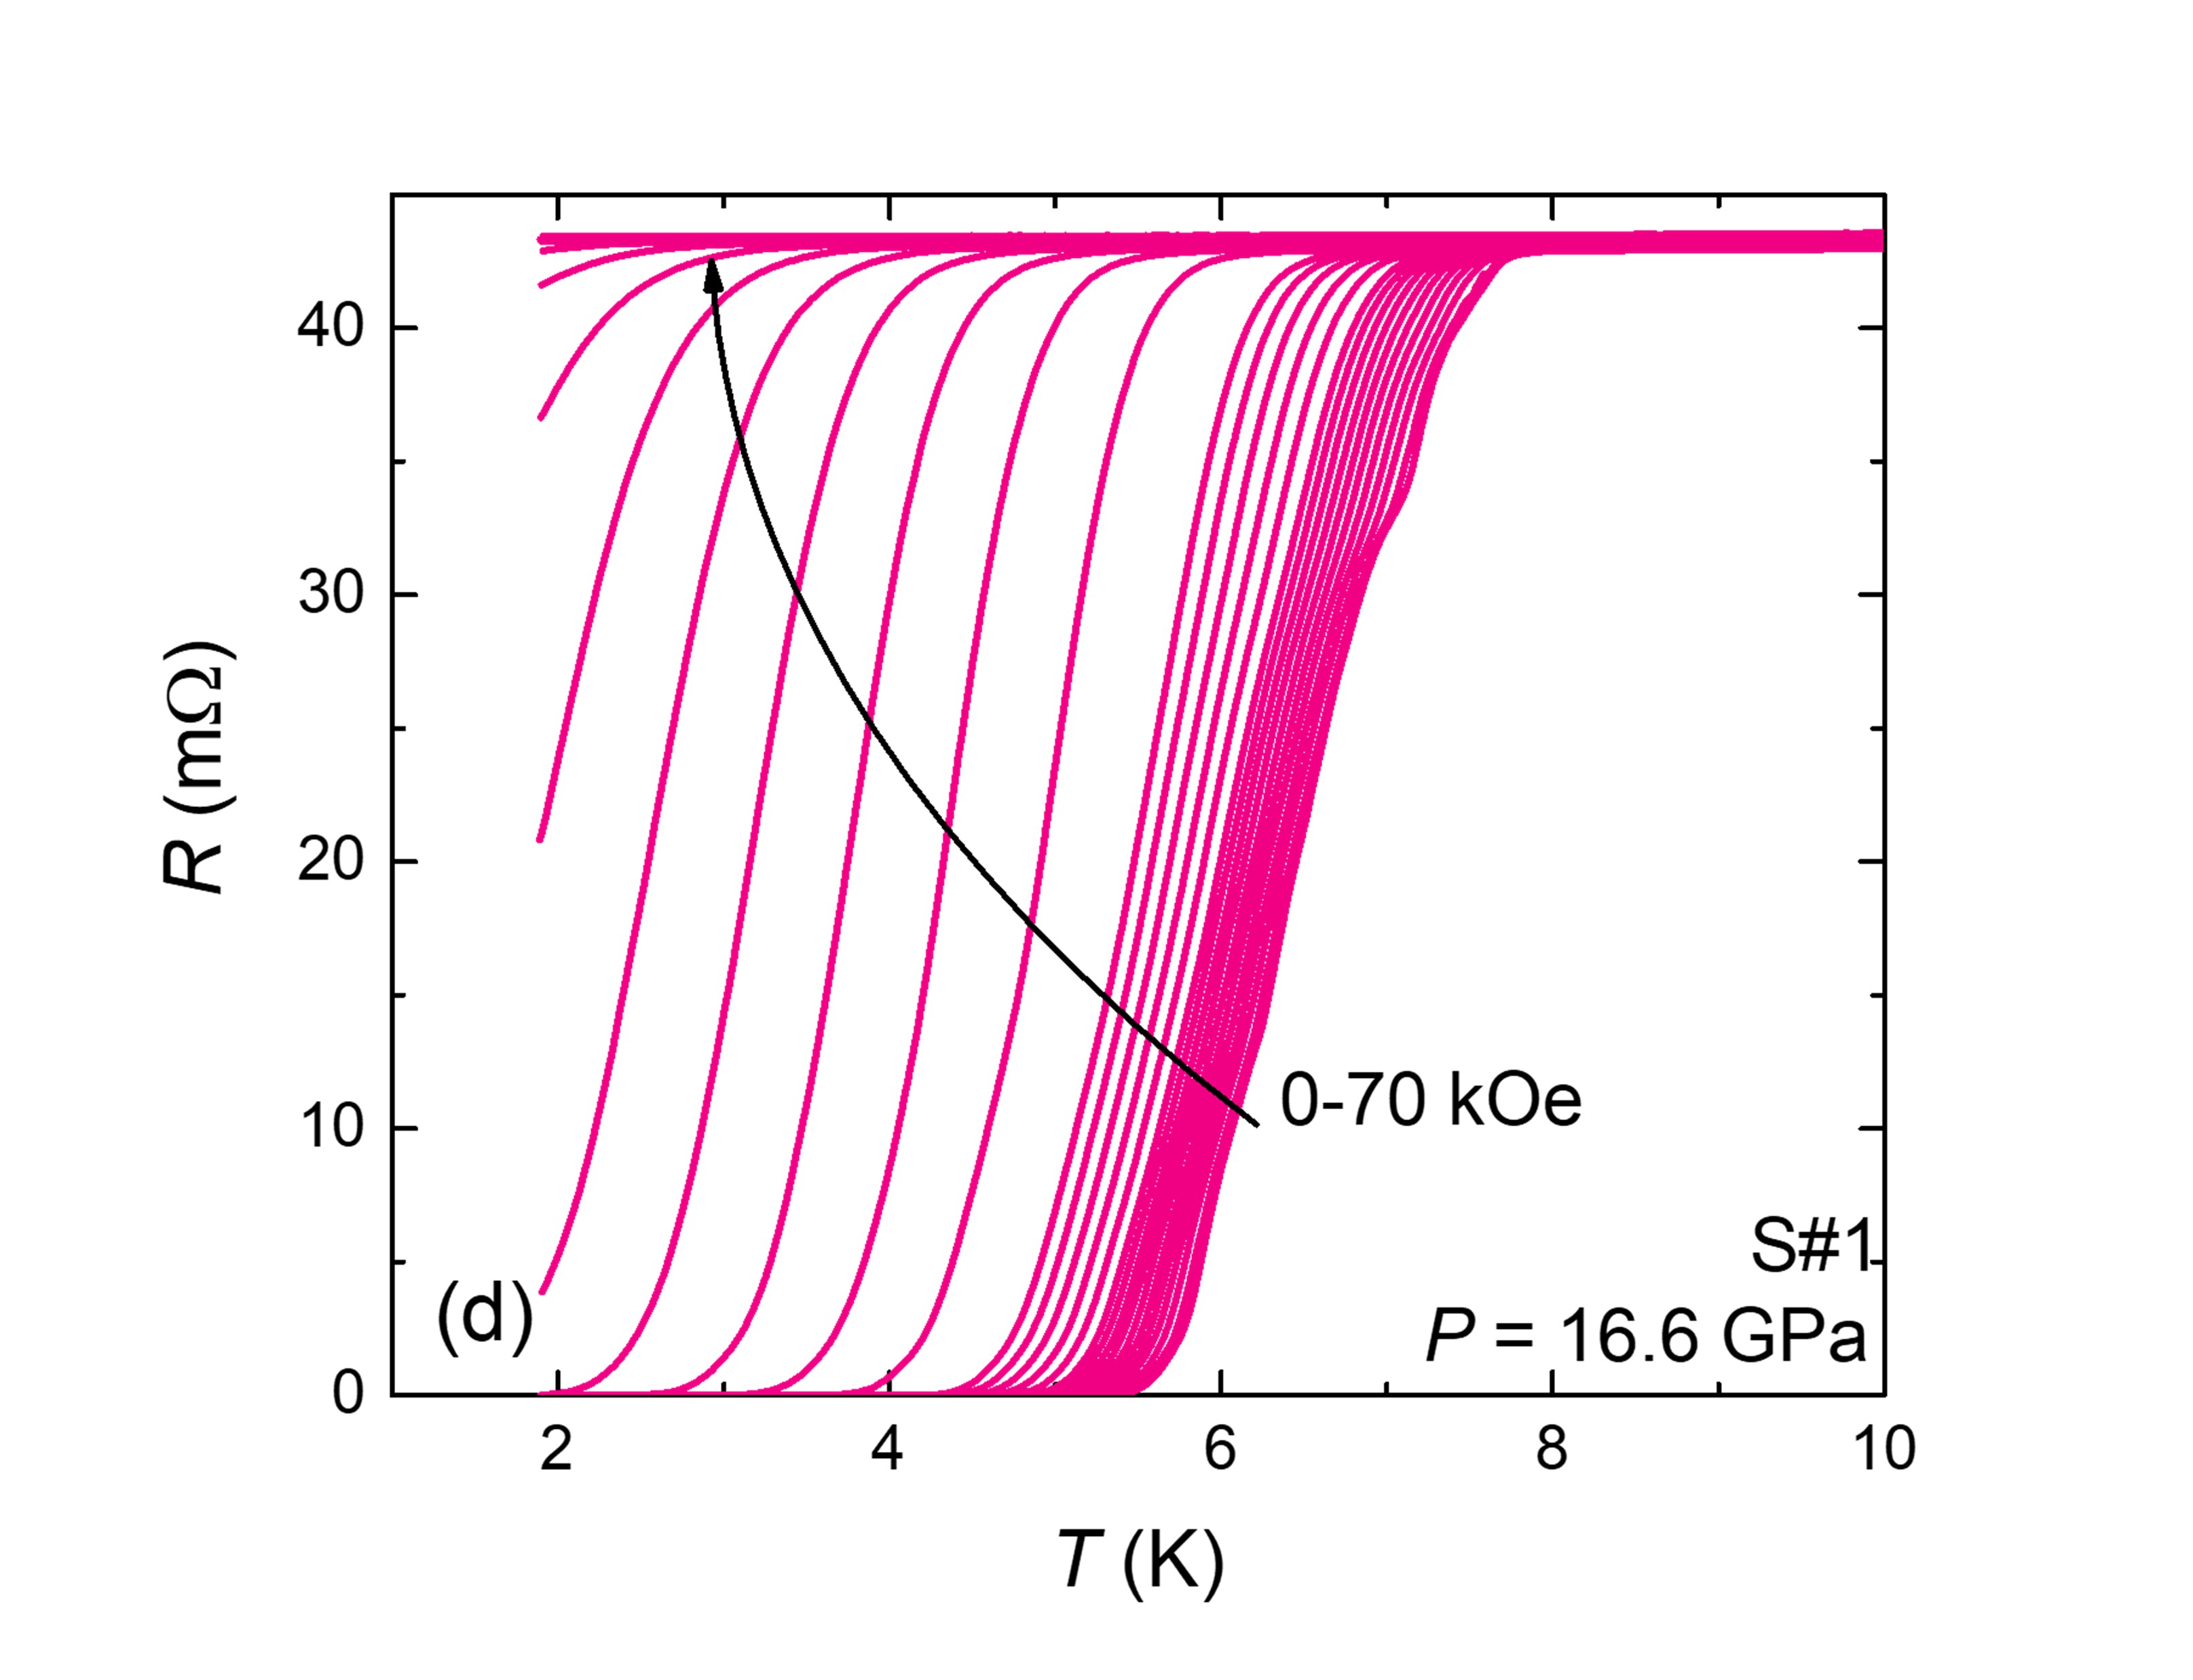
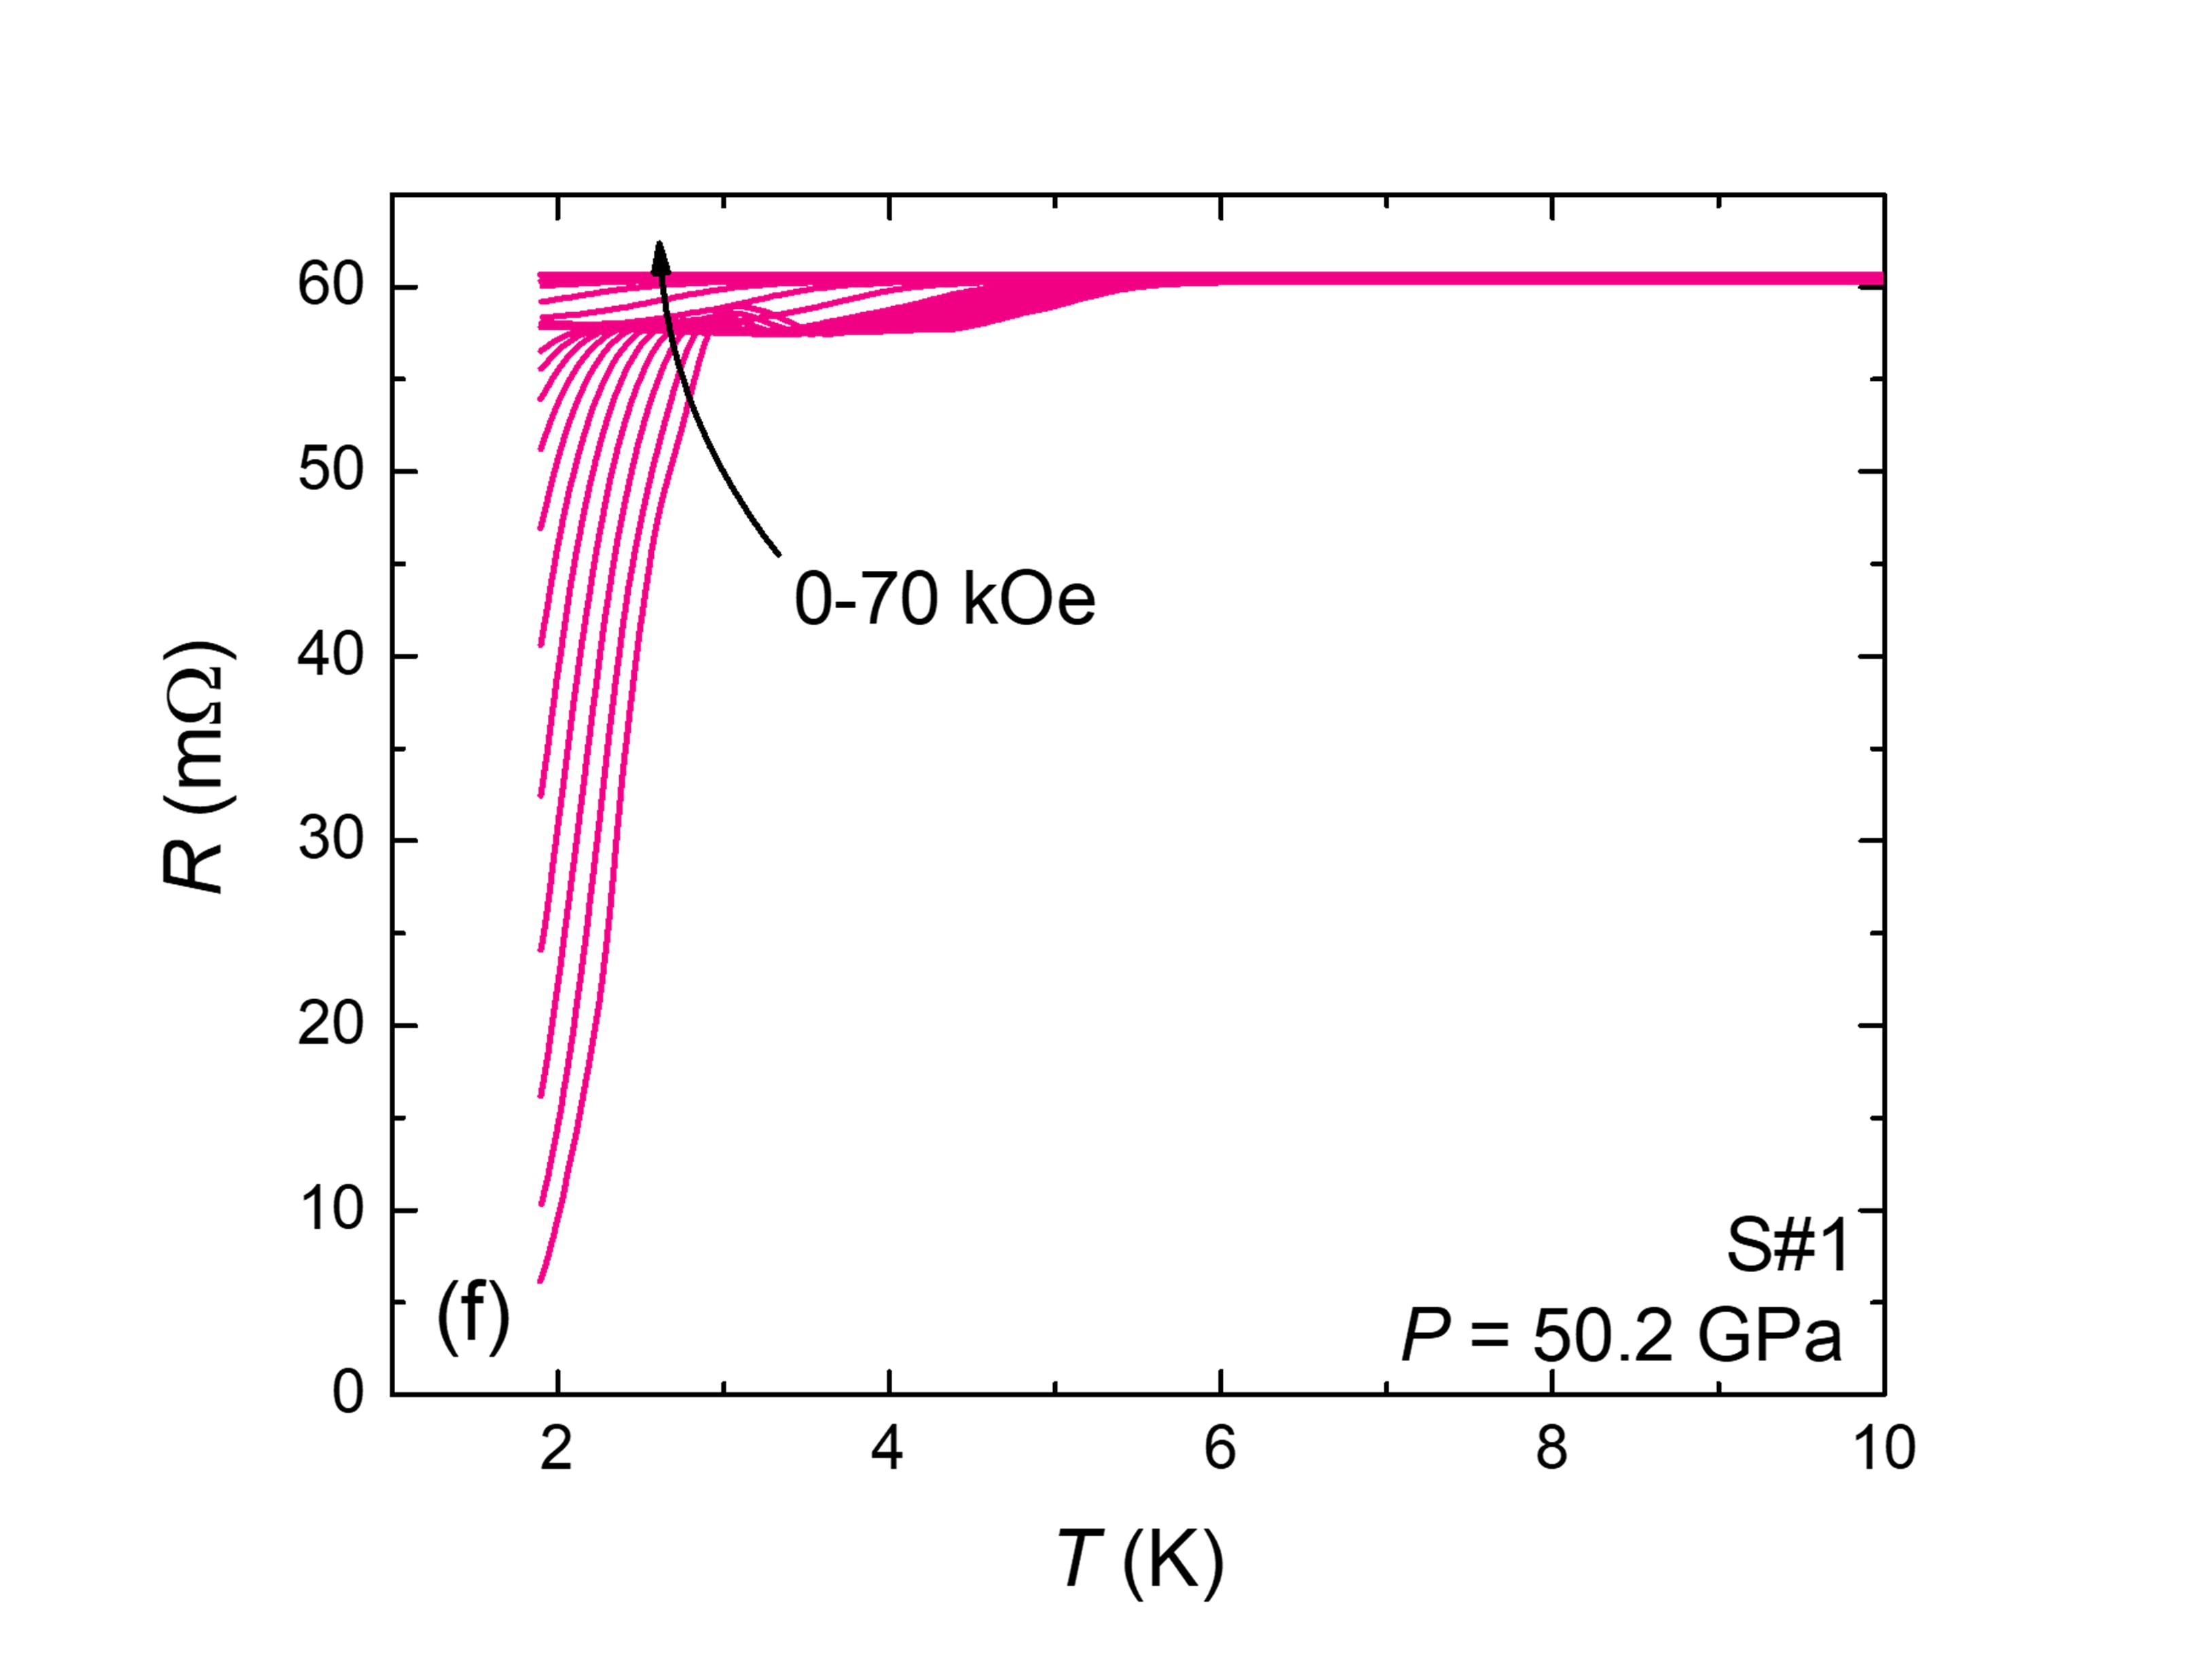
To further study the superconducting state under pressure, we performed electrical transport measurement under external magnetic field varying from 0 to 70 kOe at several pressures on sample S#1, along with ambient pressure measurements of another sample from the same batch outside of the DAC (FIG. 6 (a-f)). For the pressures in FIG. 6 (a-c), the superconducting transition remains sharp, with a single drop to zero resistance. In FIG.6 (d-f), the superconducting transition shows a multi-step feature at zero field.
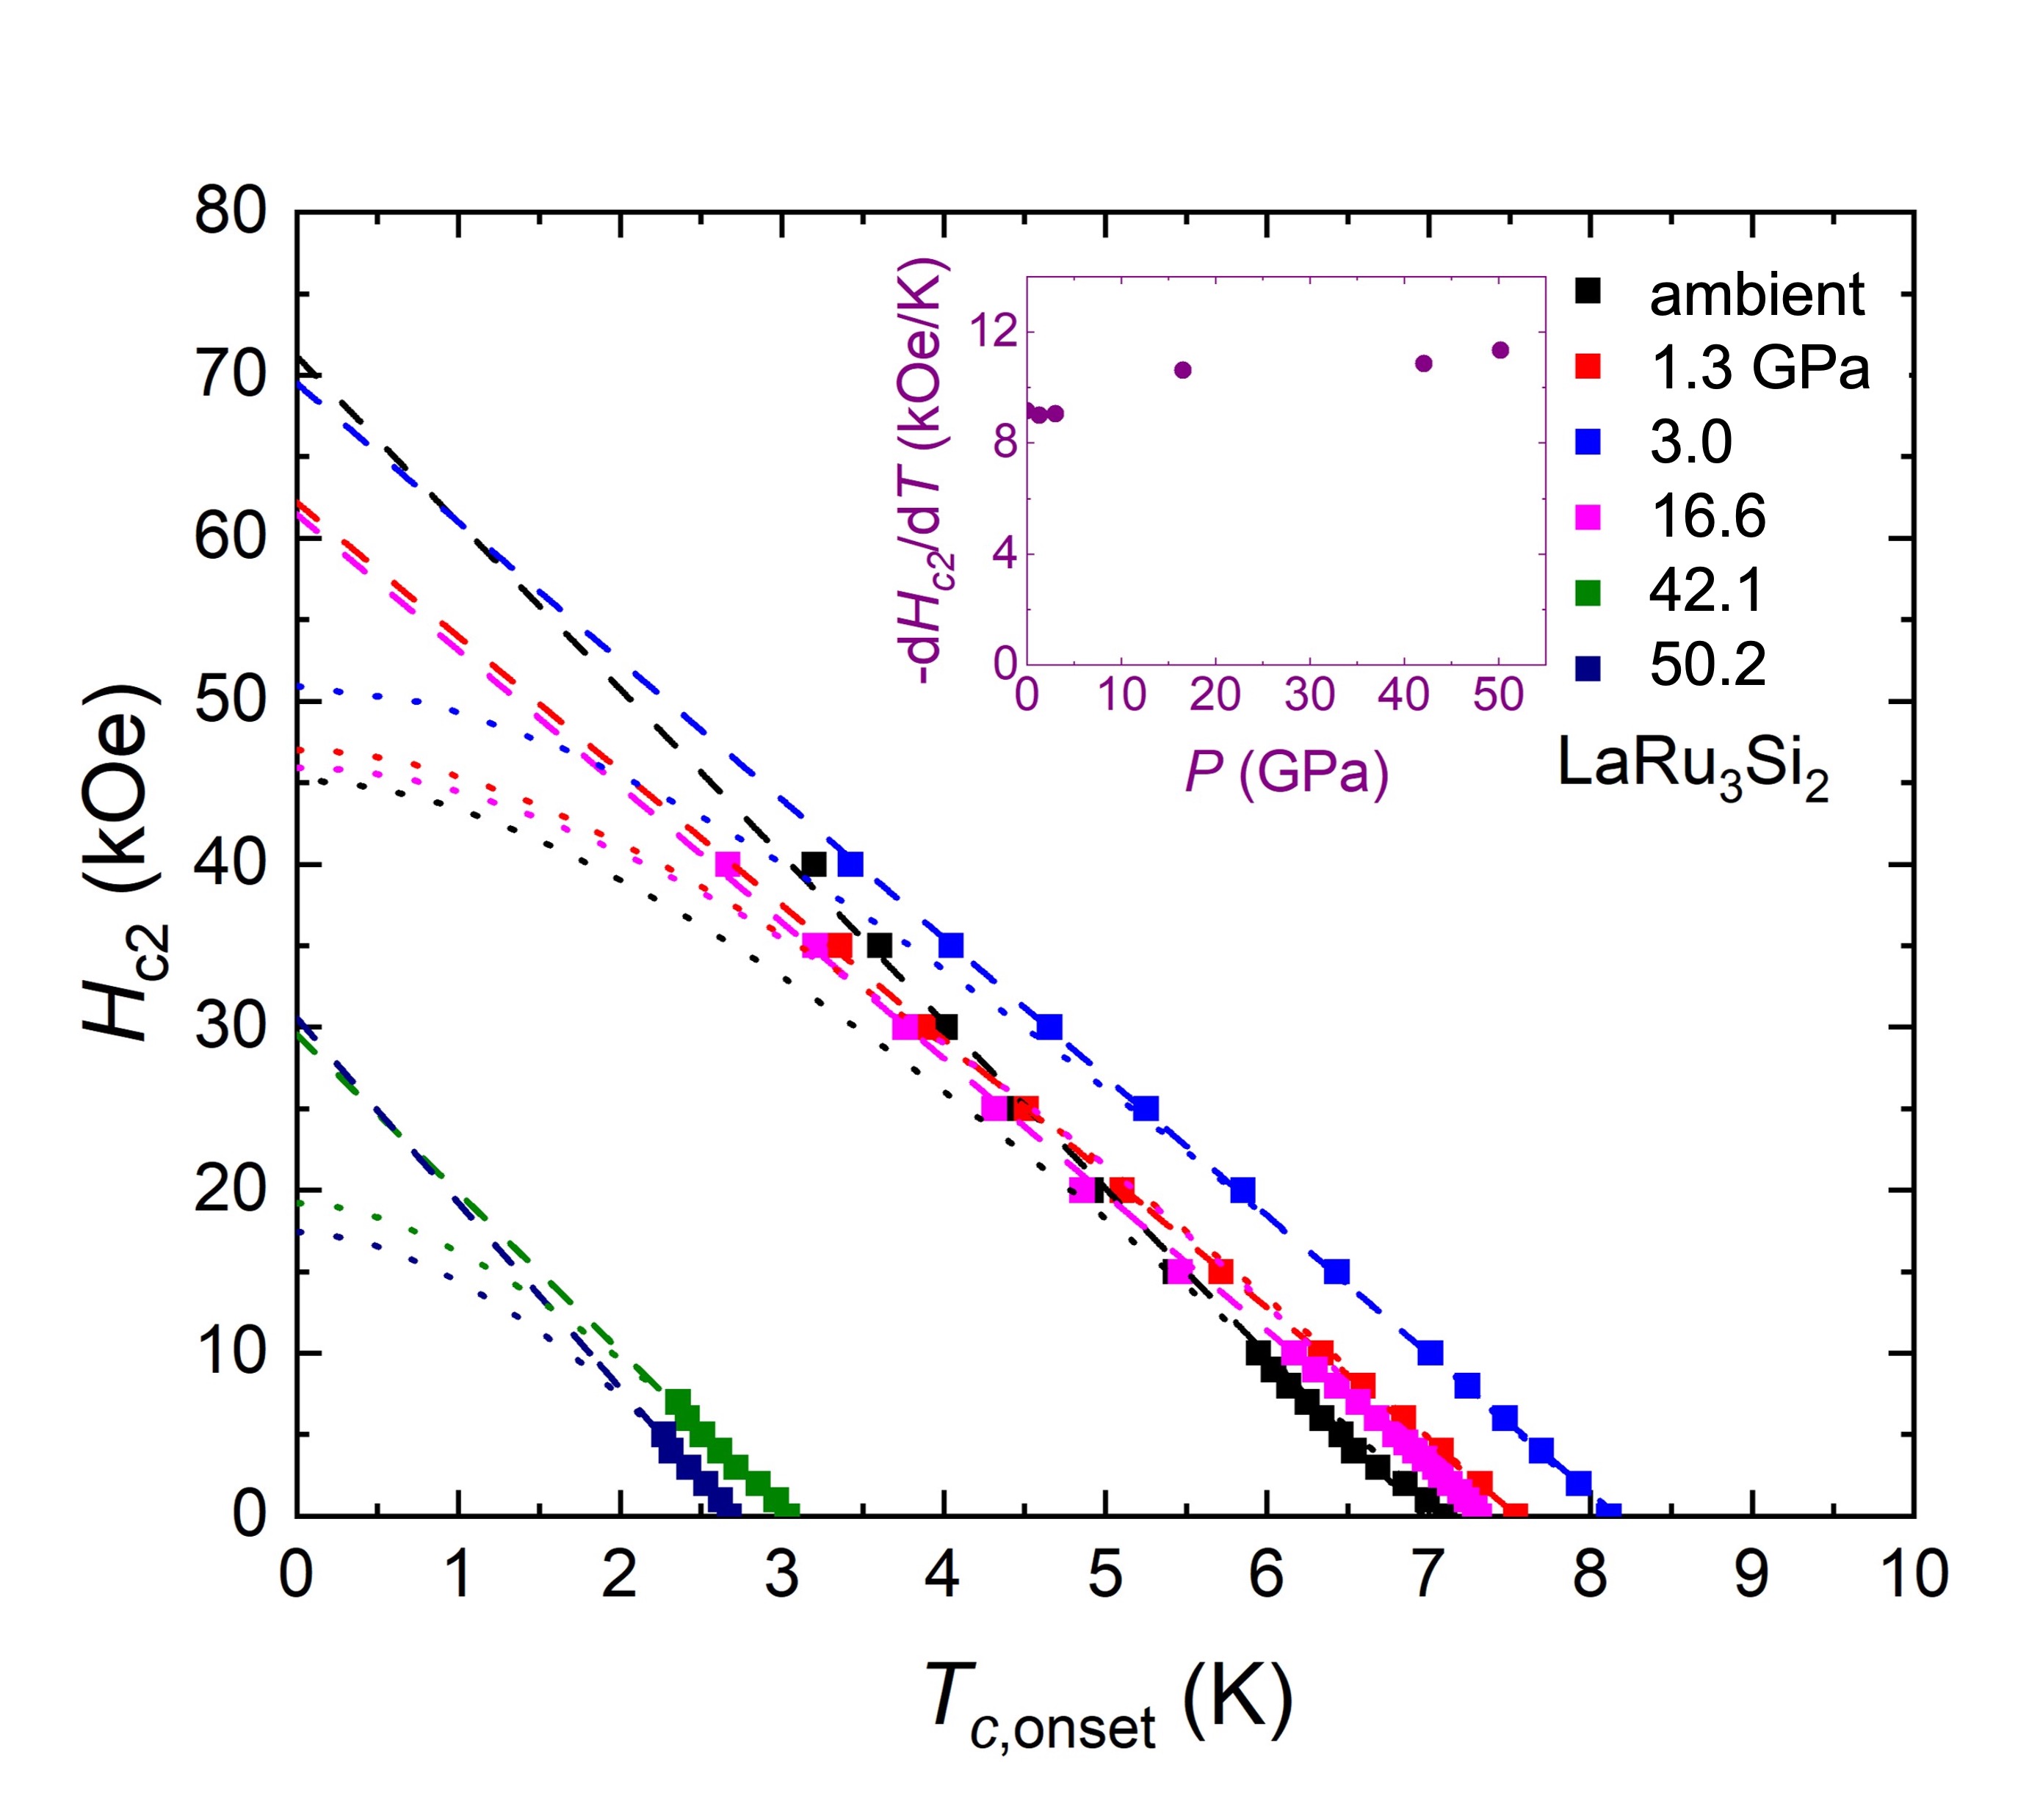
The upper critical field, , is extracted from FIG. 6 (a-f). As shown in FIG. 6 (a,e), the onset and offset of the superconducting transition is found by same aforementioned criteria at different pressures, with derived from sharpest transition, since other small steps get easily suppressed under field.
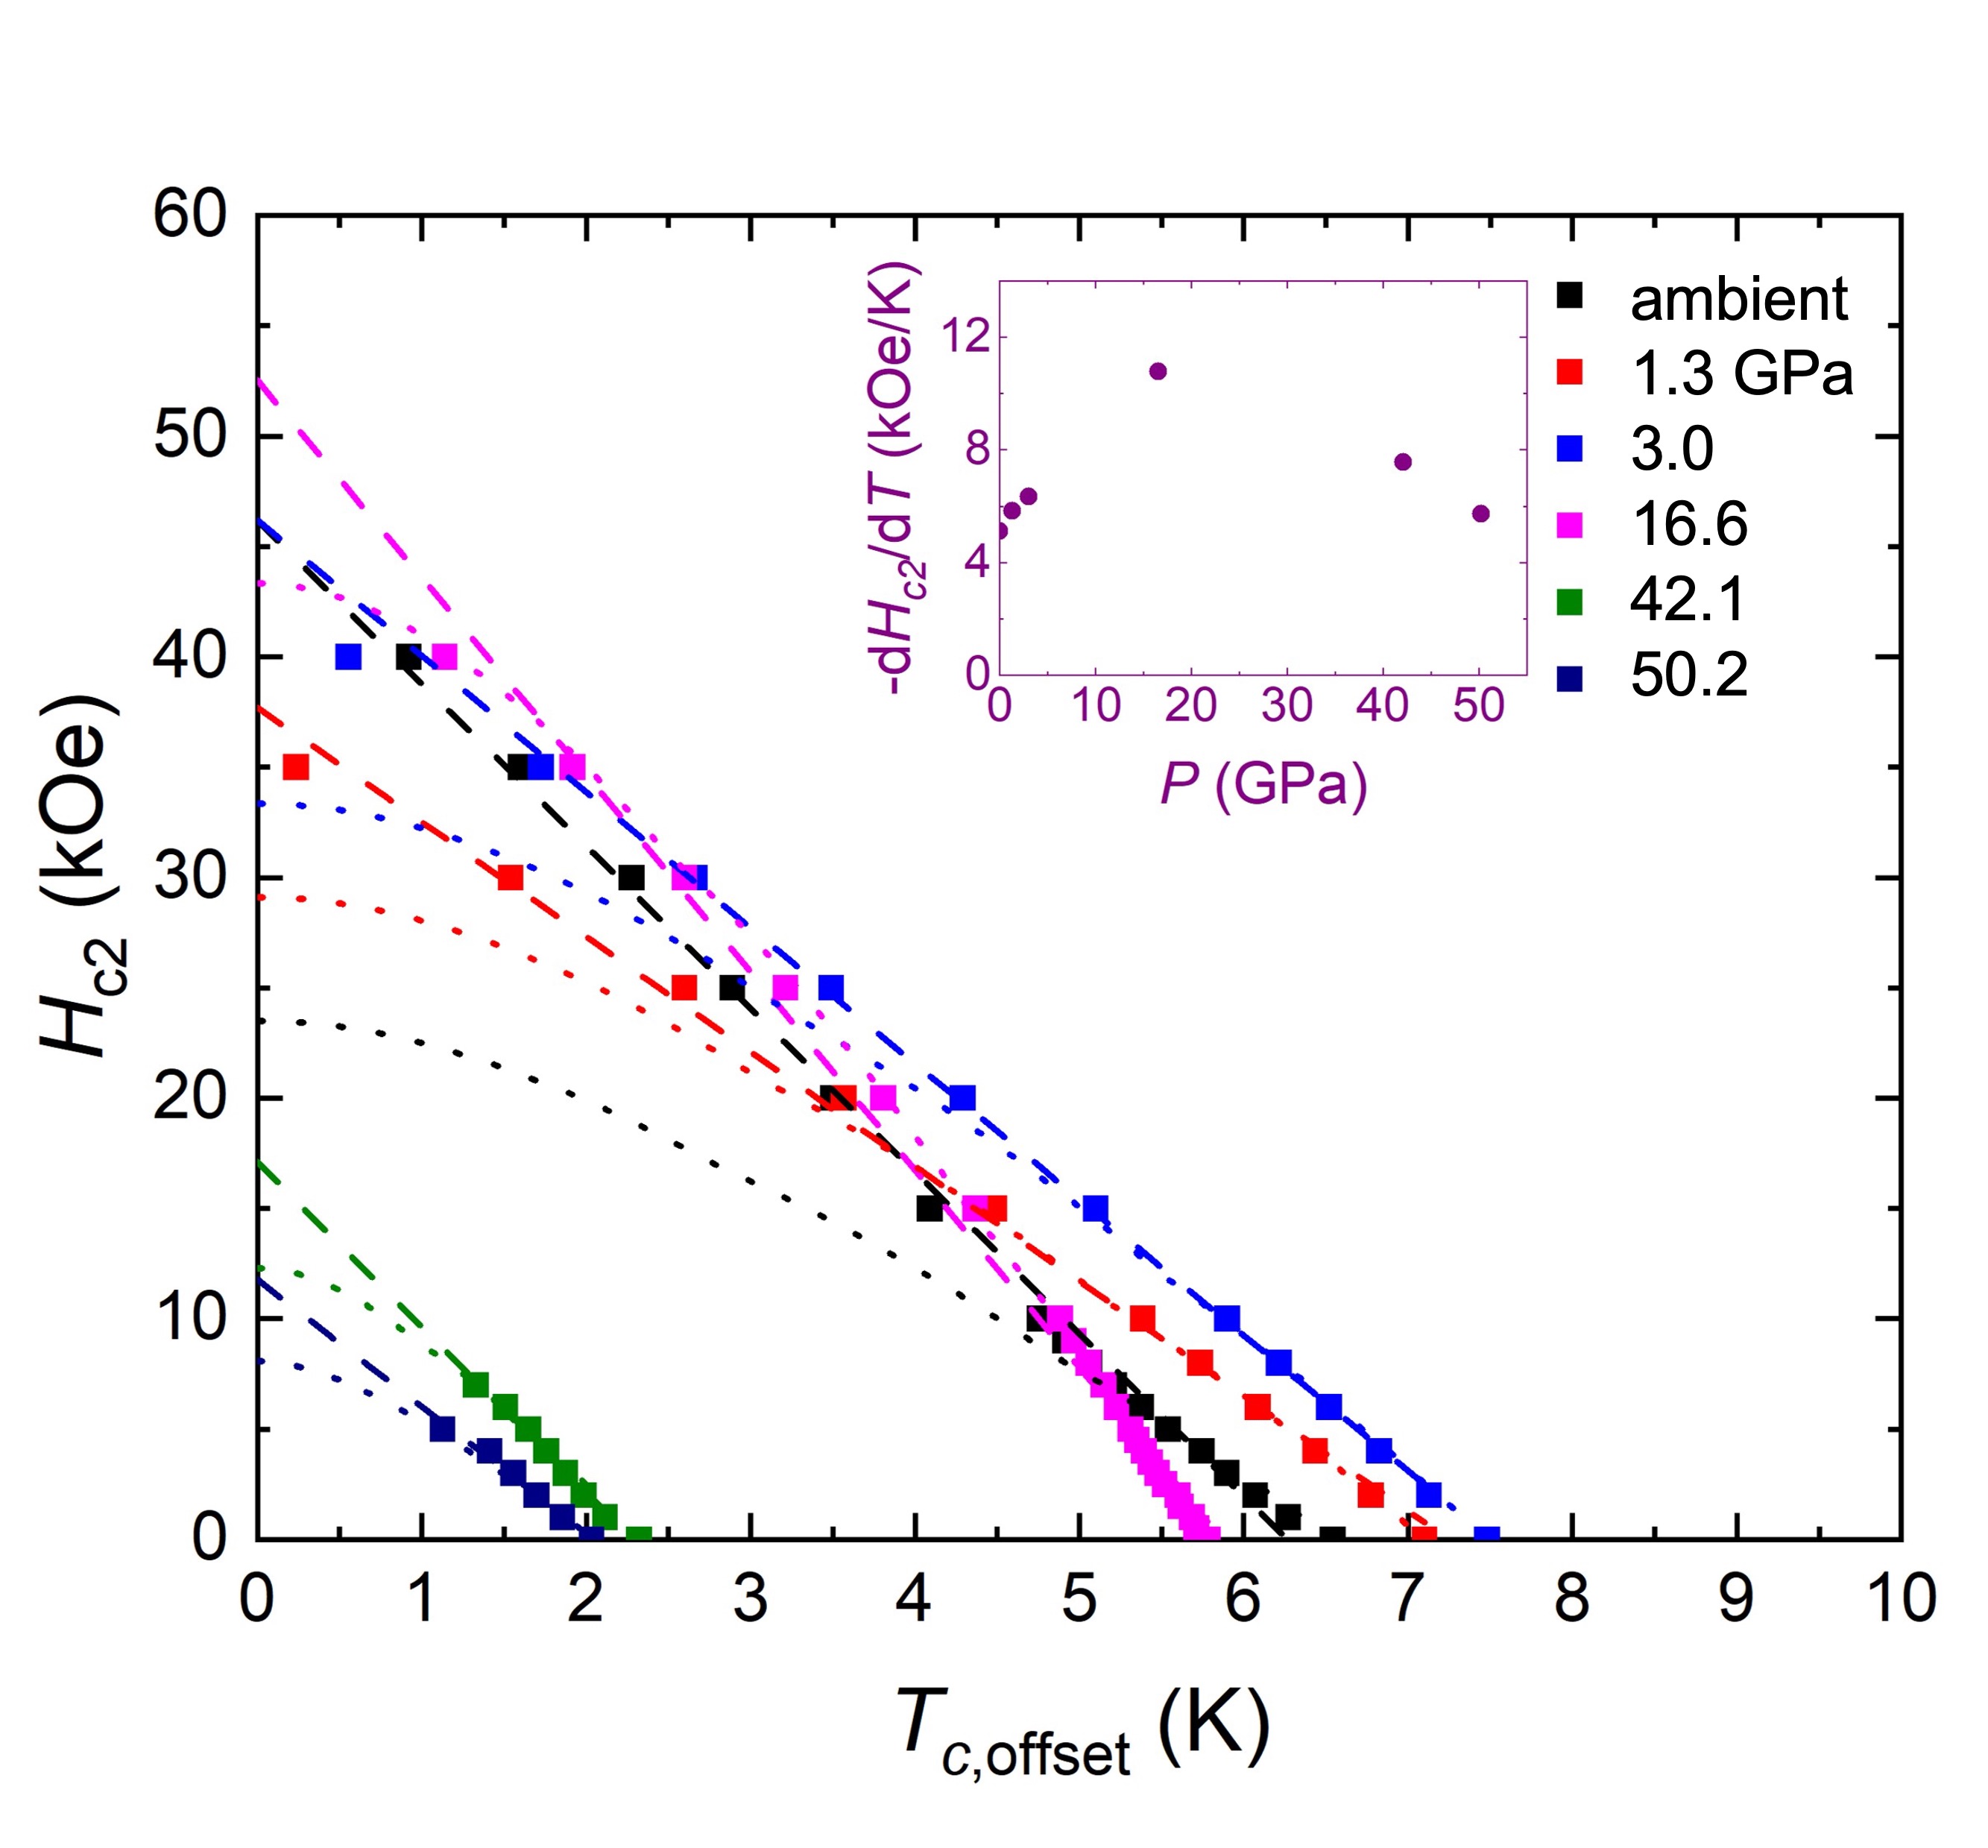
We can fit versus (presented in FIG. 7) and (shown in Appendix B) by both a linear fit and the Werthamer–Helfand–Hohenberg (WHH) model [28, 29, 30]. Details of the fitting method and results can be found in Appendix B, where at each measured pressure the upper critical fields are well below the Pauli paramagnetic limit (kOe) [31]. It is evident that, at least for = 0, 1.3, 3.0, and 16.6 GPa, the WHH model does not accurately describe the experimental data. In addition, from the inset of FIG. 7, - is nearly pressure-independent, ranging from 9.2 kOe/K at ambient to 11.4 kOe/K at highest pressure. The - values extracted from the offset data are dramatically different (as shown in Appendix B, FIG.14 inset), showing dramatic pressure sensitivity with a local maximum near 10 GPa. The origin of this difference is not clear at this point in time.
III.3 PXRD under Pressure
To investigate the nature of dome-like superconductivity in pressurized LaRu3Si2, we performed high-pressure PXRD measurements up to 34.9 GPa. FIG. 8 presents the diffraction pattern at the lowest measured pressure (0.6 GPa), with the peaks of the primary phase, LaRu3Si2, indexed. Subtle peaks corresponding to elemental Ru, identified as an impurity phase, are also observed. However, the intensities of LaRu3Si2 peaks are not consistent with ambient pressure measurement outside the DAC with significantly larger amount of sample, i.e. whereas the [200] peak shows maximum intensity for the ambient pressure measurement, the [201] peak shows maximum intensity for PXRD inside the DAC. It brings the consideration of developing preferred crystalline orientation for peak intensity evolution under pressure. Notably, the impurity phase LaRu2Si2, detected in the ambient-pressure XRD measurements (FIG. 1), was absent under high-pressure conditions. Missing any noticeable amount of LaRu2Si2 could be due to the inhomogeneity of how the small amount of it is distributed throughout the arc melted button (consistent with its absence in the EDS, as discussed above).
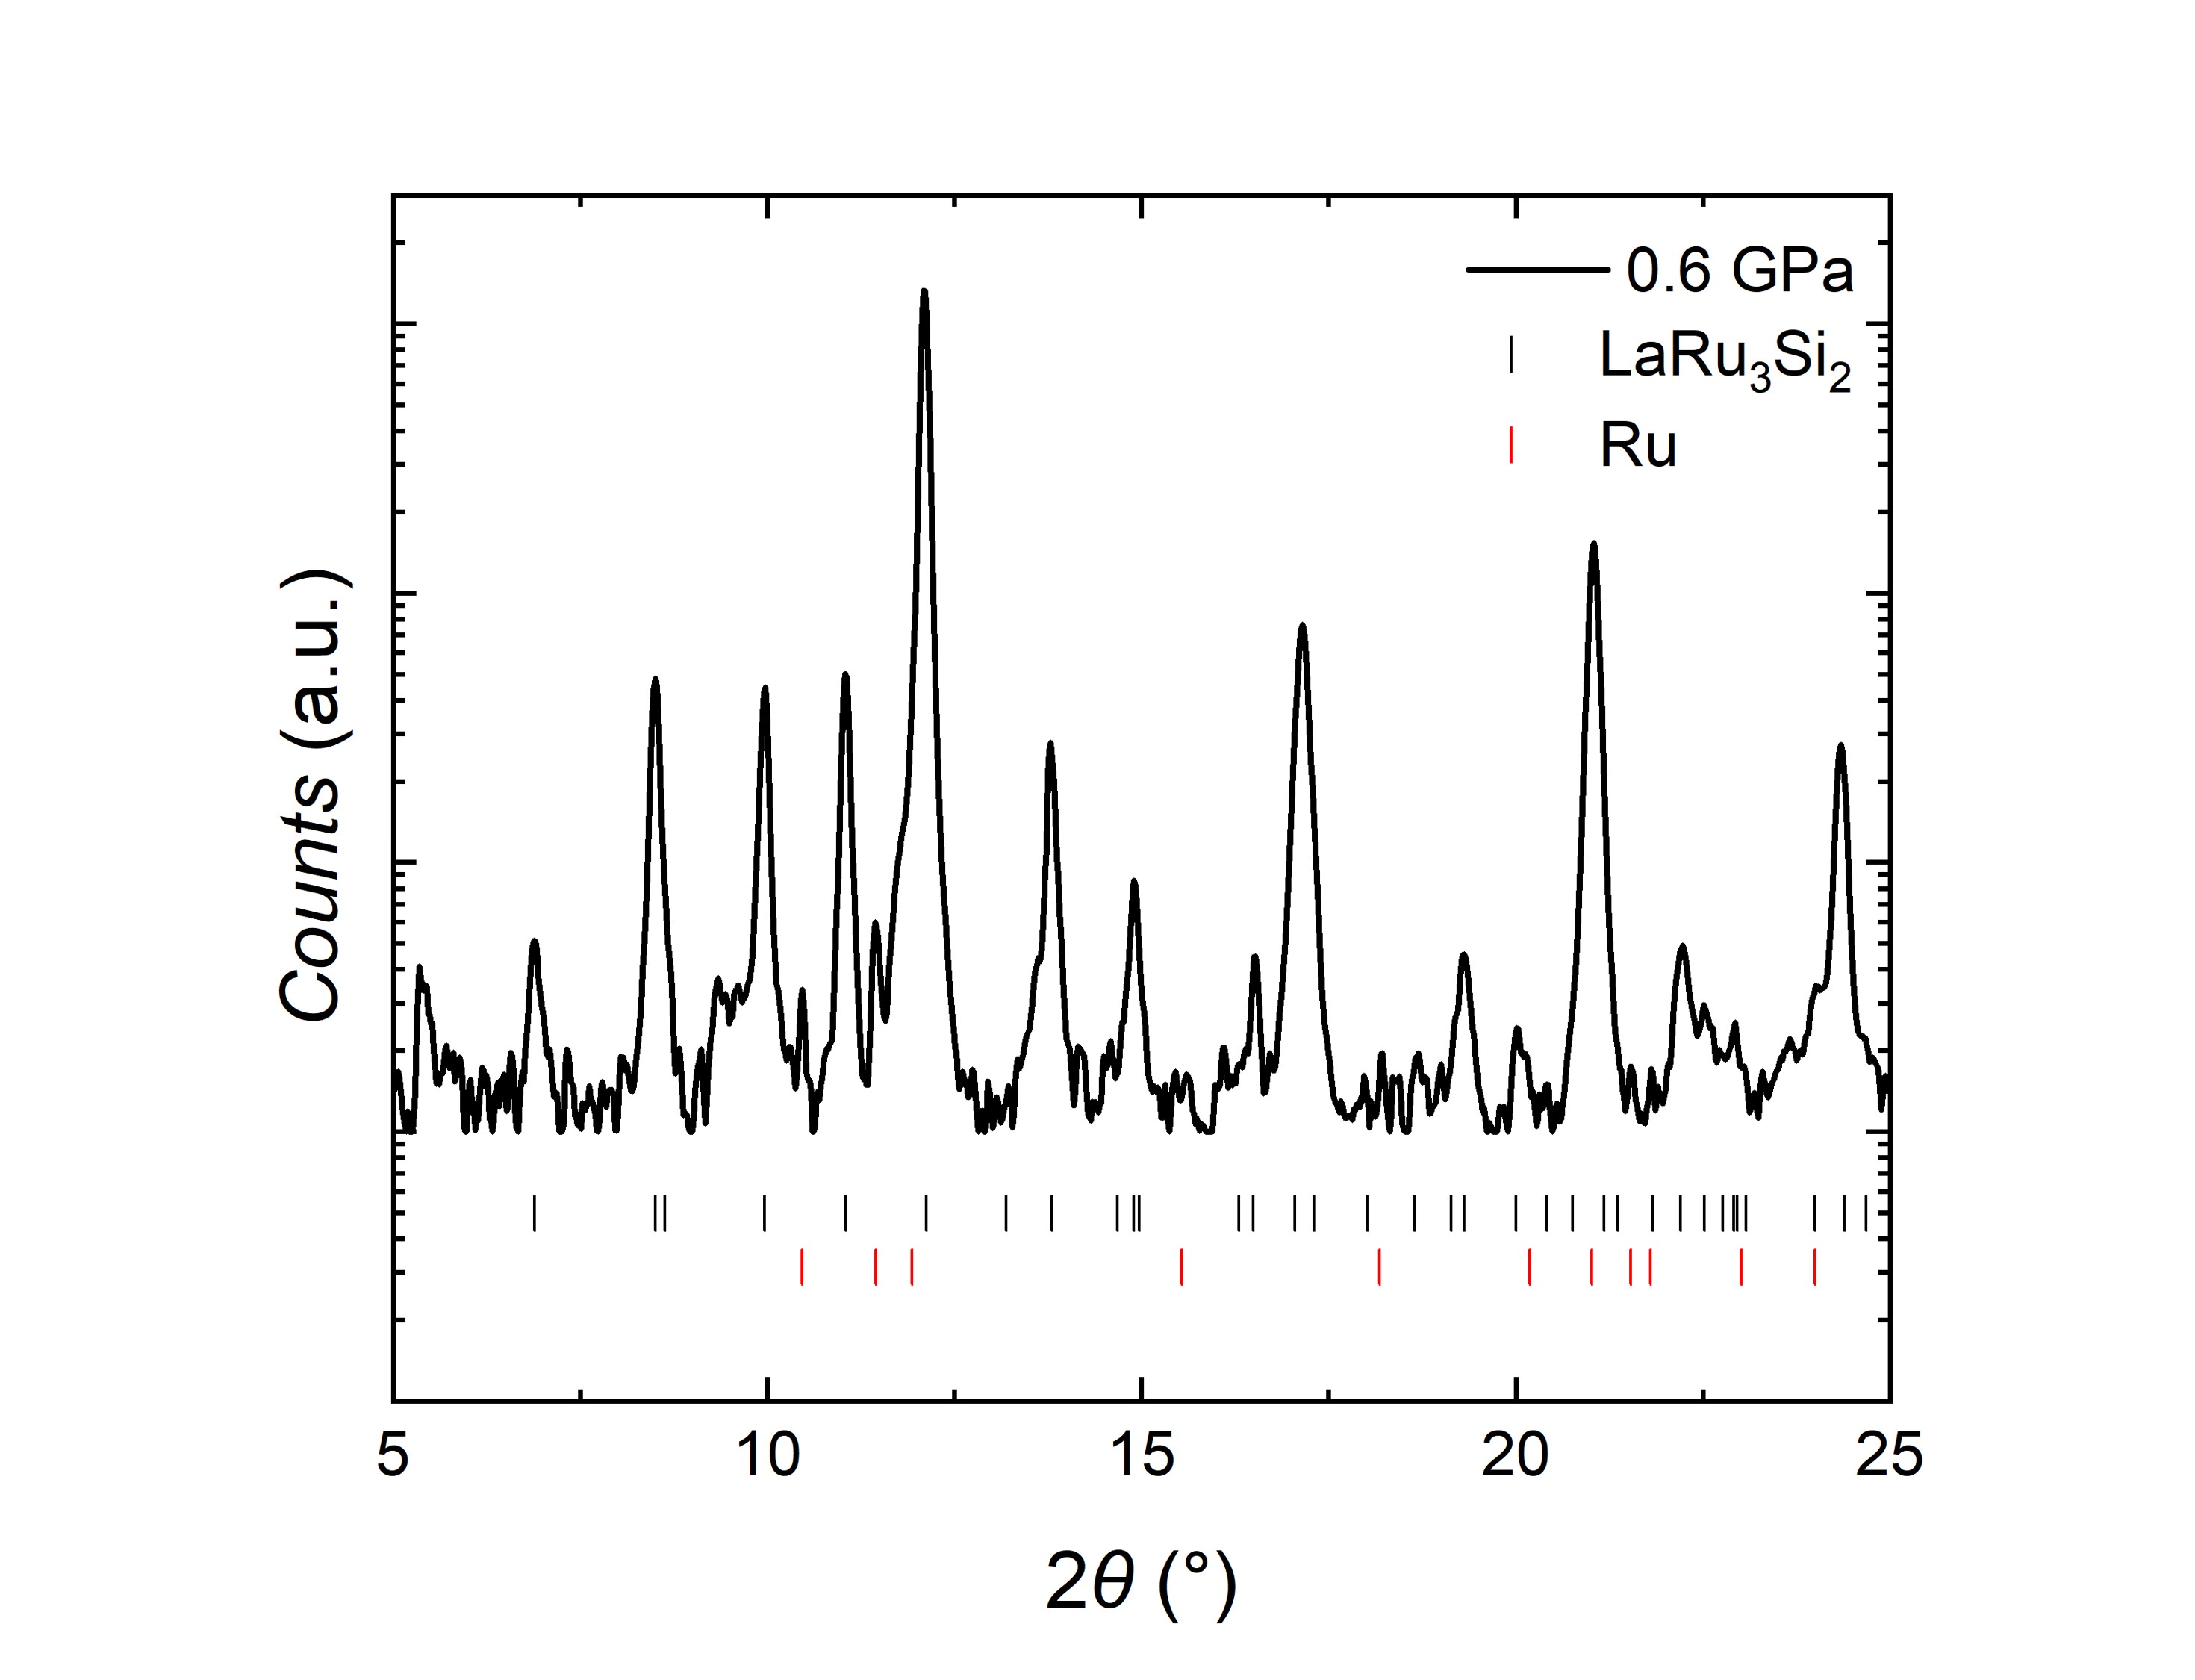
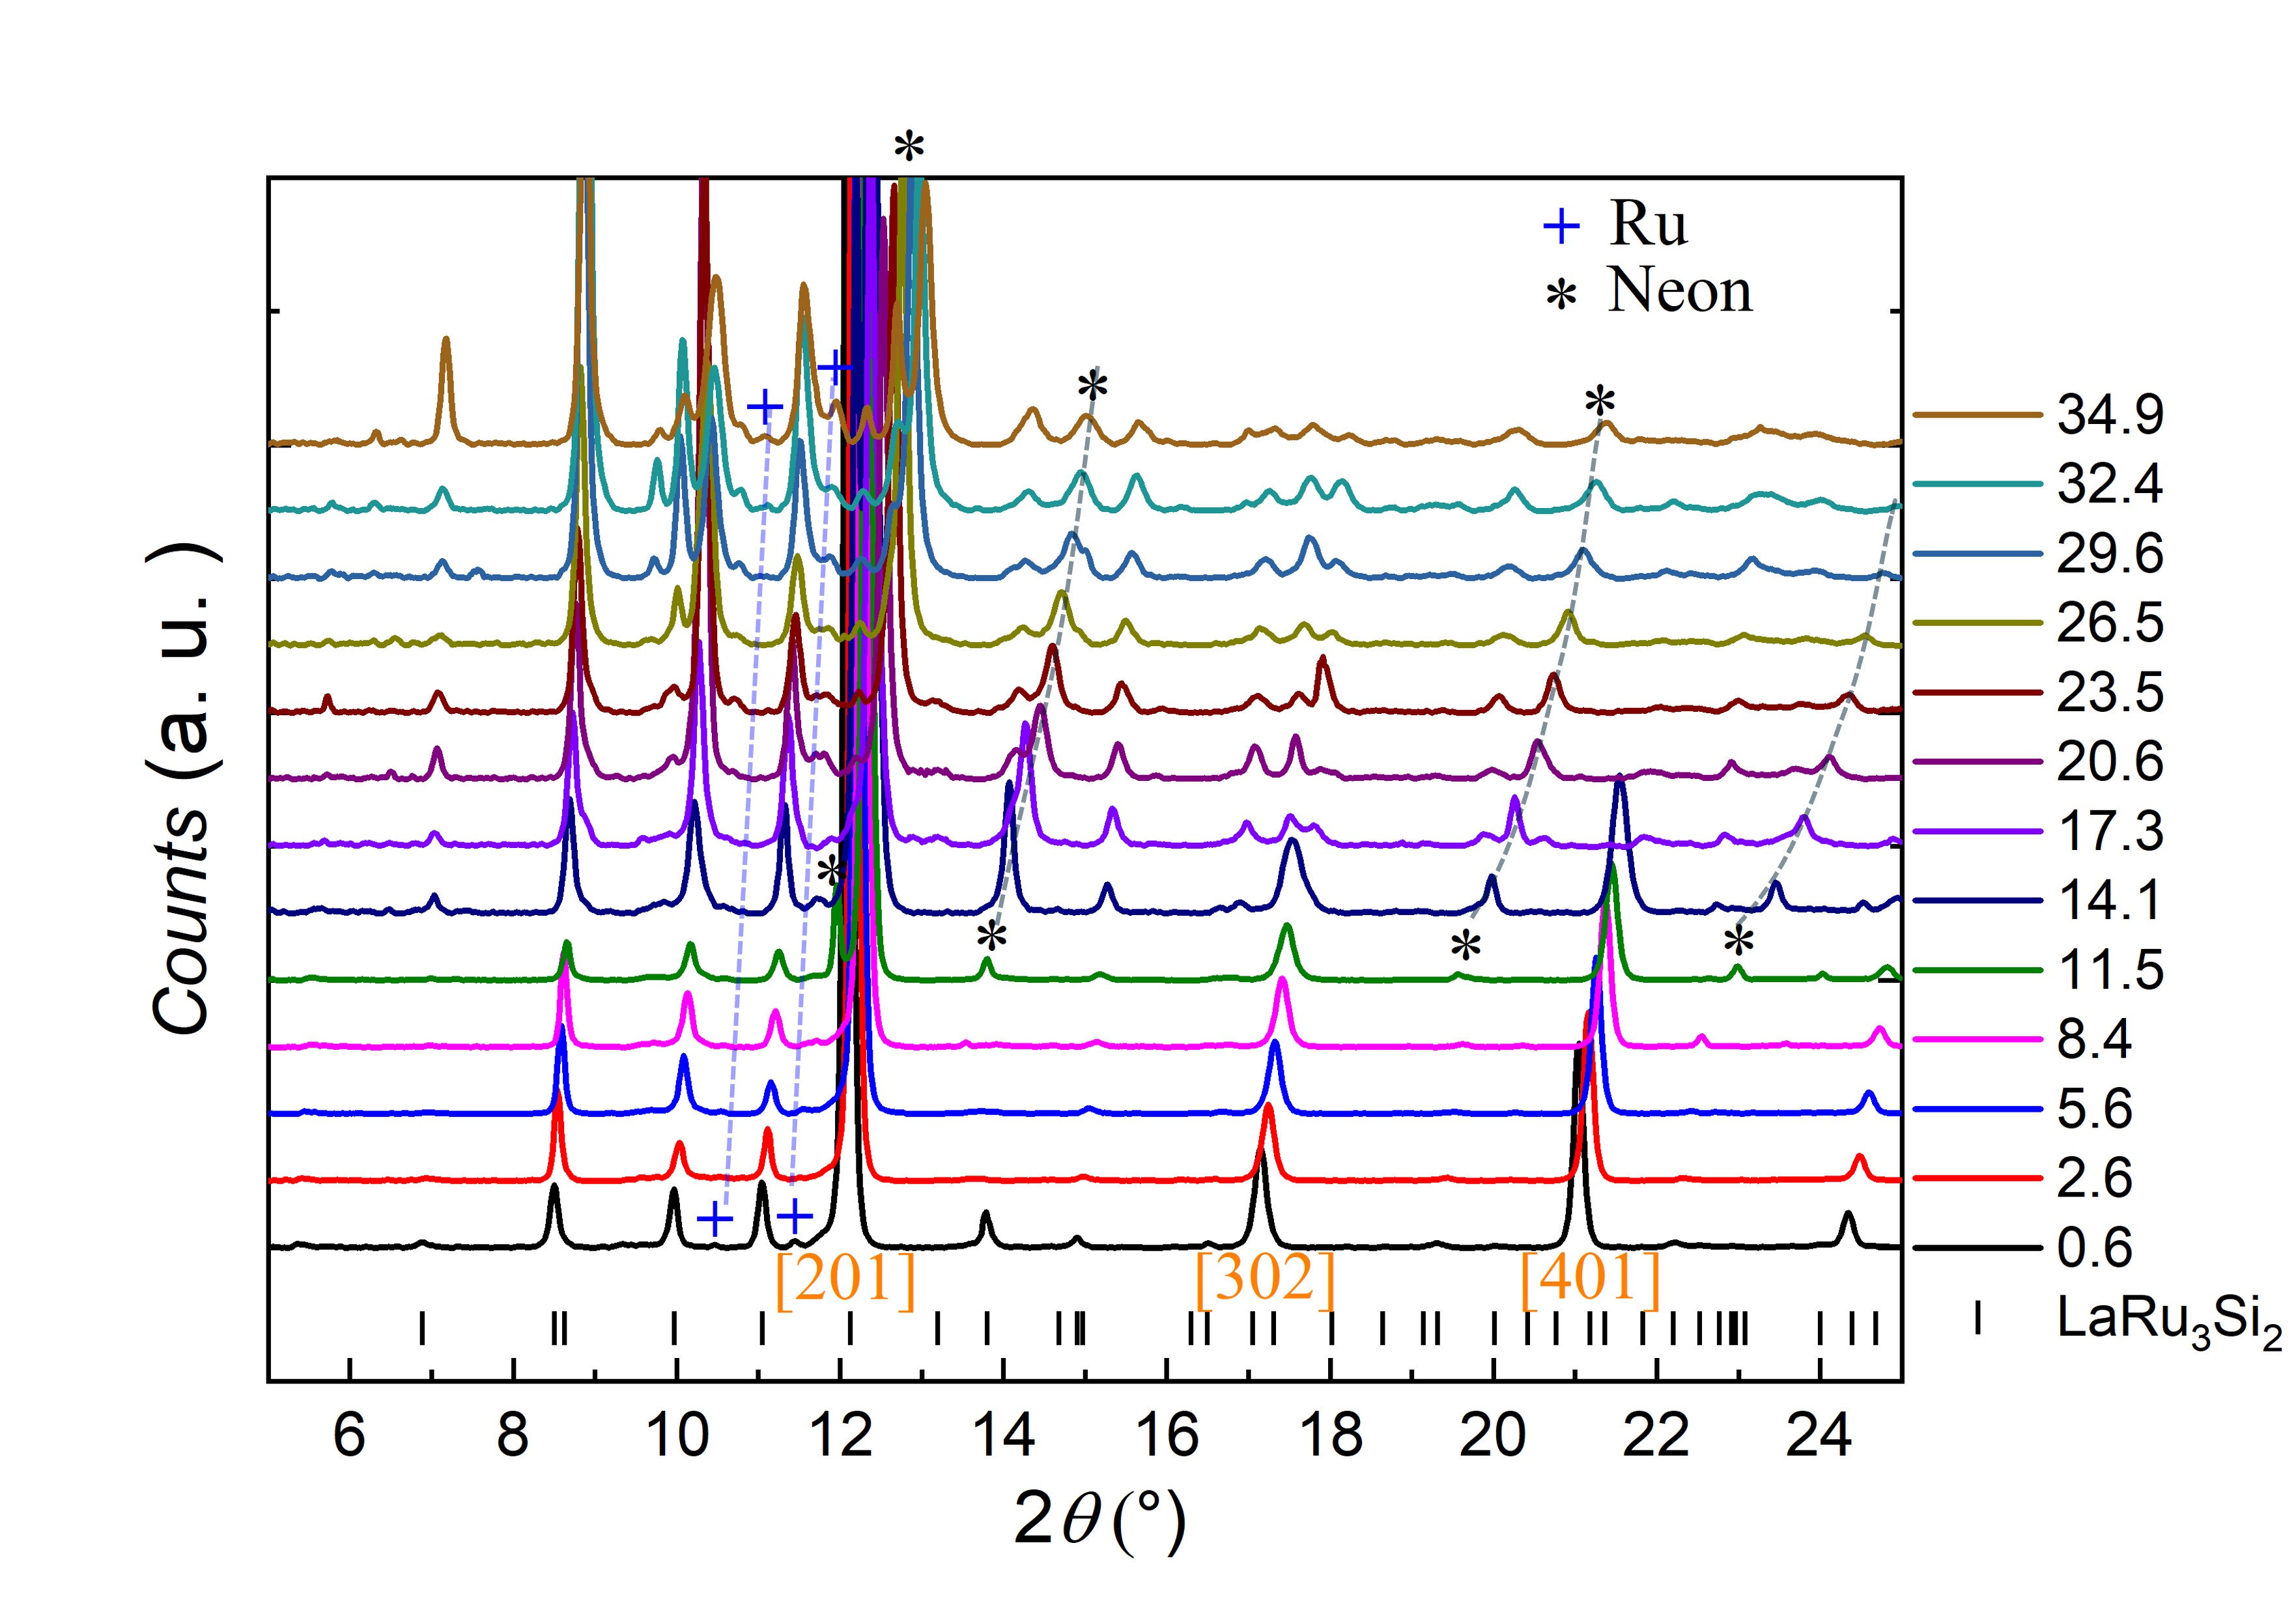
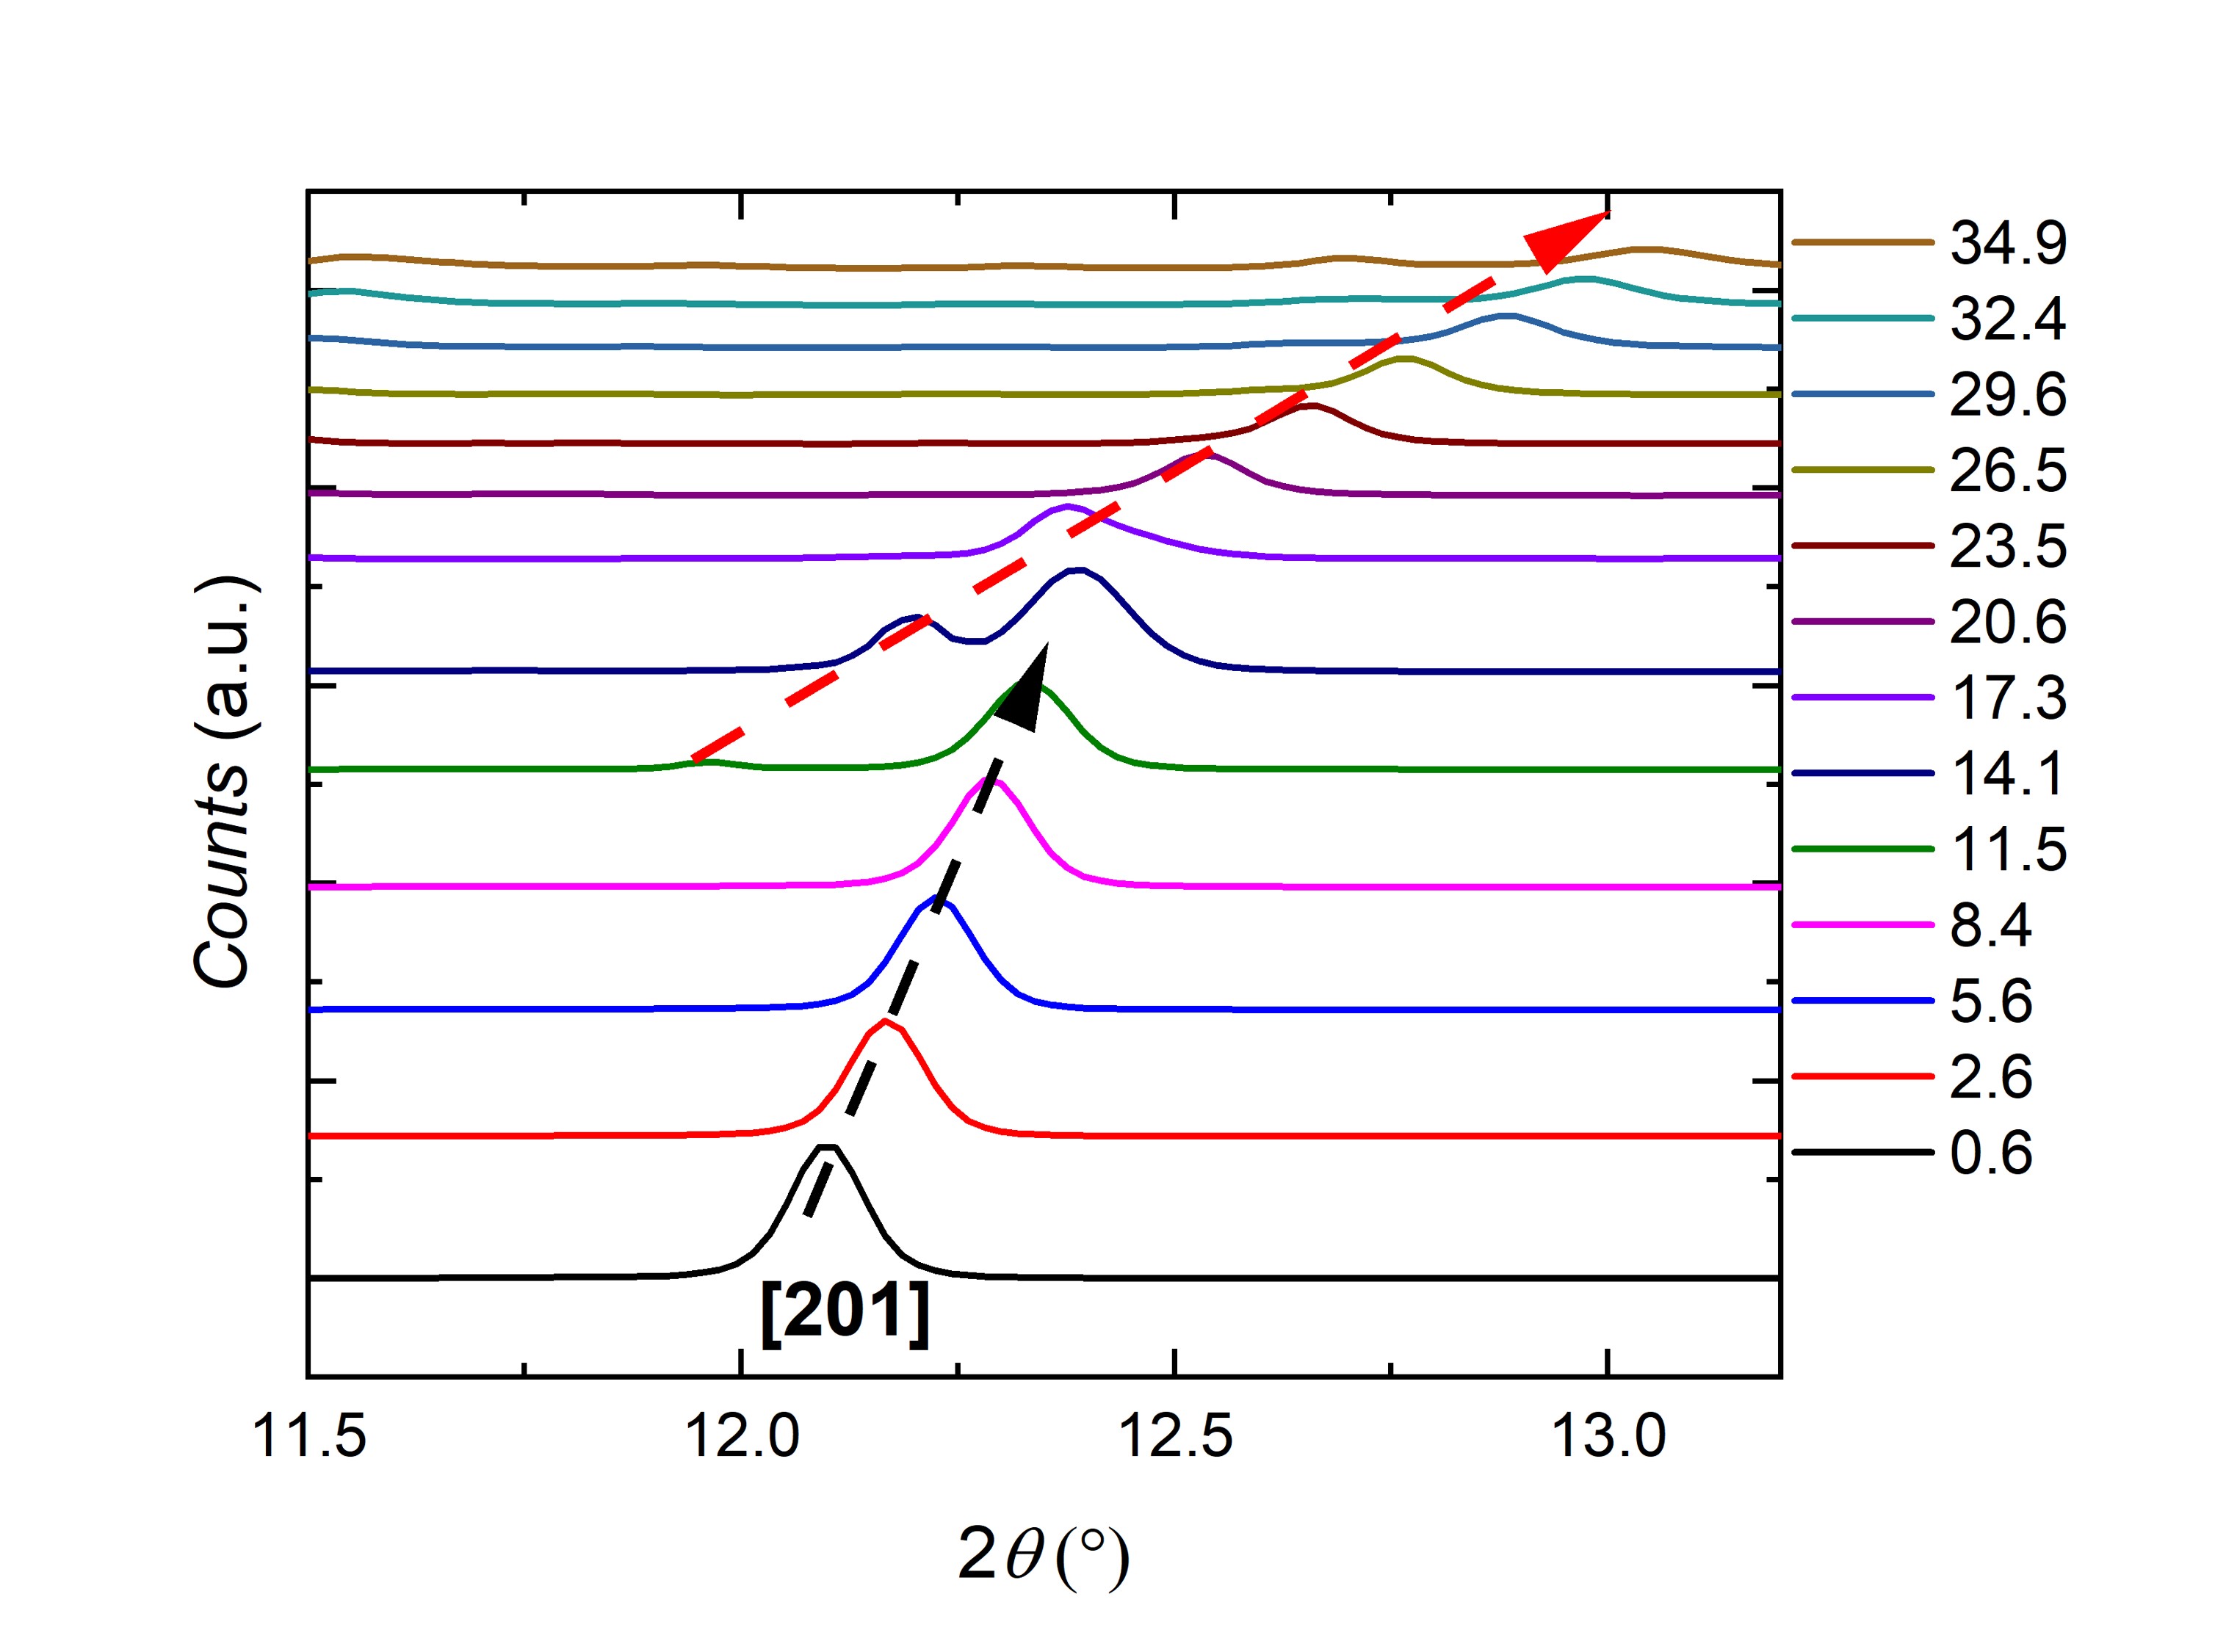
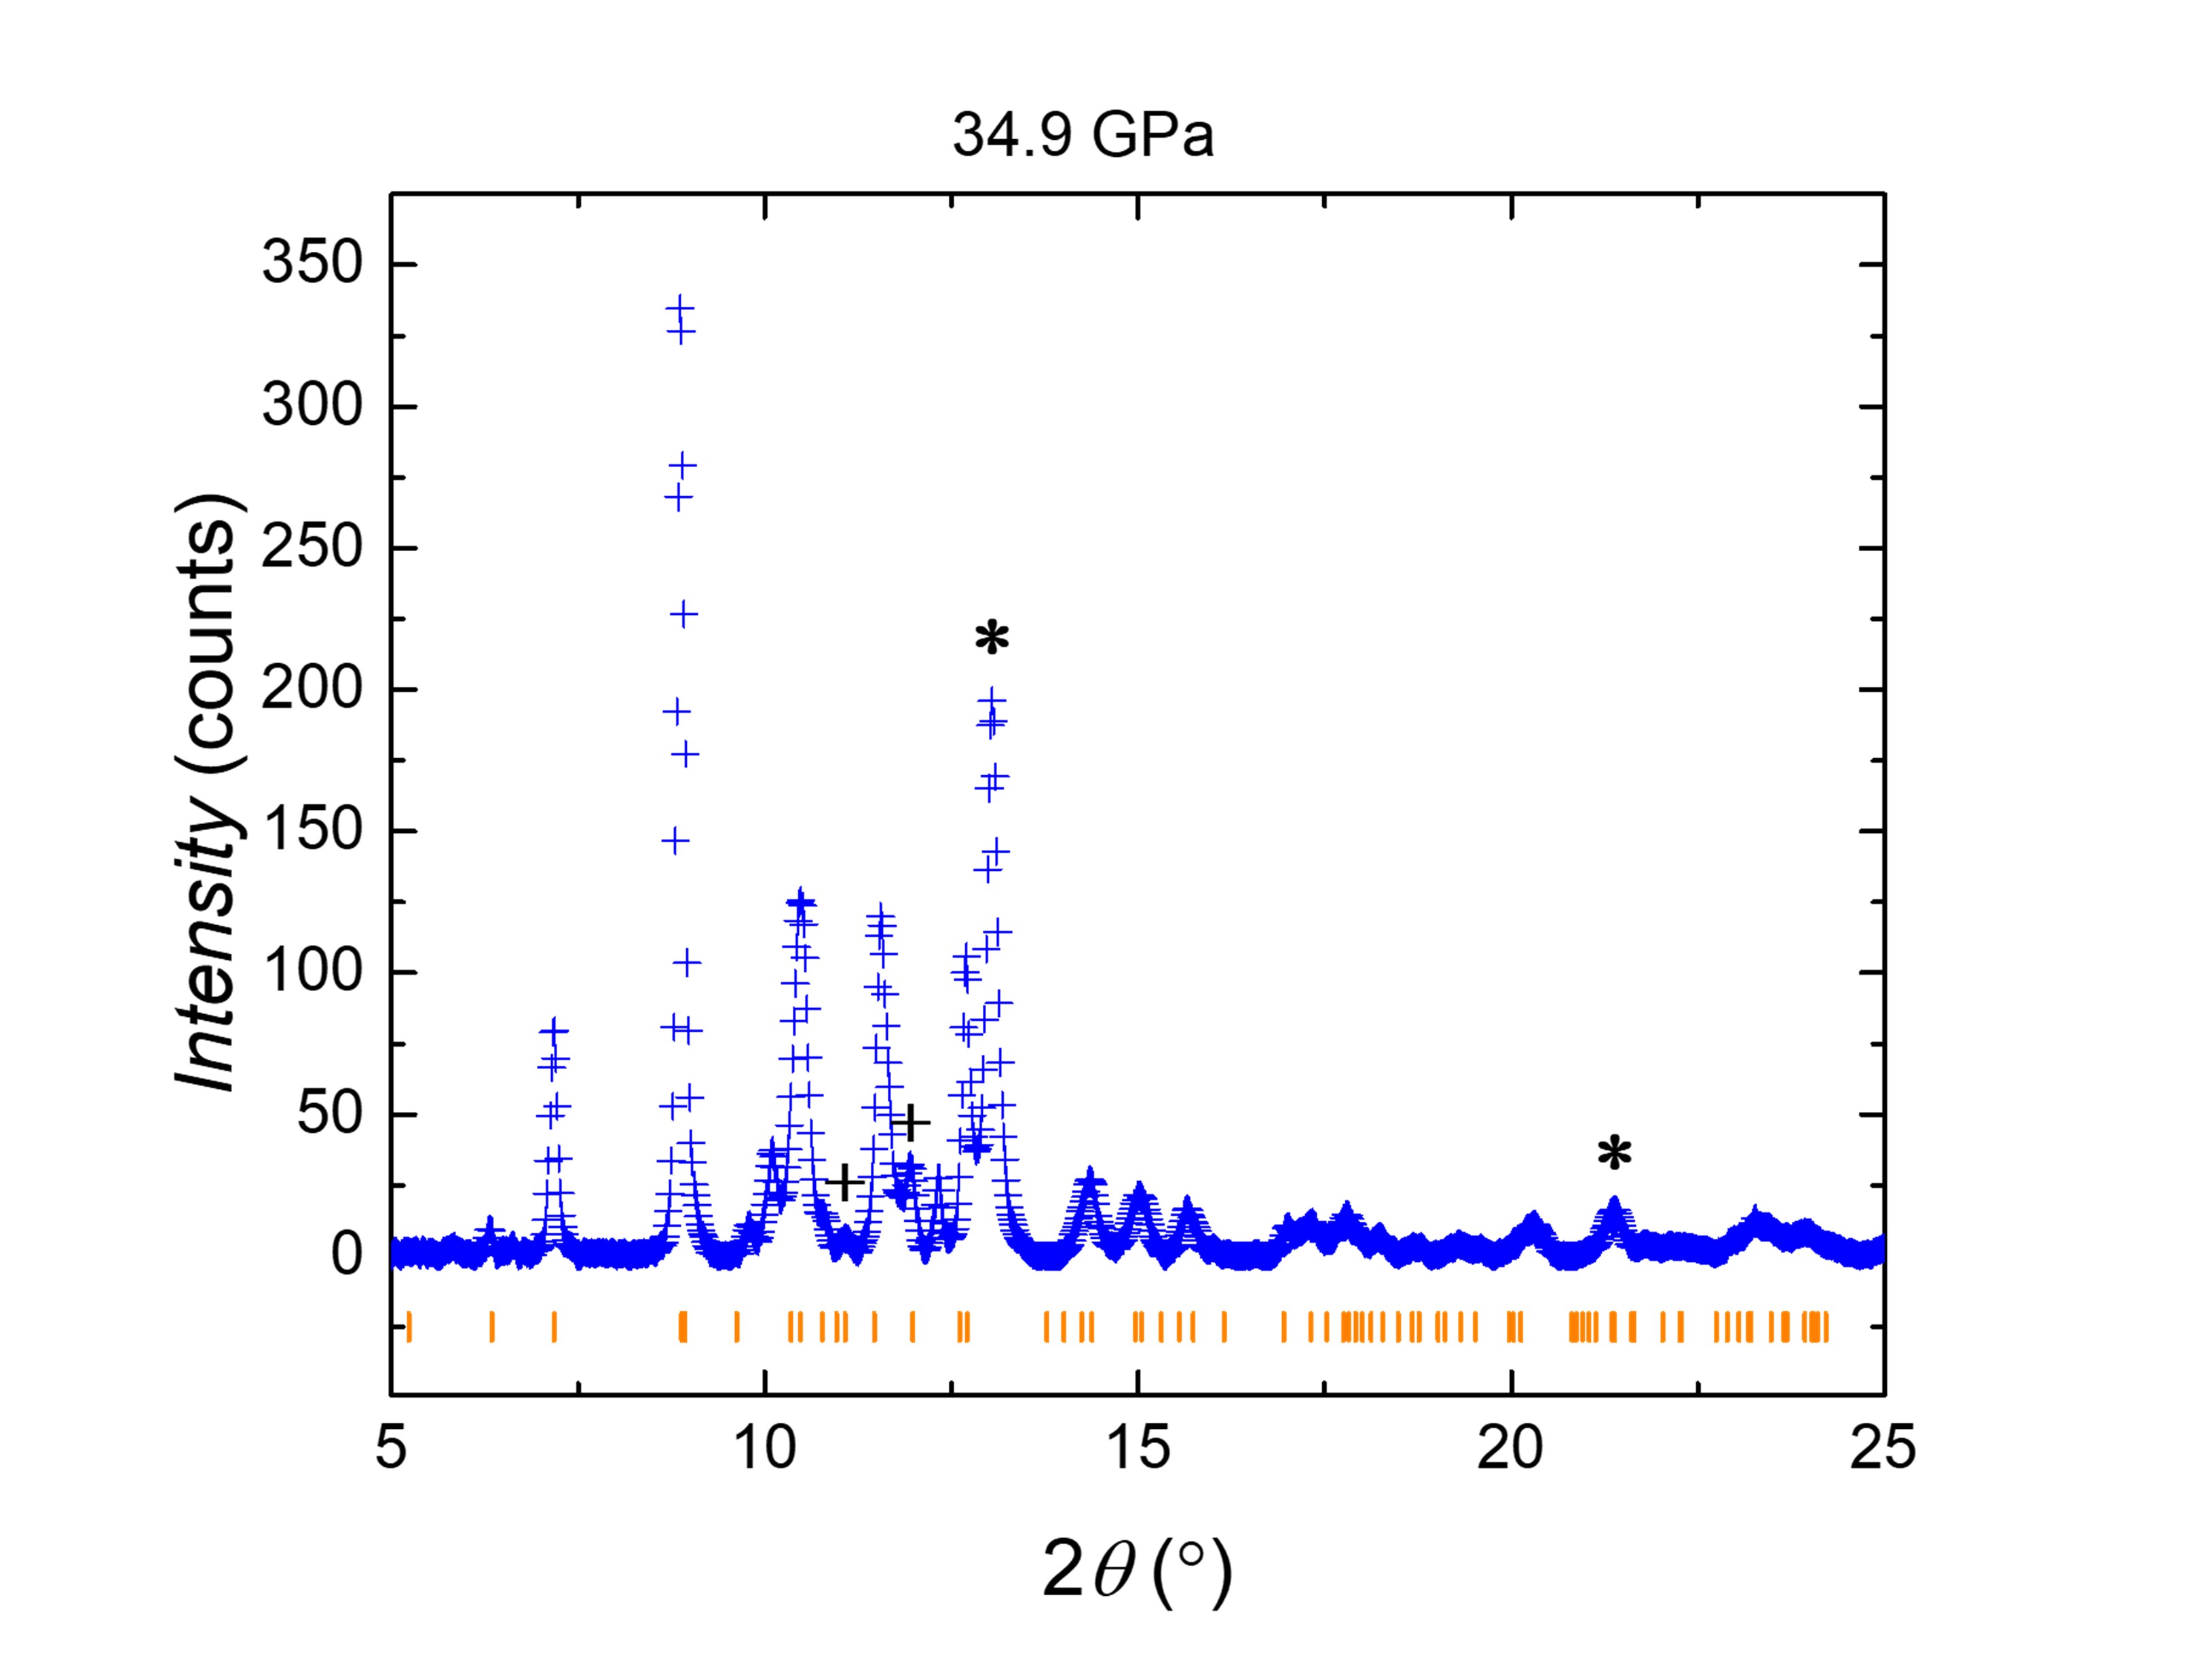
FIG.9 shows room-temperature diffraction data collected across pressures up to 35 GPa. Whereas the hexagonal structural model perfectly describes the data up to 14 GPa, we noted that: (i) A sudden reduction in the intensities of specific peaks starting at 14 GPa, such as [201], [302], and [401], suggests either a subtle distortion within the hexagonal phase leading to a loss of long-range ordering or a preferred orientation developing under pressure without a structural transition; (ii) Distinct new diffraction peaks emerge gradually with increasing pressure from 23.5 GPa, up to 34.9 GPa, as depicted in FIG.9, which suggests a second-order structural transition to a lower-symmetry phase The diffraction pattern could be assigned to an orthorhombic pace group, Pmmm, one possible solution of indexing Pmmm peaks can be found in Appendix C FIG.16; (iii) Diffraction peaks from solidified neon, marked with black stars in FIG. 9, appear at pressures above 11.5 GPa. As shown in FIG. 10, one neon peak manifests as a satellite peak near the [201] peak. With increasing pressure, the [201] peak diminishes while the neon peak becomes dominant and shifts rapidly. This behavior raises the possibility that the subtle structural changes observed in LaRu3Si2 are influenced by non-hydrostatic conditions arising from neon solidification. It should be noted that whereas neon was used as a PTM in PXRD measurements, resistance was measured using Nujol PTM, so solidification of PTM cannot be the reason for the features observed in resistance and measurements in 10 – 15 GPa pressure range. This observation potentially gives some support to interpretation of PXRD data as an indication of a subtle structural phase transition at 14 GPa.
IV Discussion and Conclusion
IV.1 Discussion
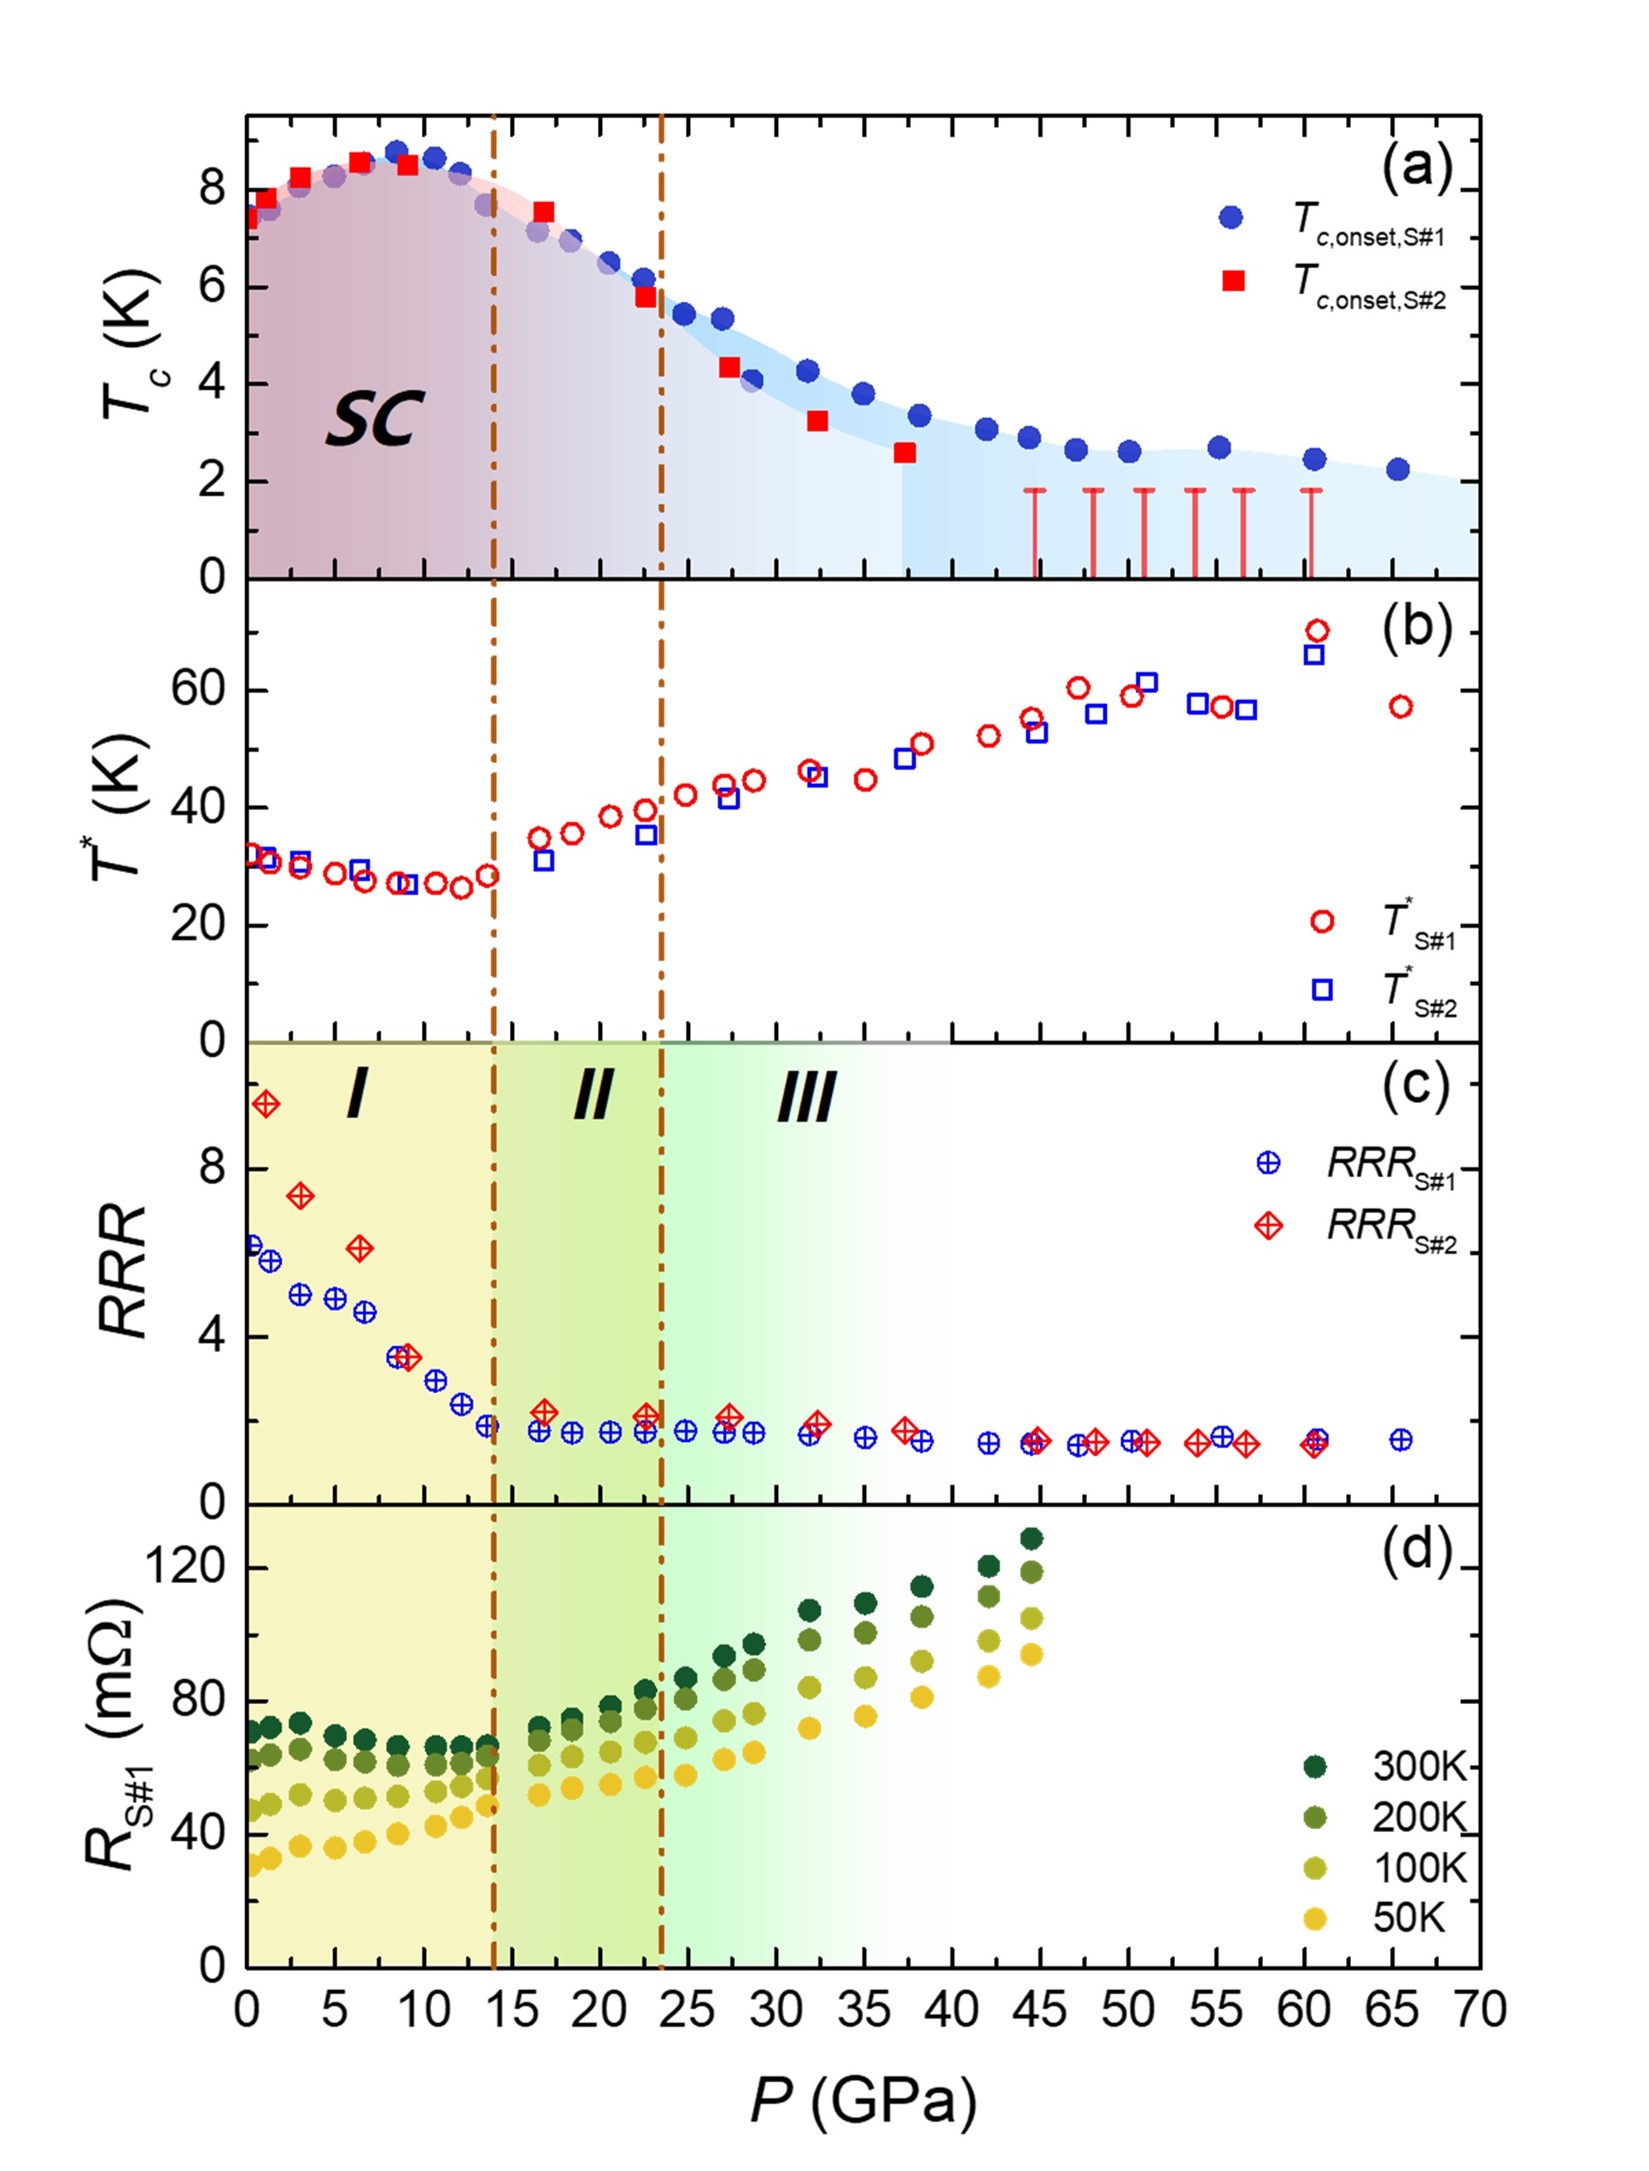
Based on high pressure transport and PXRD measurements on two LaRu3Si2 samples, we constructed a temperature pressure phase diagram in FIG. 11 (a). In addition, we plot , and isothermal in FIG. 11 (b-d) for comparison, with the shaded area denoting three possible room temperature phases. As shown in FIG. 11 (a), first increases with applying pressure, and reaches a maximum of 8.7K at 8.5 GPa. Then with further pressure, drops resulting in a superconducting dome. This dome is consistent for both sample S#1 and sample S#2 until 35 GPa, at which point of S#1 starts to reach a flat plateau, whereas for S#2, no superconducting transition was observed down to 1.8 K.
A similar superconducting dome was also reported in CeRu3Si2 [32], a mixed valent kagome superconductor with in the same structural family of LaRu3Si2. In the case of CeRu3Si2, the behavior was explained on the basis of increased hybridization reducing the pair-breaking effect of Ce ions.Such a rationalization for enhancement cannot be applied to LaRu3Si2.
The evolution of is shown in FIG. 11 (b). first manifests a slow decrease from 30 K at ambient pressure to 25 K at 10 GPa, then starts increasing to 70 K, with no sign of limitation up to 65 GPa. Though differs slightly between sample S#1 to S#2 at higher pressure, remains consistent for the whole pressure range measured.
Notably, distinct slope changes in and RRR shown in FIG. 11 (b),(c) are observed around 14 GPa, aligning closely with the onset of a subtle structural transition (14.1 17.3 GPa) at room temperature. This suggests a significant alteration in the electronic structure near the Fermi level. The progressive suppression of superconducting , above 10 - 15 GPa, may result from a reduced density of states at the Fermi surface, as indicated by the pressure-induced increase in resistance across various temperatures. Alternatively, this suppression could be linked to an evolution of specific phonon modes in this lower symmetry structure under pressure. Further Raman spectroscopy studies under pressure may provide more insights into these mechanisms.
No systematic change of , , RRR, and (300 - 50 K) is observed in correspondence with the room temperature structural transition from phase II to III near 23.5 GPa (shown in Appendix A FIG. 13 for both S#1 and S#2). It is worth noting that room temperature structure transition might affect low temperature properties at different pressure, suggesting the possibility that , , RRR, and (300 - 50 K) exhibit distinct behavior outside this pressure range.
Interestingly, another kagome superconductor family, AV3Sb5 (A = K, Rb, and Cs), exhibits two superconducting domes under pressure [33, 34]. The first dome is widely thought to be attributed to the suppression of CDW instability, whereas the origin of the second dome is still not well understood. In CsV3Sb5, the hexagonal structure remains stable under pressure, and the second dome has been associated with a Lifshitz transition [34]. In contrast, KV3Sb5 and RbV3Sb5 display structural transitions, hexagonal-to-monoclinic and hexagonal-to-monoclinic-to-orthorhombic, respectively, which are believed to underpin the second dome [35]. Our findings in this work, on the other hand, provide valuable comparative insights and contribute to a deeper understanding of the exotic superconducting pairing mechanisms in kagome systems.
IV.2 Conclusion
In conclusion, we have observed the superconducting dome of LaRu3Si2 along with two possible structural phase transitions at room temperature under pressure. Superconducting gets first enhanced to 8.7 K at 8.5 GPa and then suppressed with the further application of hydrostatic pressure. Almost the same pressure of suppression, the room temperature structure changes from original structure (P6/mmm) to a slightly distorted hexagonal structure, after which it maybe turn to a structure with lower symmetry, possibly orthorhombic, where suppression slows down.
In addition, whereas the nature of is ambiguous, the possible correlation between , superconductivity and structure demands investigations of temperature dependent X-ray diffraction and calculations of electronic structure under pressure, to get further insight to this kagome metal system.
Acknowledgements.
The authors acknowledge Juan Schmidt and Atreyee Das for useful discussions. Work at Ames National Laboratory is supported by the U.S. Department of Energy, Office of Basic Energy Science, Division of Materials Sciences and Engineering. Ames National Laboratory is operated for the U.S. Department of Energy by Iowa State University under Contract No. DE-AC02-07CH11358. E.C.T. and W.B. acknowledge the support from National Science Foundation (NSF) CAREER Award No. DMR-2045760. Portions of this work were performed at GeoSoilEnviroCARS (The University of Chicago, Sector 13), Advanced Photon Source, Argonne National Laboratory. GeoSoilEnviroCARS is supported by the National Science Foundation – Earth Sciences via SEES: Synchrotron Earth and Environmental Science (EAR –2223273). This research used resources of the Advanced Photon Source, a U.S. Department of Energy (DOE) Office of Science User Facility operated for the DOE Office of Science by Argonne National Laboratory under Contract No. DE-AC02-06CH11357.Appendix A High pressure transport measurement on sample S#1 and S#2
High pressure electrical transport measurements on sample S#1 and S#2 were performed using diamond anvil cell (DAC) with same pair of diamonds. Sample S#1 and S#2 were polished from two bulk samples in same batch, while S#2 was measured five months later than S#1. Maximum pressure reached for sample S#1 was 65.5 GPa and for sample S#2 was 60.5 GPa.
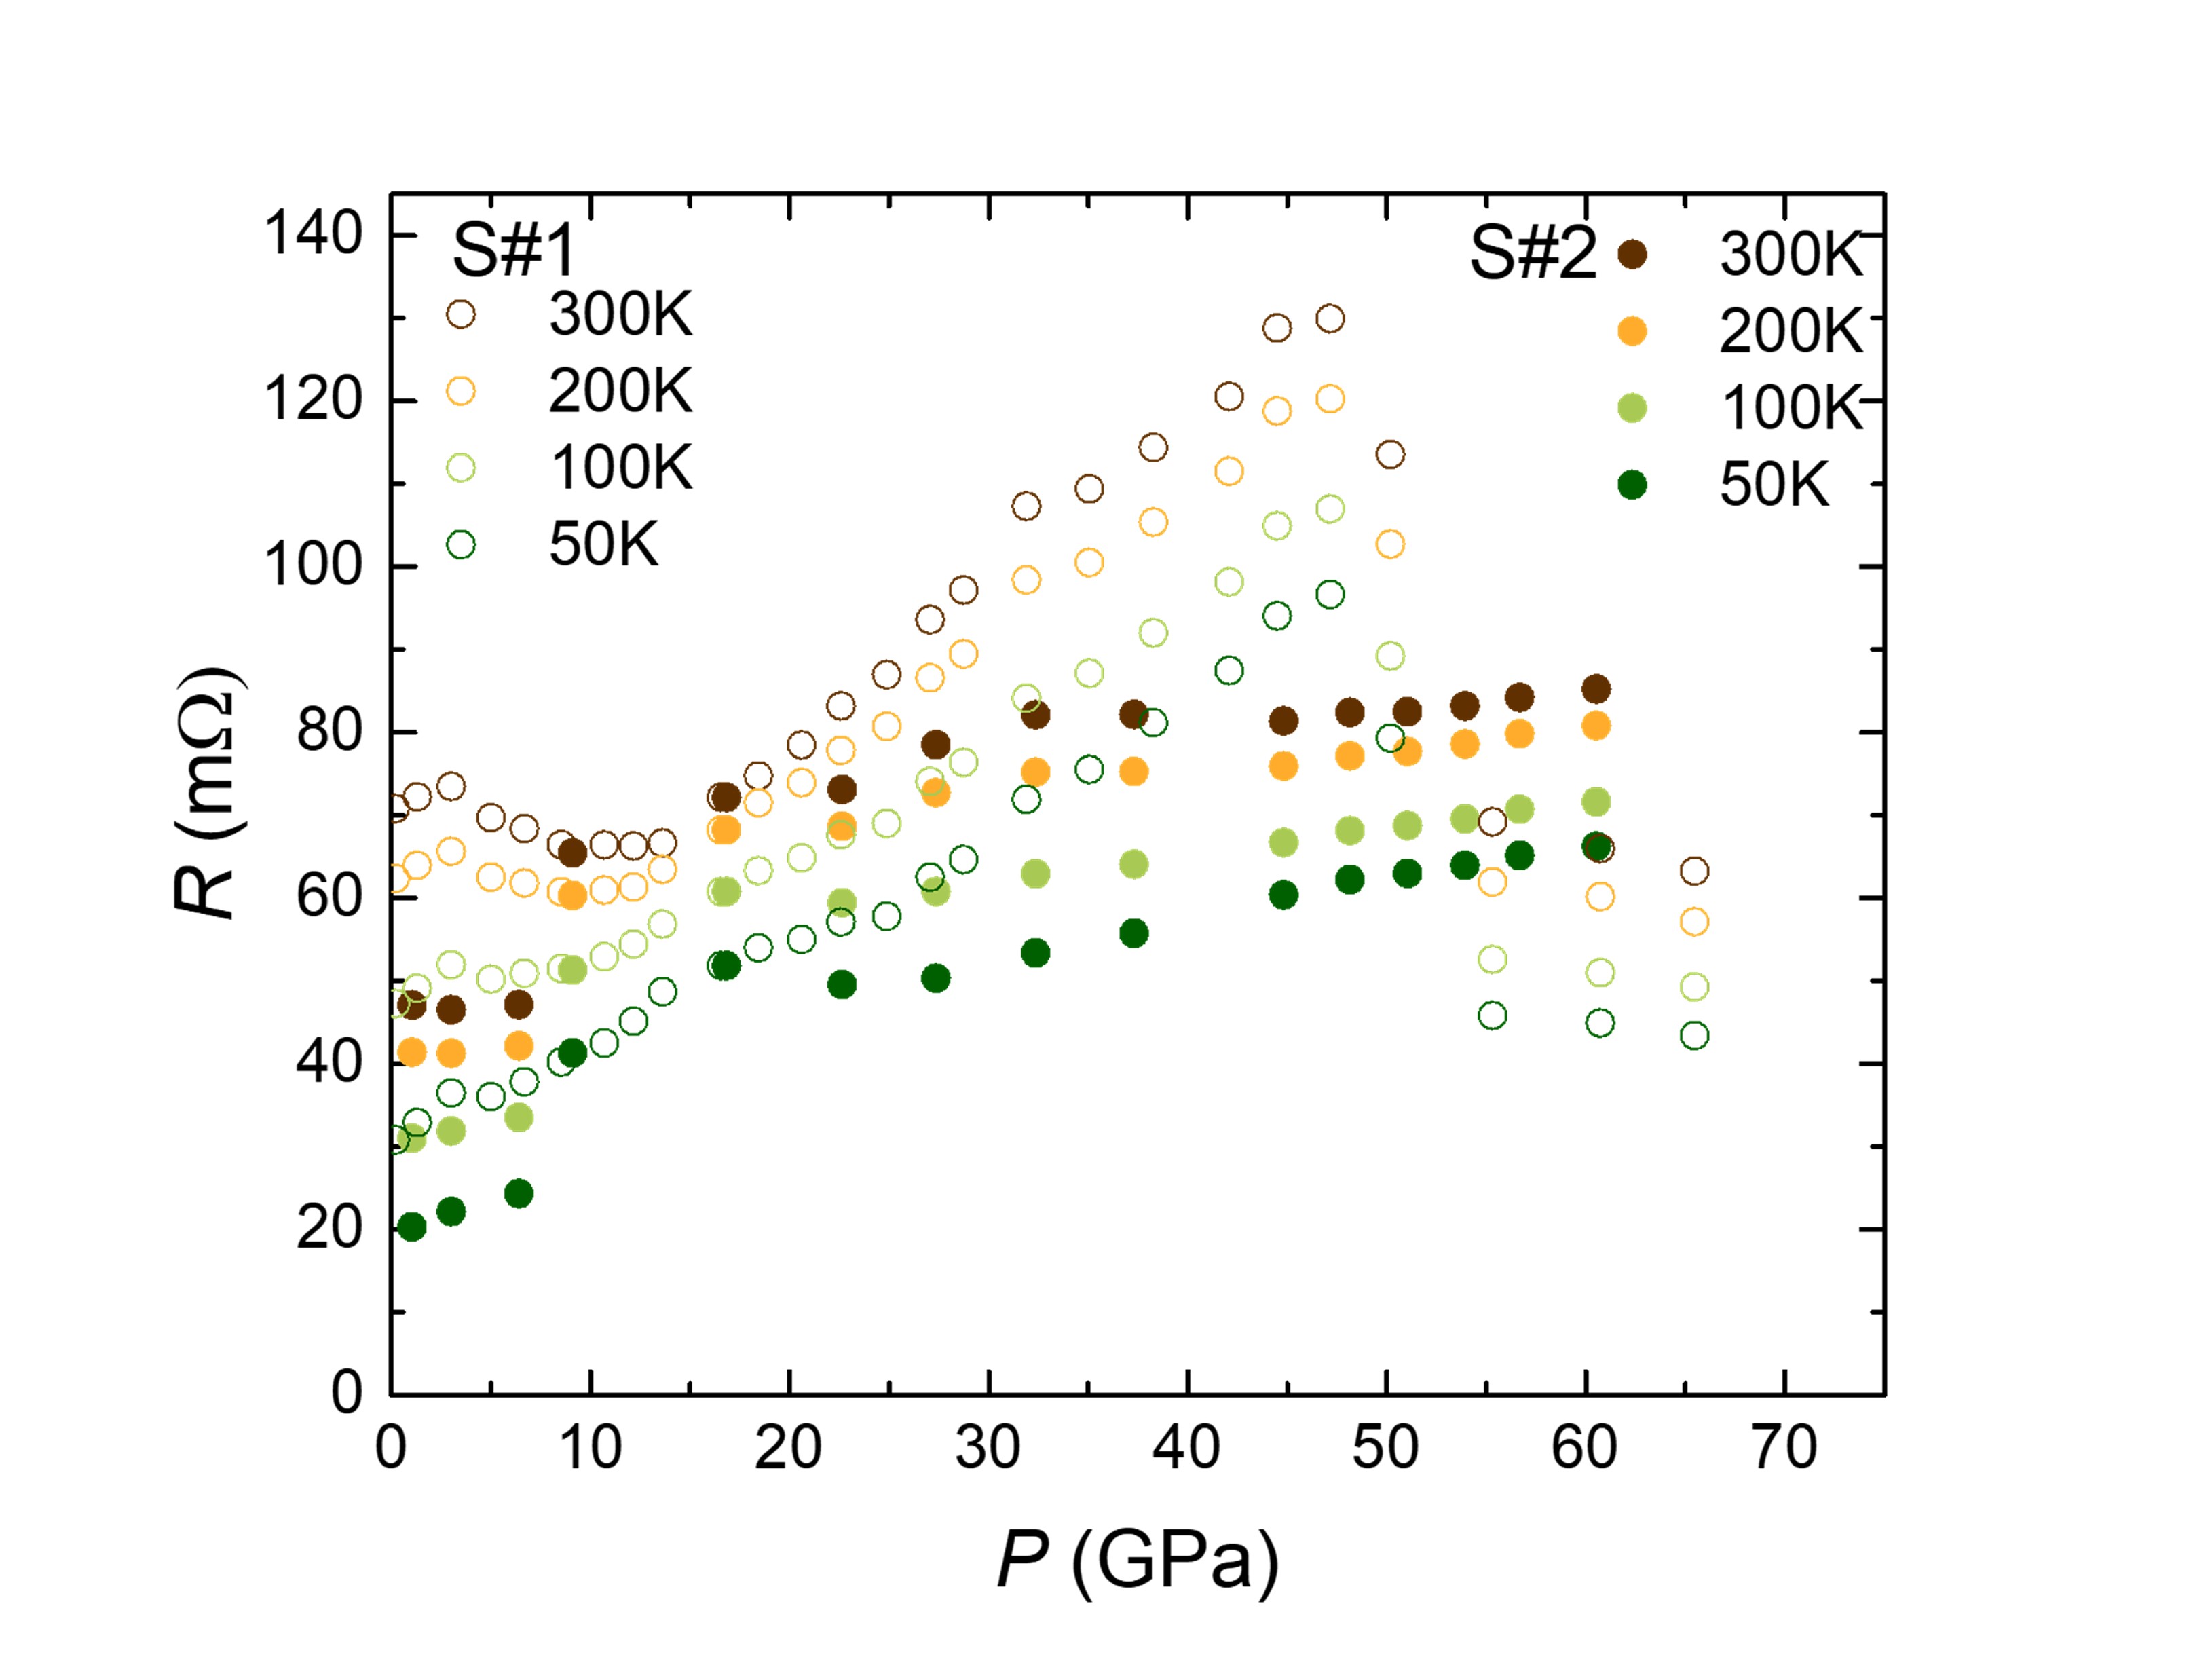
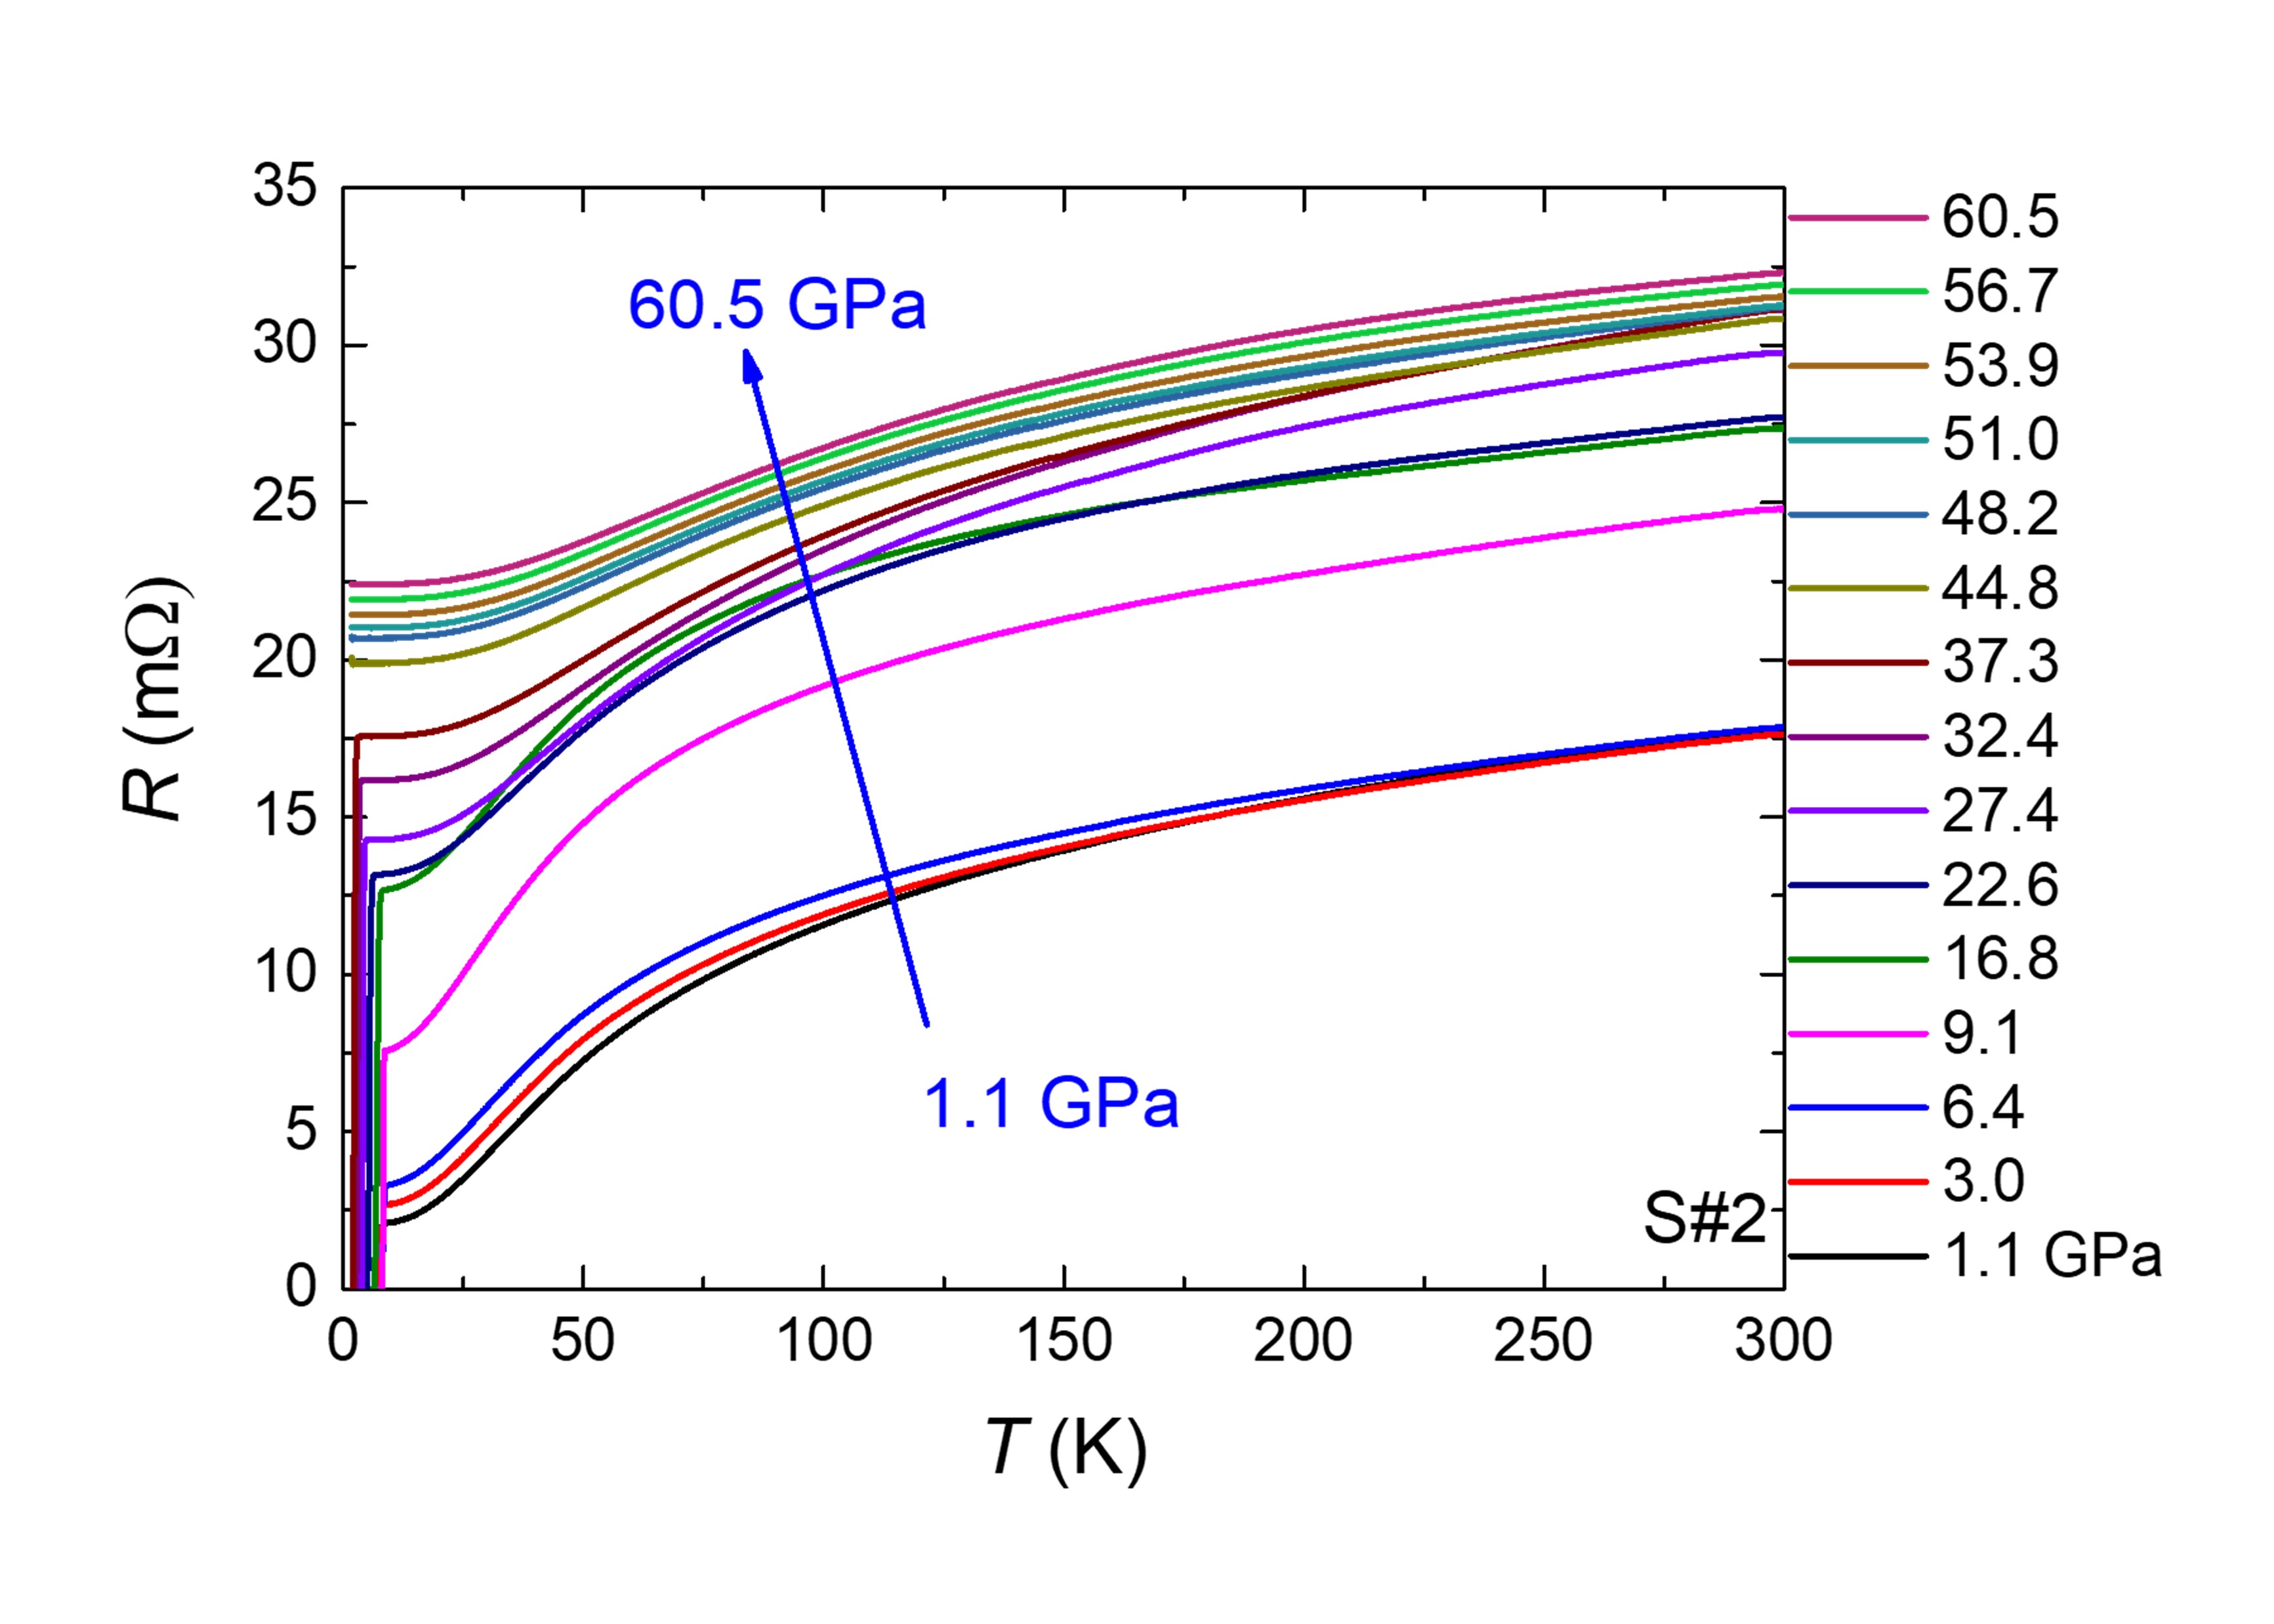
FIG. 12 shows the pressure dependence electrical resistance of sample S#2 from 0 to 300 K at various pressures. There is a jump from the overall R(T) of 6.4 GPa to 9.1 GPa, which we supposed was due to the poor sample contact that was fixed at 9.1 GPa. The sample S#2 shows a weaker pressure dependence compared to S#1, as show in FIG. 13. To compare two samples, resistance of S#2 in FIG. 13 has been normalized to that of S#1 at 17 GPa at each temperature individually. In the 10 GPa to 50 GPa region they are both following an increasing trend. However, the sudden drop of S#1 at 50 GPa was not repeated for S#2, instead S#2 keeps following an increasing trend. Although it is difficult to rule out the possible sample’s variance and inhomogeneity, such an anomaly in S#1 of sudden pressure drop is more likely due to experimental artifacts coming from electrical contacts, which has less impact on the intrinsic SC transition temperature. Thus, for S#1 at pressure 50 GPa is still taken for drawing phase diagram in FIG. 11 (a) Such variance between two samples does not affect our main conclusion.
Appendix B Linear and WHH fit for ambient and high pressure transport measurement
| (GPa) | ambient | 1.3 | 3.0 | 16.6 | 42.1 | 50.2 |
|---|---|---|---|---|---|---|
| (kOe) 111LF stands for linear fit | 71.2 | 62.2 | 69.5 | 61.5 | 29.6 | 30.6 |
| (kOe) | 45.1 | 47.0 | 50.5 | 45.9 | 19.2 | 17.4 |
| (kOe) | 130.1 | 138.2 | 148.5 | 134.1 | 55.6 | 47.6 |
| -(kOe/K) | 9.2 | 9.0 | 9.1 | 10.6 | 10.9 | 11.4 |
Werthamer–Helfand–Hohenberg (WHH) model provides a prediction of the upper critical field in typer-II superconductor, taking account the effect of both orbital and paramagnetic effects. In the dirty limit, where electron mean free path is much smaller than superconducting coherence length , follows:
| (1) | ||||
where is the normalized temperature, is the reduced magnetic field, and , Maki parameter and spin-orbit coupling parameter are fitting parameters.
Tables 1 and 2 give the summary of at various pressure for both linear fit, WHH model, -, as well as the BCS weak coupling Pauli paramagnetic limit (kOe) [31], fitted with and individually.
FIG. 14 shows the plot of fitting results of with criterion. It is worth noting that generally the dependence shows same linear feature as fitted with , deviating from WHH model. However the slope - got almost doubled at 16.6 GPa. Such significant difference remains unclear at this point, and it could arise from sample’s inhomogeneities and multi-step transition (as shown in FIG. 6 (d)).
| (GPa) | ambient | 1.3 | 3.0 | 16.6 | 42.1 | 50.2 |
|---|---|---|---|---|---|---|
| (kOe) | 46.2 | 37.7 | 46.2 | 52.5 | 17.1 | 11.8 |
| (kOe) | 23.5 | 29.1 | 33.3 | 43.3 | 12.3 | 8.1 |
| (kOe) | 119.7 | 129.9 | 136.9 | 105.8 | 42.6 | 37.2 |
| -(kOe/K) | 5.1 | 5.9 | 6.4 | 10.8 | 7.6 | 5.7 |
Appendix C Powder X-ray diffraction under high pressure refinement and indexing Pmmm peaks
Room temperature high pressure powder X-ray diffraction (PXRD) experiments were conducted using grounded sample from same batch as high pressure electrical transport. Neon was used as the pressure-transmitting medium (PTM).
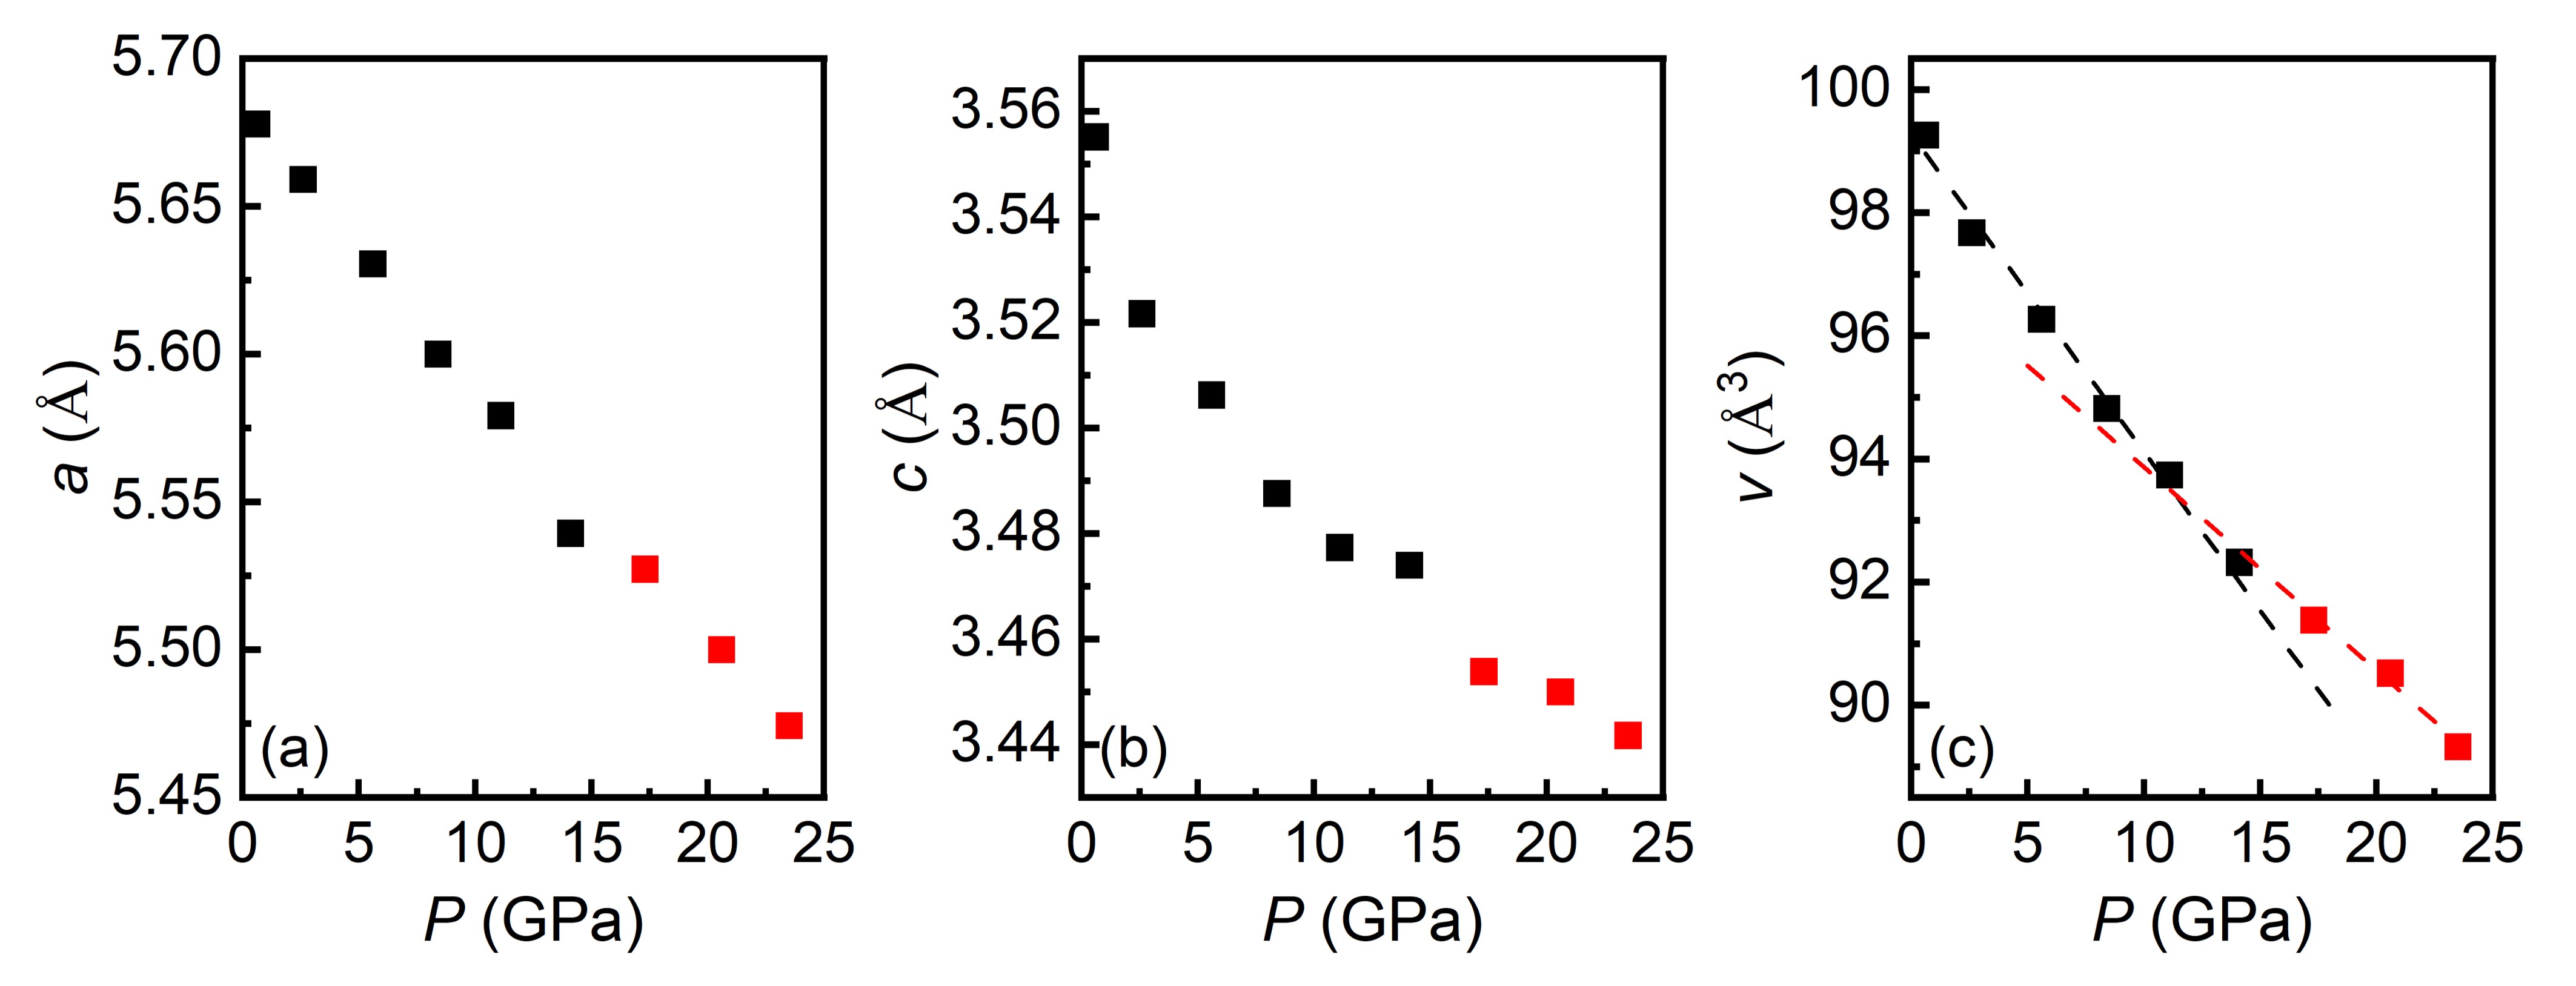
FIG. 15 (a-c) shows the pressure dependence of lattice parameter a and c, along with the unit cell volume , assuming the crystal symmetry remains unchanged up to 23.5 GPa. In FIG. 15 (a) a subtle discontinuity can be found from 14.1 GPa to 17.3 GPa for a. In FIG. 15 (b) there is a clearer jump of c at same pressure. Meanwhile the unit cell volume v shows a change of slope at the transition. These changes are observed in the pressure range where the PTM, neon, solidifies. Further work is required to sort out possible effects of non-hydrostaticity in these measurements.
References
- Barz [1980] H. Barz, New ternary superconductors with silicon, Materials Research Bulletin 15, 1489 (1980).
- Vandenberg and Barz [1980] J. Vandenberg and H. Barz, The crystal structure of a new ternary silicide in the system rare-earth-ruthenium-silicon, Materials Research Bulletin 15, 1493 (1980).
- Godart et al. [1984] C. Godart, L. Gupta, R. Parks, U. Rauschwalbe, U. Alheim, U. Gottwick, W. Lieke, and F. Steglich, Supraconductivity of TR-Ru3Si2 compounds (TR = La, Ce), Ann Chim (Paris) 9(7-8), 979 (1984).
- Godart and Gupta [1987] C. Godart and L. Gupta, Coexistence of superconductivity and spin glass freezing in La0.95Gd0.05Ru3Si2, Physics Letters A 120, 427 (1987).
- Escorne et al. [1994] M. Escorne, A. Mauger, L. C. Gupta, and C. Godart, Type-II superconductivity in a dilute magnetic system: La1-xTmxRu3Si2, Phys. Rev. B 49, 12051 (1994).
- Li et al. [2012] S. Li, J. Tao, X. Wan, X. Ding, H. Yang, and H.-H. Wen, Distinct behaviors of suppression to superconductivity in LaRu3Si2 induced by Fe and Co dopants, Phys. Rev. B 86, 024513 (2012).
- Li et al. [2016] B. Li, S. Li, and H.-H. Wen, Chemical doping effect in the LaRu3Si2 superconductor with a kagome lattice, Phys. Rev. B 94, 094523 (2016).
- Chakrabortty et al. [2023] S. Chakrabortty, R. Kumar, and N. Mohapatra, Effect of tunable spin-orbit coupling on the superconducting properties of LaRu3Si2 containing kagome-honeycomb layers, Phys. Rev. B 107, 024503 (2023).
- Abrikosov and Gor’kov [1960] A. A. Abrikosov and L. P. Gor’kov, Contribution to the theory of superconducting alloys with paramagnetic impurties, Zhur. Eksptl’. i Teoret. Fiz. 39 (1960).
- Kishimoto et al. [2004a] Y. Kishimoto, Y. Kawasaki, T. Ohno, L. C. Gupta, and G. Ghosh, La-NQR Probe of Strong-Coupling s-Wave Superconductivity in LaRu3Si2, Journal of the Physical Society of Japan 73, 190 (2004a).
- Kishimoto et al. [2004b] Y. Kishimoto, Y. Kawasaki, T. Ohno, L. C. Gupta, and G. Ghosh, 139La NQR relaxation in superconductor LaRu3Si2, Journal of Magnetism and Magnetic Materials 272-276, 507 (2004b).
- Mielke et al. [2021] C. Mielke, Y. Qin, J.-X. Yin, H. Nakamura, D. Das, K. Guo, R. Khasanov, J. Chang, Z. Q. Wang, S. Jia, S. Nakatsuji, A. Amato, H. Luetkens, G. Xu, M. Z. Hasan, and Z. Guguchia, Nodeless kagome superconductivity in LaRu3Si2, Phys. Rev. Mater. 5, 034803 (2021).
- Mielke et al. [2024] C. Mielke, D. Das, J. Spring, H. Nakamura, S. Shin, H. Liu, V. Sazgari, S. Jöhr, J. Lyu, J. N. Graham, T. Shiroka, M. Medarde, M. Z. Hasan, S. Nakatsuji, R. Khasanov, D. J. Gawryluk, H. Luetkens, and Z. Guguchia, Microscopic study of the impurity effect in the kagome superconductor Si2, Phys. Rev. B 109, 134501 (2024).
- Nunes and Smith [2020] L. H. C. M. Nunes and C. M. Smith, Flat-band superconductivity for tight-binding electrons on a square-octagon lattice, Phys. Rev. B 101, 224514 (2020).
- Rømer et al. [2022] A. T. Rømer, S. Bhattacharyya, R. Valentí, M. H. Christensen, and B. M. Andersen, Superconductivity from repulsive interactions on the kagome lattice, Phys. Rev. B 106, 174514 (2022).
- Aida et al. [2024] T. Aida, K. Matsumoto, D. Ogura, M. Ochi, and K. Kuroki, Theoretical study of spin-fluctuation-mediated superconductivity in two-dimensional hubbard models with an incipient flat band, Phys. Rev. B 110, 054516 (2024).
- Zhou et al. [2024] Y. Zhou, G. Ye, S. Luo, Y. Song, X. Lu, and H. Yuan, Kagome materials AV3Sb5 (A = K,Rb,Cs): pairing symmetry and pressure-tuning studies, Superconductor Science and Technology 37, 103001 (2024).
- Guguchia et al. [2023] Z. Guguchia, R. Khasanov, and H. Luetkens, Unconventional charge order and superconductivity in kagome-lattice systems as seen by muon-spin rotation, npj Quantum Materials 8, 41 (2023).
- Plokhikh et al. [2024] I. Plokhikh, C. Mielke III, H. Nakamura, V. Petricek, Y. Qin, V. Sazgari, J. Küspert, I. Biało, S. Shin, O. Ivashko, et al., Discovery of charge order above room-temperature in the prototypical kagome superconductor La(Ru1-x Fex)3Si2, Communications Physics 7, 182 (2024).
- Toby and Von Dreele [2013] B. H. Toby and R. B. Von Dreele, GSAS-II: the genesis of a modern open-source all purpose crystallography software package, Journal of Applied Crystallography 46, 544 (2013).
- [21] Bjscistar, http://www.bjscistar.com/page169?product _id=127.
- Dewaele et al. [2008] A. Dewaele, M. Torrent, P. Loubeyre, and M. Mezouar, Compression curves of transition metals in the Mbar range: Experiments and projector augmented-wave calculations, Phys. Rev. B 78, 104102 (2008).
- Shen et al. [2020] G. Shen, Y. Wang, A. Dewaele, C. Wu, D. E. Fratanduono, J. Eggert, S. Klotz, K. F. Dziubek, P. Loubeyre, O. V. Fat’yanov, P. D. Asimow, T. Mashimo, and R. M. M. Wentzcovitch, Toward an international practical pressure scale: A proposal for an IPPS ruby gauge (IPPS-Ruby2020), High Pressure Research 40, 299 (2020).
- Prescher and Prakapenka [2015] C. Prescher and V. B. Prakapenka, DIOPTAS: a program for reduction of two-dimensional X-ray diffraction data and data exploration, High Pressure Research 35, 223 (2015).
- Li et al. [2011] S. Li, B. Zeng, X. Wan, J. Tao, F. Han, H. Yang, Z. Wang, and H.-H. Wen, Anomalous properties in the normal and superconducting states of LaRu3Si2, Phys. Rev. B 84, 214527 (2011).
- Gavriliuk et al. [2009] A. G. Gavriliuk, A. A. Mironovich, and V. V. Struzhkin, Miniature diamond anvil cell for broad range of high pressure measurements, Review of Scientific Instruments 80, 043906 (2009).
- III et al. [2024] C. M. III, V. Sazgari, I. Plokhikh, S. Shin, H. Nakamura, J. N. Graham, J. Küspert, I. Bialo, G. Garbarino, D. Das, M. Medarde, M. Bartkowiak, S. S. Islam, R. Khasanov, H. Luetkens, M. Z. Hasan, E. Pomjakushina, J. X. Yin, M. H. Fischer, J. Chang, T. Neupert, S. Nakatsuji, B. Wehinger, D. J. Gawryluk, and Z. Guguchia, Charge orders with distinct magnetic response in a prototypical kagome superconductor LaRu3Si2 (2024), arXiv:2402.16219 .
- Helfand and Werthamer [1964] E. Helfand and N. R. Werthamer, Temperature and purity dependence of the superconducting critical field, , Phys. Rev. Lett. 13, 686 (1964).
- Helfand and Werthamer [1966] E. Helfand and N. R. Werthamer, Temperature and purity dependence of the superconducting critical field, . II, Phys. Rev. 147, 288 (1966).
- Werthamer et al. [1966] N. R. Werthamer, E. Helfand, and P. C. Hohenberg, Temperature and Purity Dependence of the Superconducting Critical Field, . III. Electron Spin and Spin-Orbit Effects, Phys. Rev. 147, 295 (1966).
- Tinkham [2004] M. Tinkham, Introduction to superconductivity (Courier Corporation, 2004).
- Yomo et al. [1986] S. Yomo, P. Hor, R. Meng, and C. Chu, High pressure-induced anomalous behavior in the mixed-valent superconductor CeRu3Si2, Journal of Magnetism and Magnetic Materials 54-57, 477 (1986).
- Zhu et al. [2022] C. C. Zhu, X. F. Yang, W. Xia, Q. W. Yin, L. S. Wang, C. C. Zhao, D. Z. Dai, C. P. Tu, B. Q. Song, Z. C. Tao, Z. J. Tu, C. S. Gong, H. C. Lei, Y. F. Guo, and S. Y. Li, Double-dome superconductivity under pressure in the V-based kagome metals ( and K), Phys. Rev. B 105, 094507 (2022).
- Zhang et al. [2021] Z. Zhang, Z. Chen, Y. Zhou, Y. Yuan, S. Wang, J. Wang, H. Yang, C. An, L. Zhang, X. Zhu, Y. Zhou, X. Chen, J. Zhou, and Z. Yang, Pressure-induced reemergence of superconductivity in the topological kagome metal CsV3Sb5, Phys. Rev. B 103, 224513 (2021).
- Du et al. [2022] F. Du, R. Li, S. Luo, Y. Gong, Y. Li, S. Jiang, B. R. Ortiz, Y. Liu, X. Xu, S. D. Wilson, C. Cao, Y. Song, and H. Yuan, Superconductivity modulated by structural phase transitions in pressurized vanadium-based kagome metals, Phys. Rev. B 106, 024516 (2022).
- Anzellini et al. [2019] S. Anzellini, D. Errandonea, C. Cazorla, S. MacLeod, V. Monteseguro, S. Boccato, E. Bandiello, D. D. Anichtchenko, C. Popescu, and C. M. Beavers, Thermal equation of state of ruthenium characterized by resistively heated diamond anvil cell, Scientific Reports 9, 14459 (2019).