Semi-Supervised Learning for Dose Prediction in Targeted Radionuclide: A Synthetic Data Study
Abstract
Targeted Radionuclide Therapy (TRT) is a modern strategy in radiation oncology that aims to administer a potent radiation dose specifically to cancer cells using cancer-targeting radiopharmaceuticals. Accurate radiation dose estimation tailored to individual patients is crucial. Deep learning, particularly with pre-therapy imaging, holds promise for personalizing TRT doses. However, current methods require large time series of SPECT imaging, which is hardly achievable in routine clinical practice, and thus raises issues of data availability. Our objective is to develop a semi-supervised learning (SSL) solution to personalize dosimetry using pre-therapy images. The aim is to develop an approach that achieves accurate results when PET/CT images are available, but are associated with only a few post-therapy dosimetry data provided by SPECT images. In this work, we introduce an SSL method using a pseudo-label generation approach for regression tasks inspired by the FixMatch framework. The feasibility of the proposed solution was preliminarily evaluated through an in-silico study using synthetic data and Monte Carlo simulation. Experimental results for organ dose prediction yielded promising outcomes, showing that the use of pseudo-labeled data provides better accuracy compared to using only labeled data. The source code can be found at https://github.com/jizhang02/SemiDose/
Index Terms:
Targeted radionuclide therapy, personalized dosimetry, deep learning, semi-supervised learning, Monte-Carlo simulation, synthetic phantomsI Introduction
Targeted Radionuclide therapy (TRT) is a contemporary approach in radiation oncology, aiming to deliver maximal destructive radiation doses via cancer-targeting radiopharmaceuticals. Radioactive ligands targeting the prostate-specific membrane antigen (PSMA) have emerged for treating metastatic castration-resistant prostate cancer (mCRPC) [1]. Despite the early success of TRT, concerns have been raised about the risks of an inadequate trade-off between therapeutic dose and side effects. An essential requirement of TRT is optimizing the radiation dose adapted for individual patients. Therefore, absorbed doses must be estimated in advance of therapy [2]. Monte Carlo simulation is considered the gold standard for accurate dose calculation in medical physics due to its ability to model complex interactions of radiation with matter. However, its high computational cost makes it difficult to use in a clinical context. As a result, researchers are exploring alternative methods, such as machine learning [3] and deterministic algorithms including the dose point kernel [4] and the voxel S-value [5], to achieve a balance between accuracy and efficiency. Deep learning approaches may play a key role in personalizing the dose in TRT using pretherapy imaging (Ga68 or F18) [6, 7], i.e., Positron Emission Tomography (PET) imaging. However, doses are typically evaluated through a large amount of time series imaging of whole-body single-photon emission computed tomography (SPECT) scans at various time points (days) after each treatment cycle. In routine clinical practice, acquiring such extensive imaging data is hardly achievable, and only a few patients undergo post-therapy dosimetry. This data scarcity is further compounded by the relatively recent introduction of TRT as a treatment modality, resulting in limited patient data sets available to train deep learning models [8]. The situation is even more challenging for emerging therapeutic approaches such as Alpha therapy [9], where the patient cohort is exceptionally small due to its novel nature. Together, these factors pose significant challenges to develop and validate robust deep learning solutions for treatment planning and dosimetry.
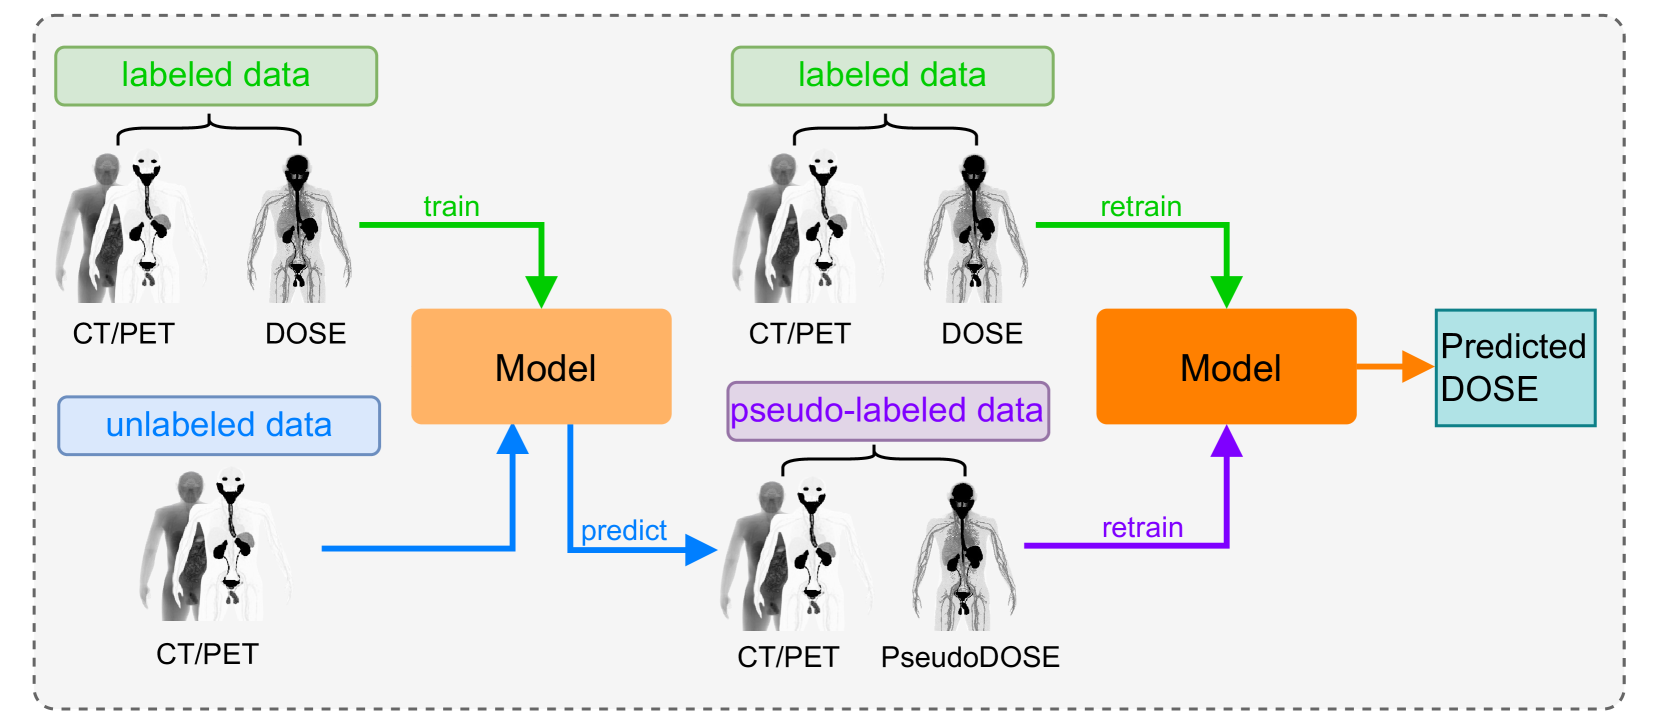
To address the challenges mentioned above, we propose using semi-supervised learning (SSL) approaches for personalized patient dosimetry using pretherapy images [10]. Our work explores and adapts various SSL methods, such as FixMatch [11], to develop robust regression models for dose prediction under these constrained conditions. The feasibility of our proposed SSL framework was preliminarily evaluated through an in-silico study using synthetic data and Monte Carlo simulation, with the complete workflow illustrated in Fig. 1. This paper presents several key contributions to the field of personalized radiotherapy dosimetry. We introduce a novel application of semi-supervised learning models to address the persistent challenge of limited annotations in the radiotherapy domain. To facilitate comprehensive testing and validation, we developed a synthetic dataset that simulates CT-PET-DOSE imaging scenarios, enabling extensive experimentation across various clinical scenarios. Furthermore, we propose an innovative adaptation of pseudo-label loss in SSL models specifically designed for individual dose prediction, extending traditional classification-based SSL approaches to handle regression problems. Our approach demonstrates the potential of SSL in maximizing the utility of limited post-therapy dosimetry data while leveraging the more abundant pre-therapy imaging data, potentially paving the way for more widespread implementation of personalized dosimetry in clinical practice.
II Related works
II-A Dose estimation via fully supervised learning
In the context of dosimetry, the labeled data refers to the scanned patients’ data as well as the corresponding dose value acquired by MC simulation. Thus, it’s a regression task in deep learning or machine learning. The first study that used artificial neural networks to estimate dose value appeared in 2011 [12]. In the next few years, various techniques for dose prediction based on deep learning began to emerge increasingly [13, 14, 15, 16]. Xue et al. [7] upgraded their method from a random forest algorithm [3] to a deep learning method on dose estimation for prostate cancer patients. In dose prediction by deep learning (DL), the most common DL model is U-Net [17] or derived from U-Net. For instance, [18] have been used a U-Net to predict internal dosimetry in nuclear medicine, [19] for intensity-modulated radiation therapy and [20] for prostate brachytherapy. Very recently, the transformer-based dose estimation method has been used by Jiao et al. [21] for rectal cancer and cervical cancer patients and Mansouri et al. [22] also use transformer model to predict dose for Lu177 radiopharmaceutical therapy, they show the superiority and generalizability of their methods. Generative models are becomming populuar in dose preiction, like generative adversarial network (GAN) [23] and diffusion model [24]. A GAN-based framework was developed for fully automated dose prediction in 3D CT images for prostate cancer [25]. In the study of [26] for breast cancer and nasopharyngeal cancer and study of [27] for thoracic tumor patients, they use diffusion models to predict the dose distribution, in which they define dose prediction as a sequence of denoising steps. Another study [28] demonstrates the advantages of a multi-task deep learning framework for predicting dose distributions across different image modalities compared to single-task models. Although fully supervised deep learning methods bring accuracy and efficiency to dose estimation tasks, they can also lead to overfitting problems if the amount of data in the training process does not match the complexity of the model.
II-B Semi-supervised learning
Semi-supervised learning (SSL) can be divided into the following three categories: consistency regularization, pseudo-label, and hybrid models. The consistency regularization method involves introducing varying degrees of disturbance to the data points while ensuring that the model’s output remains unchanged. This regularization technique aims to discover the low-dimensional representation on which the dataset is situated by leveraging unlabeled data [10]. One common structure is the Teacher-Student structure [29, 30, 31]. The student’s learning from labeled data ensures it captures the fundamental patterns and relationships inherent in the labeled samples. Simultaneously, the teacher’s guidance from pseudo-labels facilitates the model’s generalization to unseen data, mitigating overfitting and enhancing overall performance. Nevertheless, consistency regularization methods also suffer from some drawbacks, including the need to adjust hyperparameters and confirmation bias.
The Pseudo-label method is a semi-supervised learning method based on high-confidence pseudo-labeling, which improves the performance of the model by adding unlabeled data to the labeled dataset [32, 33, 34]. Despite the advantages of pseudo-label methods, they also have some drawbacks. One of them is that the pseudo-labels may contain noise, which can lead to performance degradation of the model. Another drawback is that pseudo-label methods may be affected by the distribution of the labeled data. Therefore, it is important to carefully select the unlabeled data when using pseudo-label methods.
Hybrid models effectively address the limitations of both consistency regularization and pseudo-labeling by capitalizing on their respective strengths. Consistency regularization promotes the acquisition of generalizable features, while pseudo-labeling enables the utilization of unlabeled data. This synergistic combination empowers hybrid models to achieve superior performance across a broader spectrum of tasks, for instance with the convolutional networks based FixMatch [11] and attention-based hybrid model [35].
III SynPhantom dataset
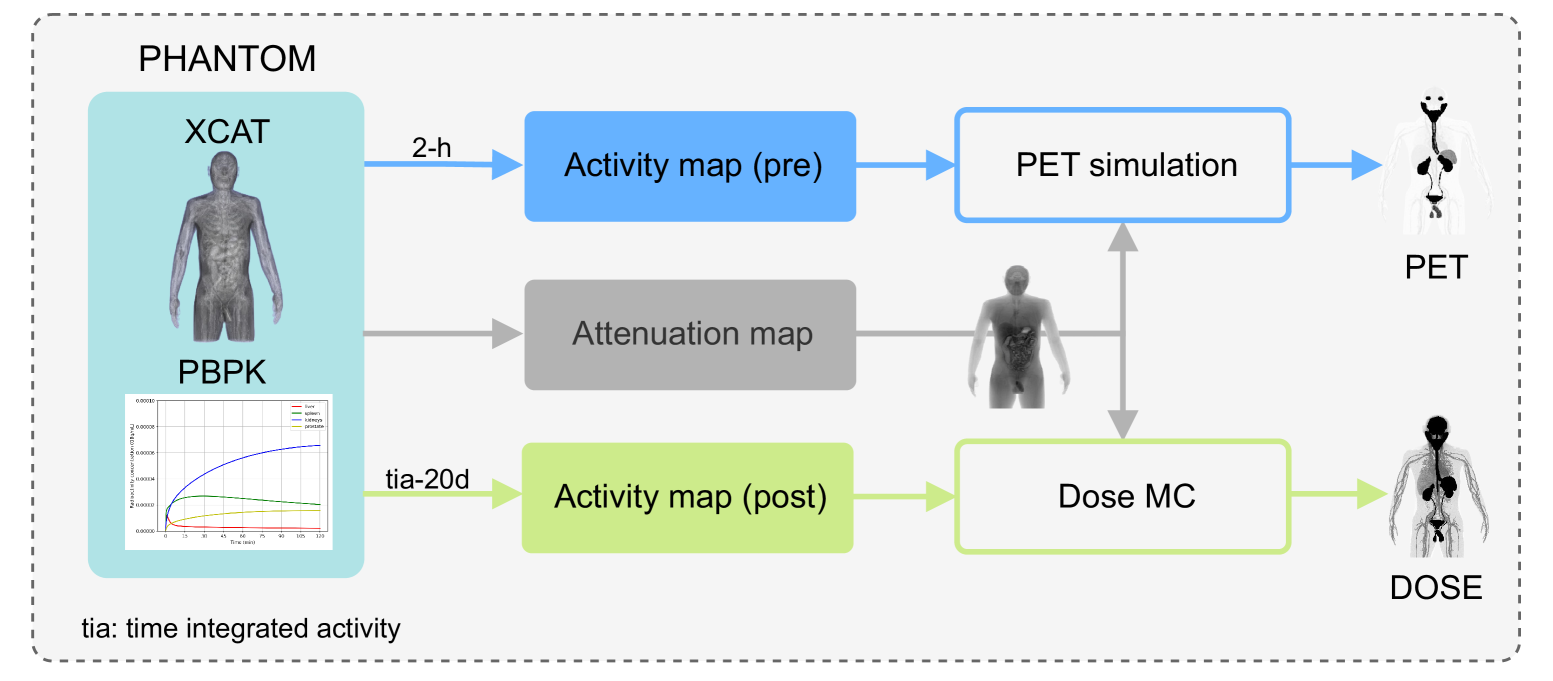
High-quality PET and dosimetry datasets are scarce, which limits deep learning applications in radiation therapy. To address this, we propose SynPhantom, a synthetic dataset specifically designed for PET imaging and dose prediction in targeted radionuclide therapy for prostate cancer. Our dataset includes pre-therapy PET imaging with Ga68-labeled tracers and dosimetry data for Lu177-based therapy. Our simulation workflow integrates anatomical phantoms, physiologically based pharmacokinetic (PBPK) modeling, Monte Carlo simulations, and PET reconstruction to generate realistic imaging and dosimetry data. The data generation pipeline is illustrated in Fig. 2.
III-A Phantoms generation
The XCAT phantom [36] was used to generate synthetic data. The morphology of the phantom was randomly sampled to encompass various patient sizes and weights. Each XCAT sample was voxelized, where each voxel was assigned a specific tissue type. The anatomical images provided by XCAT are actual color images, offering better tissue contrast, especially for organs with similar attenuation characteristics such as the heart and liver [36]. Based on the voxelized phantom, we assigned tissue-specific attenuation coefficients following reference values from the literature. These values were then mapped to a 3D matrix to create an attenuation map for each sample. The resulting attenuation maps were subsequently used in both imaging and dosimetry simulations.
III-B PBPK model
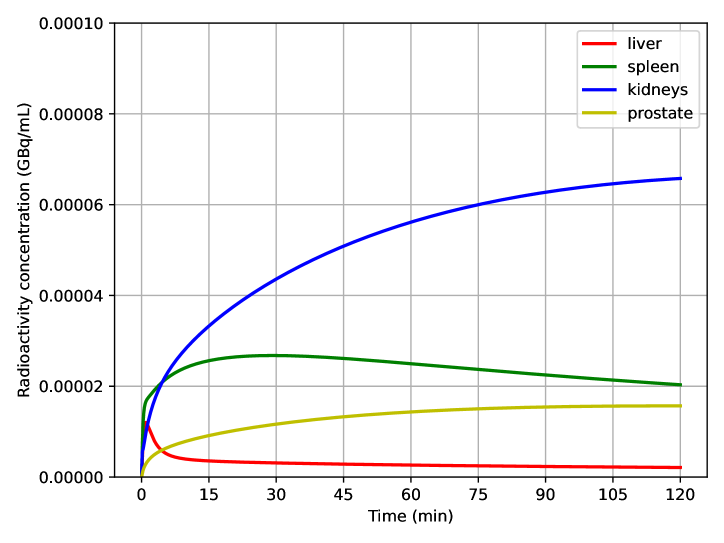
To simulate pre-therapy PET imaging with Ga68 PSMA, an activity map was generated based on the PBPK model for PSMA [37]. The PBPK model simulates the uptake, distribution, metabolism, and excretion of radiopharmaceuticals across different organs, providing time-activity curves (TACs) for each organ. Specifically, for pre-therapy imaging, the activity distribution at a 2-hour post-injection time point was extracted to construct a 3D voxel-wise activity map.
The PBPK model was initialized with organ-specific pharmacokinetic parameters derived from literature values and fitted to known biodistribution data. The injected activity for Ga68 PSMA was set to 115 ± 10 MBq, and the resulting organ-specific activity concentrations were converted into a voxelized representation using an XCAT phantom. Each organ in the phantom was assigned a specific activity level corresponding to the PBPK-predicted values at the 2-hour mark.
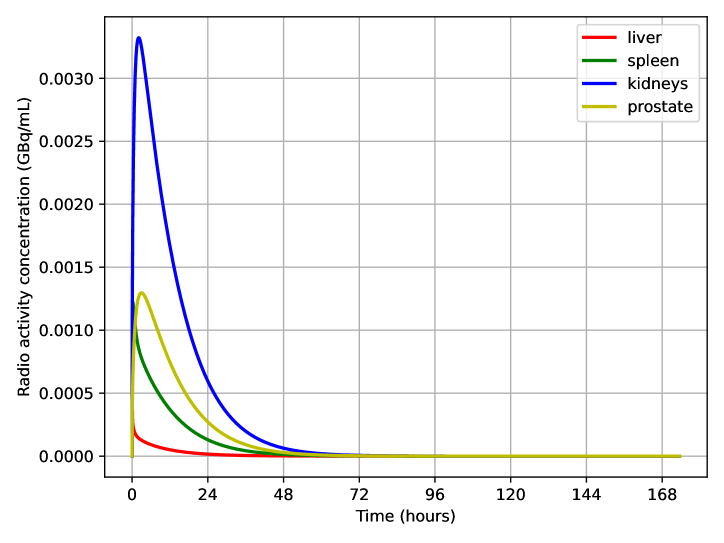
For post-therapy dosimetry estimation, a similar PBPK model was applied to predict the cumulative activity distribution over a 20-day Lu177 PSMA therapy. The model simulated time-integrated activity (TIA) by integrating the TACs over the full treatment period. The injected activity for Lu177 PSMA was set to 7400 ± 150 MBq. The calculated organ-specific TIA values were mapped onto the voxelized phantom to generate a time-integrated activity map, which was later used for dose calculation.
The organ activity curves for a representative patient are shown in Fig. 3, illustrating the dynamic uptake and clearance of PSMA ligands in different organs.
III-C PET Simulation
For efficient generation, the pre-therapy PET image was simulated and reconstructed using an iterative Maximum Likelihood Expectation Maximization (MLEM) algorithm. The process began with a forward projection step, where the 3D activity map was projected onto a sinogram by integrating voxel intensities along multiple projection angles. This simulated the PET acquisition process while accounting for spatial resolution and scanner geometry.
To correct for attenuation effects, an attenuation map was generated based on the XCAT-derived linear attenuation coefficients. The attenuation factors were incorporated into the forward projection, ensuring that the simulated sinogram accurately reflected the expected signal loss due to tissue absorption. Additionally, Poisson noise was introduced to model the statistical variations observed in PET imaging, thereby enhancing the realism of the simulated data.
The reconstruction was performed using the MLEM algorithm with 100 iterations. At each step, the expected sinogram was computed from the current estimate of the reconstructed image, followed by calculating the ratio between the measured and estimated sinogram values. A back-projection step was then applied to update the image iteratively, refining the spatial distribution of activity until convergence.
Post-processing was applied to restore the original spatial structure of the image, ensuring accurate anatomical alignment. The reconstructed images were adjusted for voxel-wise consistency, and non-body regions were masked to remove artifacts. To accelerate computation, all steps were performed on the GPU using CuPy [38] instead of NumPy, significantly improving processing efficiency.
III-D Dose map simulation
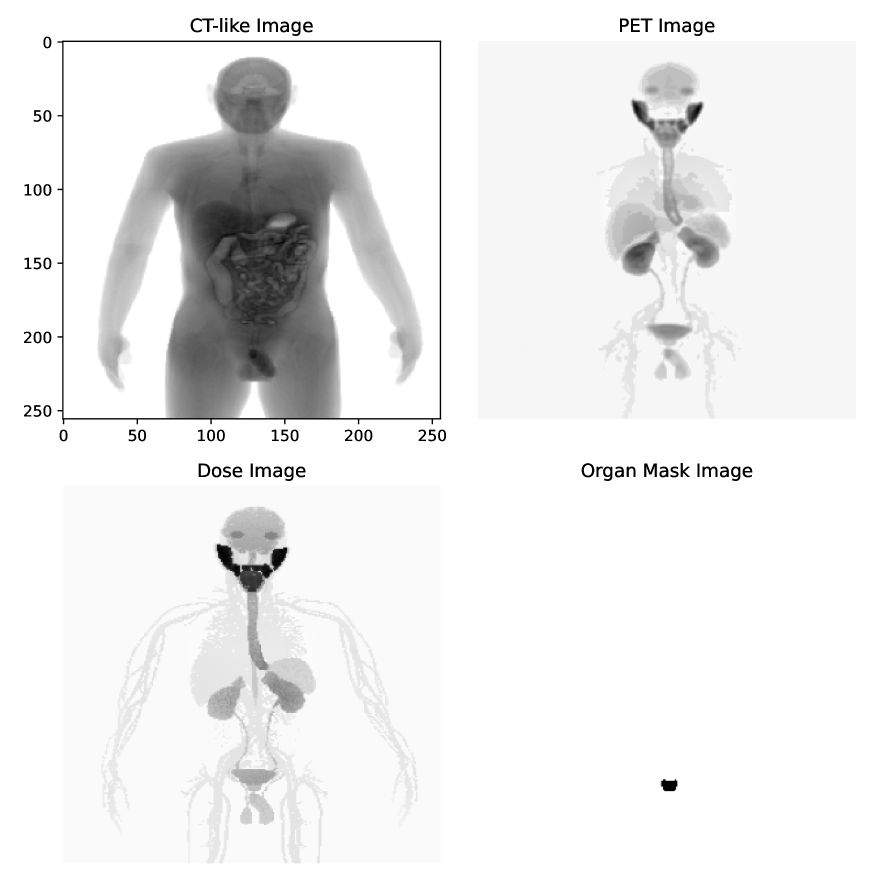
To determine the total therapeutic dose, a Monte Carlo simulation was conducted using GATE10 [39] with the TIA map incorporating Lu177. Subsequently, the total absorbed dose value for each organ was calculated with the average uncertainty 5%. We call the generated dataset as SynPhantom, the detailed information is shown as Table I. One phantom sample is shown as Fig. 4.
| Item | value |
|---|---|
| Number of phantoms | 1000 |
| Height | cm |
| Weight | Kg |
| Input PET radionuclide | Ga68 |
| Input PET dose | MBq |
| Input therapy radionuclide | Lu177 |
| Input therapy dose | MBq |
| Pharmacokinetics model | PBPK |
| Phantom size | 256 * 256 * 256 |
| Voxel size | 3 * 3 * 4.5 mm |
IV Methods
IV-A Semi-supervised learning (SSL)
When labeled data is scarce, semi-supervised learning (SSL) extends the conventional supervised learning paradigm by incorporating both supervised and unsupervised losses into the optimization process. The overall objective can be formulated as:
| (1) |
where and denote labeled and unlabeled images, respectively. The supervised loss ensures proper guidance from labeled data, while the unsupervised loss can take various forms, depending on the specific SSL strategy.
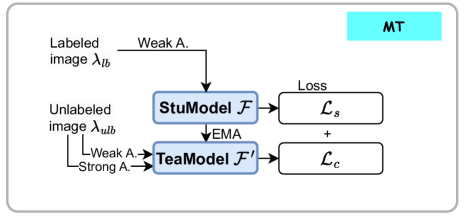
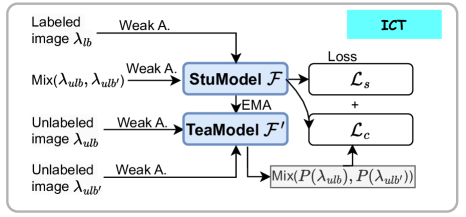
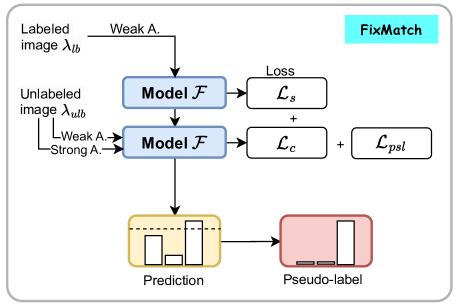
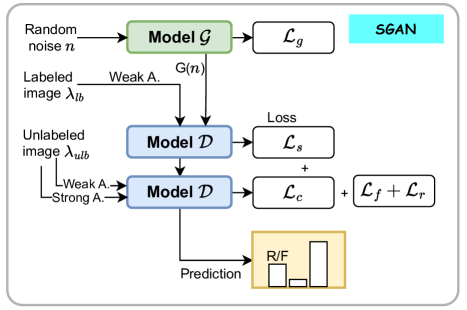
In this work, we implement several representative SSL frameworks, the training processes of these SSL models are illustrated in Fig. 5. Mean Teacher (MT) [29] and Interpolation Consistency Training (ICT) [40] rely solely on consistency loss, which enforces the model to produce similar predictions for perturbed versions of the same input, i.e., . Generative SSL models such as SGAN [41] incorporate both consistency loss and adversarial loss to distinguish real from synthetic images. FixMatch [11] further combines consistency loss with a pseudo-labeling mechanism, defining , where high-confidence predictions on weakly augmented unlabeled data are treated as labels for strongly augmented versions of the same data. While effective for classification tasks, this approach is inherently unsuitable for regression problems, as it relies on discrete label assignments rather than continuous value estimation.
IV-B Pseudo label loss (PSL) for regression
In dose prediction from PET/CT images, obtaining labeled data is often challenging. To address this, we propose a pseudo-labeling strategy tailored for regression tasks, enabling the model to leverage unlabeled data effectively. Unlike conventional pseudo-labeling approaches designed for classification, our method adapts and extends this concept to continuous-valued predictions.
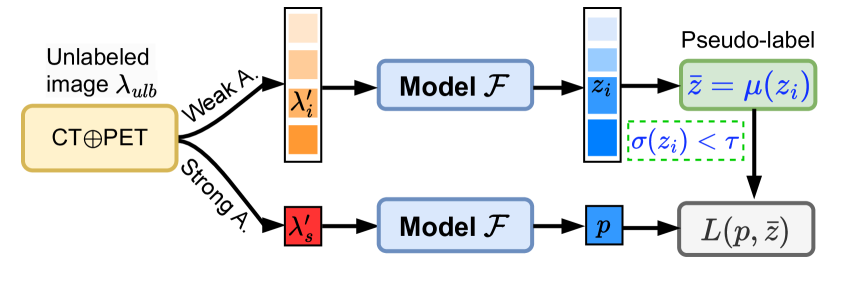
The core idea of our method is to generate pseudo-labels from unlabeled data and incorporate them into the training process (Fig. 6). Given a model with learnable parameters , we first obtain multiple predictions from weakly augmented versions of the same input . Specifically, based on empirical findings, we apply random weak augmentations 10 times to generate a set of perturbed inputs:
| (2) |
If the predicted values exhibit sufficient consistency (i.e., their standard deviation falls below a predefined threshold ), we take their mean as the pseudo-label. The model is then optimized by minimizing the discrepancy between and the prediction obtained from a strongly augmented version of the input , using a regression loss function. While we primarily use Mean Absolute Error (MAE) loss, other regression losses such as Mean Squared Error (MSE) or Huber loss can also be applied depending on the specific requirements of the task:
| (3) |
This process effectively assigns meaningful supervisory signals to previously unlabeled data, allowing them to contribute to model learning. The overall training consists of two stages: (1) an initial supervised pretraining phase using labeled data, ensuring that the model learns a reasonable mapping from input to output, and (2) a refinement phase incorporating pseudo-labels to further improve prediction accuracy. The full training pipeline is outlined in Algorithm 1. Notably, the pseudo-label generation module (grey dashed box) is designed to be model-agnostic and can be seamlessly integrated into various SSL frameworks discussed in Sec. II-B and IV-A.
Data: Labeled data: , Ground truth: ; Unlabeled data: , , (WA: Weak Augmentation, SA: Strong Augmentation)
while epoch number_epochs do
V Experiments and results
V-A Dataset preprocessing
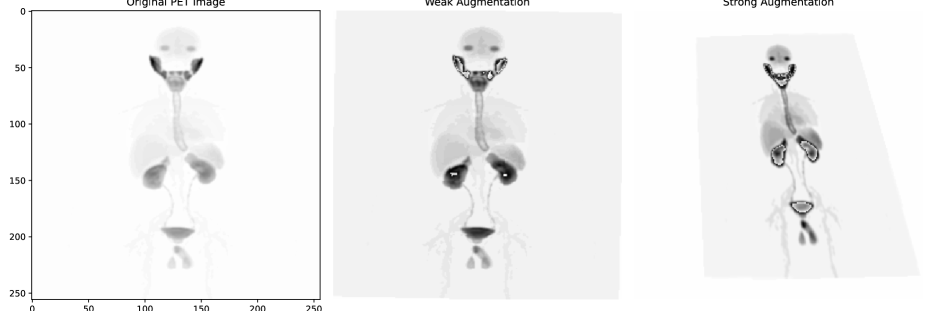
We conducted experiments using 1000 synthetic phantoms from the SynPhantom dataset with 5-fold cross-validation. The dataset was split into a training set (800 phantoms) and validation and test sets (100 phantoms each). To optimize memory usage, the network was designed for 2D image processing, where the 3D PET images were projected by summarizing intensity. The ground truth consists of organ-wise dose values stored in comma-separated values (CSV) files. Data augmentation was applied to the training set to enhance consistency regularization in the SSL framework. Each image underwent weak augmentation (horizontal flipping, random rotation of ±5°) followed by strong augmentation (horizontal flipping, random rotation of ±5°, 50% adjustment of brightness, contrast, and hue, Gaussian noise, and random perspective distortion with a scale of 0.5). Figure 7 illustrates an example of weak and strong augmentation applied to PET images.
V-B Training protocol
We used pre-trained models (trained on ImageNet [42]) from Pytorch model library (Timm, version 0.9.16) [43], respectively ResNet50 [44] and Caformer_s36 [45]. ResNet50 introduce skip connection in convolutional neural networks (CNN) to avoid gradient vanishing. Caformer combines CNN and attention mechanism (Transformer) [46] so that it can well learn local and global features from images. And then we fine-tuned them in a semi-supervised manner. The weights of the SSL models are updated through both supervised learning and unsupervised gradient updates. The pseudo-label generation process does not involve in gradient updates. The basic configuration of models training is shown as Table II. Data augmentation was applied dynamically to the training set during training. The code is implemented with PyTorch 2.2.2 [47] and runs on the cluster in our LaTIM lab.
| Models |
|
|
|
|||
|---|---|---|---|---|---|---|
| RegFixMatch (proposed) | with grad | with grad | without grad | |||
| MT [29] | with grad | without grad∗ | without grad | |||
| ICT [40] | with grad | without grad∗ | without grad | |||
| SGAN [41] | with grad | with grad | without grad | |||
| SimRegMatch [48] | with grad | N/A | without grad | |||
| Hyperparamters | ||||||
| Image shape | 256*256*3, 3 channels: CT, PET, organ mask | |||||
| Baseline | ResNet50 [44] , Caformer_s36 [45] | |||||
| Cross validation | 5-fold | |||||
| Epochs | 200 | |||||
| Optimizer | AdamW [49], weight decay=1e-4 | |||||
| Scheduler | ExponentialLR | |||||
| Learning rate | 1e-4 | |||||
| Batch size | 10 | |||||
| Unsup. & sup. loss | MAE | |||||
| Unsup. loss weight | 0.1 | |||||
| Metrics | score, MAPE, PCC | |||||
-
•
Note: ∗ use EMA technique.
V-C Evaluation Metrics
The model performance was assessed using three evaluation metrics. The Mean Absolute Percentage Error (MAPE) quantifies the relative error between the predicted dose and the Monte Carlo reference dose (Eq. 4), where is the predicted dose and is the Monte Carlo-calculated dose.
| (4) |
Coefficient of Determination ( Score) evaluates how well the model explains variance in the dose values (Eq. 5). The numerator represents the sum of squared residuals (SSR), which quantifies the discrepancy between the predicted and reference doses. The denominator represents the total sum of squares (SST), measuring deviations from the mean Monte Carlo dose . The score ranges from to 1, where a value close to 1 indicates a strong model fit, while a value close to 0 suggests weak predictive power. A negative value implies that the model performs worse than simply using the mean dose as a prediction.
| (5) |
As well as Pearson Correlation Coefficient (PCC), the PCC measures the linear correlation between predicted and Monte Carlo dose values shown in Eq. 6, where is the covariance between predicted and reference doses, and and are their standard deviations. The PCC ranges from to , where values close to 1 indicate a strong positive correlation, values near 0 suggest no correlation, and negative values imply an inverse relationship.
| (6) |
Besides, to evaluate the SSL model’s performance, we trained different amounts of labeled and unlabeled data by varying the ratio of labeled () and unlabeled () phantoms. The labeled ratio was defined as Eq. 7, where is the total number of phantoms. The labeled ratio ranged from 5% to 100%.
| (7) |
For each ratio , we evaluated the performance on the test set (100 phantoms) using the metrics above. And the models are trained in two ways: (1) fully supervised learning (FSL), where were trained; (2) semi-supervised learning (SSL) using both and . The evaluation was conducted on eight organs: the prostate (target organ), and organs at risk including the salivary glands, liver, spleen, pancreas, kidneys, bladder, and rectum.
V-D Results and discussions
Dose prediction via FSL vs. SSL
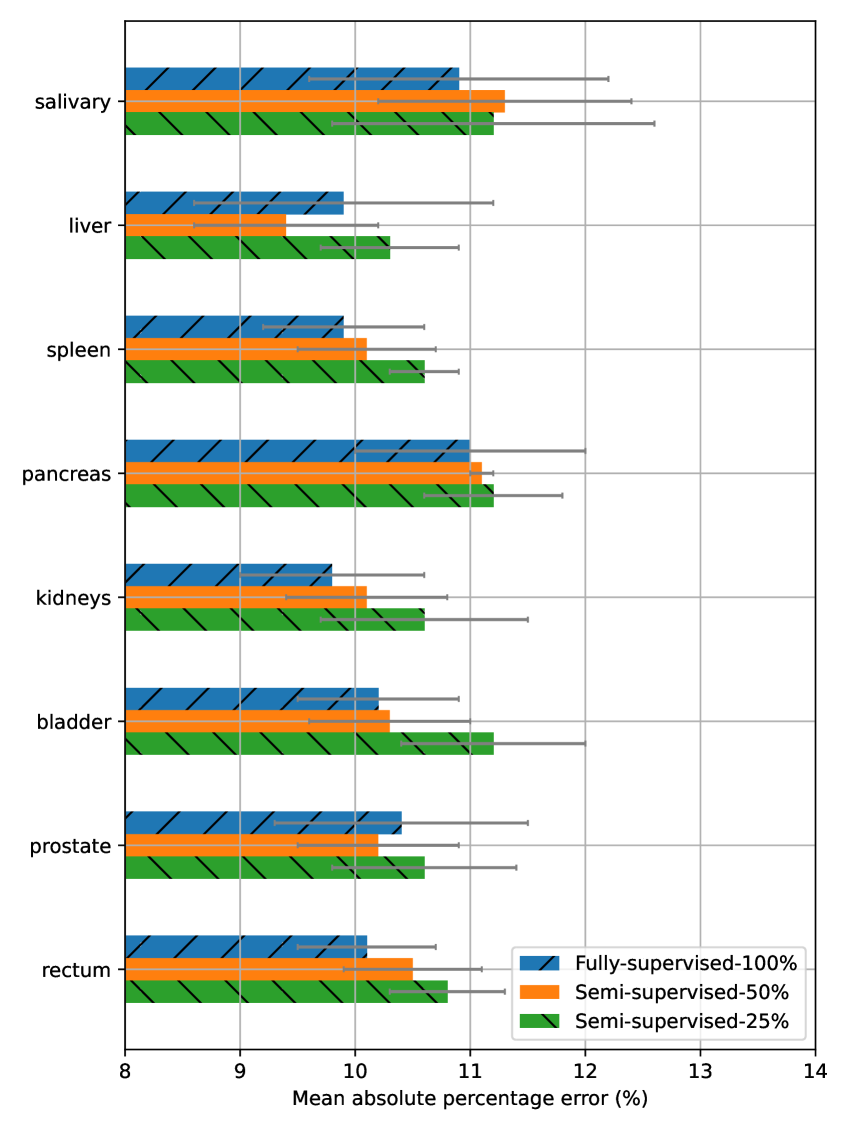
In this study, we employed deep learning methods for dose prediction and conducted a comparative analysis between fully supervised learning (FSL) and semi-supervised learning (SSL) approaches. The results demonstrate that deep learning-based dose prediction achieves relatively low mean absolute percentage error, maintaining an error rate around 10%, as shown in Fig. 8. And the proportion of labeled data has a significant impact on prediction error. As the fraction of labeled data decreases, the MAPE increases accordingly, which aligns with expectations. While the semi-supervised learning approach exhibits clear advantages. Specifically, when 50% of the data is labeled, the SSL model achieves a prediction error comparable to the FSL model trained on the entire dataset (100% labeled data), see Fig. 8. This finding suggests that SSL can maintain high predictive accuracy while requiring fewer labeled samples.
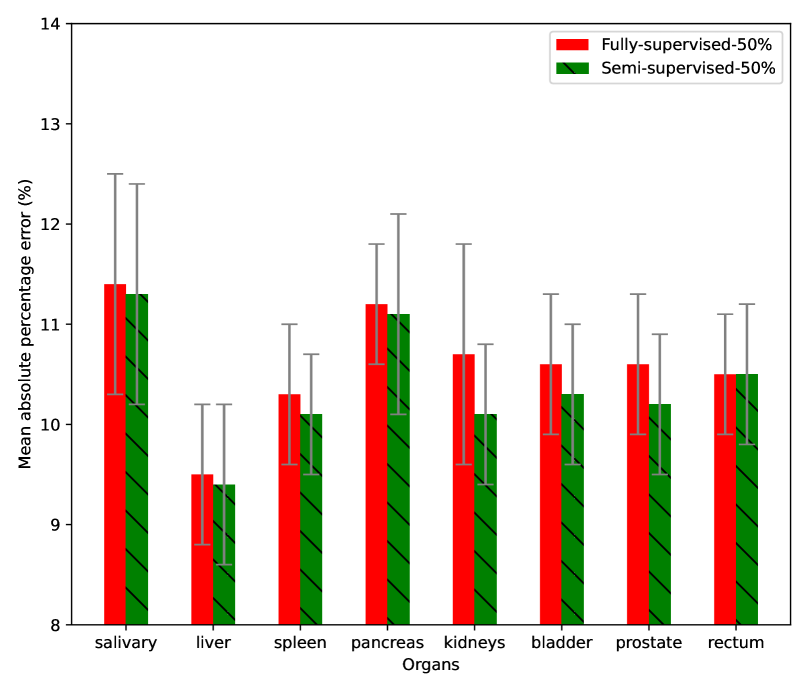
Furthermore, a direct comparison between SSL and FSL under the same proportion of labeled data (50%) reveals that SSL outperforms FSL in most organs, as shown in Fig. 9. The only exception is the rectum, where both methods yield similar errors. This advantage of SSL can be attributed to its ability to leverage additional unlabeled data, thereby enhancing generalization performance even with limited labeled samples. Consequently, semi-supervised learning demonstrates its efficacy in dose prediction tasks by reducing the dependency on extensive labeled datasets while maintaining high predictive accuracy.
SSL model’s performance with SOTA methods
| SSL methods | Labeled rate | 5% | 25% | 50% | 75% | 100% |
| score | ||||||
| MT | Supervised | |||||
| w/o PSL | - | |||||
| w/ PSL | - | |||||
| ICT | Supervised | |||||
| w/o PSL | - | |||||
| w/ PSL | - | |||||
| SGAN | Supervised | |||||
| w/o PSL | - | |||||
| w/ PSL | - | |||||
| RegFixMatch | Supervised | |||||
| w/o PSL | - | |||||
| w/ PSL | - | |||||
| MAPE | ||||||
| MT | Supervised | |||||
| w/o PSL | - | |||||
| w/ PSL | - | |||||
| ICT | Supervised | |||||
| w/o PSL | - | |||||
| w/ PSL | - | |||||
| SGAN | Supervised | |||||
| w/o PSL | - | |||||
| w/ PSL | - | |||||
| RegFixMatch | Supervised | |||||
| w/o PSL | - | |||||
| w/ PSL | - | |||||
| PCC | ||||||
| MT | Supervised | |||||
| w/o PSL | - | |||||
| w/ PSL | - | |||||
| ICT | Supervised | |||||
| w/o PSL | - | |||||
| w/ PSL | - | |||||
| SGAN | Supervised | |||||
| w/o PSL | - | |||||
| w/ PSL | - | |||||
| RegFixMatch | Supervised | |||||
| w/o PSL | - | |||||
| w/ PSL | - | |||||
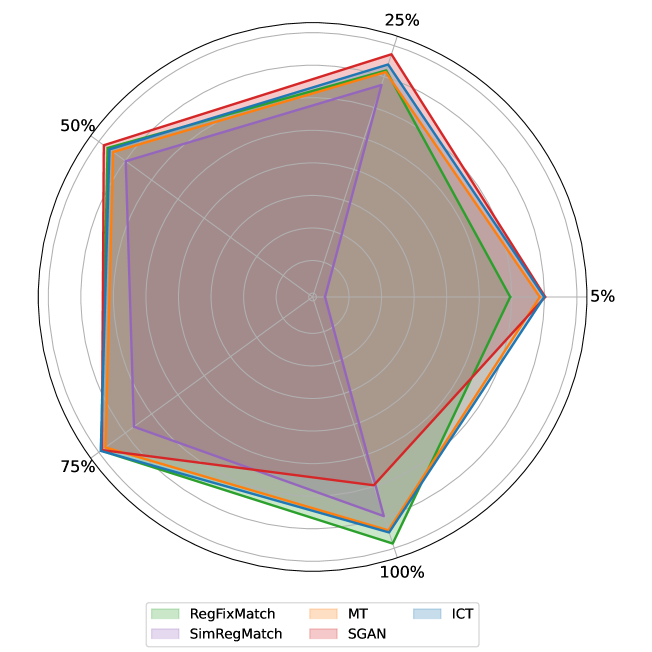
To validate the effectiveness of the proposed method, we compare it with several SSL approaches, including MeanTeacher (MT) [29], ICT [40], SGAN [41], and SimRegMatch [48]. Table III presents a comparative analysis of organ dose prediction across different SSL models and varying labeled data ratios, evaluated with and without the proposed pseudo-label loss (PSL). One can find that: SGAN with PSL consistently achieves the highest score, lowest MAPE, and strongest PCC values, demonstrating its superior efficacy in organ dose prediction. Fig. 10 further illustrates the overall performance of various SSL models across different labeled data proportions using a radar chart. Fully supervised models (100% labeled data) generally perform best, while among SSL methods, RegFixMatch exhibits the most stable improvement with increasing labeled data. ICT and SGAN remain competitive, though performance varies at extreme data ratios, whereas MT shows relatively lower consistency.
The above methods are adapted from classification to regression. To further evaluate performance, we compare our approach with SimRegMatch [48], a dedicated regression method that employs pseudo-label calibration via uncertainty analysis and feature similarity after random weight dropout [50]. However, this approach incurs significant memory overhead during training. Table IV presents a comparison of memory usage and test performance, focusing on the average score across four labeled data ratios. The results show that the proposed method not only significantly reduces memory consumption during training but also achieves a notably higher average score than SimRegMatch. This highlights its superior efficiency in resource utilization and enhanced predictive accuracy.
| Metric | SimRegMatch | Proposed RegFixMatch |
|---|---|---|
| # of parameters (MB) | 23.51 | 23.51 |
| Memory of model (MB) | 89.89 | 89.89 |
| Memory allocated (MB) | 12169.63 | 563.49 |
| Memory reserved (MB) | 25312.00 | 5550.00 |
| Average score |
Effect of PSL
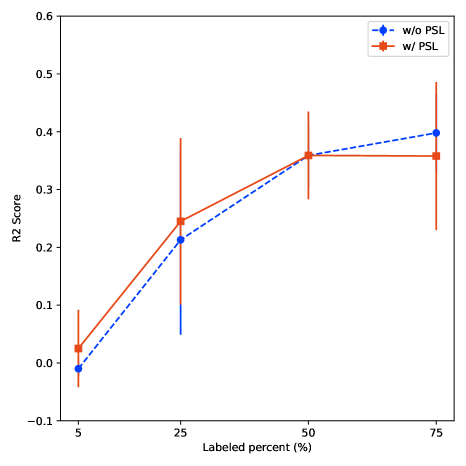
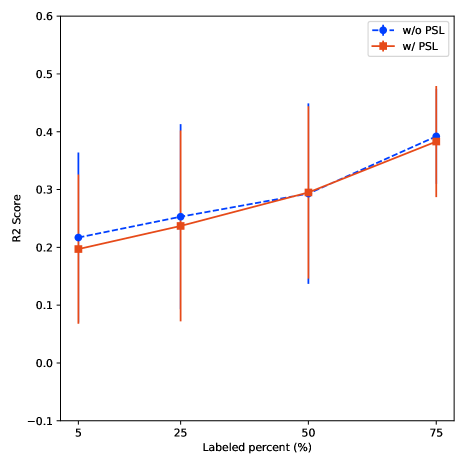
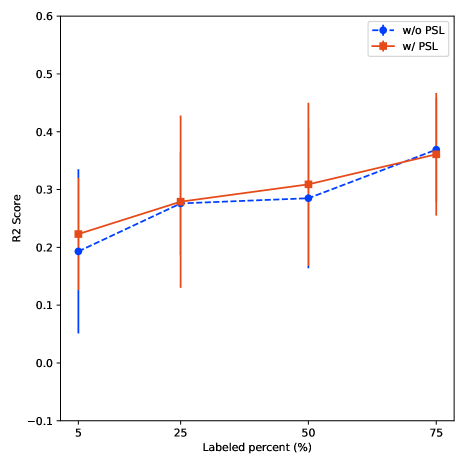
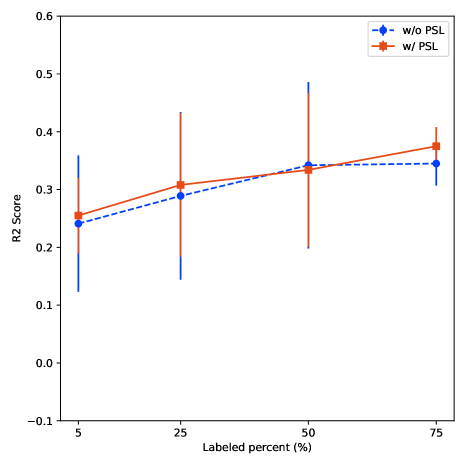
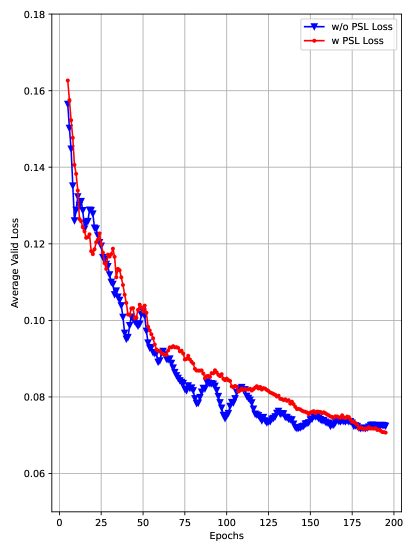
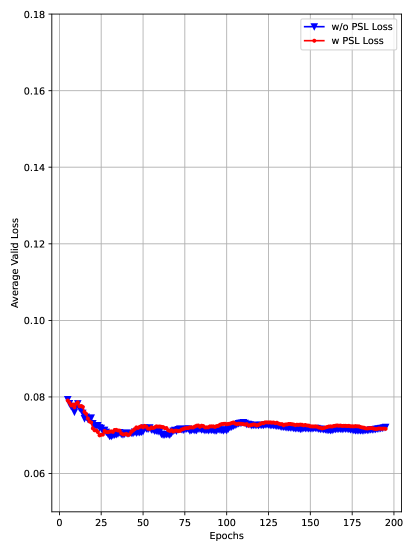
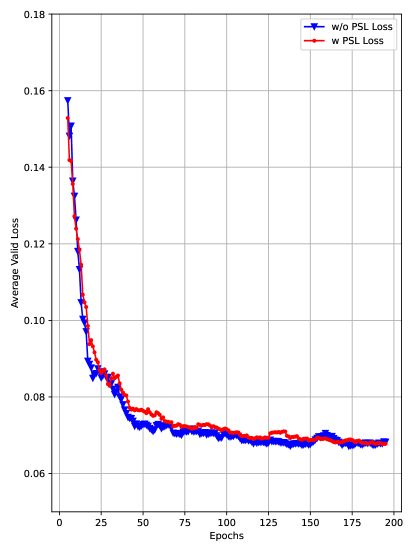
Incorporating PSL enhances all SSL models, particularly SGAN, underscoring its ability to leverage unlabeled data for refined predictions. Fig. 11 depicts the scores of different SSL models trained with and without pseudo label loss respectively. These graphs provide evidence that the proposed pseudo-label loss can effectively improve the performance of semi-supervised models. The degree of improvement varies across different labeled data rates, but the overall trend is positive. Having the pseudo-label loss, the SSL models of RegFixMatch and SGAN further converge observed from the loss curves as shown in Fig. 12.
Selection of baselines
We also compared the impact of two baselines, ResNet50 and Caformer_s36 [45], on SSL models (see Fig. 13). The results show that Caformer_s36 generally yields higher scores than ResNet50 across RegFixMatch, MT, and ICT models, with SGAN exhibiting the most significant improvement. Additionally, Caformer_s36 demonstrates lower performance variability, as indicated by smaller error bars, suggesting greater stability and reliability.
Personalized dose analysis
In this section, we investigate the impact of individual variations in organ-specific radioactive activity, as generated by the PBPK model, on dose predictions using both Monte Carlo simulations and our proposed semi-supervised deep learning model. The PBPK model is a statistical framework that relies on population-averaged physiological and biochemical parameters derived from scholarly research and surveys. While it provides reliable dose predictions at the population level, its reliance on generalized statistical data limits its accuracy in personalized dose predictions for individual patients. This limitation arises because the PBPK model does not account for the inherent variability in physiological parameters across individuals.
In contrast, our semi-supervised DL model is designed to learn complex patterns and relationships directly from the data, enabling it to capture individual-specific variations in organ dose distributions. By leveraging both labeled and unlabeled data, the SSL model can adapt to the unique characteristics of each patient, making it particularly suitable for personalized dose prediction. To evaluate the performance of the DL model in this context, we introduced controlled variations in organ-specific activity values (ranging from 98% to 102% of the original values) generated by the PBPK model. These variations simulate the natural variability in radioactive activity that may occur across individuals due to differences in physiology, metabolism, or other factors. Correspondingly, the PET and dose maps were updated to reflect these changes.
| A_PBPK | D_MC | D_DL | D_DL_ori | D_DL_var | |
|---|---|---|---|---|---|
| Organs | variation | variation | variation | MAPE | MAPE |
| Salivary | 0.9994 | 0.9970 | 0.9871 | 10.7% | 10.1% |
| Liver | 0.9994 | 0.9901 | 1.0103 | 8.5% | 8.8% |
| Spleen | 0.9996 | 0.9827 | 0.9818 | 10.1% | 10.5% |
| Pancreas | 0.9984 | 0.9954 | 0.9985 | 9.8% | 9.5% |
| Kidneys | 1.0002 | 0.9990 | 1.0218 | 10.5% | 10.9% |
| Bladder | 0.9998 | 1.0151 | 1.0054 | 11.1% | 11.1% |
| Prostate | 1.00006 | 0.9941 | 0.9916 | 9.3% | 9.4% |
| Rectum | 1.0012 | 1.0027 | 1.0174 | 11.3% | 11.5% |
As shown in Table V, the first column represents the variation in organ-specific activity values generated by the PBPK model for different phantoms in the data set. The second and third columns present the resulting variations in organ dose predictions simulated by the MC and DL methods, respectively. The data demonstrate a strong consistency between the dose variations predicted by the MC and DL models. For example, the prostate dose variation is 0.9941 for MC and 0.9916 for DL, indicating that the DL model accurately captures the dose variation patterns traditionally modeled by MC simulations. This alignment validates the reliability of the DL model in reproducing established physical principles.
Furthermore, the fourth and fifth columns in Table V show the mean absolute percentage error for the original and varied dose predictions across different organs. The results reveal that the DL model maintains stable predictive accuracy despite variations in organ doses. For instance, the liver’s original prediction error is 8.5%, and after dose variation, it is 8.8%. This minimal change in error rates underscores the robustness of the DL model, demonstrating its ability to adapt to individual-specific variations while maintaining consistent predictive performance.
VI Conclusions
In this work, we introduce an SSL method that uses pseudo-label generation for regression tasks. This approach allows us to predict personalized doses in TRT using pre-therapy PET/CT images, even when only a limited number of DOSE images are available. We conducted a comprehensive evaluation on different SSL models with different ratio of labeled data on the target organ as well as organs at risk. Besides, a synthetic phantom dataset is created based on PBPK model and Monte Carlo simulation. Experimental results of organ dose prediction on synthetic phantoms are satisfying and organs are segmentation-free thanks to the indexed distribution in phantom generated by XCAT. Moreover, the proposed method is light memory cost and efficient compared to the existing ones. We also quantitatively proved that the DL model has the potential to predict individual doses instead of the population-based PBPK model. In future work, realistic features such as tumors in the PET can be added to the phantoms. Ultimately, our goal is to establish a platform that can simulate the dose distribution of a patient-like, specific phantom but clearly and standardized, as well as accurately and rapidly, and apply this approach to real clinical data, so that is beneficial to disease diagnosis or planning the treatment.
CONFLICT OF INTEREST
The authors declare that they have no conflict of interest.
References
- [1] Wolfgang P Fendler, Svenja Reinhardt, Harun Ilhan, Andreas Delker, Guido Böning, Franz J Gildehaus, Christian Stief, Peter Bartenstein, Christian Gratzke, Sebastian Lehner, et al. Preliminary experience with dosimetry, response and patient reported outcome after 177lu-psma-617 therapy for metastatic castration-resistant prostate cancer. Oncotarget, 8(2):3581, 2017.
- [2] George Sgouros, Wesley E Bolch, Arturo Chiti, Yuni K Dewaraja, Dimitris Emfietzoglou, Robert F Hobbs, Mark Konijnenberg, Katarina Sjögreen-Gleisner, Lidia Strigari, Tzu-Chen Yen, et al. Icru report 96, dosimetry-guided radiopharmaceutical therapy. Journal of the ICRU, 21(1):1–212, 2021.
- [3] Song Xue, Andrei Gafita, Chao Dong, Yu Zhao, Giles Tetteh, Bjoern H Menze, Sibylle Ziegler, Wolfgang Weber, Ali Afshar-Oromieh, Axel Rominger, et al. Application of machine learning to pretherapeutically estimate dosimetry in men with advanced prostate cancer treated with 177lu-psma i&t therapy. European journal of nuclear medicine and molecular imaging, 49(12):4064–4072, 2022.
- [4] Hum B Giap, Daniel J Macey, John E Bayouth, and Arthur L Boyer. Validation of a dose-point kernel convolution technique for internal dosimetry. Physics in Medicine & Biology, 40(3):365, 1995.
- [5] Min Sun Lee, Joong Hyun Kim, Jin Chul Paeng, Keon Wook Kang, Jae Min Jeong, Dong Soo Lee, and Jae Sung Lee. Whole-body voxel-based personalized dosimetry: the multiple voxel s-value approach for heterogeneous media with nonuniform activity distributions. Journal of Nuclear Medicine, 59(7):1133–1139, 2018.
- [6] Song Xue, Andrei Gafita, Yu Zhao, Lorenzo Mercolli, Fangxiao Cheng, Isabel Rauscher, Calogero D’Alessandria, Robert Seifert, Ali Afshar-Oromieh, Axel Rominger, et al. Pre-therapy pet-based voxel-wise dosimetry prediction by characterizing intra-organ heterogeneity in psma-directed radiopharmaceutical theranostics. European journal of nuclear medicine and molecular imaging, pages 1–11, 2024.
- [7] Song Xue, Andrei Gafita, Ali Afshar-Oromieh, Matthias Eiber, Axel Rominger, and Kuangyu Shi. Organ-regularized deep learning for voxel-wise prediction of post-therapy dosimetry for 177lu psma therapy, 2023.
- [8] Lidia Strigari, Jazmin Schwarz, Tyler Bradshaw, Julia Brosch-Lenz, Geoffrey Currie, Georges El-Fakhri, Abhinav K Jha, Signe Mežinska, Neeta Pandit-Taskar, Emilie Roncali, et al. Computational nuclear oncology toward precision radiopharmaceutical therapies: Ethical, regulatory, and socioeconomic dimensions of theranostic digital twins. Journal of Nuclear Medicine, 2025.
- [9] Christopher Parker, Valerie Lewington, Neal Shore, Clemens Kratochwil, Moshe Levy, Ola Lindén, Walter Noordzij, Jae Park, Fred Saad, Targeted Alpha Therapy Working Group, et al. Targeted alpha therapy, an emerging class of cancer agents: a review. JAMA oncology, 4(12):1765–1772, 2018.
- [10] Xiangli Yang, Zixing Song, Irwin King, and Zenglin Xu. A survey on deep semi-supervised learning. IEEE Transactions on Knowledge and Data Engineering, 35(9):8934–8954, 2022.
- [11] Kihyuk Sohn, David Berthelot, Nicholas Carlini, Zizhao Zhang, Han Zhang, Colin A Raffel, Ekin Dogus Cubuk, Alexey Kurakin, and Chun-Liang Li. Fixmatch: Simplifying semi-supervised learning with consistency and confidence. Advances in neural information processing systems, 33:596–608, 2020.
- [12] Georgios Kalantzis, Luis A Vasquez-Quino, Travis Zalman, Guillem Pratx, and Yu Lei. Toward imrt 2d dose modeling using artificial neural networks: a feasibility study. Medical physics, 38(10):5807–5817, 2011.
- [13] Vasant Kearney, Jason W Chan, Samuel Haaf, Martina Descovich, and Timothy D Solberg. Dosenet: a volumetric dose prediction algorithm using 3d fully-convolutional neural networks. Physics in Medicine & Biology, 63(23):235022, 2018.
- [14] Zhiqiang Liu, Jiawei Fan, Minghui Li, Hui Yan, Zhihui Hu, Peng Huang, Yuan Tian, Junjie Miao, and Jianrong Dai. A deep learning method for prediction of three-dimensional dose distribution of helical tomotherapy. Medical physics, 46(5):1972–1983, 2019.
- [15] Jingjing Zhang, Shuolin Liu, Teng Li, Ronghu Mao, Chi Du, and Jianfei Liu. Voxel-level radiotherapy dose prediction using densely connected network with dilated convolutions. In Artificial Intelligence in Radiation Therapy: First International Workshop, AIRT 2019, Held in Conjunction with MICCAI 2019, Shenzhen, China, October 17, 2019, Proceedings 1, pages 70–77. Springer, 2019.
- [16] Dimitris Visvikis, Philippe Lambin, Kim Beuschau Mauridsen, Roland Hustinx, Michael Lassmann, Christoph Rischpler, Kuangyu Shi, and Jan Pruim. Application of artificial intelligence in nuclear medicine and molecular imaging: a review of current status and future perspectives for clinical translation. European journal of nuclear medicine and molecular imaging, 49(13):4452–4463, 2022.
- [17] Olaf Ronneberger, Philipp Fischer, and Thomas Brox. U-net: Convolutional networks for biomedical image segmentation. In Medical Image Computing and Computer-Assisted Intervention–MICCAI 2015: 18th International Conference, Munich, Germany, October 5-9, 2015, Proceedings, Part III 18, pages 234–241. Springer, 2015.
- [18] Min Sun Lee, Donghwi Hwang, Joong Hyun Kim, and Jae Sung Lee. Deep-dose: a voxel dose estimation method using deep convolutional neural network for personalized internal dosimetry. Scientific reports, 9(1):10308, 2019.
- [19] Dan Nguyen, Troy Long, Xun Jia, Weiguo Lu, Xuejun Gu, Zohaib Iqbal, and Steve Jiang. A feasibility study for predicting optimal radiation therapy dose distributions of prostate cancer patients from patient anatomy using deep learning. Scientific reports, 9(1):1076, 2019.
- [20] Mateo Villa, Julien Bert, Antoine Valeri, Ulrike Schick, and Dimitris Visvikis. Fast monte carlo-based inverse planning for prostate brachytherapy by using deep learning. IEEE Transactions on Radiation and Plasma Medical Sciences, 6(2):182–188, 2021.
- [21] Zhengyang Jiao, Xingchen Peng, Yan Wang, Jianghong Xiao, Dong Nie, Xi Wu, Xin Wang, Jiliu Zhou, and Dinggang Shen. TransDose: Transformer-based radiotherapy dose prediction from CT images guided by super-pixel-level GCN classification. Medical Image Analysis, 89:102902, October 2023.
- [22] Zahra Mansouri, Yazdan Salimi, Azadeh Akhavanallaf, Isaac Shiri, Eliluane Pirazzo Andrade Teixeira, Xinchi Hou, Jean-Mathieu Beauregard, Arman Rahmim, and Habib Zaidi. Deep transformer-based personalized dosimetry from spect/ct images: a hybrid approach for [177lu] lu-dotatate radiopharmaceutical therapy. European Journal of Nuclear Medicine and Molecular Imaging, pages 1–14, 2024.
- [23] Ian Goodfellow, Jean Pouget-Abadie, Mehdi Mirza, Bing Xu, David Warde-Farley, Sherjil Ozair, Aaron Courville, and Yoshua Bengio. Generative adversarial networks. Communications of the ACM, 63(11):139–144, 2020.
- [24] Jonathan Ho, Ajay Jain, and Pieter Abbeel. Denoising diffusion probabilistic models. Advances in neural information processing systems, 33:6840–6851, 2020.
- [25] Yu Murakami, Taiki Magome, Kazuki Matsumoto, Tomoharu Sato, Yasuo Yoshioka, and Masahiko Oguchi. Fully automated dose prediction using generative adversarial networks in prostate cancer patients. PloS one, 15(5):e0232697, 2020.
- [26] Yiwen Zhang, Chuanpu Li, Liming Zhong, Zeli Chen, Wei Yang, and Xuetao Wang. Dosediff: distance-aware diffusion model for dose prediction in radiotherapy. IEEE Transactions on Medical Imaging, 2024.
- [27] Linjie Fu, Xia Li, Xiuding Cai, Xueyao Wang, Yali Shen, and Yu Yao. Md-dose: A diffusion model based on the mamba for radiation dose prediction. In 2024 IEEE International Conference on Bioinformatics and Biomedicine (BIBM), pages 911–918. IEEE, 2024.
- [28] Austen Maniscalco, Ezek Mathew, David Parsons, Justin Visak, Mona Arbab, Prasanna Alluri, Xingzhe Li, Narine Wandrey, Mu-Han Lin, Asal Rahimi, et al. Multimodal radiotherapy dose prediction using a multi-task deep learning model. Medical physics, 2024.
- [29] Antti Tarvainen and Harri Valpola. Mean teachers are better role models: Weight-averaged consistency targets improve semi-supervised deep learning results. Advances in neural information processing systems, 30, 2017.
- [30] Samuli Laine and Timo Aila. Temporal ensembling for semi-supervised learning. arXiv preprint arXiv:1610.02242, 2016.
- [31] Qizhe Xie, Zihang Dai, Eduard Hovy, Thang Luong, and Quoc Le. Unsupervised data augmentation for consistency training. Advances in neural information processing systems, 33:6256–6268, 2020.
- [32] David McClosky, Eugene Charniak, and Mark Johnson. Effective self-training for parsing. In Proceedings of the Human Language Technology Conference of the NAACL, Main Conference, pages 152–159, 2006.
- [33] Avrim Blum and Tom Mitchell. Combining labeled and unlabeled data with co-training. In Proceedings of the eleventh annual conference on Computational learning theory, pages 92–100, 1998.
- [34] Paola Cascante-Bonilla, Fuwen Tan, Yanjun Qi, and Vicente Ordonez. Curriculum labeling: Revisiting pseudo-labeling for semi-supervised learning. In Proceedings of the AAAI conference on artificial intelligence, volume 35, pages 6912–6920, 2021.
- [35] Zhaowei Cai, Avinash Ravichandran, Paolo Favaro, Manchen Wang, Davide Modolo, Rahul Bhotika, Zhuowen Tu, and Stefano Soatto. Semi-supervised vision transformers at scale. Advances in Neural Information Processing Systems, 35:25697–25710, 2022.
- [36] W Paul Segars, G Sturgeon, S Mendonca, Jason Grimes, and Benjamin MW Tsui. 4d xcat phantom for multimodality imaging research. Medical physics, 37(9):4902–4915, 2010.
- [37] Mohamed Kassar, Milos Drobnjakovic, Gabriele Birindelli, Song Xue, Andrei Gafita, Thomas Wendler, Ali Afshar-Oromieh, Nassir Navab, Wolfgang A Weber, Matthias Eiber, et al. Pbpk-adapted deep learning for pre-therapy prediction of voxel-wise dosimetry: In-silico proof-of-concept. IEEE Transactions on Radiation and Plasma Medical Sciences, 2024.
- [38] ROYUD Nishino and Shohei Hido Crissman Loomis. Cupy: A numpy-compatible library for nvidia gpu calculations. 31st confernce on neural information processing systems, 151(7), 2017.
- [39] David Sarrut, Mateusz Bała, Manuel Bardiès, Julien Bert, Maxime Chauvin, Konstantinos Chatzipapas, Mathieu Dupont, Ane Etxebeste, Louise M Fanchon, Sébastien Jan, et al. Advanced monte carlo simulations of emission tomography imaging systems with gate. Physics in Medicine & Biology, 66(10):10TR03, 2021.
- [40] Vikas Verma, Kenji Kawaguchi, Alex Lamb, Juho Kannala, Arno Solin, Yoshua Bengio, and David Lopez-Paz. Interpolation consistency training for semi-supervised learning. Neural Networks, 145:90–106, 2022.
- [41] Jamal Toutouh, Subhash Nalluru, Erik Hemberg, and Una-May O’Reilly. Semi-supervised generative adversarial networks with spatial coevolution for enhanced image generation and classification. Applied Soft Computing, 148:110890, 2023.
- [42] Jia Deng, Wei Dong, Richard Socher, Li-Jia Li, Kai Li, and Li Fei-Fei. Imagenet: A large-scale hierarchical image database. In 2009 IEEE conference on computer vision and pattern recognition, pages 248–255. Ieee, 2009.
- [43] Ross Wightman. Pytorch image models. https://github.com/rwightman/pytorch-image-models, 2019.
- [44] Kaiming He, Xiangyu Zhang, Shaoqing Ren, and Jian Sun. Deep residual learning for image recognition. In Proceedings of the IEEE conference on computer vision and pattern recognition, pages 770–778, 2016.
- [45] Weihao Yu, Chenyang Si, Pan Zhou, Mi Luo, Yichen Zhou, Jiashi Feng, Shuicheng Yan, and Xinchao Wang. Metaformer baselines for vision. IEEE Transactions on Pattern Analysis and Machine Intelligence, 46(2):896–912, 2024.
- [46] Ashish Vaswani, Noam Shazeer, Niki Parmar, Jakob Uszkoreit, Llion Jones, Aidan N Gomez, Łukasz Kaiser, and Illia Polosukhin. Attention is all you need. Advances in neural information processing systems, 30, 2017.
- [47] Adam Paszke, Sam Gross, Francisco Massa, Adam Lerer, James Bradbury, Gregory Chanan, Trevor Killeen, Zeming Lin, Natalia Gimelshein, Luca Antiga, et al. Pytorch: An imperative style, high-performance deep learning library. Advances in neural information processing systems, 32, 2019.
- [48] Yongwon Jo, Hyungu Kahng, and Seoung Bum Kim. Deep semi-supervised regression via pseudo-label filtering and calibration. Applied Soft Computing, page 111670, 2024.
- [49] Ilya Loshchilov and Frank Hutter. Decoupled weight decay regularization. arXiv preprint arXiv:1711.05101, 2017.
- [50] Nitish Srivastava, Geoffrey Hinton, Alex Krizhevsky, Ilya Sutskever, and Ruslan Salakhutdinov. Dropout: a simple way to prevent neural networks from overfitting. The journal of machine learning research, 15(1):1929–1958, 2014.