Chemical signature reveals co-spatial dwarf satellite of an edge-on disc galaxy with MUSE
Abstract
Integral field unit (IFU) spectroscopic observations of resolved galaxies provide an optimal experimental setting for determination of stellar population properties, in particular - age, metallicity and -enhancement, which are key to understanding evolution of galaxies across diverse physical environments. We determine these properties for the edge-on disc galaxy IC 1553, through stellar population models fitted to MUSE IFU observations. From our determined spatial distributions of metallicity and [/Fe], we serendipitiously identify the unique chemical signature of a dwarf galaxy that is co-spatial with the luminous disc of IC 1553. The dwarf galaxy is characterized by the presence of higher [/Fe] and metal-poor stellar populations relative to the disc of IC 1553. The identified dwarf is dynamically cold from its determined kinematics, consistent with being a satellite of IC 1553. From modeling the Spitzer IRAC 3.6 image of IC 1553, we confirmed the presence of the dwarf galaxy and calculated its stellar mass to be . This is the first such identification of a dwarf galaxy from its unique chemical signature in such integrated light IFU observations, even though its hidden by the luminous body of its massive host.
keywords:
galaxies: individual: IC 1553 – galaxies: abundances – galaxies: evolution – galaxies: formation – galaxies: spiral – galaxies: stellar content1 Introduction
Numerous dwarf galaxies, typically with baryonic masses of approximately or less, have begun to be identified routinely in photometric sky surveys (e.g. Palomar Sky Survey:Schombert et al. 1997; Sloan Digital Sky Survey: Brinchmann et al. 2004) as well as in dedicated photometric searches for satellite dwarfs, including faint ones, near massive galaxies (see review by Karachentsev & Kaisina, 2019). Given the high luminosity of such massive galaxies relative to their dwarf satellites, detecting dwarf satellites that are co-spatial with their massive companion presents considerable difficulty, especially when both the massive galaxy and the dwarf are star-forming. For nearby galaxy groups like M81 and Cen A, such dwarf galaxies may be identified from deep imaging surveys of resolved stars, if their stellar populations distribute differently from that of their massive host galaxies in color-magnitude-diagrams (e.g. Chiboucas et al., 2013; Crnojević et al., 2016). But such deep photometric surveys resolving individual stars are more difficult for more distant galaxies. If the spatial distribution of line-of-sight velocities (LOSV) and LOSV dispersions (LOSVD) are available for the massive galaxy, then kinematically discordant co-spatial dwarfs may be identified even if their stellar populations are not resolved (e.g. Hartke et al., 2018). However identifying a co-spatial dwarf is even more of a challenge when the dwarf galaxy does not stand out clearly is the LOSV and LOSVD maps.
Dwarf galaxies, including those that are co-spatial with their massive star-forming companions, are however expected to have stellar population properties distinct from massive star-forming spiral galaxies. Indeed, they are composed of stellar populations that, on average, have lower metallicity, following the mass metallicity relation (Kirby et al., 2011; Curti et al., 2020). The elemental abundance ratios are also different; [/Fe] of low-mass galaxies are lower than those of massive galaxies (Thomas et al., 2010; Spolaor et al., 2010). At a given metallicity [/Fe] of such stars in low-mass galaxies are also lower than the MW halo, but higher than MW disk (Tolstoy et al., 2009). These are the result of the interplay of different chemical yields from Core-collapse (CCSNe) and Type Ia (SNe Ia) Supernovae given the difference in star-formation histories between dwarfs and spirals (Kobayashi et al., 2020a, b).
Stellar population model fits to integrated galaxy spectra can constrain galaxy stellar population properties (e.g. McDermid et al., 2015). Deep integral field unit (IFU) spectroscopy observations of galaxies, such as with MUSE at the Very Large Telescope (Bacon et al., 2010), in conjunction with such stellar population model fitting have enabled the mapping of stellar population properties like age, metallicity and [/Fe] (e.g. Comerón et al., 2016; Kasparova et al., 2016; Pinna et al., 2019a, b; Scott et al., 2021). Of particular interest are edge-on star-forming disc galaxies, where distinct stellar populations properties (mainly [/Fe]) have been determined for their thin and thick discs (e.g. Scott et al., 2021; Somawanshi et al., 2024, hereafter Paper I).
In this work, we report the serendipitous identification of a dwarf satellite galaxy, co-spatial with an edge-on disc galaxy IC 1553. Based on stellar population model fitting to MUSE IFU measurments, we find that the dwarf galaxy shows a distinct chemical signature compared to its massive companion. Its identification is supported with Spitzer space telescope imaging. We describe the basic characteristics of IC 1553 along with a discussion of the MUSE and Spitzer data in Section 2. The methodologies employed for stellar population analysis resulting in the identification of the dwarf galaxy, as well as its kinematics, are presented in Section 3. The IC 1553 Spitzer image modeling and mass estimation of the dwarf galaxy are outlined in Section 4. Finally, Section 5 encompasses a discussion and conclusions regarding the nature of the dwarf galaxy associated with IC 1553.
2 Observations of IC 1553
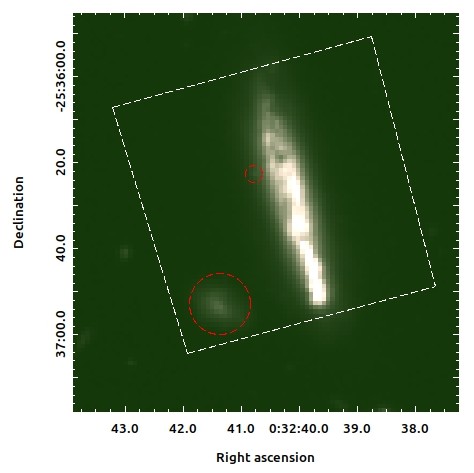
IC 1553 (see Figure 1) is an S-type galaxy located approximately 36.5 Mpc away (Tully et al., 2016). With a stellar mass of (Comerón et al., 2018), it is comparable to that of the Milky Way (M McMillan 2017). Lauberts (1982) classified IC 1553 as a galaxy exhibiting extended stellar and gaseous material. It has also been classified as an emission-line galaxy exhibiting significant star formation activity (Rautio et al., 2022). It also exhibits notable dust extinction in its central region, with a prominent dust lane visible along its mid-plane (Comerón et al., 2019).
IC 1553 was part of an initial sample of 70 edge-on disc galaxies that constituted the S4G survey (Spitzer Survey of Stellar Structure in Galaxies; Sheth et al., 2010; Comerón et al., 2012). These galaxies were mapped with Spitzer IRAC channels 1 and 2 (3.6 and 4.5 ). From amongst these edge-on discs, IC 1553 was included in the subsample of star-forming galaxies selected for IFU spectroscopic follow-up with MUSE by Comerón et al. (2019). They identified its kinematically distinct thin and thick discs. Utilizing the same MUSE IFU data, Rautio et al. (2022) found an increasing radial velocity lag in the outskirts of the galaxy disc with H kinematics, potentially due to the accretion of gas from a diffuse source.
IC 1553 forms part of our sample of edge-on disc galaxies with archival MUSE IFU observations by Comerón et al. (2019), whose stellar population properties (particularly age, metallicity, and [/Fe]) we are studying to understand the formation and evolution of disc galaxies (Somawanshi et al. in prep). The stellar population analysis for a pilot galaxy, ESO 544-27, has been presented in Paper I.
Spatial sampling of MUSE is with a field-of-view and a wavelength range from 4750–9351 Å (Bacon et al., 2010) and with a median spectral resolution of 2.5 Å. IC 1553 was observed in four dithered exposures, each lasting 2624 s, eventually combined to a single reduced data cube. The details of the observations and their reduction can be found in Comerón et al. (2019). The MUSE field-of-view of IC 1553 includes one known neighbouring galaxy LEDA 776941 (marked in red in Figure 1) as well as a foreground star. We utilized MUSE white light images of IC 1533 to create a mask & eliminate these objects.
3 MUSE data Analysis
3.1 Stellar population analysis
We applied the methods outlined in Paper I to extract the stellar kinematics and populations for IC 1553, with brief specific details provided here. For a full description, refer to section 3 of Paper I. Voronoi-binning (Cappellari & Copin, 2003) was used to obtain spatially binned spectra for IC 1553. We adopted the same minimum S/N values per bin and per spaxel of 60 and 3, respectively, within the 4800–5500 Å range, as used for ESO 544-27. This resulted in a total of 1312 bins for IC 1553. This process was carried out using the GIST (Galaxy IFU Spectroscopy Tool) Pipeline (Bittner et al., 2019).
We fitted the spectra using the Penalized Pixel-Fitting (pPXF) code as outlined in Cappellari & Emsellem (2004); Cappellari (2017), employing the semi-empirical (sMILES; Knowles et al. 2023) single-stellar-population (SSP) models, which match the sampling, resolution (FWHM), and wavelength range of MILES (Vazdekis et al., 2015). The sMILES models were chosen for their higher resolution in [/Fe] abundances (ranging from -0.2 to +0.6 in steps of 0.2). However, we used the Kroupa IMF (Kroupa, 2001) for IC 1553 instead of the unimodal Salpeter IMF (Salpeter, 1955) that was used in Paper I. While the choice of IMF has minimal impact on the mass fraction, as discussed in Paper I, we find marginally lower fraction of unphysical fitted stellar populations (see Paper I for details; also discussed briefly in next subsection) when using the Kroupa IMF.
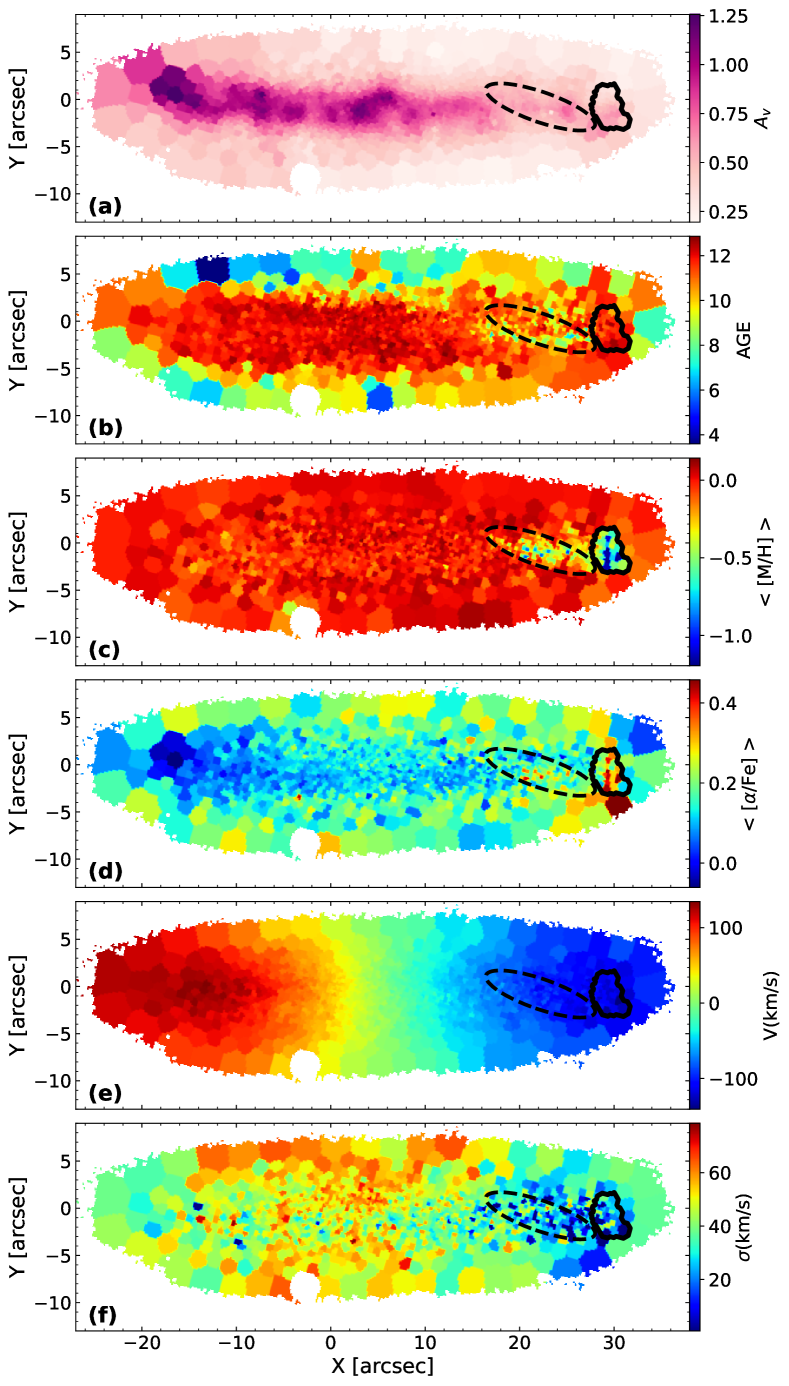
For each spatial bin, nebular dust extinction was derived from the binned spectra through the Balmer decrement, measured using the H and H emission line fluxes. This approach effectively identifies the presence and spatial distribution of dust within the galaxy. The nebular extinction values were then utilized to estimate the stellar extinction in the same spatial bin, following the relation outlined by Calzetti et al. (1994). The spatial distribution of values is presented in Figure 2a. This is different from the approach of determining from the stellar continuum that was used in Paper I, as the extinction from the dust lane in IC 1553 was not adequately accounted for using the determined by pPXF from the stellar continuum.
As in Paper I, emission lines were masked to avoid any potential impact on the stellar population model fitting. Stellar kinematics and populations were fitted separately using an additive & multiplicative polynomial of 8th order. This was done with a regularization parameter of 0.07. As mentioned in Paper I, this value was chosen to balance smoothing the solutions to reduce noise while preserving the star-formation history information and is similar to the approach followed by Pinna et al. (2019a) and Scott et al. (2021). We obtained the mass weights for each SSP model using pPXF across all 1312 spatial bins of IC 1553.
3.2 Mass-weighted mean stellar population properties
From the mass weights, we excluded contributions from metal-poor ([M/H]) and low-alpha () stellar populations, which were marked as non-physical in Paper I due to the limited capability of pPXF to accurately fit stellar population models, especially in regions affected by dust attenuation. Such a metal-poor and lower [] stellar population is not predicted for any galaxy, neither in massive galaxies (e.g. Vincenzo et al. 2018) nor for local group dwarf galaxies (e.g. Kobayashi et al. 2020a). For a more detailed discussion of this unphysical stellar population, see Paper I. Subsequently, the remaining mass weights were utilized to determine the mean age, [M/H], and [/Fe] for each spectral bin in IC 1553. Their spatial distribution is illustrated in Figure 2. We note that the mean age map is not very reliable due to tendencies of pPXF to favour majority older (>9 Gyr old) stellar population model fitting solutions balanced with small fractions of younger (1–2 Gyr old) stellar populations (Woo et al., 2024; Wang et al., 2024).
The <[M/H]> distribution (Figure 2c), in particular, reveals that the bulk of the stellar population is metal-rich (<[M/H]> ) but a region on the disc plane (outlined in black in Figure 2c) stands out as being metal poor (<[M/H]> ). We note that this is despite the tendies of pPXF to favour relatively metal-rich ([M/H]0) stellar population model fits (Woo et al., 2024).
This region is also found to have relatively higher [/Fe] compared to the mid-plane of IC 1553 (see Figure 2d), though it doesn’t stand-out in <age> (see Figure 2b). There are additional bins adjacent to this region (within the dashed black ellipse marked in Figure 2) that are also similarly metal-poor (see Figure 2c), having higher [/Fe] than the mid-plane (see Figure 2d) with a seemingly younger <age> (see Figure 2b).
Particularly the <[M/H]> and <[/Fe]> spatial distributions of IC 1553 thus reveal a region consisting of a few spatial bins that stand out in their stellar population chemistry compared to the rest of the galaxy. We select the 34 spatial bins with <[M/H]> and <[/Fe]> in this region as marked by a black outline in Figure 2.
Figure 2a shows that the spatial bins within this region as well as the ellipse also exhibit significantly lower extinction values compared to the bins in the rest of the midplane. This potentially indicates a foreground dwarf galaxy, with stellar population properties that are distinct from IC 1553, whose light dominates the observed spectral bins within the outlined region in Figure 2 while also contributing to some of the spectral bins within the ellipse region in Figure 2.
Differences between the stellar populations inhabiting the mid-plane of IC 1553 and those at greater scale heights are also evident from Figure 2, indicating differences between the thin and thick discs of IC 1553. This will be addressed along with our full sample of star-forming edge-on discs studied with MUSE IFU observations in a future publication (Somawanshi et al. in prep).
3.3 [/Fe] vs [M/H] in the dwarf region of the galaxy
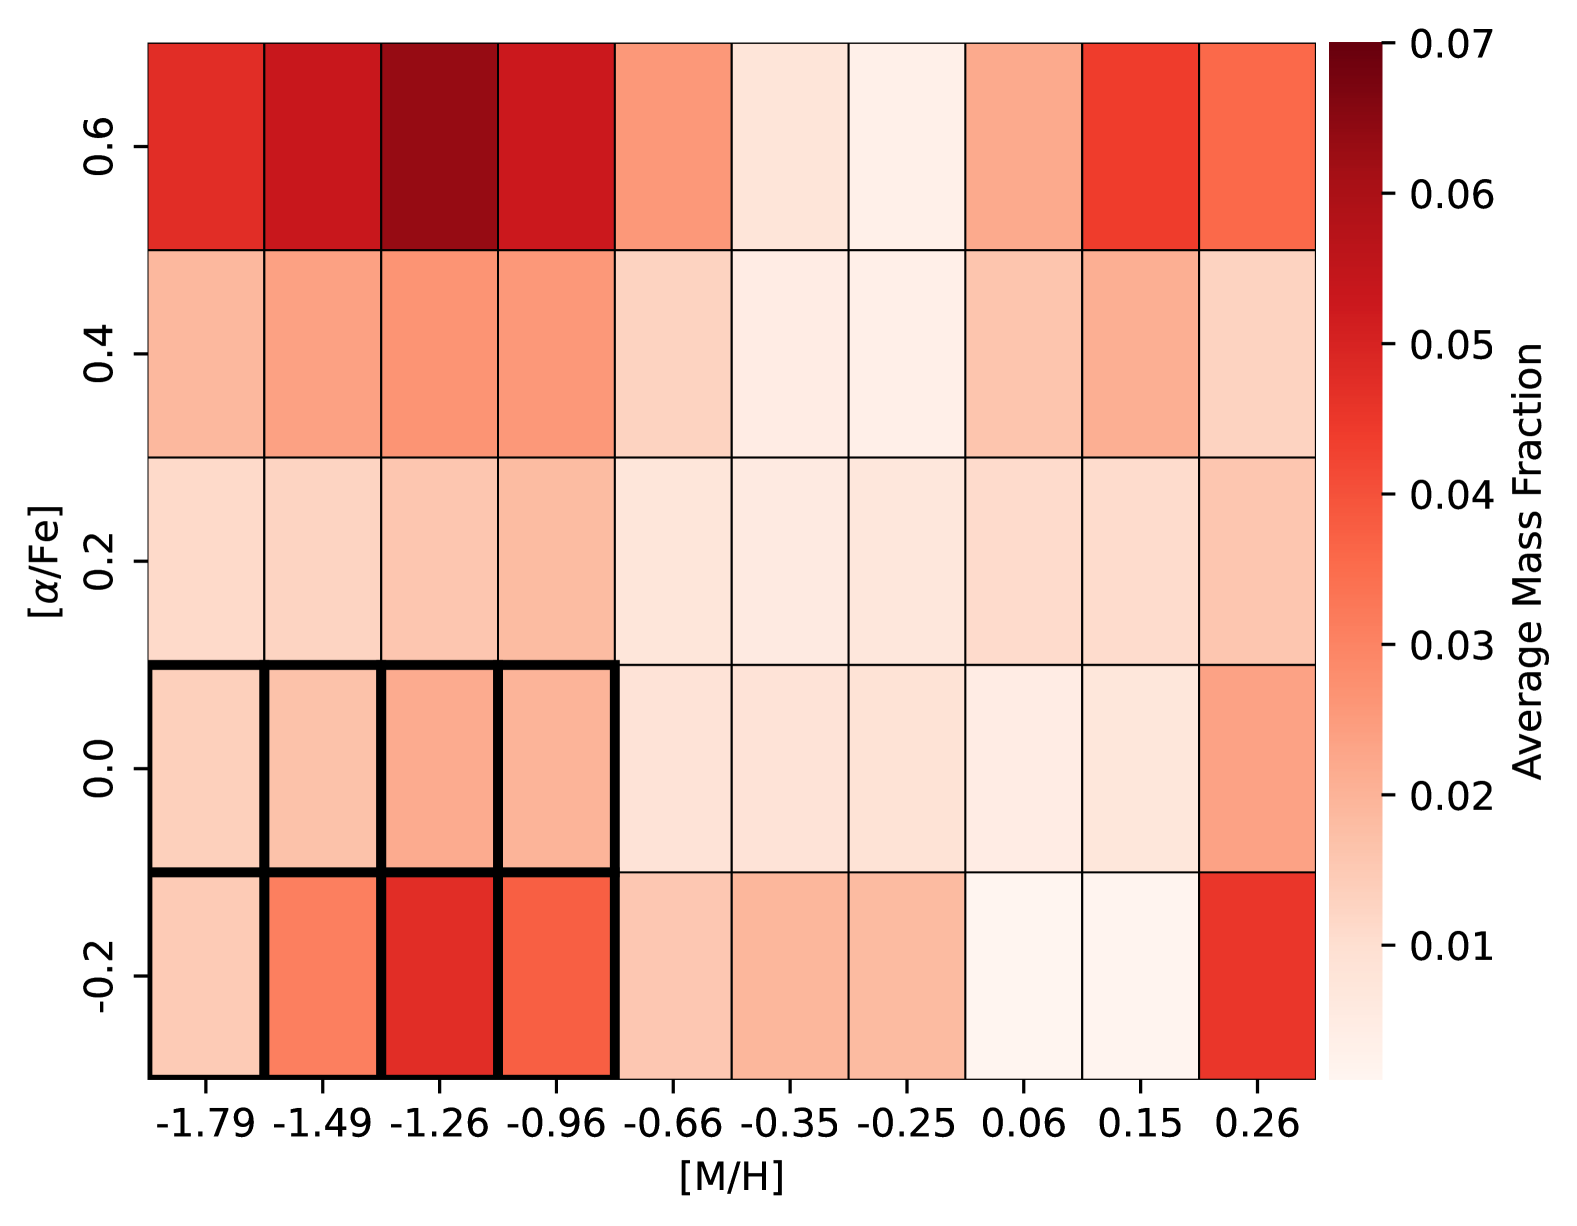
Figure 3 illustrates the average mass fraction across all spatial bins of the potential dwarf region in the [/Fe] vs [M/H] plane for stellar populations of all ages. The region contains a significant metal-rich stellar population with [M/H] and [/Fe] , alongside a stellar population characterized by [M/H] = 0.26 and [/Fe] . These stellar populations are similar to those of ESO 544-27 discussed Paper I where the higher and lower [/Fe] stellar populations were considered being associated with its thin and thick disc. This is likely also the case here and will be discussed further considering also the region beyond the dwarf region in Somawanshi et al. (in prep.). A metal-poor and lower [/Fe] stellar population ([M/H] = -1.79 – -0.96 and [/Fe] ) is also present (as outlined) in Figure 3 but should be ignored as already discussed in Section 3.2.
Of particular interest in Figure 3 is that we observe a metal-poor higher [/Fe] stellar population with [/Fe] and [M/H] = -1.7 – -0.96 in this region. With a mass fraction of , this metal-poor higher [/Fe] population thus forms about a fifth of the total stellar mass in the marked area in Figure 2. This stellar population is distinct to the dwarf region and is absent in other spatial bins of the galaxy (see also Figure 7 in Paper I for ESO 544-27). It is thus likely that this metal-poor higher [/Fe] population belongs exclusively to the potential foreground dwarf galaxy. The metal-rich lower and higher [/Fe] stellar populations may have contributions from both IC 1553 and any potential foreground dwarf.
The dwarf galaxy is thus identified with higher and more metal-poor stellar populations relative to the disc of IC 1553. We note that for this population, pPXF gives the highest value of the population grid ([/Fe] = 0.6), while lowering metallicity ([M/H]=-1.79 to -0.96) and maximizing age (12 Gyr). Similar tendency is found for age and metallicity (e.g. Sattler et al., 2024), tested extensively with mock galaxy spectra by Woo et al. (2024) and Wang et al. (2024). Therefore, to determine the exact value of [/Fe], more detailed analysis would be required
The presence of the metal-poor higher [/Fe] population spread over multiple adjoining spectral bins in a specific spatial location, may imply the possibility of a foreground dwarf galaxy, but we need to corroborate its identification in the stellar population parameter space with potential kinematic and photometric signatures.
3.4 Dwarf kinematics
It is important to assess whether a distinct dwarf galaxy can be discerned in this region in the kinematic spatial distribution of IC 1553. Figures 2e & 2f respectively present the mean stellar velocity (V) and stellar velocity dispersion (), as derived from the GIST pipeline, as described in Section 3.1. Figure 2e shows that the dwarf region is moving in the direction of rotation of the disc galaxy. Additionally, Figure 2f shows that the spatial bins within the dwarf region have a lower mean stellar velocity dispersion () compared to the spectral bins of IC 1553 diametrically opposite to the dwarf region with . Likewise, the bins within the ellipse region also exhibit similarly low stellar velocity dispersion values. If the dwarf were actively disrupting the disc of IC 1553, we would expect to observe a higher velocity dispersion in the dwarf region. Conversely, if it were physically too distant from IC 1553 albeit within the line-of-sight, the stellar velocity would differ significantly from the galaxy’s velocity field resulting in a higher measured mean velocity dispersion in the dwarf region.
The relatively lower velocity dispersion suggests that the dwarf is likely a dynamically colder satellite near the disc of IC 1553 that lies in the foreground in the line-of-sight. The dwarf itself may still be disrupting with an extended star-forming tail in the ellipse region marked in Figure 2 but it doesn’t seem to be affecting the disc of IC 1553.
4 Spitzer Imaging Data Analysis
4.1 Presence of the dwarf galaxy in photometry
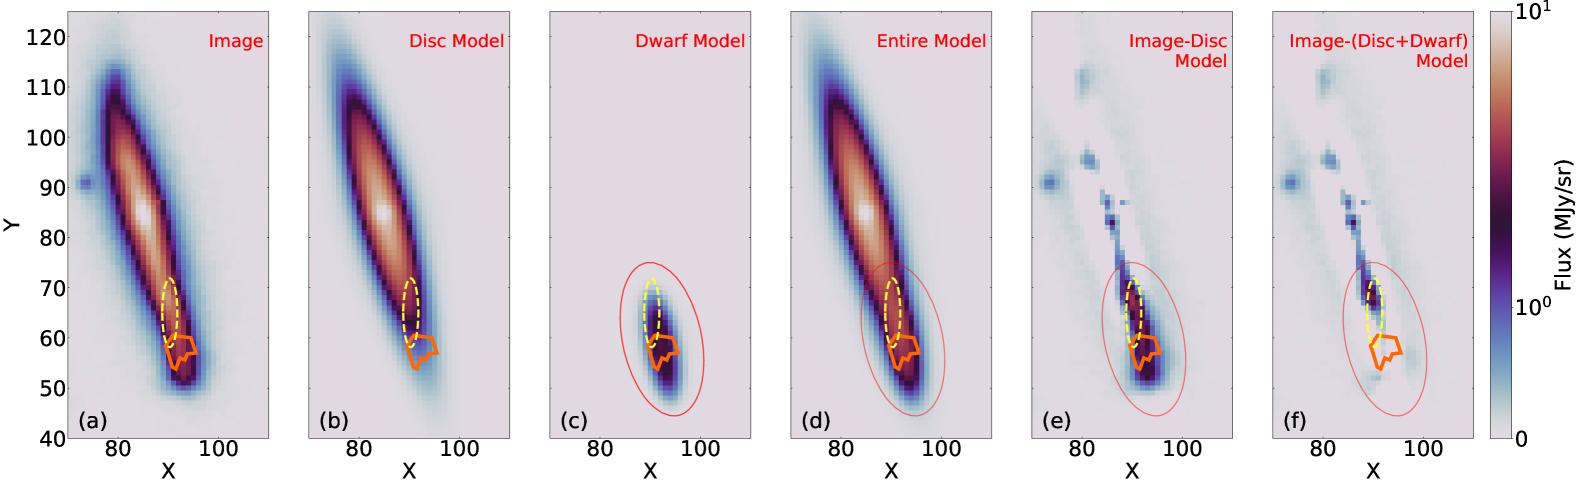
Utilising the S4G survey Spitzer IRAC 3.6 image of IC 1553 (Figure 4a) and considering also that its classified as an edge-on disc with a bright nuclear point source (Salo et al., 2015), we make a suitable GALFIT (Peng et al., 2010) model (Figure 4b) with a point spread function and a sérsic profile (magnitude: , sérsic index: 0.64, half-light radius: 16.55 pixels). The residual image (Figure 4e), from subtracting the modeled disc galaxy from the observed image, clearly shows an extended feature. The dwarf region and the extended region of interest identified from the stellar population analysis with MUSE (see Figure 2) is consistent in position with this extended feature. When the dwarf galaxy is modeled separately (Figure 4c; centered roughly at the location of the dwarf region from Figure 2) using a single sérsic profile in GALFIT (magnitude: , sérsic index: 0.17, half-light radius: 7.19 pixels) and included to model the entire image (Figure 4d), the extended feature within the elliptical outline in significantly reduced in the resulting residual when this entire model in subtracted from the image (Figure 4f), though some residual flux towards the center of the edge-on disc remains in the dwarf region.
4.2 Mass of the dwarf galaxy
To measure the mass of the dwarf galaxy, and its relative mass fraction compared to the modeled disc galaxy, we consider an elliptical aperture (marked by red in Figure 4) centered on the dwarf galaxy with the same position angle and ellipticity, but twice the effective radius, thus encompassing the entire dwarf galaxy region. In this aperture, we measured the flux from the dwarf model as MJy/sr. We then utilized Equation 6 from Querejeta et al. (2015) to estimate the mass of the dwarf galaxy which converts 3.6 old stellar flux into stellar mass with an accuracy of dex (Meidt et al., 2014). As per their suggested mass-to-light ratio, , and assuming a Chabrier IMF (Chabrier, 2003), we obtain the mass of the dwarf galaxy to be . We then applied the same elliptical aperture to the entire model to measure the total flux contribution of IC 1553 and the dwarf in the region of interest. This comes out to be MJy/sr, resulting in the computed mass of this entire region to be . Thus, the modeled dwarf galaxy has a mass fraction of within the elliptical aperture in Figure 4.
This value is higher, though within error, than the mass fraction of for the metal-poor, higher-[/Fe] population in the dwarf from MUSE (see Figure 3 and Section 3.3). While the former is the ratio of the mass of all stellar populations in the dwarf galaxy to that of all stellar populations in the edge-on disc, the latter is the ratio of the mass of the higher-[/Fe] metal-poor population, that is only present in the dwarf galaxy, to that of all other stellar populations both in the dwarf and the background IC 1553. It thus follows that the mass fraction of the metal-poor, higher-[/Fe] stellar population in the dwarf galaxy (computed from MUSE IFU stellar population model fitting) should be lower than the mass fraction of the dwarf galaxy (computed from Spitzer image modeling). The two mass fractions are thus not inconsistent.
5 Summary and conclusion
We thus report the identification of a star-forming dwarf galaxy, having mass , that is co-spatial with the luminous edge-on disc galaxy IC 1553. The dwarf galaxy is initially identified from stellar population model fitting of MUSE IFU integrated light observations (Figure 2c,d) due to its higher [/Fe], metal-poor stellar population ([/Fe] = 0.6 and [M/H] = -1.7 to -0.96; see Section 3.3), in contrast to the metal-rich stellar populations with lower mean [/Fe] that inhabit the disc of IC 1553. In this work, we have thus mainly utilized the stellar population model fitting with pPXF to chemically distinguish the dwarf galaxy from the background edge-on disc, though additional analysis may be required to more accurately obtain the [/Fe] and [M/H] of the dwarf galaxy.
This identification is consistent with how the higher [/Fe] and metal-poor stellar populations identified in dwarf spheroidal satellites of MW and M31 (e.g. Kirby et al., 2011, 2020) contrast the lower [/Fe] and metal-rich stellar populations of the MW and M31 thin discs (e.g. Hayden et al., 2015; Arnaboldi et al., 2022; Kobayashi et al., 2023).
This dwarf galaxy is consistent with being a satellite of IC 1553 as its velocity is not too dissimilar from that of the rotating disc of IC 1553 (which would have been the case if it were a foreground galaxy), but its dynamically colder than the background edge-on disc (Figure 2e,f). The dwarf galaxy is further identified from the GALFIT modeling of the Spitzer IRAC 3.6 image of IC 1553 (Section 4).
The presence of some residuals upon consideration of the dwarf galaxy in the GALFIT modeling (Figure 2f), as well as extended features near the position of the dwarf galaxy in the stellar population maps obtained from MUSE IFU images (dotted ellipse in Figure 2), indicates that the dwarf is disrupting with an extended star-forming tail. The stars in the tail likely have a higher <[M/H]> (Figure 2c) but similar <[/Fe]> (Figure 2d) as the main body of the dwarf galaxy.
Earlier studies (Sattler et al., 2024) where stellar population models for MUSE IFU observations of IC 1553 were fitted only in the age and [M/H] parameter space, did not enable the co-spatial dwarf galaxy to be identified. Our methodology (Paper I) with the expanded parameter space including [/Fe] in the sMILES stellar population models allowed the reliable identification of the dwarf satellite galaxy in <[/Fe]> and <[M/H]> maps (Figure 2c,d). This is the first such dwarf galaxy to be identified from its chemical signature in integrated light IFU observations.
Acknowledgements
SB was funded by the INSPIRE Faculty Award (DST/INSPIRE/04/2020/002224), Department of Science and Technology (DST), Government of India. The award also supported DS during his recurring stays at IUCAA, Pune, India. PKM is supported by the KIAS Individual Grant (PG096701) at the Korea Institute for Advanced Study. We acknowledge the use of Pegasus, the high-performance computing facility at IUCAA. This research made use of Astropy– a community-developed core Python package for Astronomy (Astropy Collaboration et al., 2013), SciPy (Virtanen et al., 2020), NumPy (Oliphant, 2015) and Matplotlib (Hunter, 2007). This research also made use of NASA’s Astrophysics Data System (ADS111https://ui.adsabs.harvard.edu).
Data Availability
The reduced MUSE data cube for ESO IC 1553 is publicly available through the ESO Phase 3 data release at https://doi.eso.org/10.18727/archive/8. Meanwhile, the imaging data and PSF for IC 1553 are publicly available through S4G data release at https://irsa.ipac.caltech.edu/data/SPITZER/S4G/overview.html.
References
- Arnaboldi et al. (2022) Arnaboldi M., et al., 2022, A&A, 666, A109
- Astropy Collaboration et al. (2013) Astropy Collaboration et al., 2013, A&A, 558, A33
- Bacon et al. (2010) Bacon R., et al., 2010, in McLean I. S., Ramsay S. K., Takami H., eds, Society of Photo-Optical Instrumentation Engineers (SPIE) Conference Series Vol. 7735, Ground-based and Airborne Instrumentation for Astronomy III. p. 773508 (arXiv:2211.16795), doi:10.1117/12.856027
- Bittner et al. (2019) Bittner A., et al., 2019, A&A, 628, A117
- Brinchmann et al. (2004) Brinchmann J., Charlot S., White S. D. M., Tremonti C., Kauffmann G., Heckman T., Brinkmann J., 2004, MNRAS, 351, 1151
- Calzetti et al. (1994) Calzetti D., Kinney A. L., Storchi-Bergmann T., 1994, ApJ, 429, 582
- Cappellari (2017) Cappellari M., 2017, MNRAS, 466, 798
- Cappellari & Copin (2003) Cappellari M., Copin Y., 2003, MNRAS, 342, 345
- Cappellari & Emsellem (2004) Cappellari M., Emsellem E., 2004, PASP, 116, 138
- Chabrier (2003) Chabrier G., 2003, PASP, 115, 763
- Chiboucas et al. (2013) Chiboucas K., Jacobs B. A., Tully R. B., Karachentsev I. D., 2013, AJ, 146, 126
- Comerón et al. (2012) Comerón S., et al., 2012, ApJ, 759, 98
- Comerón et al. (2016) Comerón S., Salo H., Peletier R. F., Mentz J., 2016, A&A, 593, L6
- Comerón et al. (2018) Comerón S., Salo H., Knapen J. H., 2018, A&A, 610, A5
- Comerón et al. (2019) Comerón S., Salo H., Knapen J. H., Peletier R. F., 2019, A&A, 623, A89
- Crnojević et al. (2016) Crnojević D., et al., 2016, ApJ, 823, 19
- Curti et al. (2020) Curti M., Mannucci F., Cresci G., Maiolino R., 2020, MNRAS, 491, 944
- Dey et al. (2019) Dey A., et al., 2019, AJ, 157, 168
- Hartke et al. (2018) Hartke J., et al., 2018, A&A, 616, A123
- Hayden et al. (2015) Hayden M. R., et al., 2015, ApJ, 808, 132
- Hunter (2007) Hunter J. D., 2007, Computing In Science & Engineering, 9, 90
- Karachentsev & Kaisina (2019) Karachentsev I. D., Kaisina E. I., 2019, Astrophysical Bulletin, 74, 111
- Kasparova et al. (2016) Kasparova A. V., Katkov I. Y., Chilingarian I. V., Silchenko O. K., Moiseev A. V., Borisov S. B., 2016, MNRAS, 460, L89
- Kirby et al. (2011) Kirby E. N., Cohen J. G., Smith G. H., Majewski S. R., Sohn S. T., Guhathakurta P., 2011, ApJ, 727, 79
- Kirby et al. (2020) Kirby E. N., Gilbert K. M., Escala I., Wojno J., Guhathakurta P., Majewski S. R., Beaton R. L., 2020, AJ, 159, 46
- Knowles et al. (2023) Knowles A. T., Sansom A. E., Vazdekis A., Allende Prieto C., 2023, MNRAS, 523, 3450
- Kobayashi et al. (2020a) Kobayashi C., Leung S.-C., Nomoto K., 2020a, ApJ, 895, 138
- Kobayashi et al. (2020b) Kobayashi C., Karakas A. I., Lugaro M., 2020b, ApJ, 900, 179
- Kobayashi et al. (2023) Kobayashi C., Bhattacharya S., Arnaboldi M., Gerhard O., 2023, ApJ, 956, L14
- Kroupa (2001) Kroupa P., 2001, MNRAS, 322, 231
- Lauberts (1982) Lauberts A., 1982, ESO/Uppsala survey of the ESO(B) atlas
- McDermid et al. (2015) McDermid R. M., et al., 2015, MNRAS, 448, 3484
- McMillan (2017) McMillan P. J., 2017, MNRAS, 465, 76
- Meidt et al. (2014) Meidt S. E., et al., 2014, ApJ, 788, 144
- Oliphant (2015) Oliphant T. E., 2015, Guide to NumPy, 2nd edn. CreateSpace Independent Publishing Platform, USA
- Peng et al. (2010) Peng C. Y., Ho L. C., Impey C. D., Rix H.-W., 2010, AJ, 139, 2097
- Pinna et al. (2019a) Pinna F., et al., 2019a, A&A, 623, A19
- Pinna et al. (2019b) Pinna F., et al., 2019b, A&A, 625, A95
- Querejeta et al. (2015) Querejeta M., et al., 2015, ApJS, 219, 5
- Rautio et al. (2022) Rautio R. P. V., Watkins A. E., Comerón S., Salo H., Díaz-García S., Janz J., 2022, A&A, 659, A153
- Salo et al. (2015) Salo H., et al., 2015, ApJS, 219, 4
- Salpeter (1955) Salpeter E. E., 1955, ApJ, 121, 161
- Sattler et al. (2024) Sattler N., Pinna F., Comerón S., Martig M., Falcón-Barroso J., Martín-Navarro I., Neumayer N., 2024, arXiv e-prints, p. arXiv:2410.05761
- Schombert et al. (1997) Schombert J. M., Pildis R. A., Eder J. A., 1997, ApJS, 111, 233
- Scott et al. (2021) Scott N., van de Sande J., Sharma S., Bland-Hawthorn J., Freeman K., Gerhard O., Hayden M. R., McDermid R., 2021, ApJ, 913, L11
- Sheth et al. (2010) Sheth K., et al., 2010, PASP, 122, 1397
- Somawanshi et al. (2024) Somawanshi D., Bhattacharya S., Kataria M., Kobayashi C., 2024, MNRAS, 531, 4336
- Spolaor et al. (2010) Spolaor M., Kobayashi C., Forbes D. A., Couch W. J., Hau G. K. T., 2010, MNRAS, 408, 272
- Thomas et al. (2010) Thomas D., Maraston C., Schawinski K., Sarzi M., Silk J., 2010, MNRAS, 404, 1775
- Tolstoy et al. (2009) Tolstoy E., Hill V., Tosi M., 2009, ARA&A, 47, 371
- Tully et al. (2016) Tully R. B., Courtois H. M., Sorce J. G., 2016, AJ, 152, 50
- Vazdekis et al. (2015) Vazdekis A., et al., 2015, MNRAS, 449, 1177
- Vincenzo et al. (2018) Vincenzo F., Kobayashi C., Taylor P., 2018, MNRAS, 480, L38
- Virtanen et al. (2020) Virtanen P., et al., 2020, Nature Methods, 17, 261
- Wang et al. (2024) Wang Z., Sharma S., Hayden M. R., van de Sande J., Bland-Hawthorn J., Vaughan S., Martig M., Pinna F., 2024, MNRAS, 534, 1175
- Woo et al. (2024) Woo J., Walters D., Archinuk F., Faber S. M., Ellison S. L., Teimoorinia H., Iyer K., 2024, MNRAS, 530, 4260