Your Model is Overconfident, and Other Lies We Tell Ourselves

Timothee Mickus1   Aman Sinha2   Raúl Vázquez1
1University of Helsinki   2Université de Lorraine
firstname.lastname@{1helsinki.fi,2univ-lorraine.fr}
Abstract

The difficulty intrinsic to a given example, rooted in its inherent ambiguity, is a key yet often overlooked factor in evaluating neural NLP models. We investigate the interplay and divergence among various metrics for assessing intrinsic difficulty, including annotator dissensus, training dynamics, and model confidence. Through a comprehensive analysis using 29 models on three datasets, we reveal that while correlations exist among these metrics, their relationships are neither linear nor monotonic. By disentangling these dimensions of uncertainty, we aim to refine our understanding of data complexity and its implications for evaluating and improving NLP models.

Your Model is Overconfident, and Other Lies We Tell Ourselves


Timothee Mickus1   Aman Sinha2   Raúl Vázquez1 1University of Helsinki   2Université de Lorraine firstname.lastname@{1helsinki.fi,2univ-lorraine.fr}


1 Introduction

A central, but often overlooked, concept in natural language processing is the consensus of annotators when labeling a specific datapoint. Annotators often express different perspectives, and prior literature provides strong evidence that this dissensus is a legitimate characteristic of language data, rather than a consequence of noisy annotation processes (Plank et al., 2014; Plank, 2022; Uma et al., 2021).

Annotator dissensus is often linked to data complexity: if humans do not agree as to whether a pair of sentences contradict each other, then we expect this pair to be hard to label with a neural network. Data complexity can be quantified through training dynamics (e.g., how early a training example is learned), model confidence, or performance variability across models (Guo et al., 2017; Swayamdipta et al., 2020; Hendrycks and Dietterich, 2019). This relationship shapes the design of evaluation benchmarks, which increasingly incorporate multiple annotations per datapoint (e.g., Bowman et al., 2015; Nie et al., 2020). As such, matching human uncertainty with model uncertainty is an explicit desideratum laid out in numerous NLP applications.

Common drivers of data uncertainty include annotation noise, semantic ambiguity, and overlapping class boundaries (Hu et al., 2023). These factors not only lower inter-annotator agreement but also highlight the presence of linguistic phenomena such as semantic indeterminacy — which lead to label ambiguity, as extensively documented across NLP tasks (Bowman et al., 2015). Hence, prior work has expected annotator dissensus to be a reasonable proxy for data complexity (e.g., Hachey et al., 2005; Lalor et al., 2018).

Our findings reveal non-linear and conflicting relationships between annotator dissensus and model-derived complexity metrics. Through experiments using 29 models on the ChaosNLI and DynaSent datasets (Nie et al., 2020; Potts et al., 2021), we observe that various metric indicators of data complexity often correlate with one another — and yet that the relationship they hold with human-based assessments of linguistic dissensus is far from linear or monotonic. Moreover, indicators of data complexity derived from model behavior tend to conflict depending on whether they account for the correctness of the models’ predictions — for instance, assessments derived from conformal prediction methods do not align with the training dynamics approach of Swayamdipta et al. (2020), and both fail to adequately capture the true human label variation collected by Nie et al. (2020).

2 Background

Our study falls at the intersection of data complexity and uncertainty in NLP, particularly in relation to annotator disagreement, label variation, and the metrics used to evaluate them (Jiang and de Marneffe, 2022; Uma et al., 2021; Lorena et al., 2019; Baan et al., 2023). Though closely related, these concepts involve distinct challenges.

Data uncertainty or aleatoric uncertainty describes the randomness or noise inherent to the data (Hu et al., 2023). This type of uncertainty is irreducible and cannot be eliminated through model improvements or tuning (Kiureghian and Ditlevsen, 2009; Kendall and Gal, 2017; Hüllermeier and Waegeman, 2021). Sources of data uncertainty include noisy observations, overlapping classes, ground truth errors or inherent randomness.

Annotator disagreement is highlighted as a fundamental characteristic of linguistic data, stemming from both annotation noise and the inherent ambiguity of language (Plank et al., 2014; Aroyo and Welty, 2015; Pavlick and Kwiatkowski, 2019; Fornaciari et al., 2021). It often correlates with label uncertainty, where no single correct label exists. High-disagreement examples contain valuable signals for classifiers (Basile et al., 2021; Palomaki et al., 2018). However, disagreement does not necessarily indicate annotation noise—it may instead reflect genuine linguistic or contextual ambiguity.

Data complexity or data difficulty refers to the characteristics of a data sample that make classification inherently difficult. It is related to the structural properties of the data, not to randomness or noise, as is the case with data uncertainty. Several factors contribute to data complexity: proximity to decision boundaries and class overlap, semantic indeterminacy, and task-specific challenges, such as requiring world knowledge (Plank, 2022; Jiang and de Marneffe, 2022).

Metrics for evaluating data uncertainty and complexity include model confidence (probability of the predicted class), entropy of predicted probabilities (measuring classification uncertainty), and confidence calibration (aligning confidence with performance). These help assess label uncertainty caused by overlapping class boundaries (e.g., Geng et al., 2024; Zhou et al., 2022; Xiao and Wang, 2019). Training dynamics, such as how quickly a model learns to classify an example or the shape of the loss curve, further reveal the relative difficulty of datapoints (Swayamdipta et al., 2020; Toneva et al., 2019; Baldock et al., 2021). These metrics offer tools to analyze the challenges of data complexity, yet they do not provide a nuanced perspective on the interplay between annotator disagreement and model uncertainty.

Complexity, disagreement & uncertainty.

Data complexity, annotator disagreement, and data uncertainty are intertwined phenomena with similar root causes. For instance, while authors differ in their terminology, ‘overlapping classes’ (Ho and Basu, 2002; Peterson et al., 2019; Lorena et al., 2019), ‘absence of a single ground truth’ (Aroyo and Welty, 2015; Baan et al., 2022), or ‘linguistic ambiguity’ due to semantic and social factors (Plank, 2022) all refer to the fact that some datapoints can have different labels — which drives up complexity, disagreement and uncertainty.

Hence, these three phenomena have been conflated in the literature. For example, uncertainty is often measured through label distribution entropy, used as a proxy for annotator disagreement (Zhang et al., 2022; Baumler et al., 2023). Similarly, Lalor et al. (2018) has found alignment between human difficulty and model-assigned probability mass, suggesting that both perceive difficulty similarly. This viewpoint is also prevalent in active learning (e.g., Hachey et al., 2005) and attested less directly in quality estimation (e.g., Jamison and Gurevych, 2015). Additionally, anecdotal evidence has been used to support this connection, especially in studies exploring the underlying causes of data complexity (Swayamdipta et al., 2020; Baldock et al., 2021; Rajpurkar et al., 2018).

This perspective has also been employed as a working hypothesis. For example, Weinshall et al. (2018) assume that knowledge distillation from a model can play the same role as humans in active learning scenarios, while Beigman and Beigman Klebanov (2009) propose replacing annotator-based disagreement assessment with classifier proxies. Authors adopting this approach often treat it as a simplifying initial assumption, and frequently include modeling work to better capture human variation (e.g. Reidsma and Carletta, 2008) or discussions of the limitations of this working hypothesis (as in Beigman and Beigman Klebanov).

Treating these three phenomena as interchangeable oversimplifies their relationships. Disagreement often signals semantic complexity but can also stem from bias, expertise variance, or cultural differences (e.g., Jiang and de Marneffe, 2022). Similarly, uncertainty overlaps with complexity but also arises from noise that is not tied to structural data complexity (Kendall and Gal, 2017), while example difficulty has been linked to factors that are a priori not linguistic, such as class imbalance or distributional shifts (Ho and Basu, 2002; Gawlikowski et al., 2023). While some studies find overlap between human disagreement and model uncertainty (Swayamdipta et al., 2020; Baldock et al., 2021), others challenge this view (Reidsma and Carletta, 2008). Our findings highlight the need to distinguish these concepts, as we show that complexity metrics do not map linearly to human assessments.

3 Indicators of data complexity

We formalize several means of assessing how difficult it is to assign one of kk possible labels {y1,,yk}=Y\left\{y_{1},\dots,y_{k}\right\}=Y to a specific instance xx.

3.1 Human-based indicators

Empirical population dissensus.

The simplest way to quantify disagreement on a specific datapoint is to ask multiple annotators a1,,ana_{1},\dots,a_{n}, and compute how unpopular the majority opinion is. As such, if annotator aja_{j} would assign the label yajy_{a_{j}} to the observation xx, we can define the probability Pr(yi|x)\Pr_{\mathbb{H}}(y_{i}|x) on label yiy_{i} as the proportion of annotators agreeing on the label yiy_{i}, or formally

Pr(yi|x)=1nj=1n𝟙{yaj=yi}\Pr{}_{\mathbb{H}}(y_{i}|x)=\frac{1}{n}\sum\limits_{j=1}^{n}\mathbbm{1}\left\{y_{a_{j}}=y_{i}\right\}

and denote the dissensus among annotators as:

dis=1maxyiYPr(yi|x),\mathbb{H}_{\mathrm{dis}}=1-\max\limits_{y_{i}\in Y}\Pr{}_{\mathbb{H}}(y_{i}|x), (1)

dis\mathbb{H}_{\mathrm{dis}} is hence inversely related to the popularity of the most common label. If all annotators agree, there is a strong consensus, implying that dis=0\mathbb{H}_{\mathrm{dis}}=0 because maxiPr(yi|x)=1\max\limits_{i}\Pr{}_{\mathbb{H}}(y_{i}|x)=1.

Empirical population entropy.

The empirical dissensus dis\mathbb{H}_{\mathrm{dis}} has the drawback of not factoring in minority opinions: there is a distinction to be made between having the opinions split among a handful of well-supported alternatives versus a total lack of consensus and annotators maximally split across all possible alternatives. To account for such differences, we consider the empirical entropy of opinions (Nie et al., 2020), or

ent=yiYPr(yi|x)logPr(yi|x)\mathbb{H}_{\mathrm{ent}}=-\sum\limits_{y_{i}\in Y}\Pr{}_{\mathbb{H}}(y_{i}|x)\log\Pr{}_{\mathbb{H}}(y_{i}|x) (2)

Entropy measures uncertainty or diversity in the label distribution, better accounting for both dominant and minority labels. As before, ent=0\mathbb{H}_{\mathrm{ent}}=0 when all annotators agree on one label. Contrastingly, dis\mathbb{H}_{\mathrm{dis}} is maximal when PrUnif\Pr_{\mathbb{H}}\sim\mathrm{Unif}, i.e., when annotators are evenly split across all labels.

3.2 Reference-free model-based indicators

Model pool dissensus and model pool entropy.

Given a set of models parametrized by θ1,,θm\theta_{1},\dots,\theta_{m}, we can easily extend the concepts of dissensus (dis\mathbb{H}_{\mathrm{dis}}) and entropy (ent\mathbb{H}_{\mathrm{ent}}) to models’ predictions, instead of relying on human annotators. To do this, we evaluate the predictions of a model θj\theta_{j} by selecting the label argmaxyiYp(yi|x,θj)\operatorname*{argmax}_{y_{i}\in Y}~p(y_{i}|x,\theta_{j}). Next, we define the probability Pr𝕄(yi|x)\Pr_{\mathbb{M}}(y_{i}|x) of this datapoint being labeled as yiy_{i}, by tallying the number of models that predict yiy_{i} as the most likely label:

Pr(yi|x)𝕄=1mj=1m𝟙{yi=argmaxykYp(yk|x,θj)}\Pr{}_{\mathbb{M}}(y_{i}|x)=\frac{1}{m}\sum\limits_{j=1}^{m}\mathbbm{1}\Bigl{\{}y_{i}=\operatorname*{argmax}\limits_{y_{k}\in Y}~p(y_{k}|x,\theta_{j})\Bigr{\}}

Using this distribution, we can analogously define both metrics for the models’ predictions:

𝕄dis\displaystyle\mathbb{M}_{\mathrm{dis}} =1maxyiYPr(yi|x)𝕄\displaystyle=1-\max\limits_{y_{i}\in Y}\Pr{}_{\mathbb{M}}(y_{i}|x) (3)
𝕄ent\displaystyle\mathbb{M}_{\mathrm{ent}} =yiYPr(yi|x)𝕄logPr(yi|x)𝕄\displaystyle=-\sum\limits_{y_{i}\in Y}\Pr{}_{\mathbb{M}}(y_{i}|x)\log\Pr{}_{\mathbb{M}}(y_{i}|x) (4)

Averaged model entropy.

Entropy has also been used to assess the confidence of a model in its own prediction (e.g., Malinin and Gales, 2021; Schröder et al., 2022; Baumler et al., 2023). A reasonable line of thought is that lower confidence scores reflect data complexity. To evaluate the difficulty of labeling xx, we can average the label distribution entropy across multiple models:

𝕄avgent=1mj=1myiY\displaystyle\mathbb{M}_{\mathrm{avg\ ent}}=-\frac{1}{m}\sum\limits_{j=1}^{m}\sum\limits_{y_{i}\in Y} p(yi|x,θj)\displaystyle p(y_{i}|x,\theta_{j})
×logp(yi|x,θj)\displaystyle\times\log p(y_{i}|x,\theta_{j}) (5)

Conformal prediction set size.

A more elaborate statistical estimator than entropy consists in quantifying the ambiguity necessary for a probabilistic classifier to meet a certain statistical guarantee; an approach known as conformal prediction (CP, Vovk et al., 2005; Angelopoulos and Bates, 2022). In practice, we can also use a probabilistic classifier parametrized with θ\theta to derive a set of possible labels 𝒞θ(x)Y\mathcal{C}_{\theta}(x)\subseteq Y for every input xx such that the true label yy^{\ast} is likely to be in 𝒞θ(x)\mathcal{C}_{\theta}(x), with a budget tolerance for failure 1α1-\alpha. Formally, we want to construct a set-valued function 𝒞θ\mathcal{C}_{\theta} such that

xPr(y𝒞θ(x))1α\forall x\qquad\Pr\left(y^{\ast}\in\mathcal{C}_{\theta}(x)\right)\geq 1-\alpha

We can then capture the ambiguity inherent to a prediction by considering the size of the prediction set, |𝒞θ(x)||\mathcal{C}_{\theta}(x)|: a larger CP set size ought to reflect a greater uncertainty as to what the true label is. To convert a probabilistic classifier p(Y|X,θ)p(Y|X,\theta) to such a set-valued classifier, we rely on a least-ambiguous set-valued classifier method (Sadinle et al., 2019). This consists in identifying the value tθt_{\theta} such that, for all calibration datapoints xx^{\prime} with their label yy^{\prime} in a held-out calibration dataset 𝒟cal\mathcal{D}_{\mathrm{cal}}:

q^\displaystyle\hat{q} =|𝒟cal|+1|𝒟cal|(1α)\displaystyle=\frac{|\mathcal{D}_{\mathrm{cal}}|+1}{|\mathcal{D}_{\mathrm{cal}}|}(1-\alpha)
tθ\displaystyle t_{\theta} =sup{t|Pr(p(y|x,θ)t)q^}\displaystyle=\sup\left\{t\middle|\Pr\left(p\left(y^{\prime}|x^{\prime},\theta\right)\geq t\right)\geq\hat{q}\right\}

Using tθt_{\theta}, we can construct the set

𝒞θ(x)={y|p(y|x,θ)tθ}\mathcal{C}_{\theta}(x)=\left\{y~\middle|~p\left(y|x,\theta\right)\geq t_{\theta}\right\}

which provides the expected statistical guarantee. Here, we convert CP sets into uncertainty indicators by considering their average size across models:

𝕄CP=1mi=1m|𝒞θi(x)|\mathbb{M}_{\mathrm{CP}}=\frac{1}{m}\sum\limits_{i=1}^{m}\left|\mathcal{C}_{\theta_{i}}(x)\right| (6)

Here, we experiment with three variants, based on different risk tolerances with α=0.05\alpha=0.05, α=0.1\alpha=0.1 or α=0.2\alpha=0.2. While conformal prediction algorithms require labeled calibration sets 𝒟cal\mathcal{D}_{\mathrm{cal}}, their predictions are made without label information. Hence we consider CP set size indicators to be reference-free, as they can estimate uncertainty for unlabeled datapoints. We use as 𝒟cal\mathcal{D}_{\mathrm{cal}} all other datapoints in the test set (i.e., a leave-one-out process).

3.3 Reference-dependent model-based indicators

Model pool failure rate.

Since it is in principle possible for models to broadly agree on a label that human annotators would not have picked, one value worth considering is the proportion of models that fail to produce the reference label yy^{\ast} we would expect given our annotations. Defining

𝕄failref=1mi=1m𝟙{argmaxyjYp(yj|x,θi)y}\mathbb{M}_{\mathrm{fail}}^{\mathrm{ref}}=\frac{1}{m}\sum\limits_{i=1}^{m}\mathbbm{1}\Bigl{\{}\operatorname*{argmax}_{y_{j}\in Y}p(y_{j}|x,\theta_{i})\neq y^{\ast}\Bigr{\}} (7)

highlights the disconnect between model predictions and human annotations. A low value for 𝕄failref\mathbb{M}_{\mathrm{fail}}^{\mathrm{ref}} implies a strong alignment between the model pool and the human-provided reference label; a high value suggests that many models fail to predict yy^{\ast}.

Early computation termination.

Baldock et al. (2021) propose to estimate the difficulty of an example through the computational cost of a correct prediction. They first compute the hidden representations 𝐡i1,𝐡il\mathbf{h}_{i}^{1},\dots\mathbf{h}_{i}^{l} for a specific input 𝐱i\mathbf{x}_{i} and then assess which of these representations lie in label-specific subspaces using kNN classifiers, since that datapoints that are easier to process ought to be mapped onto unambiguous subspaces earlier.

This approach assumes there is a meaningful distance metric between the different representations — an assumption that is not easy to meet with sequence-level classification tasks, where inputs can have different matrix shapes. We can however leverage the fact that Transformer layers can be viewed as functions mapping from and unto the same space (Elhage et al., 2021): Earlier work has suggested to interpret hidden representations for a specific layer by directly projecting them onto the label-space, skipping over all subsequent layers (nostalgebraist, 2020; Geva et al., 2022). We therefore replace Baldock et al.’s kNN classifiers with the learned classifier head. More formally, if a model parametrized with θi\theta_{i} is made of lil_{i} layers of the form fθi,j(𝐗)=ϕ(𝐗,θi,j)f_{\theta_{i},j}(\mathbf{X})=\phi(\mathbf{X},\theta_{i,j}) and a projection head fθi,proj(𝐗)=argmaxψ(𝐗,θi,li+1)f_{\theta_{i},\mathrm{proj}}(\mathbf{X})=\operatorname*{argmax}\psi(\mathbf{X},\theta_{i,l_{i}+1}), let us denote all early predictions from layer jj onward as

Y^ij={fθi,projfθi,kfθi,1(𝐗)|jkli}\hat{Y}_{ij}=\Bigl{\{}f_{\theta_{i},\mathrm{proj}}\circ f_{\theta_{i},k}\ \circ\dots\circ f_{\theta_{i},1}\left(\mathbf{X}\right)~\Bigm{|}~j\leq k\leq l_{i}\Bigr{\}}

which allows us to retrieve the first layer kk such that all predicts from layer kk to layer ll are correct, according to a reference label yy^{\ast}:

s1stlayerref(θi)\displaystyle\mathrm{s}_{1^{\mathrm{st}}\ \mathrm{layer}}^{\mathrm{ref}}(\theta_{i}) ={1ifp(y|x,θi)yminj{j|Y^ij={y}}l+1otherwise\displaystyle=\begin{cases}1\hfill\mathrm{if}~p(y|x,\theta_{i})\neq y^{\ast}\\ \frac{\min\limits_{j}\left\{j~\middle|~\hat{Y}_{ij}=\{y^{\ast}\}\right\}}{l+1}\quad\mathrm{otherwise}\end{cases}
𝕄1stlayerref\displaystyle\mathbb{M}_{1^{\mathrm{st}}\ \mathrm{layer}}^{\mathrm{ref}} =1mi=1ms1stlayerref(θi)\displaystyle=\frac{1}{m}\sum\limits_{i=1}^{m}\mathrm{s}_{1^{\mathrm{st}}\ \mathrm{layer}}^{\mathrm{ref}}(\theta_{i}) (8)

We average across our pool of models so that the indicator is not too sensitive to one specific model’s idiosyncratic behavior. This also leads us to normalizing according to the number of layers so that we maintain consistent ranges across models with different layer counts. We also make the practical choice of setting examples that models do not label correctly to the higher end of the scale.

Early training termination.

One can also consider that easier items require less training (Swayamdipta et al., 2020). If for a given model θi\theta_{i} we have access to different checkpoints across training θi1,,θip\theta_{i}^{1},\dots,\theta_{i}^{p}, we can simply assess when the model starts making reliable predictions. Consider the set of predictions from all future checkpoints:

Fij={argmaxyp(y|x,θij),,argmaxyp(y|x,θip)}F_{ij}=\left\{\operatorname*{argmax}\limits_{y}p(y|x,\theta_{i}^{j}),~\dots,~\operatorname*{argmax}\limits_{y}p(y|x,\theta_{i}^{p})\right\}

which we use to define:

s1stckptref(θip)\displaystyle\mathrm{s}_{1^{\mathrm{st}}\ \mathrm{ckpt}}^{\mathrm{ref}}(\theta_{i}^{p}) ={1ifp(y|x,θip)yminj{j|Fij={y}}p+1otherwise\displaystyle=\begin{cases}1\hfill\mathrm{if}~p(y|x,\theta_{i}^{p})\neq y^{\ast}\\ \frac{\min\limits_{j}\left\{j~\middle|~F_{ij}=\left\{y^{\ast}\right\}\right\}}{p+1}\quad\mathrm{otherwise}\end{cases}
𝕄1stckptref\displaystyle\mathbb{M}_{1^{\mathrm{st}}\ \mathrm{ckpt}}^{\mathrm{ref}} =1mi=1ms1stckptref(θip)\displaystyle=\frac{1}{m}\sum\limits_{i=1}^{m}\mathrm{s}_{1^{\mathrm{st}}\ \mathrm{ckpt}}^{\mathrm{ref}}(\theta_{i}^{p}) (9)

Here again, we normalize according to the number of checkpoints, average across all models, and manually penalize models that do not ultimately learn to produce the target reference.

Failure rate through training.

We can also assume that easier items are likely to be attributed the expected reference at any stage of training, whereas more complex observations will only be labeled properly during the later stages. We can therefore quantify the proportion of checkpoints where the model failed to produce the expected label yy^{\ast}:

𝕄avgckptref=1mpi=1mj=1p𝟙{p(y|x,θij)y}\mathbb{M}_{\mathrm{avg\ ckpt}}^{\mathrm{ref}}=\frac{1}{mp}\sum\limits_{i=1}^{m}\sum\limits_{j=1}^{p}\mathbbm{1}\left\{p(y|x,\theta_{i}^{j})\neq y^{\ast}\right\} (10)

Again, we average across a pool of models to mitigate idiosyncrasies.

Probability mass through training.

One problem with the approach in eq.˜10 is that it does not distinguish between cases where the classifier correctly predicts yy^{\ast} and assigns no weight to any other options from cases where the probability assigned to yy^{\ast} is only within a small margin from that of an incorrect class. Swayamdipta et al. (2020) propose to consider the probability mass assigned by the classifier across training, or formally:

𝕄avgckptpref=11mpi=1mj=1pp(y|x,θij)\mathbb{M}_{\mathrm{avg\ ckpt\ }p}^{\mathrm{ref}}=1-\frac{1}{mp}\sum\limits_{i=1}^{m}\sum\limits_{j=1}^{p}p(y^{\ast}|x,\theta_{i}^{j}) (11)

Eq. (11) is minimized when the gold label yy^{\ast} is assigned a probability of 1 throughout training.

4 ChaosNLI

4.1 Experimental setup

We first study classifiers trained on SNLI (Bowman et al., 2015) or MNLI (Williams et al., 2018) and evaluated on ChaosNLI (Nie et al., 2020). We might expect the family of models we consider to define our indicators to weigh on results. In particular, the homogeneity of the pool of models considered — in terms of pretraining and fine-tuning data, algorithmic and architectural designs, or parameter counts — is a factor of interest.

Heterogeneous training, similar parameter counts (1B group).

One may expect that data complexity indicators should be established by considering a large swath of models trained in conditions as varied as possible — i.e., using different training data and algorithms. To this end, we consider 5 different LLMs in the 1B parameter range; OLMo (Groeneveld et al., 2024), Pythia (Biderman et al., 2023), Llama 3.2 (Grattafiori et al., 2024), Falcon Almazrouei et al. (2023), and BLOOM (Scao et al., 2023). So as to further maximize the difference across the different models we consider, we partition the NLI training set (either SNLI or MNLI) into five equally sized subsets s1,,s5s_{1},\dots,s_{5} and train one model for each pair of LLM and NLI subset, or 25 classifiers on SNLI and MNLI each.

Homogeneous training data, different parameter counts (<1B group).

Conversely, we might expect that the model pool should be established with a fixed training data — on the one hand, this corresponds to an assumption frequently made when measuring aleatoric uncertainty in the Bayesian literature; on the other hand, we might expect that difficulty should be intimately linked to the data a model has been exposed to. To that tend, we consider a family of smaller BERT-type models (Turc et al., 2019) so as to verify how the indicators in behave with respect to a family of different models trained homogeneously on the same data and under the same conditions, varying in terms of architecture designs and parameter counts. We fine-tune all of Turc et al.’s BERT models on each of the NLI training sets in their entirety.

4.2 Results

Human-based and model-based indicators do not agree with each other.

A straightforward first approach consists in computing how the different indicators correlate with one another — in particular, we start by focusing on comparing human-based indicators to model-based indicators.

<1B pool 1B pool
ent\mathbb{H}_{\mathrm{ent}} dis\mathbb{H}_{\mathrm{dis}} ent\mathbb{H}_{\mathrm{ent}} dis\mathbb{H}_{\mathrm{dis}}
𝕄dis\mathbb{M}_{\mathrm{dis}} 0.244 0020.244\,002 0.217 8810.217\,881 0.194 7490.194\,749 0.177 1770.177\,177
𝕄ent\mathbb{M}_{\mathrm{ent}} 0.278 3970.278\,397 0.243 3380.243\,338 0.218 2920.218\,292 0.197 0000.197\,000
𝕄avgent\mathbb{M}_{\mathrm{avg\ ent}} 0.390 0600.390\,060 0.348 9640.348\,964 0.281 0530.281\,053 0.239 8450.239\,845
𝕄CPα=0.05\mathbb{M}_{\mathrm{CP\ }\alpha=0.05} 0.373 6670.373\,667 0.318 5770.318\,577 0.276 6920.276\,692 0.231 5410.231\,541
𝕄CPα=0.1\mathbb{M}_{\mathrm{CP\ }\alpha=0.1} 0.376 3000.376\,300 0.337 9110.337\,911 0.281 8840.281\,884 0.239 2990.239\,299
𝕄CPα=0.2\mathbb{M}_{\mathrm{CP\ }\alpha=0.2} 0.324 8270.324\,827 0.306 3940.306\,394 0.248 2180.248\,218 0.215 6990.215\,699
𝕄failref\mathbb{M}_{\mathrm{fail}}^{\mathrm{ref}} 0.398 9670.398\,967 0.395 9350.395\,935 0.349 7010.349\,701 0.333 0370.333\,037
𝕄1stlayerref\mathbb{M}_{\mathrm{1^{st}\ layer}}^{\mathrm{ref}} 0.371 8870.371\,887 0.379 5880.379\,588 0.362 3580.362\,358 0.338 6930.338\,693
𝕄1stckptref\mathbb{M}_{\mathrm{1^{st}\ ckpt}}^{\mathrm{ref}} 0.435 6740.435\,674 0.424 4480.424\,448 0.368 1880.368\,188 0.344 3190.344\,319
𝕄avgckptref\mathbb{M}_{\mathrm{avg\ ckpt}}^{\mathrm{ref}} 0.396 9410.396\,941 0.390 4030.390\,403 0.347 6810.347\,681 0.327 3500.327\,350
𝕄avgckptpref\mathbb{M}_{\mathrm{avg\ ckpt\ }p}^{\mathrm{ref}} 0.438 6450.438\,645 0.424 1060.424\,106 0.367 0490.367\,049 0.342 7560.342\,756
Table 1: Spearman correlation between human-based and model-based indicators on SNLI.
<1B pool 1B pool
ent\mathbb{H}_{\mathrm{ent}} dis\mathbb{H}_{\mathrm{dis}} ent\mathbb{H}_{\mathrm{ent}} dis\mathbb{H}_{\mathrm{dis}}
𝕄dis\mathbb{M}_{\mathrm{dis}} 0.002 232-0.002\,232 0.004 482-0.004\,482 0.141 8830.141\,883 0.107 4310.107\,431
𝕄ent\mathbb{M}_{\mathrm{ent}} 0.002 3310.002\,331 0.001 140-0.001\,140 0.158 7330.158\,733 0.120 1480.120\,148
𝕄avgent\mathbb{M}_{\mathrm{avg\ ent}} 0.007 652-0.007\,652 0.015 789-0.015\,789 0.132 8830.132\,883 0.109 5290.109\,529
𝕄CPα=0.05\mathbb{M}_{\mathrm{CP\ }\alpha=0.05} 0.010 0600.010\,060 0.008 535-0.008\,535 0.078 8110.078\,811 0.042 5060.042\,506
𝕄CPα=0.1\mathbb{M}_{\mathrm{CP\ }\alpha=0.1} 0.007 260-0.007\,260 0.017 336-0.017\,336 0.179 7970.179\,797 0.116 3830.116\,383
𝕄CPα=0.2\mathbb{M}_{\mathrm{CP\ }\alpha=0.2} 0.018 384-0.018\,384 0.023 108-0.023\,108 0.158 0520.158\,052 0.093 6210.093\,621
𝕄failref\mathbb{M}_{\mathrm{fail}}^{\mathrm{ref}} 0.117 3760.117\,376 0.150 7910.150\,791 0.172 5860.172\,586 0.224 6180.224\,618
𝕄1stlayerref\mathbb{M}_{\mathrm{1^{st}\ layer}}^{\mathrm{ref}} 0.068 1660.068\,166 0.096 6220.096\,622 0.204 0440.204\,044 0.251 4010.251\,401
𝕄1stckptref\mathbb{M}_{\mathrm{1^{st}\ ckpt}}^{\mathrm{ref}} 0.113 1710.113\,171 0.147 9280.147\,928 0.182 9280.182\,928 0.230 7370.230\,737
𝕄avgckptref\mathbb{M}_{\mathrm{avg\ ckpt}}^{\mathrm{ref}} 0.116 7660.116\,766 0.149 8470.149\,847 0.176 4230.176\,423 0.226 0720.226\,072
𝕄avgckptpref\mathbb{M}_{\mathrm{avg\ ckpt\ }p}^{\mathrm{ref}} 0.109 3850.109\,385 0.143 4120.143\,412 0.181 2640.181\,264 0.230 6700.230\,670
Table 2: Spearman correlation between human-based and model-based indicators on MNLI.

The corresponding Spearman correlation values are shown in Tables˜1 and 2. Reference-free indicators defined without factoring in the majority label among human annotators (eqs.˜3, 4, 5 and 6) almost systematically yield lower correlations than reference-dependent indicators (eqs.˜7, 8, 9, 10 and 11).

Yet, while we observe positive and significant trends throughout, the correlation itself is somewhat low. For a sense of scale, if we are to focus on SNLI for which we observe the highest correlations, two human-based indicators or two reference-dependent indicators, tend to yield correlation scores of ρ0.9\rho\geq 0.9. When comparing two reference-free indicators, we can observe two sub-groups: namely, 𝕄avgent\mathbb{M}_{\mathrm{avg\ ent}} and the CP set size indicators yield correlations of ρ0.9\rho\geq 0.9),111 Except 𝕄CPα=0.05\mathbb{M}_{\mathrm{CP\ }\alpha=0.05} and 𝕄CPα=0.2\mathbb{M}_{\mathrm{CP\ }\alpha=0.2}, where ρ0.80\rho\approx 0.80. whereas 𝕄dis\mathbb{M}_{\mathrm{dis}} and 𝕄ent\mathbb{M}_{\mathrm{ent}} yield a correlation of ρ0.95\rho\approx 0.95, and comparisons across these two sub-groups are in the range 0.64<ρ<0.880.64<\rho<0.88. The observation also holds on MNLI: We observe a correlation of ρ0.90\rho\approx 0.90 for dis\mathbb{H}_{\mathrm{dis}} and ent\mathbb{H}_{\mathrm{ent}}, correlations systematically greater than ρ0.9\rho\geq 0.9 between any two reference-dependent indicators, and correlations between 0.46ρ0.960.46\leq\rho\leq 0.96 for reference-free indicators (with again 𝕄dis\mathbb{M}_{\mathrm{dis}} and 𝕄ent\mathbb{M}_{\mathrm{ent}} forming a subgroup distinct from 𝕄CP\mathbb{M}_{\mathrm{CP}} and 𝕄avgent\mathbb{M}_{\mathrm{avg\ ent}}). In sum, all three groups of indicators portray different pictures, echoing findings from prior works (esp. Pavlick and Kwiatkowski, 2019): The difficulty associated to the samples is not the same for the humans and models, regardless of the pool considered.222 We can stress this relationship is non-linear, see §B.1.

The behavior of model-based indicators also appears contingent on the exact setup. For instance, observations derived from our 1B model pool on MNLI would suggest 𝕄CPα=0.1\mathbb{M}_{\mathrm{CP\ }\alpha=0.1} to be quite in line with human label variation assessments — whereas the corresponding coefficient in the <1B pool on MNLI is about 0. In the same vein, the choice of α\alpha for CP has different effects on SNLI and MNLI insofar the 1B pool is concerned: Whereas 𝕄CPα=0.2\mathbb{M}_{\mathrm{CP\ }\alpha=0.2} yields higher results than 𝕄CPα=0.05\mathbb{M}_{\mathrm{CP\ }\alpha=0.05} on MNLI, the opposite is true for SNLI classifiers.

Refer to caption
Figure 1: Example of joint distribution between a reference-free and a reference-dependent indicator (SNLI 1B pool, 𝕄CP,α=0.05\mathbb{M}_{\mathrm{CP,\ }\alpha=0.05} vs. 𝕄1stlayerref\mathbb{M}_{1^{\mathrm{st}}\mathrm{\ layer}}^{\mathrm{ref}}). Datapoints in orange are misclassified by 50%50\% of the pool, blue datapoints aren’t. See also tables˜8 and 9B.2).

Reference-free indicators conflate model success and model failure.

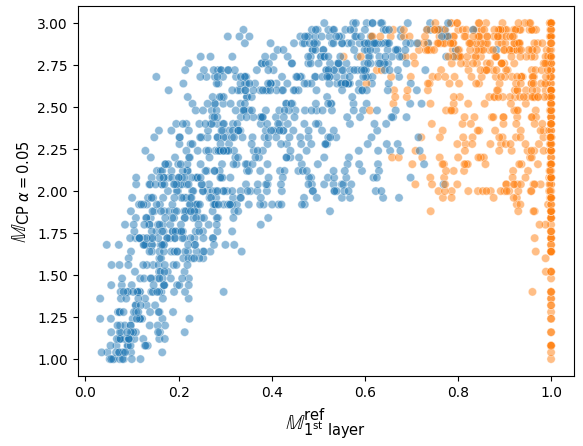
We can also remark that reference-free and reference-dependent indicators do not agree either. This is evident, for instance, by looking at Figure˜1, which exemplifies one such comparison. We can see that the joint distribution of the indicators forms an inverted U-shape distribution, i.e., the reference-free indicator rates as equally good items that the reference-dependent does discriminates. Generally speaking, reference-free indicators tend to assign similar scores to datapoints rated as either maximal or minimal by reference-dependent indicators: In fact, if we partition datapoints according to whether a majority of the models fail to predict the annotator majority label (corresponding to the orange and blue hues in Figure˜1), we can observe systematic anti-correlations when the models do tend to fail.333 See in Tables 8 and 9 in §B.2 for detailed results. One major factor at play here is that models fail more often on samples with a high human dissensus. This can be shown with Mann-Whitney U tests. On SNLI, for the 1B models, we observe a pp-value of p<1027p<10^{-27} and a common language effect size f=66.7%f=66.7\%; as for the <1B models, we have p<1042p<10^{-42}, f=72.2%f=72.2\%. On MNLI, the 1B model pool yields p<1014p<10^{-14} and f=61.3%f=61.3\%, whereas the <1B pool yields p<107p<10^{-7} and f=58.1%f=58.1\%.444 Conversely, we can still identify a small subset of datapoints with low human dissensus but high model failure rates.

5 DynaSent

5.1 Experimental setup

An overlooked aspect of our discussion so far is whether the discrepancy between indicators highlighted in §4 can be mitigated. Since we trained our classifiers to match the consensus among annotators, any probability mass not assigned to the majority label is penalized. As a result, classifiers default to assigning most of their probability mass to a single label. That is, they may be poorly calibrated in the sense of Guo et al. (2017), and the probabilities that they assign might not reflect the probability of the model being correct. As Baan et al. (2022) discuss, measuring calibration for ambiguous labels is not possible in practice as metrics such as ECE explicitly assume the existence of a single valid label. Baan et al. instead advocate to measure how well the model’s distribution aligns with human label variation.555 This is similar to what we present in Tables 1 and 2. We thus expect that directly optimizing the classifiers to match the empirical human label variation will remedy this issue. We refer to this approach as training with ‘soft’ continuous labels, instead of ‘hard’ categorical labels.

For these experiments we use DynaSent (Potts et al., 2021), which also allows us to assess whether out results generalize beyond NLI. DynaSent is a sentiment analysis dataset built incrementally through several rounds of adversarial data collection, featuring four sentiment classes: positive, negative, neutral or mixed. Each datapoint is annotated by five crowd-workers, providing a first-order approximation of human label variation. We focus on the round 1 data to train classifiers using either hard or soft labels as targets. A potential challenge is label imbalance, which has been linked to example difficulty (Ho and Basu, 2002; cf. §B.4). Therefore, we convert the dataset to a ternary label scheme by removing all datapoints that at least one annotator marked as ‘mixed,’ then subsample the dataset to guarantee an equal distribution of positive, neutral and negative labels. This re-balancing procedure severely limits the size of our dataset to roughly 32K training instances (see §A.1). We report results on this re-balanced dataset, using the same PLM pools as in our previous experiments. Given the limited data, we train 1B pool models on the full dataset, and report results across 3 runs, whereas we only train 1 seed for each of the 24 models from Turc et al. (2019) in our homogeneous pool.

5.2 Results

<1B pool 1B pool
soft hard soft hard
𝕄dis\mathbb{M}_{\mathrm{dis}} 0.067 9470.067\,947 0.065 4040.065\,404 0.155 3060.155\,306 0.143 4570.143\,457
𝕄ent\mathbb{M}_{\mathrm{ent}} 0.070 8050.070\,805 0.063 0820.063\,082 0.160 5560.160\,556 0.146 3130.146\,313
𝕄avgent\mathbb{M}_{\mathrm{avg\ ent}} 0.139 5250.139\,525 0.126 5540.126\,554 0.199 5740.199\,574 0.120 5750.120\,575
𝕄CPα=0.05\mathbb{M}_{\mathrm{CP\ }\alpha=0.05} 0.122 3100.122\,310 0.107 4920.107\,492 0.190 4270.190\,427 0.138 6340.138\,634
𝕄CPα=0.1\mathbb{M}_{\mathrm{CP\ }\alpha=0.1} 0.117 7450.117\,745 0.099 7800.099\,780 0.183 5880.183\,588 0.134 9140.134\,914
𝕄CPα=0.2\mathbb{M}_{\mathrm{CP\ }\alpha=0.2} 0.109 9550.109\,955 0.081 2900.081\,290 0.087 108-0.087\,108 0.126 243-0.126\,243
𝕄failref\mathbb{M}_{\mathrm{fail}}^{\mathrm{ref}} 0.128 6210.128\,621 0.115 6340.115\,634 0.185 8030.185\,803 0.176 3650.176\,365
𝕄1stlayerref\mathbb{M}_{\mathrm{1^{st}\ layer}}^{\mathrm{ref}} 0.131 8550.131\,855 0.123 5110.123\,511 0.201 6080.201\,608 0.192 8330.192\,833
𝕄1stckptref\mathbb{M}_{\mathrm{1^{st}\ ckpt}}^{\mathrm{ref}} 0.131 3100.131\,310 0.113 6660.113\,666 0.201 5670.201\,567 0.190 6520.190\,652
𝕄avgckptref\mathbb{M}_{\mathrm{avg\ ckpt}}^{\mathrm{ref}} 0.126 8320.126\,832 0.113 3020.113\,302 0.186 4920.186\,492 0.177 9960.177\,996
𝕄avgckptpref\mathbb{M}_{\mathrm{avg\ ckpt\ }p}^{\mathrm{ref}} 0.150 4180.150\,418 0.135 9610.135\,961 0.225 6740.225\,674 0.189 2740.189\,274
Table 3: Spearman’s ρ\rho between model-based indicators vs. human-based (entropy) indicator on DynaSent.

Table˜3 summarizes the correlation between model-based and human-based indicators on Dynasent. Due to the dataset’s structure—specifically the limited number of annotations per datapoint and their majority label selection—ent\mathbb{H}_{\mathrm{ent}} and dis\mathbb{H}_{\mathrm{dis}} are perfectly correlated. We replicate observations made for NLI in §4: When training the classifiers using hard labels, we observe a clear divide between reference-free and reference-dependent indicators.

Using soft labels yields obvious improvements for some of the reference-free indicators: In particular 𝕄CP\mathbb{M}_{\mathrm{CP}} and 𝕄avgent\mathbb{M}_{\mathrm{avg\ ent}} are in some case competitive with reference-dependent metrics. It is however crucial to highlight that results remain volatile, as attested by the anti-correlations yielded by 𝕄CPα=0.2\mathbb{M}_{\mathrm{CP\ }\alpha=0.2};666 There are several possibility as to what causes this unexpected pattern for 𝕄CPα=0.2\mathbb{M}_{\mathrm{CP\ }\alpha=0.2}; we consider in particular the small size of the dataset as the behavior is not reproduced when training on the non-subsampled dataset, cf. §B.4. remark also that the optimal risk tolerance α\alpha we observe on DynaSent is 0.050.05, instead of 0.10.1 as we observed for NLI models. Nor is the gap between reference-free and reference-dependent metrics fully mitigated: In all cases, the reference-dependent indicator 𝕄avgckptpref\mathbb{M}_{\mathrm{avg~ckpt~}p}^{\mathrm{ref}} outperforms all other indicators. Taking stock of which indicators strongly benefit from soft-label trainings (viz. 𝕄CP\mathbb{M}_{\mathrm{CP}}, 𝕄avgent\mathbb{M}_{\mathrm{avg\ ent}} and 𝕄avgckptpref\mathbb{M}_{\mathrm{avg~ckpt~}p}^{\mathrm{ref}}), we remark that they are derived from the probability distribution, rather than its argmax. Soft labels foster distributions that are more in line with human label variation, but this might not suffice to fully bridge the gap between reference-free and reference-dependent indicators.777 This is also in line with the fact that reference-free indicators derived from classifiers trained on soft labels still conflate success and failure, as shown in §B.2, Table 10.

6 Discussion

Our study of how different indicators of data complexity correlate to one another has shown a somewhat perplexing picture worth diving into. As we have established, model-based indicators align poorly with human-based indicators — while we often observe positive correlations, their magnitudes are low. Defining model-based indicators with respect to human majority labels partially narrows the gap between the two, primarily because reference-free indicators often converge on a single label, regardless of its alignment with human preferences or the strength of consensus within the annotator pool. Within the reference-free indicators, we can also tentatively distinguish two subgroups: assessments that rely only on the pool of models considered (eqs.˜3 and 4) appear to have a distinct profile from those which rely on more complex statistics, such as CP set sizes or entropy (eqs.˜5 and 6). For CP specifically, it is worth stressing that desiderata in terms of coverage can also entail significant variability.

Training classifiers to directly predict human label variation does not fully bridge the gap between reference-free and reference-dependent indicators, and only improves correlations with human assessment for indicators that do not summarize an model’s distribution to its argmax. Models often overwhelmingly agree on labels that lack humans annotator consensus, and factoring in human preferences in indicators is necessary though not sufficient for bridging the gap between human-based and model-based assessments difficulty. This underscores a critical limitation of the current research landscape: Reference-free approaches such as CP or entropy are at odds with reference-dependent approaches (e.g., Swayamdipta et al., 2020; Baldock et al., 2021), in that the former conflate failures and successes.888 A related train of thought that can shed more light on our observations consists in considering which factors shape model decisions. See §B.3 for a discussion.

Practical engineering recommendations also emerge from our observations. Authors interested in developing automated assessments of data complexity in line with human assessments should favor (i) training models on soft labels, (ii) factoring in the actual probability distribution of the model, and (iii) leveraging the human label distribution, e.g., through the majority label.

In all, the present observations highlight a disconnect in the current literature. If data uncertainty is to be accounted for by factors such as noise, ambiguity or label overlap during data collection — factors that we also expect to weigh in on measurements of linguistic disagreement — then there is a need to reconcile this line of thought with the limited predictability of model-based assessments of data complexity from annotators’ preferences.

7 Conclusions

We present a study with 11 indicators and 29 models, which show that human-based assessments of difficulty need not align with model-based assessments (Pavlick and Kwiatkowski, 2019) and that model-based assessments exhibit stark differences according to whether they factor in human preferences. Data complexity and annotator disagreements, as assessed by model-based indicators or annotator label distribution, have clearly distinct behaviors, despite the overlap the literature posits (Lalor et al., 2018). This calls for replication of our study in other settings, other tasks, other languages, etc.: Establishing the prevalence of the confound we identify remains a topic for future work.

Lastly, our findings also question practices adopted by the field. If we are to posit a sharp distinction between data complexity as exemplified by Swayamdipta et al. (2020) or Baldock et al. (2021), vs. uncertainty as captured by e.g. conformal prediction methods, then we need to explain why said data complexity is more in line with annotator disagreement than CP-based estimates of uncertainty. Likewise, model-based estimates used in active learning (e.g. Schröder et al., 2022; Baumler et al., 2023) do not align with all definitions of uncertainty, especially label uncertainty as assessed through inter-annotator agreements. Such an exercise in terminology is a necessary step forward if we are to address challenges such as disentangling sources of uncertainty (Mucsányi et al., 2024) or leveraging uncertainty as a richer training signal (Basile et al., 2021; Palomaki et al., 2018).

Acknowledgements

This work was supported by the ICT 2023 project “Uncertainty-aware neural language models” funded by the Academy of Finland (grant agreement № 345999).

Limitations

We identify two core limitations on our findings.

First, the present study relies on two datasets, namely the ChaosNLI re-annotation by Nie et al. (2020) and the DynaSent dataset of Potts et al. (2021). While this limits the usefulness of our findings, and entails that our results might not carry on to other setups, we believe this choice is practically necessary (in that very few datasets are available with a training split large enough to easily train classifiers). It is in fact debatable whether DynaSent squarely meets all desiderata, since its validation split might not contain a rich enough set of annotations to accurately capture human label variation: DynaSent only collects five judgments from crowd workers, which Nie et al. (2020) shows to be unreliable. On a practical level, this also means that there are many human-based indicators that we have ignored; e.g., the ‘complicated’ label of Jiang and de Marneffe (2022) or other explicit self-reports of uncertainty from the annotators could yield valuable insight that would contrast with the label distribution–based indicators we consider in eqs.˜1 and 2. Of course, all studies need to define their scope: In our case, more can always be done to integrate other data uncertainty/difficulty indicators from a wider range of studies, beyond the key ones we study here (viz. Nie et al., 2020; Vovk et al., 2005; Baldock et al., 2021; Swayamdipta et al., 2020).

Second, we rely on pool of models that have not been individually optimized for the task they are tested on. This point bears further discussion: As we identify in Table˜7, a major driver of the difference between reference-free and reference-dependent indicators is whether or not the classifier correctly identifies the gold label; and it therefore stands to reason that better trained classifiers may exhibit different patterns. There are however three key facts to stress here. First, hyperparameter tuning over a large pool of models (24 BERT variants from (Turc et al., 2019), plus 25 1B PLMs–based classifiers, on three different datasets) is computationally prohibitive and would actively hinder the reproducibility of our experiments, which justifies the practice of limiting hyperparameter searches. Second, our discussion pertains to the general usefulness of the indicators, rather than the fitness of the models — or in other words, it is reasonable to expect of indicators of data complexity that they be robust enough to be deployed with less-than-top-of-the-leaderboard models. Third, going by Table˜7, the main driver for the limited correlation between the different groups of model-based indicators is their failure, i.e., the main insight is that we would observe higher correlations if the models never failed, which is not a very realistic standard to expect from NLP systems. While we believe this justifies our approach, it is quite plausible that the exact results as reported here would shift towards higher correlations with human assessments should the models reach higher accuracy scores.

References

  • Almazrouei et al. (2023) Ebtesam Almazrouei, Hamza Alobeidli, Abdulaziz Alshamsi, Alessandro Cappelli, Ruxandra Cojocaru, Mérouane Debbah, Étienne Goffinet, Daniel Hesslow, Julien Launay, Quentin Malartic, Daniele Mazzotta, Badreddine Noune, Baptiste Pannier, and Guilherme Penedo. 2023. The falcon series of open language models. Preprint, arXiv:2311.16867.
  • Angelopoulos and Bates (2022) Anastasios N. Angelopoulos and Stephen Bates. 2022. A gentle introduction to conformal prediction and distribution-free uncertainty quantification. Preprint, arXiv:2107.07511.
  • Aroyo and Welty (2015) Lora Aroyo and Chris Welty. 2015. Truth is a lie: Crowd truth and the seven myths of human annotation. AI Magazine, 36(1):15–24.
  • Baan et al. (2022) Joris Baan, Wilker Aziz, Barbara Plank, and Raquel Fernandez. 2022. Stop measuring calibration when humans disagree. pages 1892–1915, Abu Dhabi, United Arab Emirates.
  • Baan et al. (2023) Joris Baan, Nico Daheim, Evgenia Ilia, Dennis Ulmer, Haau-Sing Li, Raquel Fernández, Barbara Plank, Rico Sennrich, Chrysoula Zerva, and Wilker Aziz. 2023. Uncertainty in natural language generation: From theory to applications. Preprint, arXiv:2307.15703.
  • Baldock et al. (2021) Robert John Nicholas Baldock, Hartmut Maennel, and Behnam Neyshabur. 2021. Deep learning through the lens of example difficulty. In Advances in Neural Information Processing Systems.
  • Basile et al. (2021) Valerio Basile, Michael Fell, Tommaso Fornaciari, Dirk Hovy, Silviu Paun, Barbara Plank, Massimo Poesio, and Alexandra Uma. 2021. We need to consider disagreement in evaluation. pages 15–21, Online.
  • Baumler et al. (2023) Connor Baumler, Anna Sotnikova, and Hal Daumé III. 2023. Which examples should be multiply annotated? active learning when annotators may disagree. pages 10352–10371, Toronto, Canada.
  • Beigman and Beigman Klebanov (2009) Eyal Beigman and Beata Beigman Klebanov. 2009. Learning with annotation noise. pages 280–287, Suntec, Singapore.
  • Biderman et al. (2023) Stella Biderman, Hailey Schoelkopf, Quentin Anthony, Herbie Bradley, Kyle O’Brien, Eric Hallahan, Mohammad Aflah Khan, Shivanshu Purohit, USVSN Sai Prashanth, Edward Raff, Aviya Skowron, Lintang Sutawika, and Oskar Van Der Wal. 2023. Pythia: a suite for analyzing large language models across training and scaling. In Proceedings of the 40th International Conference on Machine Learning, ICML’23. JMLR.org.
  • Bowman et al. (2015) Samuel R. Bowman, Gabor Angeli, Christopher Potts, and Christopher D. Manning. 2015. A large annotated corpus for learning natural language inference. pages 632–642, Lisbon, Portugal.
  • Elhage et al. (2021) Nelson Elhage, Neel Nanda, Catherine Olsson, Tom Henighan, Nicholas Joseph, Ben Mann, Amanda Askell, Yuntao Bai, Anna Chen, Tom Conerly, Nova DasSarma, Dawn Drain, Deep Ganguli, Zac Hatfield-Dodds, Danny Hernandez, Andy Jones, Jackson Kernion, Liane Lovitt, Kamal Ndousse, Dario Amodei, Tom Brown, Jack Clark, Jared Kaplan, Sam McCandlish, and Chris Olah. 2021. A mathematical framework for transformer circuits.
  • Fornaciari et al. (2021) Tommaso Fornaciari, Alexandra Uma, Silviu Paun, Barbara Plank, Dirk Hovy, and Massimo Poesio. 2021. Beyond black & white: Leveraging annotator disagreement via soft-label multi-task learning. pages 2591–2597, Online.
  • Gawlikowski et al. (2023) Jakob Gawlikowski, Cedrique Rovile Njieutcheu Tassi, Mohsin Ali, Jongseok Lee, Matthias Humt, Jianxiang Feng, Anna Kruspe, Rudolph Triebel, Peter Jung, Ribana Roscher, Muhammad Shahzad, Wen Yang, Richard Bamler, and Xiao Xiang Zhu. 2023. A survey of uncertainty in deep neural networks. Artificial Intelligence Review, 56(1):1513–1589.
  • Geng et al. (2024) Jiahui Geng, Fengyu Cai, Yuxia Wang, Heinz Koeppl, Preslav Nakov, and Iryna Gurevych. 2024. A survey of confidence estimation and calibration in large language models. pages 6577–6595, Mexico City, Mexico.
  • Geva et al. (2022) Mor Geva, Avi Caciularu, Kevin Wang, and Yoav Goldberg. 2022. Transformer feed-forward layers build predictions by promoting concepts in the vocabulary space. pages 30–45, Abu Dhabi, United Arab Emirates.
  • Grattafiori et al. (2024) Aaron Grattafiori, Abhimanyu Dubey, Abhinav Jauhri, Abhinav Pandey, Abhishek Kadian, Ahmad Al-Dahle, Aiesha Letman, Akhil Mathur, Alan Schelten, Alex Vaughan, Amy Yang, Angela Fan, Anirudh Goyal, Anthony Hartshorn, Aobo Yang, Archi Mitra, Archie Sravankumar, Artem Korenev, Arthur Hinsvark, Arun Rao, Aston Zhang, Aurelien Rodriguez, Austen Gregerson, Ava Spataru, Baptiste Roziere, Bethany Biron, Binh Tang, Bobbie Chern, Charlotte Caucheteux, Chaya Nayak, Chloe Bi, Chris Marra, Chris McConnell, Christian Keller, Christophe Touret, Chunyang Wu, Corinne Wong, Cristian Canton Ferrer, Cyrus Nikolaidis, Damien Allonsius, Daniel Song, Danielle Pintz, Danny Livshits, Danny Wyatt, David Esiobu, Dhruv Choudhary, Dhruv Mahajan, Diego Garcia-Olano, Diego Perino, Dieuwke Hupkes, Egor Lakomkin, Ehab AlBadawy, Elina Lobanova, Emily Dinan, Eric Michael Smith, Filip Radenovic, Francisco Guzmán, Frank Zhang, Gabriel Synnaeve, Gabrielle Lee, Georgia Lewis Anderson, Govind Thattai, Graeme Nail, Gregoire Mialon, Guan Pang, Guillem Cucurell, Hailey Nguyen, Hannah Korevaar, Hu Xu, Hugo Touvron, Iliyan Zarov, Imanol Arrieta Ibarra, Isabel Kloumann, Ishan Misra, Ivan Evtimov, Jack Zhang, Jade Copet, Jaewon Lee, Jan Geffert, Jana Vranes, Jason Park, Jay Mahadeokar, Jeet Shah, Jelmer van der Linde, Jennifer Billock, Jenny Hong, Jenya Lee, Jeremy Fu, Jianfeng Chi, Jianyu Huang, Jiawen Liu, Jie Wang, Jiecao Yu, Joanna Bitton, Joe Spisak, Jongsoo Park, Joseph Rocca, Joshua Johnstun, Joshua Saxe, Junteng Jia, Kalyan Vasuden Alwala, Karthik Prasad, Kartikeya Upasani, Kate Plawiak, Ke Li, Kenneth Heafield, Kevin Stone, Khalid El-Arini, Krithika Iyer, Kshitiz Malik, Kuenley Chiu, Kunal Bhalla, Kushal Lakhotia, Lauren Rantala-Yeary, Laurens van der Maaten, Lawrence Chen, Liang Tan, Liz Jenkins, Louis Martin, Lovish Madaan, Lubo Malo, Lukas Blecher, Lukas Landzaat, Luke de Oliveira, Madeline Muzzi, Mahesh Pasupuleti, Mannat Singh, Manohar Paluri, Marcin Kardas, Maria Tsimpoukelli, Mathew Oldham, Mathieu Rita, Maya Pavlova, Melanie Kambadur, Mike Lewis, Min Si, Mitesh Kumar Singh, Mona Hassan, Naman Goyal, Narjes Torabi, Nikolay Bashlykov, Nikolay Bogoychev, Niladri Chatterji, Ning Zhang, Olivier Duchenne, Onur Çelebi, Patrick Alrassy, Pengchuan Zhang, Pengwei Li, Petar Vasic, Peter Weng, Prajjwal Bhargava, Pratik Dubal, Praveen Krishnan, Punit Singh Koura, Puxin Xu, Qing He, Qingxiao Dong, Ragavan Srinivasan, Raj Ganapathy, Ramon Calderer, Ricardo Silveira Cabral, Robert Stojnic, Roberta Raileanu, Rohan Maheswari, Rohit Girdhar, Rohit Patel, Romain Sauvestre, Ronnie Polidoro, Roshan Sumbaly, Ross Taylor, Ruan Silva, Rui Hou, Rui Wang, Saghar Hosseini, Sahana Chennabasappa, Sanjay Singh, Sean Bell, Seohyun Sonia Kim, Sergey Edunov, Shaoliang Nie, Sharan Narang, Sharath Raparthy, Sheng Shen, Shengye Wan, Shruti Bhosale, Shun Zhang, Simon Vandenhende, Soumya Batra, Spencer Whitman, Sten Sootla, Stephane Collot, Suchin Gururangan, Sydney Borodinsky, Tamar Herman, Tara Fowler, Tarek Sheasha, Thomas Georgiou, Thomas Scialom, Tobias Speckbacher, Todor Mihaylov, Tong Xiao, Ujjwal Karn, Vedanuj Goswami, Vibhor Gupta, Vignesh Ramanathan, Viktor Kerkez, Vincent Gonguet, Virginie Do, Vish Vogeti, Vítor Albiero, Vladan Petrovic, Weiwei Chu, Wenhan Xiong, Wenyin Fu, Whitney Meers, Xavier Martinet, Xiaodong Wang, Xiaofang Wang, Xiaoqing Ellen Tan, Xide Xia, Xinfeng Xie, Xuchao Jia, Xuewei Wang, Yaelle Goldschlag, Yashesh Gaur, Yasmine Babaei, Yi Wen, Yiwen Song, Yuchen Zhang, Yue Li, Yuning Mao, Zacharie Delpierre Coudert, Zheng Yan, Zhengxing Chen, Zoe Papakipos, Aaditya Singh, Aayushi Srivastava, Abha Jain, Adam Kelsey, Adam Shajnfeld, Adithya Gangidi, Adolfo Victoria, Ahuva Goldstand, Ajay Menon, Ajay Sharma, Alex Boesenberg, Alexei Baevski, Allie Feinstein, Amanda Kallet, Amit Sangani, Amos Teo, Anam Yunus, Andrei Lupu, Andres Alvarado, Andrew Caples, Andrew Gu, Andrew Ho, Andrew Poulton, Andrew Ryan, Ankit Ramchandani, Annie Dong, Annie Franco, Anuj Goyal, Aparajita Saraf, Arkabandhu Chowdhury, Ashley Gabriel, Ashwin Bharambe, Assaf Eisenman, Azadeh Yazdan, Beau James, Ben Maurer, Benjamin Leonhardi, Bernie Huang, Beth Loyd, Beto De Paola, Bhargavi Paranjape, Bing Liu, Bo Wu, Boyu Ni, Braden Hancock, Bram Wasti, Brandon Spence, Brani Stojkovic, Brian Gamido, Britt Montalvo, Carl Parker, Carly Burton, Catalina Mejia, Ce Liu, Changhan Wang, Changkyu Kim, Chao Zhou, Chester Hu, Ching-Hsiang Chu, Chris Cai, Chris Tindal, Christoph Feichtenhofer, Cynthia Gao, Damon Civin, Dana Beaty, Daniel Kreymer, Daniel Li, David Adkins, David Xu, Davide Testuggine, Delia David, Devi Parikh, Diana Liskovich, Didem Foss, Dingkang Wang, Duc Le, Dustin Holland, Edward Dowling, Eissa Jamil, Elaine Montgomery, Eleonora Presani, Emily Hahn, Emily Wood, Eric-Tuan Le, Erik Brinkman, Esteban Arcaute, Evan Dunbar, Evan Smothers, Fei Sun, Felix Kreuk, Feng Tian, Filippos Kokkinos, Firat Ozgenel, Francesco Caggioni, Frank Kanayet, Frank Seide, Gabriela Medina Florez, Gabriella Schwarz, Gada Badeer, Georgia Swee, Gil Halpern, Grant Herman, Grigory Sizov, Guangyi, Zhang, Guna Lakshminarayanan, Hakan Inan, Hamid Shojanazeri, Han Zou, Hannah Wang, Hanwen Zha, Haroun Habeeb, Harrison Rudolph, Helen Suk, Henry Aspegren, Hunter Goldman, Hongyuan Zhan, Ibrahim Damlaj, Igor Molybog, Igor Tufanov, Ilias Leontiadis, Irina-Elena Veliche, Itai Gat, Jake Weissman, James Geboski, James Kohli, Janice Lam, Japhet Asher, Jean-Baptiste Gaya, Jeff Marcus, Jeff Tang, Jennifer Chan, Jenny Zhen, Jeremy Reizenstein, Jeremy Teboul, Jessica Zhong, Jian Jin, Jingyi Yang, Joe Cummings, Jon Carvill, Jon Shepard, Jonathan McPhie, Jonathan Torres, Josh Ginsburg, Junjie Wang, Kai Wu, Kam Hou U, Karan Saxena, Kartikay Khandelwal, Katayoun Zand, Kathy Matosich, Kaushik Veeraraghavan, Kelly Michelena, Keqian Li, Kiran Jagadeesh, Kun Huang, Kunal Chawla, Kyle Huang, Lailin Chen, Lakshya Garg, Lavender A, Leandro Silva, Lee Bell, Lei Zhang, Liangpeng Guo, Licheng Yu, Liron Moshkovich, Luca Wehrstedt, Madian Khabsa, Manav Avalani, Manish Bhatt, Martynas Mankus, Matan Hasson, Matthew Lennie, Matthias Reso, Maxim Groshev, Maxim Naumov, Maya Lathi, Meghan Keneally, Miao Liu, Michael L. Seltzer, Michal Valko, Michelle Restrepo, Mihir Patel, Mik Vyatskov, Mikayel Samvelyan, Mike Clark, Mike Macey, Mike Wang, Miquel Jubert Hermoso, Mo Metanat, Mohammad Rastegari, Munish Bansal, Nandhini Santhanam, Natascha Parks, Natasha White, Navyata Bawa, Nayan Singhal, Nick Egebo, Nicolas Usunier, Nikhil Mehta, Nikolay Pavlovich Laptev, Ning Dong, Norman Cheng, Oleg Chernoguz, Olivia Hart, Omkar Salpekar, Ozlem Kalinli, Parkin Kent, Parth Parekh, Paul Saab, Pavan Balaji, Pedro Rittner, Philip Bontrager, Pierre Roux, Piotr Dollar, Polina Zvyagina, Prashant Ratanchandani, Pritish Yuvraj, Qian Liang, Rachad Alao, Rachel Rodriguez, Rafi Ayub, Raghotham Murthy, Raghu Nayani, Rahul Mitra, Rangaprabhu Parthasarathy, Raymond Li, Rebekkah Hogan, Robin Battey, Rocky Wang, Russ Howes, Ruty Rinott, Sachin Mehta, Sachin Siby, Sai Jayesh Bondu, Samyak Datta, Sara Chugh, Sara Hunt, Sargun Dhillon, Sasha Sidorov, Satadru Pan, Saurabh Mahajan, Saurabh Verma, Seiji Yamamoto, Sharadh Ramaswamy, Shaun Lindsay, Shaun Lindsay, Sheng Feng, Shenghao Lin, Shengxin Cindy Zha, Shishir Patil, Shiva Shankar, Shuqiang Zhang, Shuqiang Zhang, Sinong Wang, Sneha Agarwal, Soji Sajuyigbe, Soumith Chintala, Stephanie Max, Stephen Chen, Steve Kehoe, Steve Satterfield, Sudarshan Govindaprasad, Sumit Gupta, Summer Deng, Sungmin Cho, Sunny Virk, Suraj Subramanian, Sy Choudhury, Sydney Goldman, Tal Remez, Tamar Glaser, Tamara Best, Thilo Koehler, Thomas Robinson, Tianhe Li, Tianjun Zhang, Tim Matthews, Timothy Chou, Tzook Shaked, Varun Vontimitta, Victoria Ajayi, Victoria Montanez, Vijai Mohan, Vinay Satish Kumar, Vishal Mangla, Vlad Ionescu, Vlad Poenaru, Vlad Tiberiu Mihailescu, Vladimir Ivanov, Wei Li, Wenchen Wang, Wenwen Jiang, Wes Bouaziz, Will Constable, Xiaocheng Tang, Xiaojian Wu, Xiaolan Wang, Xilun Wu, Xinbo Gao, Yaniv Kleinman, Yanjun Chen, Ye Hu, Ye Jia, Ye Qi, Yenda Li, Yilin Zhang, Ying Zhang, Yossi Adi, Youngjin Nam, Yu, Wang, Yu Zhao, Yuchen Hao, Yundi Qian, Yunlu Li, Yuzi He, Zach Rait, Zachary DeVito, Zef Rosnbrick, Zhaoduo Wen, Zhenyu Yang, Zhiwei Zhao, and Zhiyu Ma. 2024. The llama 3 herd of models. Preprint, arXiv:2407.21783.
  • Groeneveld et al. (2024) Dirk Groeneveld, Iz Beltagy, Evan Walsh, Akshita Bhagia, Rodney Kinney, Oyvind Tafjord, Ananya Jha, Hamish Ivison, Ian Magnusson, Yizhong Wang, Shane Arora, David Atkinson, Russell Authur, Khyathi Chandu, Arman Cohan, Jennifer Dumas, Yanai Elazar, Yuling Gu, Jack Hessel, Tushar Khot, William Merrill, Jacob Morrison, Niklas Muennighoff, Aakanksha Naik, Crystal Nam, Matthew Peters, Valentina Pyatkin, Abhilasha Ravichander, Dustin Schwenk, Saurabh Shah, William Smith, Emma Strubell, Nishant Subramani, Mitchell Wortsman, Pradeep Dasigi, Nathan Lambert, Kyle Richardson, Luke Zettlemoyer, Jesse Dodge, Kyle Lo, Luca Soldaini, Noah Smith, and Hannaneh Hajishirzi. 2024. OLMo: Accelerating the science of language models. pages 15789–15809, Bangkok, Thailand.
  • Guo et al. (2017) Chuan Guo, Geoff Pleiss, Yu Sun, and Kilian Q. Weinberger. 2017. On calibration of modern neural networks. In Proceedings of the 34th International Conference on Machine Learning, volume 70 of Proceedings of Machine Learning Research, pages 1321–1330. PMLR.
  • Hachey et al. (2005) Ben Hachey, Beatrice Alex, and Markus Becker. 2005. Investigating the effects of selective sampling on the annotation task. pages 144–151, Ann Arbor, Michigan.
  • Hendrycks and Dietterich (2019) Dan Hendrycks and Thomas Dietterich. 2019. Benchmarking neural network robustness to common corruptions and perturbations. In International Conference on Learning Representations.
  • Ho and Basu (2002) Tin Kam Ho and M. Basu. 2002. Complexity measures of supervised classification problems. IEEE Transactions on Pattern Analysis and Machine Intelligence, 24(3):289–300.
  • Hu et al. (2023) Mengting Hu, Zhen Zhang, Shiwan Zhao, Minlie Huang, and Bingzhe Wu. 2023. Uncertainty in natural language processing: Sources, quantification, and applications. arXiv preprint arXiv:2306.04459.
  • Hüllermeier and Waegeman (2021) Eyke Hüllermeier and Willem Waegeman. 2021. Aleatoric and epistemic uncertainty in machine learning: an introduction to concepts and methods. Machine Learning, 110(3):457–506.
  • Jamison and Gurevych (2015) Emily Jamison and Iryna Gurevych. 2015. Noise or additional information? leveraging crowdsource annotation item agreement for natural language tasks. pages 291–297, Lisbon, Portugal.
  • Jiang and de Marneffe (2022) Nan-Jiang Jiang and Marie-Catherine de Marneffe. 2022. Investigating reasons for disagreement in natural language inference. Transactions of the Association for Computational Linguistics, 10:1357–1374.
  • Kendall and Gal (2017) Alex Kendall and Yarin Gal. 2017. What uncertainties do we need in bayesian deep learning for computer vision? In Proceedings of the 31st International Conference on Neural Information Processing Systems, NIPS’17, page 5580–5590, Red Hook, NY, USA. Curran Associates Inc.
  • Kiureghian and Ditlevsen (2009) Armen Der Kiureghian and Ove Ditlevsen. 2009. Aleatory or epistemic? does it matter? Structural Safety, 31(2):105–112. Risk Acceptance and Risk Communication.
  • Lalor et al. (2018) John P Lalor, Hao Wu, Tsendsuren Munkhdalai, and Hong Yu. 2018. Understanding deep learning performance through an examination of test set difficulty: A psychometric case study. Proc. Conf. Empir. Methods Nat. Lang. Process., 2018:4711–4716.
  • Lhoest et al. (2021) Quentin Lhoest, Albert Villanova del Moral, Yacine Jernite, Abhishek Thakur, Patrick von Platen, Suraj Patil, Julien Chaumond, Mariama Drame, Julien Plu, Lewis Tunstall, Joe Davison, Mario Šaško, Gunjan Chhablani, Bhavitvya Malik, Simon Brandeis, Teven Le Scao, Victor Sanh, Canwen Xu, Nicolas Patry, Angelina McMillan-Major, Philipp Schmid, Sylvain Gugger, Clément Delangue, Théo Matussière, Lysandre Debut, Stas Bekman, Pierric Cistac, Thibault Goehringer, Victor Mustar, François Lagunas, Alexander Rush, and Thomas Wolf. 2021. Datasets: A community library for natural language processing. pages 175–184, Online and Punta Cana, Dominican Republic.
  • Lorena et al. (2019) Ana C. Lorena, Luís P. F. Garcia, Jens Lehmann, Marcilio C. P. Souto, and Tin Kam Ho. 2019. How complex is your classification problem? a survey on measuring classification complexity. ACM Comput. Surv., 52(5).
  • Malinin and Gales (2021) Andrey Malinin and Mark Gales. 2021. Uncertainty estimation in autoregressive structured prediction. In International Conference on Learning Representations.
  • Mucsányi et al. (2024) Bálint Mucsányi, Michael Kirchhof, and Seong Joon Oh. 2024. Benchmarking uncertainty disentanglement: Specialized uncertainties for specialized tasks. Preprint, arXiv:2402.19460.
  • Nie et al. (2020) Yixin Nie, Xiang Zhou, and Mohit Bansal. 2020. What can we learn from collective human opinions on natural language inference data? pages 9131–9143, Online.
  • nostalgebraist (2020) nostalgebraist. 2020. interpreting GPT: the logit lens.
  • Palomaki et al. (2018) Jennimaria Palomaki, Olivia Rhinehart, and Michael Tseng. 2018. A case for a range of acceptable annotations. In Proceedings of the 1st Workshop on Subjectivity, Ambiguity and Disagreement in Crowdsourcing, and Short Paper Proceedings of the 1st Workshop on Disentangling the Relation Between Crowdsourcing and Bias Management (SAD 2018 and CrowdBias 2018) co-located the 6th AAAI Conference on Human Computation and Crowdsourcing (HCOMP 2018), Zürich, Switzerland, July 5, 2018, volume 2276 of CEUR Workshop Proceedings, pages 19–31. CEUR-WS.org.
  • Pavlick and Kwiatkowski (2019) Ellie Pavlick and Tom Kwiatkowski. 2019. Inherent disagreements in human textual inferences. Transactions of the Association for Computational Linguistics, 7:677–694.
  • Peterson et al. (2019) Joshua C. Peterson, Ruairidh M. Battleday, Thomas L. Griffiths, and Olga Russakovsky. 2019. Human uncertainty makes classification more robust. In Proceedings of the IEEE/CVF International Conference on Computer Vision (ICCV).
  • Plank (2022) Barbara Plank. 2022. The “problem” of human label variation: On ground truth in data, modeling and evaluation. pages 10671–10682, Abu Dhabi, United Arab Emirates.
  • Plank et al. (2014) Barbara Plank, Dirk Hovy, and Anders Søgaard. 2014. Linguistically debatable or just plain wrong? pages 507–511, Baltimore, Maryland.
  • Potts et al. (2021) Christopher Potts, Zhengxuan Wu, Atticus Geiger, and Douwe Kiela. 2021. DynaSent: A dynamic benchmark for sentiment analysis. pages 2388–2404, Online.
  • Rajpurkar et al. (2018) Pranav Rajpurkar, Robin Jia, and Percy Liang. 2018. Know what you don’t know: Unanswerable questions for SQuAD. pages 784–789, Melbourne, Australia.
  • Reidsma and Carletta (2008) Dennis Reidsma and Jean Carletta. 2008. Squibs: Reliability measurement without limits. Computational Linguistics, 34(3):319–326.
  • Sadinle et al. (2019) Mauricio Sadinle, Jing Lei, and Larry Wasserman. 2019. Least ambiguous set-valued classifiers with bounded error levels. Journal of the American Statistical Association, 114(525):223–234.
  • Scao et al. (2023) Teven Le Scao, Angela Fan, Christopher Akiki, Ellie Pavlick, Suzana Ilić, Daniel Hesslow, Roman Castagné, Alexandra Sasha Luccioni, François Yvon, Matthias Gallé, Jonathan Tow, Alexander M. Rush, Stella Biderman, Albert Webson, Pawan Sasanka Ammanamanchi, Thomas Wang, Benoît Sagot, Niklas Muennighoff, Albert Villanova del Moral, Olatunji Ruwase, Rachel Bawden, Stas Bekman, Angelina McMillan-Major, Iz Beltagy, Huu Nguyen, Lucile Saulnier, Samson Tan, Pedro Ortiz Suarez, Victor Sanh, Hugo Laurençon, Yacine Jernite, Julien Launay, Margaret Mitchell, Colin Raffel, Aaron Gokaslan, Adi Simhi, Aitor Soroa, Alham Fikri Aji, Amit Alfassy, Anna Rogers, Ariel Kreisberg Nitzav, Canwen Xu, Chenghao Mou, Chris Emezue, Christopher Klamm, Colin Leong, Daniel van Strien, David Ifeoluwa Adelani, Dragomir Radev, Eduardo González Ponferrada, Efrat Levkovizh, Ethan Kim, Eyal Bar Natan, Francesco De Toni, Gérard Dupont, Germán Kruszewski, Giada Pistilli, Hady Elsahar, Hamza Benyamina, Hieu Tran, Ian Yu, Idris Abdulmumin, Isaac Johnson, Itziar Gonzalez-Dios, Javier de la Rosa, Jenny Chim, Jesse Dodge, Jian Zhu, Jonathan Chang, Jörg Frohberg, Joseph Tobing, Joydeep Bhattacharjee, Khalid Almubarak, Kimbo Chen, Kyle Lo, Leandro Von Werra, Leon Weber, Long Phan, Loubna Ben allal, Ludovic Tanguy, Manan Dey, Manuel Romero Muñoz, Maraim Masoud, María Grandury, Mario Šaško, Max Huang, Maximin Coavoux, Mayank Singh, Mike Tian-Jian Jiang, Minh Chien Vu, Mohammad A. Jauhar, Mustafa Ghaleb, Nishant Subramani, Nora Kassner, Nurulaqilla Khamis, Olivier Nguyen, Omar Espejel, Ona de Gibert, Paulo Villegas, Peter Henderson, Pierre Colombo, Priscilla Amuok, Quentin Lhoest, Rheza Harliman, Rishi Bommasani, Roberto Luis López, Rui Ribeiro, Salomey Osei, Sampo Pyysalo, Sebastian Nagel, Shamik Bose, Shamsuddeen Hassan Muhammad, Shanya Sharma, Shayne Longpre, Somaieh Nikpoor, Stanislav Silberberg, Suhas Pai, Sydney Zink, Tiago Timponi Torrent, Timo Schick, Tristan Thrush, Valentin Danchev, Vassilina Nikoulina, Veronika Laippala, Violette Lepercq, Vrinda Prabhu, Zaid Alyafeai, Zeerak Talat, Arun Raja, Benjamin Heinzerling, Chenglei Si, Davut Emre Taşar, Elizabeth Salesky, Sabrina J. Mielke, Wilson Y. Lee, Abheesht Sharma, Andrea Santilli, Antoine Chaffin, Arnaud Stiegler, Debajyoti Datta, Eliza Szczechla, Gunjan Chhablani, Han Wang, Harshit Pandey, Hendrik Strobelt, Jason Alan Fries, Jos Rozen, Leo Gao, Lintang Sutawika, M Saiful Bari, Maged S. Al-shaibani, Matteo Manica, Nihal Nayak, Ryan Teehan, Samuel Albanie, Sheng Shen, Srulik Ben-David, Stephen H. Bach, Taewoon Kim, Tali Bers, Thibault Fevry, Trishala Neeraj, Urmish Thakker, Vikas Raunak, Xiangru Tang, Zheng-Xin Yong, Zhiqing Sun, Shaked Brody, Yallow Uri, Hadar Tojarieh, Adam Roberts, Hyung Won Chung, Jaesung Tae, Jason Phang, Ofir Press, Conglong Li, Deepak Narayanan, Hatim Bourfoune, Jared Casper, Jeff Rasley, Max Ryabinin, Mayank Mishra, Minjia Zhang, Mohammad Shoeybi, Myriam Peyrounette, Nicolas Patry, Nouamane Tazi, Omar Sanseviero, Patrick von Platen, Pierre Cornette, Pierre François Lavallée, Rémi Lacroix, Samyam Rajbhandari, Sanchit Gandhi, Shaden Smith, Stéphane Requena, Suraj Patil, Tim Dettmers, Ahmed Baruwa, Amanpreet Singh, Anastasia Cheveleva, Anne-Laure Ligozat, Arjun Subramonian, Aurélie Névéol, Charles Lovering, Dan Garrette, Deepak Tunuguntla, Ehud Reiter, Ekaterina Taktasheva, Ekaterina Voloshina, Eli Bogdanov, Genta Indra Winata, Hailey Schoelkopf, Jan-Christoph Kalo, Jekaterina Novikova, Jessica Zosa Forde, Jordan Clive, Jungo Kasai, Ken Kawamura, Liam Hazan, Marine Carpuat, Miruna Clinciu, Najoung Kim, Newton Cheng, Oleg Serikov, Omer Antverg, Oskar van der Wal, Rui Zhang, Ruochen Zhang, Sebastian Gehrmann, Shachar Mirkin, Shani Pais, Tatiana Shavrina, Thomas Scialom, Tian Yun, Tomasz Limisiewicz, Verena Rieser, Vitaly Protasov, Vladislav Mikhailov, Yada Pruksachatkun, Yonatan Belinkov, Zachary Bamberger, Zdeněk Kasner, Alice Rueda, Amanda Pestana, Amir Feizpour, Ammar Khan, Amy Faranak, Ana Santos, Anthony Hevia, Antigona Unldreaj, Arash Aghagol, Arezoo Abdollahi, Aycha Tammour, Azadeh HajiHosseini, Bahareh Behroozi, Benjamin Ajibade, Bharat Saxena, Carlos Muñoz Ferrandis, Daniel McDuff, Danish Contractor, David Lansky, Davis David, Douwe Kiela, Duong A. Nguyen, Edward Tan, Emi Baylor, Ezinwanne Ozoani, Fatima Mirza, Frankline Ononiwu, Habib Rezanejad, Hessie Jones, Indrani Bhattacharya, Irene Solaiman, Irina Sedenko, Isar Nejadgholi, Jesse Passmore, Josh Seltzer, Julio Bonis Sanz, Livia Dutra, Mairon Samagaio, Maraim Elbadri, Margot Mieskes, Marissa Gerchick, Martha Akinlolu, Michael McKenna, Mike Qiu, Muhammed Ghauri, Mykola Burynok, Nafis Abrar, Nazneen Rajani, Nour Elkott, Nour Fahmy, Olanrewaju Samuel, Ran An, Rasmus Kromann, Ryan Hao, Samira Alizadeh, Sarmad Shubber, Silas Wang, Sourav Roy, Sylvain Viguier, Thanh Le, Tobi Oyebade, Trieu Le, Yoyo Yang, Zach Nguyen, Abhinav Ramesh Kashyap, Alfredo Palasciano, Alison Callahan, Anima Shukla, Antonio Miranda-Escalada, Ayush Singh, Benjamin Beilharz, Bo Wang, Caio Brito, Chenxi Zhou, Chirag Jain, Chuxin Xu, Clémentine Fourrier, Daniel León Periñán, Daniel Molano, Dian Yu, Enrique Manjavacas, Fabio Barth, Florian Fuhrimann, Gabriel Altay, Giyaseddin Bayrak, Gully Burns, Helena U. Vrabec, Imane Bello, Ishani Dash, Jihyun Kang, John Giorgi, Jonas Golde, Jose David Posada, Karthik Rangasai Sivaraman, Lokesh Bulchandani, Lu Liu, Luisa Shinzato, Madeleine Hahn de Bykhovetz, Maiko Takeuchi, Marc Pàmies, Maria A Castillo, Marianna Nezhurina, Mario Sänger, Matthias Samwald, Michael Cullan, Michael Weinberg, Michiel De Wolf, Mina Mihaljcic, Minna Liu, Moritz Freidank, Myungsun Kang, Natasha Seelam, Nathan Dahlberg, Nicholas Michio Broad, Nikolaus Muellner, Pascale Fung, Patrick Haller, Ramya Chandrasekhar, Renata Eisenberg, Robert Martin, Rodrigo Canalli, Rosaline Su, Ruisi Su, Samuel Cahyawijaya, Samuele Garda, Shlok S Deshmukh, Shubhanshu Mishra, Sid Kiblawi, Simon Ott, Sinee Sang-aroonsiri, Srishti Kumar, Stefan Schweter, Sushil Bharati, Tanmay Laud, Théo Gigant, Tomoya Kainuma, Wojciech Kusa, Yanis Labrak, Yash Shailesh Bajaj, Yash Venkatraman, Yifan Xu, Yingxin Xu, Yu Xu, Zhe Tan, Zhongli Xie, Zifan Ye, Mathilde Bras, Younes Belkada, and Thomas Wolf. 2023. Bloom: A 176b-parameter open-access multilingual language model. Preprint, arXiv:2211.05100.
  • Schröder et al. (2022) Christopher Schröder, Andreas Niekler, and Martin Potthast. 2022. Revisiting uncertainty-based query strategies for active learning with transformers. pages 2194–2203, Dublin, Ireland.
  • Swayamdipta et al. (2020) Swabha Swayamdipta, Roy Schwartz, Nicholas Lourie, Yizhong Wang, Hannaneh Hajishirzi, Noah A. Smith, and Yejin Choi. 2020. Dataset cartography: Mapping and diagnosing datasets with training dynamics. pages 9275–9293, Online.
  • Toneva et al. (2019) Mariya Toneva, Alessandro Sordoni, Remi Tachet des Combes, Adam Trischler, Yoshua Bengio, and Geoffrey J Gordon. 2019. An empirical study of example forgetting during deep neural network learning. In ICLR.
  • Turc et al. (2019) Iulia Turc, Ming-Wei Chang, Kenton Lee, and Kristina Toutanova. 2019. Well-read students learn better: On the importance of pre-training compact models. arXiv preprint arXiv:1908.08962v2.
  • Uma et al. (2021) Alexandra N. Uma, Tommaso Fornaciari, Dirk Hovy, Silviu Paun, Barbara Plank, and Massimo Poesio. 2021. Learning from disagreement: A survey. Journal of Artificial Intelligence Research, 72:1385–1470.
  • Vovk et al. (2005) Vladimir Vovk, Alexander Gammerman, and Glenn Shafer. 2005. Algorithmic Learning in a Random World. Springer-Verlag.
  • Weinshall et al. (2018) Daphna Weinshall, Gad Cohen, and Dan Amir. 2018. Curriculum learning by transfer learning: Theory and experiments with deep networks. In Proceedings of the 35th International Conference on Machine Learning, volume 80 of Proceedings of Machine Learning Research, pages 5238–5246. PMLR.
  • Williams et al. (2018) Adina Williams, Nikita Nangia, and Samuel Bowman. 2018. A broad-coverage challenge corpus for sentence understanding through inference. pages 1112–1122, New Orleans, Louisiana.
  • Wolf et al. (2020) Thomas Wolf, Lysandre Debut, Victor Sanh, Julien Chaumond, Clement Delangue, Anthony Moi, Pierric Cistac, Tim Rault, Remi Louf, Morgan Funtowicz, Joe Davison, Sam Shleifer, Patrick von Platen, Clara Ma, Yacine Jernite, Julien Plu, Canwen Xu, Teven Le Scao, Sylvain Gugger, Mariama Drame, Quentin Lhoest, and Alexander Rush. 2020. Transformers: State-of-the-art natural language processing. pages 38–45, Online.
  • Xiao and Wang (2019) Yijun Xiao and William Yang Wang. 2019. Quantifying uncertainties in natural language processing tasks. Proceedings of the AAAI Conference on Artificial Intelligence, 33(01):7322–7329.
  • Zhang et al. (2022) Zhisong Zhang, Emma Strubell, and Eduard Hovy. 2022. A survey of active learning for natural language processing. pages 6166–6190, Abu Dhabi, United Arab Emirates.
  • Zhou et al. (2022) Xinlei Zhou, Han Liu, Farhad Pourpanah, Tieyong Zeng, and Xizhao Wang. 2022. A survey on epistemic (model) uncertainty in supervised learning: Recent advances and applications. Neurocomputing, 489:449–465.

Appendix A Implementation details

Our use of all preexisting research artifacts is consistent with their corresponding licenses. We trust creators of said artifacts to have handled any personally identifying information that the artifacts may contain.

We also provide our code for replication purposes at this anonymized link.

Dataset Variant Train Val Test
SNLI All labeled (§4, <1B) 549 367549\,367 98429842 (unused)
5-splits (§4, 1B) 109 873109\,873 98429842 (unused)
MNLI All labeled (§4, <1B) 392 702392\,702 98159815 (unused)
5-splits (§4, 1B) 78 54078\,540 98159815 (unused)
DynaSent Re-balanced (§5) 32 00132\,001 30663066 30273027
All labeled (§B.4) 84 38884\,388 36003600 36003600
Table 4: Dataset Statistics

A.1 Data

As noted above, we use SNLI (Bowman et al., 2015: retrieved from HuggingFace), MNLI (Williams et al., 2018, retrieved from HuggingFace), ChaosNLI (Nie et al., 2020; retrieved from GitHub) and DynaSent (Potts et al., 2021, retrieved from GitHub, round 1 data). We remove items without public labels from SNLI and MNLI, as well as datapoints with no majority label from DynaSent. Corresponding statistics are listed in Table˜4.

Data shuffling was seeded (with fixed random seeds per runs) for DynaSent experiments so as to guarantee strictly comparable training conditions between soft and hard label experiments.

A.2 Models

All models are implemented with HuggingFace (HF; Wolf et al., 2020; Lhoest et al., 2021). As per default HF implementations, for the 1B pool of models, classifiers rely on the last token in the input; for the <1B model pool, we use the first token. All experiments are supervised full fine-tuning processes using learned linear projections as classification heads. Models are trained on a V100 NVIDIA GPU, for an individual runtime of \leq15 hours for any individual model.

All classifier heads for DynaSent were initialized (with fixed random seeds per run) so as to guarantee strictly comparable training conditions between soft and hard label experiments.

Number of epochs 2
Batch size 16
(a) Hyperparameters, <1B SNLI models
Number of epochs 10
Batch size 16
(b) Hyperparameters, 1B SNLI models
Number of epochs 5
Batch size 1
Gradient accumulation 16
Warmup ratio 0.1
(c) Hyperparameters, all DynaSent models
Number of epochs 5
Batch size 1
Gradient accumulation 16
Warmup ratio 0.1
Learning rate 1e-6
(d) Hyperparameters, all MNLI models
Table 5: Hyperparameters for all models considered

Hyperparameters are listed in Table˜5. Any hyperparameter not listed in Table˜5 was left to its default value as listed in the HF documentation.

Appendix B Supplementary results

B.1 Non-linear relationship of human-based indicators and model-based indicators

dis\mathbb{H}_{\mathrm{dis}} ent\mathbb{H}_{\mathrm{ent}}
𝕄dis\mathbb{M}_{\mathrm{dis}} 0.047 472 343 065 758 540.047\,472\,343\,065\,758\,54 0.059 536 827 355 002 10.059\,536\,827\,355\,002\,1
𝕄ent\mathbb{M}_{\mathrm{ent}} 0.059 213 489 147 368 240.059\,213\,489\,147\,368\,24 0.077 504 915 198 292 720.077\,504\,915\,198\,292\,72
𝕄avgent\mathbb{M}_{\mathrm{avg\ ent}} 0.121 775 870 755 452 60.121\,775\,870\,755\,452\,6 0.152 147 145 742 975 60.152\,147\,145\,742\,975\,6
𝕄CPα=0.05\mathbb{M}_{\mathrm{CP\ }\alpha=0.05} 0.101 491 219 548 292 10.101\,491\,219\,548\,292\,1 0.139 626 890 218 631 50.139\,626\,890\,218\,631\,5
𝕄CPα=0.1\mathbb{M}_{\mathrm{CP\ }\alpha=0.1} 0.114 183 732 239 202 20.114\,183\,732\,239\,202\,2 0.141 601 548 043 584 50.141\,601\,548\,043\,584\,5
𝕄CPα=0.2\mathbb{M}_{\mathrm{CP\ }\alpha=0.2} 0.093 877 291 513 565 50.093\,877\,291\,513\,565\,5 0.105 512 590 305 112 060.105\,512\,590\,305\,112\,06
𝕄failref\mathbb{M}_{\mathrm{fail}}^{\mathrm{ref}} 0.156 764 807 149 783 470.156\,764\,807\,149\,783\,47 0.159 174 686 621 536 780.159\,174\,686\,621\,536\,78
𝕄1stlayerref\mathbb{M}_{\mathrm{1^{st}\ layer}}^{\mathrm{ref}} 0.144 086 841 448 415 330.144\,086\,841\,448\,415\,33 0.138 300 063 097 922 30.138\,300\,063\,097\,922\,3
𝕄1stckptref\mathbb{M}_{\mathrm{1^{st}\ ckpt}}^{\mathrm{ref}} 0.180 156 503 510 606 20.180\,156\,503\,510\,606\,2 0.189 811 760 471 089 390.189\,811\,760\,471\,089\,39
𝕄avgckptref\mathbb{M}_{\mathrm{avg\ ckpt}}^{\mathrm{ref}} 0.152 414 862 393 344 230.152\,414\,862\,393\,344\,23 0.157 561 829 512 674 830.157\,561\,829\,512\,674\,83
𝕄avgckptp+ref\mathbb{M}_{\mathrm{avg\ ckpt\ }p}^{+\mathrm{ref}} 0.179 866 186 165 999 80.179\,866\,186\,165\,999\,8 0.192 409 155 228 892 90.192\,409\,155\,228\,892\,9
(a) <1B models
dis\mathbb{H}_{\mathrm{dis}} ent\mathbb{H}_{\mathrm{ent}}
𝕄dis\mathbb{M}_{\mathrm{dis}} 0.031 391 615 428 776 110.031\,391\,615\,428\,776\,11 0.037 927 068 357 759 1640.037\,927\,068\,357\,759\,164
𝕄avgent\mathbb{M}_{\mathrm{avg\ ent}} 0.057 525 749 956 136 240.057\,525\,749\,956\,136\,24 0.078 990 866 954 887 220.078\,990\,866\,954\,887\,22
𝕄ent\mathbb{M}_{\mathrm{ent}} 0.038 808 894 561 580 540.038\,808\,894\,561\,580\,54 0.047 651 289 292 962 250.047\,651\,289\,292\,962\,25
𝕄CPα=0.05\mathbb{M}_{\mathrm{CP\ }\alpha=0.05} 0.053 611 192 724 189 130.053\,611\,192\,724\,189\,13 0.076 558 645 984 786 90.076\,558\,645\,984\,786\,9
𝕄CPα=0.1\mathbb{M}_{\mathrm{CP\ }\alpha=0.1} 0.057 263 871 881 726 2140.057\,263\,871\,881\,726\,214 0.079 458 311 100 261 80.079\,458\,311\,100\,261\,8
𝕄CPα=0.2\mathbb{M}_{\mathrm{CP\ }\alpha=0.2} 0.046 526 252 168 893 610.046\,526\,252\,168\,893\,61 0.061 612 145 687 850 0060.061\,612\,145\,687\,850\,006
𝕄failref\mathbb{M}_{\mathrm{fail}}^{\mathrm{ref}} 0.110 913 521 577 611 920.110\,913\,521\,577\,611\,92 0.122 291 021 386 518 150.122\,291\,021\,386\,518\,15
𝕄1stlayerref\mathbb{M}_{\mathrm{1^{st}\ layer}}^{\mathrm{ref}} 0.114 712 630 687 749 50.114\,712\,630\,687\,749\,5 0.131 303 652 151 101 740.131\,303\,652\,151\,101\,74
𝕄1stckptref\mathbb{M}_{\mathrm{1^{st}\ ckpt}}^{\mathrm{ref}} 0.118 555 662 247 406 320.118\,555\,662\,247\,406\,32 0.135 562 152 537 024 970.135\,562\,152\,537\,024\,97
𝕄avgckptref\mathbb{M}_{\mathrm{avg\ ckpt}}^{\mathrm{ref}} 0.107 158 319 541 982 630.107\,158\,319\,541\,982\,63 0.120 882 224 561 629 450.120\,882\,224\,561\,629\,45
𝕄avgckptp+ref\mathbb{M}_{\mathrm{avg\ ckpt\ }p}^{+\mathrm{ref}} 0.117 481 974 129 408 530.117\,481\,974\,129\,408\,53 0.134 725 097 694 934 570.134\,725\,097\,694\,934\,57
(b) 1B models
Table 6: Proportion of explained variance (R2R^{2}) of linear regressions predicting a model-based indicator from a human-based indicator.

To get a better grasp on the magnitude of the difference highlighted in Tables˜1 and 2, we can turn to residual analyses. We fit a linear regression, attempting to predict one indicator from another, and measure the proportion of variance that this linear model can explain using a coefficient of determination R2R^{2}. Corresponding values are shown in Table˜6, with Figure˜3(a) focusing on the <1B group and Figure˜3(b) the 1B group. In short, R2R^{2} are never above 20%20\%, and often below 10%10\% for reference-free metrics, suggesting that at least 80%80\% of the behavior of our model-based indicators cannot be accounted for with human-based indicators alone. In this case as well, we can observe a difference between reference-free and reference-dependent indicators: As one would expect, reference-dependent indicators yield quantitatively higher R2R^{2} scores, suggesting they are (marginally) more in line with human indicators. It is worth highlighting that out of all the reference-free indicators, conformal prediction set sizes and average model entropy scores tend to be the most in line with human judgments. This echoes our earlier remarks on the reference-free indicators being partitioned in two sub-groups, and suggests that more elaborate statistical estimators may mitigate some of the discrepancy we observe between human-based and model-based indicators.

B.2 Interaction of model-based indicators and model success

A more formal statement of the argument shown in Figure˜1 is that we observe higher correlations when comparing two model-based indicators than when comparing human-based to model-based indicators, although correlations remain smaller than what we observe when comparing indicators within the same group. This can be seen in Table˜7 for SNLI, where the values are clearly below what we observe within any subgroup of indicators, but higher than what we summarized in Table˜1.

𝕄failref\mathbb{M}_{\mathrm{fail}}^{\mathrm{ref}} 𝕄1stlayerref\mathbb{M}_{\mathrm{1^{st}\ layer}}^{\mathrm{ref}} 𝕄1stckptref\mathbb{M}_{\mathrm{1^{st}\ ckpt}}^{\mathrm{ref}} 𝕄avgckptref\mathbb{M}_{\mathrm{avg\ ckpt}}^{\mathrm{ref}} 𝕄avgckptpref\mathbb{M}_{\mathrm{avg\ ckpt\ }p}^{\mathrm{ref}}
𝕄dis\mathbb{M}_{\mathrm{dis}} 0.618 986 126 816 572 60.618\,986\,126\,816\,572\,6 0.509 847 389 669 890 30.509\,847\,389\,669\,890\,3 0.605 266 337 396 0230.605\,266\,337\,396\,023 0.609 105 564 034 9970.609\,105\,564\,034\,997 0.598 564 906 141 766 70.598\,564\,906\,141\,766\,7
𝕄ent\mathbb{M}_{\mathrm{ent}} 0.621 243 913 694 725 40.621\,243\,913\,694\,725\,4 0.513 287 719 393 914 60.513\,287\,719\,393\,914\,6 0.608 275 326 639 116 50.608\,275\,326\,639\,116\,5 0.611 747 715 041 817 10.611\,747\,715\,041\,817\,1 0.603 489 871 580 386 60.603\,489\,871\,580\,386\,6
𝕄avgent\mathbb{M}_{\mathrm{avg\ ent}} 0.590 402 389 488 9380.590\,402\,389\,488\,938 0.497 309 635 738 820.497\,309\,635\,738\,82 0.622 116 464 997 218 80.622\,116\,464\,997\,218\,8 0.587 607 473 573 689 70.587\,607\,473\,573\,689\,7 0.642 756 029 569 679 60.642\,756\,029\,569\,679\,6
𝕄CPα=0.05\mathbb{M}_{\mathrm{CP\ }\alpha=0.05} 0.460 203 392 491 808 40.460\,203\,392\,491\,808\,4 0.376 169 420 081 878 30.376\,169\,420\,081\,878\,3 0.484 508 374 501 3040.484\,508\,374\,501\,304 0.458 477 770 713 345 330.458\,477\,770\,713\,345\,33 0.520 621 982 965 239 20.520\,621\,982\,965\,239\,2
𝕄CPα=0.1\mathbb{M}_{\mathrm{CP\ }\alpha=0.1} 0.460 109 740 555 100 40.460\,109\,740\,555\,100\,4 0.374 771 277 215 6430.374\,771\,277\,215\,643 0.488 075 555 107 332 860.488\,075\,555\,107\,332\,86 0.457 218 028 332 677 30.457\,218\,028\,332\,677\,3 0.504 446 534 551 217 90.504\,446\,534\,551\,217\,9
𝕄CPα=0.2\mathbb{M}_{\mathrm{CP\ }\alpha=0.2} 0.354 597 086 844 138 90.354\,597\,086\,844\,138\,9 0.316 968 260 939 402 340.316\,968\,260\,939\,402\,34 0.374 664 855 740 314 940.374\,664\,855\,740\,314\,94 0.350 363 027 692 176 860.350\,363\,027\,692\,176\,86 0.362 259 167 094 330 370.362\,259\,167\,094\,330\,37
(a) <1B models
𝕄failref\mathbb{M}_{\mathrm{fail}}^{\mathrm{ref}} 𝕄1stlayerref\mathbb{M}_{\mathrm{1^{st}\ layer}}^{\mathrm{ref}} 𝕄1stckptref\mathbb{M}_{\mathrm{1^{st}\ ckpt}}^{\mathrm{ref}} 𝕄avgckptref\mathbb{M}_{\mathrm{avg\ ckpt}}^{\mathrm{ref}} 𝕄avgckptpref\mathbb{M}_{\mathrm{avg\ ckpt\ }p}^{\mathrm{ref}}
𝕄dis\mathbb{M}_{\mathrm{dis}} 0.515 376 188 356 634 90.515\,376\,188\,356\,634\,9 0.496 601 454 239 847 30.496\,601\,454\,239\,847\,3 0.502 850 249 061 2890.502\,850\,249\,061\,289 0.503 516 380 804 114 10.503\,516\,380\,804\,114\,1 0.504 764 262 677 584 90.504\,764\,262\,677\,584\,9
𝕄ent\mathbb{M}_{\mathrm{ent}} 0.516 791 465 513 611 10.516\,791\,465\,513\,611\,1 0.498 444 467 099 863 60.498\,444\,467\,099\,863\,6 0.504 660 347 819 375 90.504\,660\,347\,819\,375\,9 0.507 271 488 335 075 50.507\,271\,488\,335\,075\,5 0.512 709 911 826 927 20.512\,709\,911\,826\,927\,2
𝕄avgent\mathbb{M}_{\mathrm{avg\ ent}} 0.529 158 396 482 461 90.529\,158\,396\,482\,461\,9 0.541 866 078 046 840 40.541\,866\,078\,046\,840\,4 0.546 789 649 608 837 50.546\,789\,649\,608\,837\,5 0.529 195 854 464 142 70.529\,195\,854\,464\,142\,7 0.555 966 294 823 295 30.555\,966\,294\,823\,295\,3
𝕄CPα=0.05\mathbb{M}_{\mathrm{CP\ }\alpha=0.05} 0.486 043 027 382 622 560.486\,043\,027\,382\,622\,56 0.495 827 050 437 536 60.495\,827\,050\,437\,536\,6 0.497 218 580 647 839 30.497\,218\,580\,647\,839\,3 0.491 554 345 904 435 30.491\,554\,345\,904\,435\,3 0.528 596 915 712 278 10.528\,596\,915\,712\,278\,1
𝕄CPα=0.1\mathbb{M}_{\mathrm{CP\ }\alpha=0.1} 0.521 597 058 103 540 30.521\,597\,058\,103\,540\,3 0.528 991 254 893 299 30.528\,991\,254\,893\,299\,3 0.535 338 866 535 820 30.535\,338\,866\,535\,820\,3 0.524 098 040 975 617 40.524\,098\,040\,975\,617\,4 0.552 695 983 774 566 60.552\,695\,983\,774\,566\,6
𝕄CPα=0.2\mathbb{M}_{\mathrm{CP\ }\alpha=0.2} 0.523 205 095 060 116 90.523\,205\,095\,060\,116\,9 0.533 774 440 226 309 20.533\,774\,440\,226\,309\,2 0.543 661 616 535 489 70.543\,661\,616\,535\,489\,7 0.518 758 262 888 526 80.518\,758\,262\,888\,526\,8 0.533 761 176 926 960 30.533\,761\,176\,926\,960\,3
(b) 1B models
Table 7: Spearman correlation between reference-dependent and reference-free indicators.

To show that all of our reference-free indicators conflate model-success and failure, we can break down observations depending on whether over 50%50\% of the model pool produces the majority label of the human annotator pools. Recomputing correlations for each subgroup yields systematic negative correlations when the models tend to fail, and systematic positive correlations when the models tend to succeed according to the majority labels, as summarized in Tables˜8, 9 and 10 — informally, correlations form the ‘left leg’ of the inverted U-shape distributions, and anti-correlation the ‘right leg.’

𝕄failref\mathbb{M}_{\mathrm{fail}}^{\mathrm{ref}} 𝕄1stlayerref\mathbb{M}_{\mathrm{1^{st}\ layer}}^{\mathrm{ref}} 𝕄1stckptref\mathbb{M}_{\mathrm{1^{st}\ ckpt}}^{\mathrm{ref}} 𝕄avgckptref\mathbb{M}_{\mathrm{avg\ ckpt}}^{\mathrm{ref}} 𝕄avgckptpref\mathbb{M}_{\mathrm{avg\ ckpt\ }p}^{\mathrm{ref}}
𝕄dis\mathbb{M}_{\mathrm{dis}} 0.850 817 071 338 756 4-0.850\,817\,071\,338\,756\,4 0.851 835 993 265 202 7-0.851\,835\,993\,265\,202\,7 0.846 106 245 988 785 9-0.846\,106\,245\,988\,785\,9 0.808 529 097 691 429 2-0.808\,529\,097\,691\,429\,2 0.763 096 234 279 286 1-0.763\,096\,234\,279\,286\,1
𝕄ent\mathbb{M}_{\mathrm{ent}} 0.793 277 799 034 745 3-0.793\,277\,799\,034\,745\,3 0.792 950 208 306 214 1-0.792\,950\,208\,306\,214\,1 0.786 320 771 931 56-0.786\,320\,771\,931\,56 0.755 082 116 544 850 1-0.755\,082\,116\,544\,850\,1 0.700 683 837 061 615 1-0.700\,683\,837\,061\,615\,1
𝕄avgent\mathbb{M}_{\mathrm{avg\ ent}} 0.596 889 642 504 745-0.596\,889\,642\,504\,745 0.561 699 111 343 349 7-0.561\,699\,111\,343\,349\,7 0.538 977 888 034 643 2-0.538\,977\,888\,034\,643\,2 0.582 815 431 131 203 3-0.582\,815\,431\,131\,203\,3 0.594 148 556 338 502 7-0.594\,148\,556\,338\,502\,7
𝕄CPα=0.05\mathbb{M}_{\mathrm{CP\ }\alpha=0.05} 0.395 794 668 109 176-0.395\,794\,668\,109\,176 0.387 554 423 420 869 15-0.387\,554\,423\,420\,869\,15 0.387 420 081 063 615 9-0.387\,420\,081\,063\,615\,9 0.373 580 519 276 805 74-0.373\,580\,519\,276\,805\,74 0.355 216 453 299 580 07-0.355\,216\,453\,299\,580\,07
𝕄CPα=0.1\mathbb{M}_{\mathrm{CP\ }\alpha=0.1} 0.496 547 783 244 685 6-0.496\,547\,783\,244\,685\,6 0.463 997 414 261 526 63-0.463\,997\,414\,261\,526\,63 0.467 000 595 747 613 3-0.467\,000\,595\,747\,613\,3 0.483 314 807 924 434 1-0.483\,314\,807\,924\,434\,1 0.482 432 304 456 679 06-0.482\,432\,304\,456\,679\,06
𝕄CPα=0.2\mathbb{M}_{\mathrm{CP\ }\alpha=0.2} 0.439 235 792 012 350 6-0.439\,235\,792\,012\,350\,6 0.401 395 470 182 673 5-0.401\,395\,470\,182\,673\,5 0.397 392 578 103 699 7-0.397\,392\,578\,103\,699\,7 0.429 748 462 835 910 95-0.429\,748\,462\,835\,910\,95 0.440 349 386 169 748 95-0.440\,349\,386\,169\,748\,95
(a) <1B models, datapoints where most models fail
𝕄failref\mathbb{M}_{\mathrm{fail}}^{\mathrm{ref}} 𝕄1stlayerref\mathbb{M}_{\mathrm{1^{st}\ layer}}^{\mathrm{ref}} 𝕄1stckptref\mathbb{M}_{\mathrm{1^{st}\ ckpt}}^{\mathrm{ref}} 𝕄avgckptref\mathbb{M}_{\mathrm{avg\ ckpt}}^{\mathrm{ref}} 𝕄avgckptpref\mathbb{M}_{\mathrm{avg\ ckpt\ }p}^{\mathrm{ref}}
𝕄dis\mathbb{M}_{\mathrm{dis}} 0.950 742 301 839 210 50.950\,742\,301\,839\,210\,5 0.692 039 643 674 564 40.692\,039\,643\,674\,564\,4 0.918 704 177 395 861 30.918\,704\,177\,395\,861\,3 0.921 328 817 046 167 80.921\,328\,817\,046\,167\,8 0.885 867 322 221 4930.885\,867\,322\,221\,493
𝕄ent\mathbb{M}_{\mathrm{ent}} 0.948 897 992 116 074 30.948\,897\,992\,116\,074\,3 0.691 231 231 596 155 50.691\,231\,231\,596\,155\,5 0.917 669 356 486 606 90.917\,669\,356\,486\,606\,9 0.920 149 929 812 582 70.920\,149\,929\,812\,582\,7 0.887 339 130 837 475 20.887\,339\,130\,837\,475\,2
𝕄avgent\mathbb{M}_{\mathrm{avg\ ent}} 0.820 244 808 859 1120.820\,244\,808\,859\,112 0.599 841 268 930 9580.599\,841\,268\,930\,958 0.875 970 441 451 668 60.875\,970\,441\,451\,668\,6 0.812 305 670 188 756 90.812\,305\,670\,188\,756\,9 0.937 073 977 196 342 70.937\,073\,977\,196\,342\,7
𝕄CPα=0.05\mathbb{M}_{\mathrm{CP\ }\alpha=0.05} 0.583 302 085 072 301 70.583\,302\,085\,072\,301\,7 0.402 611 028 851 218 970.402\,611\,028\,851\,218\,97 0.634 208 694 978 866 90.634\,208\,694\,978\,866\,9 0.576 345 778 643 222 70.576\,345\,778\,643\,222\,7 0.705 327 723 652 862 80.705\,327\,723\,652\,862\,8
𝕄CPα=0.1\mathbb{M}_{\mathrm{CP\ }\alpha=0.1} 0.623 703 077 912 500 10.623\,703\,077\,912\,500\,1 0.433 930 072 745 007 80.433\,930\,072\,745\,007\,8 0.677 465 615 708 963 40.677\,465\,615\,708\,963\,4 0.615 625 598 645 5980.615\,625\,598\,645\,598 0.716 617 721 925 884 20.716\,617\,721\,925\,884\,2
𝕄CPα=0.2\mathbb{M}_{\mathrm{CP\ }\alpha=0.2} 0.498 549 396 964 877 930.498\,549\,396\,964\,877\,93 0.401 571 291 893 147 660.401\,571\,291\,893\,147\,66 0.531 664 159 279 347 40.531\,664\,159\,279\,347\,4 0.486 620 486 003 291 050.486\,620\,486\,003\,291\,05 0.516 537 007 780 927 50.516\,537\,007\,780\,927\,5
(b) <1B models, datapoints where most models succeed
𝕄failref\mathbb{M}_{\mathrm{fail}}^{\mathrm{ref}} 𝕄1stlayerref\mathbb{M}_{\mathrm{1^{st}\ layer}}^{\mathrm{ref}} 𝕄1stckptref\mathbb{M}_{\mathrm{1^{st}\ ckpt}}^{\mathrm{ref}} 𝕄avgckptref\mathbb{M}_{\mathrm{avg\ ckpt}}^{\mathrm{ref}} 𝕄avgckptpref\mathbb{M}_{\mathrm{avg\ ckpt\ }p}^{\mathrm{ref}}
𝕄dis\mathbb{M}_{\mathrm{dis}} 0.776 107 996 619 319-0.776\,107\,996\,619\,319 0.759 257 483 500 869 5-0.759\,257\,483\,500\,869\,5 0.773 654 989 803 351 1-0.773\,654\,989\,803\,351\,1 0.713 585 118 060 266 1-0.713\,585\,118\,060\,266\,1 0.683 841 450 667 835 7-0.683\,841\,450\,667\,835\,7
𝕄ent\mathbb{M}_{\mathrm{ent}} 0.713 076 553 315 920 7-0.713\,076\,553\,315\,920\,7 0.707 529 157 865 442 3-0.707\,529\,157\,865\,442\,3 0.717 369 921 454 692 1-0.717\,369\,921\,454\,692\,1 0.653 892 479 834 717 7-0.653\,892\,479\,834\,717\,7 0.613 999 706 606 810 5-0.613\,999\,706\,606\,810\,5
𝕄avgent\mathbb{M}_{\mathrm{avg\ ent}} 0.561 542 841 985 104 1-0.561\,542\,841\,985\,104\,1 0.526 415 190 570 880 9-0.526\,415\,190\,570\,880\,9 0.528 344 450 423 037 2-0.528\,344\,450\,423\,037\,2 0.530 253 850 284 601 5-0.530\,253\,850\,284\,601\,5 0.511 053 108 723 015 8-0.511\,053\,108\,723\,015\,8
𝕄CPα=0.05\mathbb{M}_{\mathrm{CP\ }\alpha=0.05} 0.367 015 708 010 461 35-0.367\,015\,708\,010\,461\,35 0.363 316 548 128 810 26-0.363\,316\,548\,128\,810\,26 0.351 469 830 479 161 7-0.351\,469\,830\,479\,161\,7 0.338 893 661 903 130 5-0.338\,893\,661\,903\,130\,5 0.303 660 898 724 374 3-0.303\,660\,898\,724\,374\,3
𝕄CPα=0.1\mathbb{M}_{\mathrm{CP\ }\alpha=0.1} 0.476 060 121 294 633 54-0.476\,060\,121\,294\,633\,54 0.456 520 108 259 136-0.456\,520\,108\,259\,136 0.457 511 576 666 918 55-0.457\,511\,576\,666\,918\,55 0.445 304 428 113 186 2-0.445\,304\,428\,113\,186\,2 0.418 183 994 570 394 7-0.418\,183\,994\,570\,394\,7
𝕄CPα=0.2\mathbb{M}_{\mathrm{CP\ }\alpha=0.2} 0.642 686 023 185 188 3-0.642\,686\,023\,185\,188\,3 0.583 594 360 109 516 5-0.583\,594\,360\,109\,516\,5 0.596 680 498 421 392 7-0.596\,680\,498\,421\,392\,7 0.615 576 513 160 144 8-0.615\,576\,513\,160\,144\,8 0.611 594 566 654 472 2-0.611\,594\,566\,654\,472\,2
(c) 1B models, datapoints where most models fail
𝕄failref\mathbb{M}_{\mathrm{fail}}^{\mathrm{ref}} 𝕄1stlayerref\mathbb{M}_{\mathrm{1^{st}\ layer}}^{\mathrm{ref}} 𝕄1stckptref\mathbb{M}_{\mathrm{1^{st}\ ckpt}}^{\mathrm{ref}} 𝕄avgckptref\mathbb{M}_{\mathrm{avg\ ckpt}}^{\mathrm{ref}} 𝕄avgckptpref\mathbb{M}_{\mathrm{avg\ ckpt\ }p}^{\mathrm{ref}}
𝕄dis\mathbb{M}_{\mathrm{dis}} 0.953 597 644 714 0190.953\,597\,644\,714\,019 0.892 809 817 889 786 20.892\,809\,817\,889\,786\,2 0.915 904 123 313 913 10.915\,904\,123\,313\,913\,1 0.900 264 600 721 888 50.900\,264\,600\,721\,888\,5 0.893 426 607 974 190 90.893\,426\,607\,974\,190\,9
𝕄ent\mathbb{M}_{\mathrm{ent}} 0.946 415 682 680 793 60.946\,415\,682\,680\,793\,6 0.889 072 998 468 776 20.889\,072\,998\,468\,776\,2 0.910 677 741 058 543 30.910\,677\,741\,058\,543\,3 0.897 977 443 939 889 40.897\,977\,443\,939\,889\,4 0.896 236 955 523 169 50.896\,236\,955\,523\,169\,5
𝕄avgent\mathbb{M}_{\mathrm{avg\ ent}} 0.880 328 765 943 382 20.880\,328\,765\,943\,382\,2 0.895 500 001 480 8970.895\,500\,001\,480\,897 0.911 573 871 665 374 50.911\,573\,871\,665\,374\,5 0.869 355 367 143 3520.869\,355\,367\,143\,352 0.931 474 976 145 070 90.931\,474\,976\,145\,070\,9
𝕄CPα=0.05\mathbb{M}_{\mathrm{CP\ }\alpha=0.05} 0.774 807 828 088 073 20.774\,807\,828\,088\,073\,2 0.793 854 723 771 702 20.793\,854\,723\,771\,702\,2 0.797 120 401 166 015 30.797\,120\,401\,166\,015\,3 0.775 898 714 812 901 40.775\,898\,714\,812\,901\,4 0.854 649 688 253 848 80.854\,649\,688\,253\,848\,8
𝕄CPα=0.1\mathbb{M}_{\mathrm{CP\ }\alpha=0.1} 0.854 604 219 727 576 90.854\,604\,219\,727\,576\,9 0.860 138 986 656 981 50.860\,138\,986\,656\,981\,5 0.881 613 616 490 2140.881\,613\,616\,490\,214 0.849 094 614 247 898 90.849\,094\,614\,247\,898\,9 0.910 343 476 196 959 50.910\,343\,476\,196\,959\,5
𝕄CPα=0.2\mathbb{M}_{\mathrm{CP\ }\alpha=0.2} 0.899 555 792 617 555 10.899\,555\,792\,617\,555\,1 0.898 180 455 950 607 50.898\,180\,455\,950\,607\,5 0.931 965 681 033 761 20.931\,965\,681\,033\,761\,2 0.879 930 315 433 923 10.879\,930\,315\,433\,923\,1 0.916 578 610 888 674 50.916\,578\,610\,888\,674\,5
(d) 1B models, datapoints where most models succeed
Table 8: Spearman correlation on SNLI data between reference-dependent and reference-free indicators of data complexity, broken down by average model success or failure.
𝕄failref\mathbb{M}_{\mathrm{fail}}^{\mathrm{ref}} 𝕄avgckptref\mathbb{M}_{\mathrm{avg\ ckpt}}^{\mathrm{ref}} 𝕄1stckptref\mathbb{M}_{\mathrm{1^{st}\ ckpt}}^{\mathrm{ref}} 𝕄1stlayerref\mathbb{M}_{\mathrm{1^{st}\ layer}}^{\mathrm{ref}} 𝕄avgckptpref\mathbb{M}_{\mathrm{avg\ ckpt\ }p}^{\mathrm{ref}}
𝕄dis\mathbb{M}_{\mathrm{dis}} 0.767 572 568 458 332 3-0.767\,572\,568\,458\,332\,3 0.762 482 339 315 043 6-0.762\,482\,339\,315\,043\,6 0.781 200 423 827 536 1-0.781\,200\,423\,827\,536\,1 0.691 135 746 959 099 3-0.691\,135\,746\,959\,099\,3 0.737 987 851 258 165 1-0.737\,987\,851\,258\,165\,1
𝕄ent\mathbb{M}_{\mathrm{ent}} 0.732 247 112 379 725 6-0.732\,247\,112\,379\,725\,6 0.730 107 762 377 606 9-0.730\,107\,762\,377\,606\,9 0.746 940 092 140 546 2-0.746\,940\,092\,140\,546\,2 0.648 676 126 785 822 1-0.648\,676\,126\,785\,822\,1 0.703 442 605 620 102 2-0.703\,442\,605\,620\,102\,2
𝕄avgent\mathbb{M}_{\mathrm{avg\ ent}} 0.524 147 161 524 331 7-0.524\,147\,161\,524\,331\,7 0.512 996 901 130 290 1-0.512\,996\,901\,130\,290\,1 0.514 769 782 553 568 6-0.514\,769\,782\,553\,568\,6 0.518 882 481 284 859 4-0.518\,882\,481\,284\,859\,4 0.504 378 352 106 788 5-0.504\,378\,352\,106\,788\,5
𝕄CPα=0.05\mathbb{M}_{\mathrm{CP\ }\alpha=0.05} 0.346 261 669 345 968 6-0.346\,261\,669\,345\,968\,6 0.330 706 342 801 846 3-0.330\,706\,342\,801\,846\,3 0.348 377 636 485 343 64-0.348\,377\,636\,485\,343\,64 0.328 879 560 005 966 5-0.328\,879\,560\,005\,966\,5 0.331 998 215 050 121 56-0.331\,998\,215\,050\,121\,56
𝕄CPα=0.1\mathbb{M}_{\mathrm{CP\ }\alpha=0.1} 0.407 867 106 848 036 8-0.407\,867\,106\,848\,036\,8 0.392 981 926 549 352 1-0.392\,981\,926\,549\,352\,1 0.408 341 890 914 787 23-0.408\,341\,890\,914\,787\,23 0.396 415 906 762 425-0.396\,415\,906\,762\,425 0.392 957 660 841 941 7-0.392\,957\,660\,841\,941\,7
𝕄CPα=0.2\mathbb{M}_{\mathrm{CP\ }\alpha=0.2} 0.506 968 887 202 493 1-0.506\,968\,887\,202\,493\,1 0.494 914 941 967 913 14-0.494\,914\,941\,967\,913\,14 0.501 254 360 446 396 5-0.501\,254\,360\,446\,396\,5 0.504 140 203 772 916 2-0.504\,140\,203\,772\,916\,2 0.491 451 952 051 072 34-0.491\,451\,952\,051\,072\,34
(a) <1B models, datapoints where most models fail
𝕄failref\mathbb{M}_{\mathrm{fail}}^{\mathrm{ref}} 𝕄avgckptref\mathbb{M}_{\mathrm{avg\ ckpt}}^{\mathrm{ref}} 𝕄1stckptref\mathbb{M}_{\mathrm{1^{st}\ ckpt}}^{\mathrm{ref}} 𝕄1stlayerref\mathbb{M}_{\mathrm{1^{st}\ layer}}^{\mathrm{ref}} 𝕄avgckptpref\mathbb{M}_{\mathrm{avg\ ckpt\ }p}^{\mathrm{ref}}
𝕄dis\mathbb{M}_{\mathrm{dis}} 0.974 694 112 070 692 50.974\,694\,112\,070\,692\,5 0.818 852 304 482 682 10.818\,852\,304\,482\,682\,1 0.959 277 199 719 739 80.959\,277\,199\,719\,739\,8 0.927 566 142 640 975 70.927\,566\,142\,640\,975\,7 0.934 499 639 959 985 40.934\,499\,639\,959\,985\,4
𝕄ent\mathbb{M}_{\mathrm{ent}} 0.962 257 383 776 325 40.962\,257\,383\,776\,325\,4 0.805 310 772 997 800 20.805\,310\,772\,997\,800\,2 0.948 381 951 969 656 90.948\,381\,951\,969\,656\,9 0.929 356 680 795 655 50.929\,356\,680\,795\,655\,5 0.928 091 872 240 783 30.928\,091\,872\,240\,783\,3
𝕄avgent\mathbb{M}_{\mathrm{avg\ ent}} 0.782 835 525 064 216 60.782\,835\,525\,064\,216\,6 0.723 576 719 782 101 70.723\,576\,719\,782\,101\,7 0.800 003 411 721 4150.800\,003\,411\,721\,415 0.911 840 453 725 753 30.911\,840\,453\,725\,753\,3 0.752 974 539 858 217 30.752\,974\,539\,858\,217\,3
𝕄CPα=0.05\mathbb{M}_{\mathrm{CP\ }\alpha=0.05} 0.576 975 294 659 734 40.576\,975\,294\,659\,734\,4 0.581 901 978 226 1950.581\,901\,978\,226\,195 0.585 745 755 533 177 10.585\,745\,755\,533\,177\,1 0.711 961 304 717 463 70.711\,961\,304\,717\,463\,7 0.566 419 367 656 178 40.566\,419\,367\,656\,178\,4
𝕄CPα=0.1\mathbb{M}_{\mathrm{CP\ }\alpha=0.1} 0.658 140 704 914 718 70.658\,140\,704\,914\,718\,7 0.628 151 219 183 850.628\,151\,219\,183\,85 0.667 996 152 778 633 20.667\,996\,152\,778\,633\,2 0.797 076 351 755 790.797\,076\,351\,755\,79 0.646 625 636 822 681 70.646\,625\,636\,822\,681\,7
𝕄CPα=0.2\mathbb{M}_{\mathrm{CP\ }\alpha=0.2} 0.755 911 016 584 462 10.755\,911\,016\,584\,462\,1 0.675 294 955 071 374 80.675\,294\,955\,071\,374\,8 0.769 301 300 922 529 70.769\,301\,300\,922\,529\,7 0.888 753 239 497 529 20.888\,753\,239\,497\,529\,2 0.738 570 807 957 870.738\,570\,807\,957\,87
(b) <1B models, datapoints where most models succeed
𝕄failref\mathbb{M}_{\mathrm{fail}}^{\mathrm{ref}} 𝕄1stlayerref\mathbb{M}_{\mathrm{1^{st}\ layer}}^{\mathrm{ref}} 𝕄1stckptref\mathbb{M}_{\mathrm{1^{st}\ ckpt}}^{\mathrm{ref}} 𝕄avgckptref\mathbb{M}_{\mathrm{avg\ ckpt}}^{\mathrm{ref}} 𝕄avgckptpref\mathbb{M}_{\mathrm{avg\ ckpt\ }p}^{\mathrm{ref}}
𝕄dis\mathbb{M}_{\mathrm{dis}} 0.804 354 819 590 257 3-0.804\,354\,819\,590\,257\,3 0.791 000 776 214 750 1-0.791\,000\,776\,214\,750\,1 0.804 101 549 771 035 4-0.804\,101\,549\,771\,035\,4 0.777 324 099 403 975 8-0.777\,324\,099\,403\,975\,8 0.778 449 753 276 862 2-0.778\,449\,753\,276\,862\,2
𝕄ent\mathbb{M}_{\mathrm{ent}} 0.759 396 252 958 866 7-0.759\,396\,252\,958\,866\,7 0.745 693 868 064 205 8-0.745\,693\,868\,064\,205\,8 0.764 023 236 757 757 1-0.764\,023\,236\,757\,757\,1 0.734 645 558 219 412 8-0.734\,645\,558\,219\,412\,8 0.732 016 499 034 311 3-0.732\,016\,499\,034\,311\,3
𝕄avgent\mathbb{M}_{\mathrm{avg\ ent}} 0.542 210 202 307 993 4-0.542\,210\,202\,307\,993\,4 0.493 281 035 591 613 9-0.493\,281\,035\,591\,613\,9 0.488 416 409 974 237 8-0.488\,416\,409\,974\,237\,8 0.525 855 842 468 130 6-0.525\,855\,842\,468\,130\,6 0.536 484 756 578 883 1-0.536\,484\,756\,578\,883\,1
𝕄CPα=0.05\mathbb{M}_{\mathrm{CP\ }\alpha=0.05} 0.141 523 056 279 406 42-0.141\,523\,056\,279\,406\,42 0.118 559 465 263 494 65-0.118\,559\,465\,263\,494\,65 0.161 428 929 693 458 37-0.161\,428\,929\,693\,458\,37 0.124 618 806 431 964 27-0.124\,618\,806\,431\,964\,27 0.110 574 835 487 220 75-0.110\,574\,835\,487\,220\,75
𝕄CPα=0.1\mathbb{M}_{\mathrm{CP\ }\alpha=0.1} 0.391 268 325 787 170 63-0.391\,268\,325\,787\,170\,63 0.360 962 164 193 647 46-0.360\,962\,164\,193\,647\,46 0.401 403 285 877 585 6-0.401\,403\,285\,877\,585\,6 0.372 446 737 849 283 4-0.372\,446\,737\,849\,283\,4 0.370 583 363 591 819 37-0.370\,583\,363\,591\,819\,37
𝕄CPα=0.2\mathbb{M}_{\mathrm{CP\ }\alpha=0.2} 0.529 317 628 297 110 8-0.529\,317\,628\,297\,110\,8 0.484 286 422 583 588 95-0.484\,286\,422\,583\,588\,95 0.517 910 480 805 350 8-0.517\,910\,480\,805\,350\,8 0.515 480 700 088 486 7-0.515\,480\,700\,088\,486\,7 0.518 156 738 505 736 8-0.518\,156\,738\,505\,736\,8
(c) 1B models, datapoints where most models fail
𝕄failref\mathbb{M}_{\mathrm{fail}}^{\mathrm{ref}} 𝕄1stlayerref\mathbb{M}_{\mathrm{1^{st}\ layer}}^{\mathrm{ref}} 𝕄1stckptref\mathbb{M}_{\mathrm{1^{st}\ ckpt}}^{\mathrm{ref}} 𝕄avgckptref\mathbb{M}_{\mathrm{avg\ ckpt}}^{\mathrm{ref}} 𝕄avgckptpref\mathbb{M}_{\mathrm{avg\ ckpt\ }p}^{\mathrm{ref}}
𝕄dis\mathbb{M}_{\mathrm{dis}} 0.976 691 065 405 410 20.976\,691\,065\,405\,410\,2 0.895 087 377 626 741 20.895\,087\,377\,626\,741\,2 0.941 337 608 406 343 80.941\,337\,608\,406\,343\,8 0.944 698 227 592 881 70.944\,698\,227\,592\,881\,7 0.945 856 529 736 4780.945\,856\,529\,736\,478
𝕄ent\mathbb{M}_{\mathrm{ent}} 0.963 495 754 502 536 70.963\,495\,754\,502\,536\,7 0.887 543 906 048 299 80.887\,543\,906\,048\,299\,8 0.930 939 939 747 751 70.930\,939\,939\,747\,751\,7 0.933 720 101 113 904 50.933\,720\,101\,113\,904\,5 0.935 764 582 532 892 10.935\,764\,582\,532\,892\,1
𝕄avgent\mathbb{M}_{\mathrm{avg\ ent}} 0.741 427 543 704 216 80.741\,427\,543\,704\,216\,8 0.734 480 221 403 179 40.734\,480\,221\,403\,179\,4 0.786 320 047 260 814 80.786\,320\,047\,260\,814\,8 0.733 884 647 188 753 70.733\,884\,647\,188\,753\,7 0.753 199 744 333 883 90.753\,199\,744\,333\,883\,9
𝕄CPα=0.05\mathbb{M}_{\mathrm{CP\ }\alpha=0.05} 0.054 717 120 725 648 940.054\,717\,120\,725\,648\,94 0.053 963 122 100 030 650.053\,963\,122\,100\,030\,65 0.036 602 964 287 446 030.036\,602\,964\,287\,446\,03 0.043 222 177 690 850 7240.043\,222\,177\,690\,850\,724 0.032 955 575 474 607 760.032\,955\,575\,474\,607\,76
𝕄CPα=0.1\mathbb{M}_{\mathrm{CP\ }\alpha=0.1} 0.505 772 329 003 101 70.505\,772\,329\,003\,101\,7 0.520 374 909 028 914 90.520\,374\,909\,028\,914\,9 0.522 006 958 908 230 70.522\,006\,958\,908\,230\,7 0.499 486 866 414 476 870.499\,486\,866\,414\,476\,87 0.515 894 621 778 279 20.515\,894\,621\,778\,279\,2
𝕄CPα=0.2\mathbb{M}_{\mathrm{CP\ }\alpha=0.2} 0.673 440 035 165 016 80.673\,440\,035\,165\,016\,8 0.680 574 068 929 829 30.680\,574\,068\,929\,829\,3 0.709 125 045 494 0410.709\,125\,045\,494\,041 0.666 102 625 572 287 80.666\,102\,625\,572\,287\,8 0.693 601 597 282 066 70.693\,601\,597\,282\,066\,7
(d) 1B models, datapoints where most models succeed
Table 9: Spearman correlation on MNLI data between reference-dependent and reference-free indicators of data complexity, broken down by average model success or failure.
𝕄failref\mathbb{M}_{\mathrm{fail}}^{\mathrm{ref}} 𝕄1stlayerref\mathbb{M}_{\mathrm{1^{st}\ layer}}^{\mathrm{ref}} 𝕄1stckptref\mathbb{M}_{\mathrm{1^{st}\ ckpt}}^{\mathrm{ref}} 𝕄avgckptref\mathbb{M}_{\mathrm{avg\ ckpt}}^{\mathrm{ref}} 𝕄avgckptpref\mathbb{M}_{\mathrm{avg\ ckpt\ }p}^{\mathrm{ref}}
𝕄dis\mathbb{M}_{\mathrm{dis}} 0.732 909 792 296 174 3-0.732\,909\,792\,296\,174\,3 0.689 162 874 906 08-0.689\,162\,874\,906\,08 0.732 279 077 377 907 1-0.732\,279\,077\,377\,907\,1 0.698 853 400 592 208 2-0.698\,853\,400\,592\,208\,2 0.643 514 132 878 540 3-0.643\,514\,132\,878\,540\,3
𝕄ent\mathbb{M}_{\mathrm{ent}} 0.653 909 354 002 062 5-0.653\,909\,354\,002\,062\,5 0.625 915 281 453 885 6-0.625\,915\,281\,453\,885\,6 0.651 927 097 590 931 3-0.651\,927\,097\,590\,931\,3 0.628 745 160 920 227 6-0.628\,745\,160\,920\,227\,6 0.550 873 447 077 403 8-0.550\,873\,447\,077\,403\,8
𝕄avgent\mathbb{M}_{\mathrm{avg\ ent}} 0.210 607 386 388 862 67-0.210\,607\,386\,388\,862\,67 0.209 387 344 244 335 3-0.209\,387\,344\,244\,335\,3 0.192 555 994 950 545 87-0.192\,555\,994\,950\,545\,87 0.196 902 682 781 715 83-0.196\,902\,682\,781\,715\,83 0.209 385 462 056 039 42-0.209\,385\,462\,056\,039\,42
𝕄CPα=0.05\mathbb{M}_{\mathrm{CP\ }\alpha=0.05} 0.205 571 462 939 808 5-0.205\,571\,462\,939\,808\,5 0.221 308 747 769 677 24-0.221\,308\,747\,769\,677\,24 0.190 305 459 363 854 04-0.190\,305\,459\,363\,854\,04 0.208 931 914 900 836 73-0.208\,931\,914\,900\,836\,73 0.146 326 139 531 123 44-0.146\,326\,139\,531\,123\,44
𝕄CPα=0.1\mathbb{M}_{\mathrm{CP\ }\alpha=0.1} 0.244 931 304 732 206 48-0.244\,931\,304\,732\,206\,48 0.259 494 233 292 255 46-0.259\,494\,233\,292\,255\,46 0.224 846 667 462 587 02-0.224\,846\,667\,462\,587\,02 0.245 365 558 169 727 74-0.245\,365\,558\,169\,727\,74 0.206 679 789 528 054 7-0.206\,679\,789\,528\,054\,7
𝕄CPα=0.2\mathbb{M}_{\mathrm{CP\ }\alpha=0.2} 0.372 963 845 859 184 6-0.372\,963\,845\,859\,184\,6 0.380 135 861 164 482 3-0.380\,135\,861\,164\,482\,3 0.346 473 865 132 785 9-0.346\,473\,865\,132\,785\,9 0.365 817 758 688 476 8-0.365\,817\,758\,688\,476\,8 0.374 267 740 874 870 64-0.374\,267\,740\,874\,870\,64
(a) <1B models, soft labels, datapoints where most models fail
𝕄failref\mathbb{M}_{\mathrm{fail}}^{\mathrm{ref}} 𝕄1stlayerref\mathbb{M}_{\mathrm{1^{st}\ layer}}^{\mathrm{ref}} 𝕄1stckptref\mathbb{M}_{\mathrm{1^{st}\ ckpt}}^{\mathrm{ref}} 𝕄avgckptref\mathbb{M}_{\mathrm{avg\ ckpt}}^{\mathrm{ref}} 𝕄avgckptpref\mathbb{M}_{\mathrm{avg\ ckpt\ }p}^{\mathrm{ref}}
𝕄dis\mathbb{M}_{\mathrm{dis}} 0.977 713 923 975 482 80.977\,713\,923\,975\,482\,8 0.911 531 571 905 452 30.911\,531\,571\,905\,452\,3 0.966 593 433 909 429 90.966\,593\,433\,909\,429\,9 0.945 222 437 561 901 70.945\,222\,437\,561\,901\,7 0.737 506 017 195 636 80.737\,506\,017\,195\,636\,8
𝕄ent\mathbb{M}_{\mathrm{ent}} 0.950 194 918 122 640 10.950\,194\,918\,122\,640\,1 0.903 898 537 547 524 70.903\,898\,537\,547\,524\,7 0.940 601 339 978 540 50.940\,601\,339\,978\,540\,5 0.923 139 995 883 832 30.923\,139\,995\,883\,832\,3 0.744 178 802 226 910 50.744\,178\,802\,226\,910\,5
𝕄avgent\mathbb{M}_{\mathrm{avg\ ent}} 0.491 742 283 061 507 10.491\,742\,283\,061\,507\,1 0.503 664 969 838 576 70.503\,664\,969\,838\,576\,7 0.510 686 661 308 615 70.510\,686\,661\,308\,615\,7 0.459 210 803 057 695 570.459\,210\,803\,057\,695\,57 0.930 616 321 480 476 90.930\,616\,321\,480\,476\,9
𝕄CPα=0.05\mathbb{M}_{\mathrm{CP\ }\alpha=0.05} 0.543 327 166 213 260 80.543\,327\,166\,213\,260\,8 0.590 425 812 474 433 20.590\,425\,812\,474\,433\,2 0.559 212 838 706 075 50.559\,212\,838\,706\,075\,5 0.528 046 718 975 570 40.528\,046\,718\,975\,570\,4 0.892 718 657 399 223 60.892\,718\,657\,399\,223\,6
𝕄CPα=0.1\mathbb{M}_{\mathrm{CP\ }\alpha=0.1} 0.623 712 365 777 573 30.623\,712\,365\,777\,573\,3 0.643 945 098 556 525 60.643\,945\,098\,556\,525\,6 0.642 340 002 964 117 50.642\,340\,002\,964\,117\,5 0.600 467 039 190 086 70.600\,467\,039\,190\,086\,7 0.936 713 075 094 433 10.936\,713\,075\,094\,433\,1
𝕄CPα=0.2\mathbb{M}_{\mathrm{CP\ }\alpha=0.2} 0.735 097 168 243 535 30.735\,097\,168\,243\,535\,3 0.715 101 879 392 913 40.715\,101\,879\,392\,913\,4 0.754 173 917 197 042 20.754\,173\,917\,197\,042\,2 0.703 201 728 920 845 80.703\,201\,728\,920\,845\,8 0.897 473 806 680 460 40.897\,473\,806\,680\,460\,4
(b) <1B models, soft labels, datapoints where most models succeed
𝕄failref\mathbb{M}_{\mathrm{fail}}^{\mathrm{ref}} 𝕄1stlayerref\mathbb{M}_{\mathrm{1^{st}\ layer}}^{\mathrm{ref}} 𝕄1stckptref\mathbb{M}_{\mathrm{1^{st}\ ckpt}}^{\mathrm{ref}} 𝕄avgckptref\mathbb{M}_{\mathrm{avg\ ckpt}}^{\mathrm{ref}} 𝕄avgckptpref\mathbb{M}_{\mathrm{avg\ ckpt\ }p}^{\mathrm{ref}}
𝕄dis\mathbb{M}_{\mathrm{dis}} 0.741 979 874 434 302 2-0.741\,979\,874\,434\,302\,2 0.720 806 322 556 436 7-0.720\,806\,322\,556\,436\,7 0.743 709 800 157 977-0.743\,709\,800\,157\,977 0.717 797 134 822 337 5-0.717\,797\,134\,822\,337\,5 0.630 957 061 670 016-0.630\,957\,061\,670\,016
𝕄ent\mathbb{M}_{\mathrm{ent}} 0.679 176 208 884 438-0.679\,176\,208\,884\,438 0.670 465 244 834 426 5-0.670\,465\,244\,834\,426\,5 0.680 399 253 431 243 6-0.680\,399\,253\,431\,243\,6 0.655 948 661 921 153 5-0.655\,948\,661\,921\,153\,5 0.560 942 225 545 257-0.560\,942\,225\,545\,257
𝕄avgent\mathbb{M}_{\mathrm{avg\ ent}} 0.321 277 368 547 707 66-0.321\,277\,368\,547\,707\,66 0.334 976 074 486 988 74-0.334\,976\,074\,486\,988\,74 0.305 346 945 552 374 6-0.305\,346\,945\,552\,374\,6 0.297 794 159 405 189 05-0.297\,794\,159\,405\,189\,05 0.299 066 733 802 170 6-0.299\,066\,733\,802\,170\,6
𝕄CPα=0.05\mathbb{M}_{\mathrm{CP\ }\alpha=0.05} 0.306 222 712 405 623 5-0.306\,222\,712\,405\,623\,5 0.312 646 454 694 845 6-0.312\,646\,454\,694\,845\,6 0.290 597 460 858 921 74-0.290\,597\,460\,858\,921\,74 0.294 494 565 497 423 75-0.294\,494\,565\,497\,423\,75 0.243 242 501 660 952 76-0.243\,242\,501\,660\,952\,76
𝕄CPα=0.1\mathbb{M}_{\mathrm{CP\ }\alpha=0.1} 0.384 817 496 841 679 15-0.384\,817\,496\,841\,679\,15 0.380 520 934 484 972 15-0.380\,520\,934\,484\,972\,15 0.366 407 855 163 472 46-0.366\,407\,855\,163\,472\,46 0.374 702 978 235 362 3-0.374\,702\,978\,235\,362\,3 0.346 453 340 077 644 33-0.346\,453\,340\,077\,644\,33
𝕄CPα=0.2\mathbb{M}_{\mathrm{CP\ }\alpha=0.2} 0.487 536 068 035 414 6-0.487\,536\,068\,035\,414\,6 0.482 143 678 254 014 5-0.482\,143\,678\,254\,014\,5 0.464 731 487 665 655 7-0.464\,731\,487\,665\,655\,7 0.479 304 192 439 108 27-0.479\,304\,192\,439\,108\,27 0.477 114 304 365 596 04-0.477\,114\,304\,365\,596\,04
(c) <1B models, hard labels, datapoints where most models fail
𝕄failref\mathbb{M}_{\mathrm{fail}}^{\mathrm{ref}} 𝕄1stlayerref\mathbb{M}_{\mathrm{1^{st}\ layer}}^{\mathrm{ref}} 𝕄1stckptref\mathbb{M}_{\mathrm{1^{st}\ ckpt}}^{\mathrm{ref}} 𝕄avgckptref\mathbb{M}_{\mathrm{avg\ ckpt}}^{\mathrm{ref}} 𝕄avgckptpref\mathbb{M}_{\mathrm{avg\ ckpt\ }p}^{\mathrm{ref}}
𝕄dis\mathbb{M}_{\mathrm{dis}} 0.983 218 461 641 626 70.983\,218\,461\,641\,626\,7 0.865 886 244 670 960 10.865\,886\,244\,670\,960\,1 0.958 021 343 834 620 60.958\,021\,343\,834\,620\,6 0.945 390 910 499 474 70.945\,390\,910\,499\,474\,7 0.692 377 868 048 473 50.692\,377\,868\,048\,473\,5
𝕄ent\mathbb{M}_{\mathrm{ent}} 0.969 200 733 772 171 80.969\,200\,733\,772\,171\,8 0.854 721 134 557 005 70.854\,721\,134\,557\,005\,7 0.944 755 943 207 001 50.944\,755\,943\,207\,001\,5 0.933 748 215 192 400 60.933\,748\,215\,192\,400\,6 0.702 214 556 643 320 60.702\,214\,556\,643\,320\,6
𝕄avgent\mathbb{M}_{\mathrm{avg\ ent}} 0.462 796 794 406 050 40.462\,796\,794\,406\,050\,4 0.443 828 323 651 289 940.443\,828\,323\,651\,289\,94 0.483 457 504 377 416 30.483\,457\,504\,377\,416\,3 0.460 154 899 490 393 450.460\,154\,899\,490\,393\,45 0.926 473 816 922 972 40.926\,473\,816\,922\,972\,4
𝕄CPα=0.05\mathbb{M}_{\mathrm{CP\ }\alpha=0.05} 0.472 519 250 211 521 40.472\,519\,250\,211\,521\,4 0.437 885 072 186 160 60.437\,885\,072\,186\,160\,6 0.494 308 005 849 201 80.494\,308\,005\,849\,201\,8 0.483 678 433 547 908 850.483\,678\,433\,547\,908\,85 0.863 909 973 317 039 90.863\,909\,973\,317\,039\,9
𝕄CPα=0.1\mathbb{M}_{\mathrm{CP\ }\alpha=0.1} 0.611 556 707 247 6360.611\,556\,707\,247\,636 0.583 107 933 709 263 80.583\,107\,933\,709\,263\,8 0.631 811 404 314 040 60.631\,811\,404\,314\,040\,6 0.612 949 950 835 691 40.612\,949\,950\,835\,691\,4 0.920 914 402 380 574 50.920\,914\,402\,380\,574\,5
𝕄CPα=0.2\mathbb{M}_{\mathrm{CP\ }\alpha=0.2} 0.738 028 205 623 475 40.738\,028\,205\,623\,475\,4 0.752 818 522 688 976 50.752\,818\,522\,688\,976\,5 0.750 922 753 071 806 90.750\,922\,753\,071\,806\,9 0.719 407 453 842 968 70.719\,407\,453\,842\,968\,7 0.812 351 845 994 666 90.812\,351\,845\,994\,666\,9
(d) <1B models, hard labels, datapoints where most models succeed
𝕄failref\mathbb{M}_{\mathrm{fail}}^{\mathrm{ref}} 𝕄1stlayerref\mathbb{M}_{\mathrm{1^{st}\ layer}}^{\mathrm{ref}} 𝕄1stckptref\mathbb{M}_{\mathrm{1^{st}\ ckpt}}^{\mathrm{ref}} 𝕄avgckptref\mathbb{M}_{\mathrm{avg\ ckpt}}^{\mathrm{ref}} 𝕄avgckptpref\mathbb{M}_{\mathrm{avg\ ckpt\ }p}^{\mathrm{ref}}
𝕄dis\mathbb{M}_{\mathrm{dis}} 0.808 926 813 001 420 3-0.808\,926\,813\,001\,420\,3 0.762 014 735 888 452 5-0.762\,014\,735\,888\,452\,5 0.793 438 085 495 902 1-0.793\,438\,085\,495\,902\,1 0.757 249 222 084 221 4-0.757\,249\,222\,084\,221\,4 0.749 870 624 625 944 7-0.749\,870\,624\,625\,944\,7
𝕄ent\mathbb{M}_{\mathrm{ent}} 0.716 682 230 357 844 8-0.716\,682\,230\,357\,844\,8 0.689 689 143 350 361 9-0.689\,689\,143\,350\,361\,9 0.712 674 200 814 982 5-0.712\,674\,200\,814\,982\,5 0.678 479 941 043 295-0.678\,479\,941\,043\,295 0.661 606 577 610 349 5-0.661\,606\,577\,610\,349\,5
𝕄avgent\mathbb{M}_{\mathrm{avg\ ent}} 0.420 117 699 747 919 57-0.420\,117\,699\,747\,919\,57 0.336 463 773 025 694 36-0.336\,463\,773\,025\,694\,36 0.303 131 193 633 788 5-0.303\,131\,193\,633\,788\,5 0.428 077 077 847 102 86-0.428\,077\,077\,847\,102\,86 0.426 818 537 255 446 6-0.426\,818\,537\,255\,446\,6
𝕄CPα=0.05\mathbb{M}_{\mathrm{CP\ }\alpha=0.05} 0.426 776 946 465 805 2-0.426\,776\,946\,465\,805\,2 0.357 890 971 029 898 25-0.357\,890\,971\,029\,898\,25 0.355 495 571 358 546 04-0.355\,495\,571\,358\,546\,04 0.423 755 174 375 889 3-0.423\,755\,174\,375\,889\,3 0.412 238 720 378 586 5-0.412\,238\,720\,378\,586\,5
𝕄CPα=0.1\mathbb{M}_{\mathrm{CP\ }\alpha=0.1} 0.436 610 406 355 725 84-0.436\,610\,406\,355\,725\,84 0.359 398 000 180 413 46-0.359\,398\,000\,180\,413\,46 0.340 701 755 427 862 85-0.340\,701\,755\,427\,862\,85 0.447 012 482 804 504 95-0.447\,012\,482\,804\,504\,95 0.443 000 393 885 863 8-0.443\,000\,393\,885\,863\,8
𝕄CPα=0.2\mathbb{M}_{\mathrm{CP\ }\alpha=0.2} 0.392 389 350 130 805 20.392\,389\,350\,130\,805\,2 0.341 713 880 069 052 60.341\,713\,880\,069\,052\,6 0.298 965 592 221 233 370.298\,965\,592\,221\,233\,37 0.400 585 625 877 7550.400\,585\,625\,877\,755 0.399 582 101 840 413 50.399\,582\,101\,840\,413\,5
(e) 1B models, soft labels, datapoints where most models fail
𝕄failref\mathbb{M}_{\mathrm{fail}}^{\mathrm{ref}} 𝕄1stlayerref\mathbb{M}_{\mathrm{1^{st}\ layer}}^{\mathrm{ref}} 𝕄1stckptref\mathbb{M}_{\mathrm{1^{st}\ ckpt}}^{\mathrm{ref}} 𝕄avgckptref\mathbb{M}_{\mathrm{avg\ ckpt}}^{\mathrm{ref}} 𝕄avgckptpref\mathbb{M}_{\mathrm{avg\ ckpt\ }p}^{\mathrm{ref}}
𝕄dis\mathbb{M}_{\mathrm{dis}} 0.868 110 246 263 784 30.868\,110\,246\,263\,784\,3 0.718 515 115 925 855 30.718\,515\,115\,925\,855\,3 0.844 245 860 208 968 10.844\,245\,860\,208\,968\,1 0.829 247 726 067 102 40.829\,247\,726\,067\,102\,4 0.785 448 819 312 768 80.785\,448\,819\,312\,768\,8
𝕄ent\mathbb{M}_{\mathrm{ent}} 0.866 641 356 602 770 60.866\,641\,356\,602\,770\,6 0.716 959 289 200 600 70.716\,959\,289\,200\,600\,7 0.842 528 473 612 344 70.842\,528\,473\,612\,344\,7 0.827 858 507 138 742 30.827\,858\,507\,138\,742\,3 0.784 896 465 102 5050.784\,896\,465\,102\,505
𝕄avgent\mathbb{M}_{\mathrm{avg\ ent}} 0.793 722 126 575 156 60.793\,722\,126\,575\,156\,6 0.784 335 795 386 348 90.784\,335\,795\,386\,348\,9 0.814 594 008 712 988 80.814\,594\,008\,712\,988\,8 0.794 270 189 132 395 80.794\,270\,189\,132\,395\,8 0.939 870 160 448 0530.939\,870\,160\,448\,053
𝕄CPα=0.05\mathbb{M}_{\mathrm{CP\ }\alpha=0.05} 0.793 464 366 476 750 10.793\,464\,366\,476\,750\,1 0.771 495 480 144 378 50.771\,495\,480\,144\,378\,5 0.816 605 578 291 569 90.816\,605\,578\,291\,569\,9 0.792 294 966 290 603 50.792\,294\,966\,290\,603\,5 0.923 870 061 785 703 10.923\,870\,061\,785\,703\,1
𝕄CPα=0.1\mathbb{M}_{\mathrm{CP\ }\alpha=0.1} 0.805 609 734 650 650 60.805\,609\,734\,650\,650\,6 0.731 143 303 591 420 30.731\,143\,303\,591\,420\,3 0.832 796 653 450 323 40.832\,796\,653\,450\,323\,4 0.798 026 963 470 056 20.798\,026\,963\,470\,056\,2 0.868 751 170 240 8360.868\,751\,170\,240\,836
𝕄CPα=0.2\mathbb{M}_{\mathrm{CP\ }\alpha=0.2} 0.379 421 673 359 652 7-0.379\,421\,673\,359\,652\,7 0.361 254 636 976 930 83-0.361\,254\,636\,976\,930\,83 0.388 033 608 483 972 06-0.388\,033\,608\,483\,972\,06 0.371 478 573 067 894 34-0.371\,478\,573\,067\,894\,34 0.403 254 300 002 938 44-0.403\,254\,300\,002\,938\,44
(f) 1B models, soft labels, datapoints where most models succeed
𝕄failref\mathbb{M}_{\mathrm{fail}}^{\mathrm{ref}} 𝕄1stlayerref\mathbb{M}_{\mathrm{1^{st}\ layer}}^{\mathrm{ref}} 𝕄1stckptref\mathbb{M}_{\mathrm{1^{st}\ ckpt}}^{\mathrm{ref}} 𝕄avgckptref\mathbb{M}_{\mathrm{avg\ ckpt}}^{\mathrm{ref}} 𝕄avgckptpref\mathbb{M}_{\mathrm{avg\ ckpt\ }p}^{\mathrm{ref}}
𝕄dis\mathbb{M}_{\mathrm{dis}} 0.812 073 984 329 561 9-0.812\,073\,984\,329\,561\,9 0.782 177 632 694 313 5-0.782\,177\,632\,694\,313\,5 0.818 307 704 946 195 1-0.818\,307\,704\,946\,195\,1 0.746 558 350 112 125 3-0.746\,558\,350\,112\,125\,3 0.548 102 413 841 498-0.548\,102\,413\,841\,498
𝕄ent\mathbb{M}_{\mathrm{ent}} 0.723 266 939 762 940 9-0.723\,266\,939\,762\,940\,9 0.704 409 105 534 243 1-0.704\,409\,105\,534\,243\,1 0.738 444 826 181 923 5-0.738\,444\,826\,181\,923\,5 0.669 321 999 766 848 8-0.669\,321\,999\,766\,848\,8 0.448 141 750 906 741 6-0.448\,141\,750\,906\,741\,6
𝕄avgent\mathbb{M}_{\mathrm{avg\ ent}} 0.458 393 009 860 123 3-0.458\,393\,009\,860\,123\,3 0.419 314 150 649 395 1-0.419\,314\,150\,649\,395\,1 0.411 755 553 175 935 43-0.411\,755\,553\,175\,935\,43 0.436 375 384 808 268 6-0.436\,375\,384\,808\,268\,6 0.226 717 619 062 078 2-0.226\,717\,619\,062\,078\,2
𝕄CPα=0.05\mathbb{M}_{\mathrm{CP\ }\alpha=0.05} 0.469 273 096 656 700 75-0.469\,273\,096\,656\,700\,75 0.436 912 222 269 464 3-0.436\,912\,222\,269\,464\,3 0.402 648 483 499 771 56-0.402\,648\,483\,499\,771\,56 0.459 280 380 864 397 6-0.459\,280\,380\,864\,397\,6 0.337 143 758 798 896 6-0.337\,143\,758\,798\,896\,6
𝕄CPα=0.1\mathbb{M}_{\mathrm{CP\ }\alpha=0.1} 0.467 804 776 669 161 04-0.467\,804\,776\,669\,161\,04 0.373 085 626 453 842 2-0.373\,085\,626\,453\,842\,2 0.337 631 560 984 306 86-0.337\,631\,560\,984\,306\,86 0.484 375 371 213 966 2-0.484\,375\,371\,213\,966\,2 0.546 885 363 569 206 6-0.546\,885\,363\,569\,206\,6
𝕄CPα=0.2\mathbb{M}_{\mathrm{CP\ }\alpha=0.2} 0.279 493 544 788 897 90.279\,493\,544\,788\,897\,9 0.240 028 455 544 874 180.240\,028\,455\,544\,874\,18 0.243 196 472 776 161 220.243\,196\,472\,776\,161\,22 0.263 419 611 018 582 240.263\,419\,611\,018\,582\,24 0.066 946 880 467 371 060.066\,946\,880\,467\,371\,06
(g) 1B models, hard labels, datapoints where most models fail
𝕄failref\mathbb{M}_{\mathrm{fail}}^{\mathrm{ref}} 𝕄1stlayerref\mathbb{M}_{\mathrm{1^{st}\ layer}}^{\mathrm{ref}} 𝕄1stckptref\mathbb{M}_{\mathrm{1^{st}\ ckpt}}^{\mathrm{ref}} 𝕄avgckptref\mathbb{M}_{\mathrm{avg\ ckpt}}^{\mathrm{ref}} 𝕄avgckptpref\mathbb{M}_{\mathrm{avg\ ckpt\ }p}^{\mathrm{ref}}
𝕄dis\mathbb{M}_{\mathrm{dis}} 0.852 189 332 695 596 40.852\,189\,332\,695\,596\,4 0.738 335 145 270 324 30.738\,335\,145\,270\,324\,3 0.830 252 696 138 848 20.830\,252\,696\,138\,848\,2 0.823 068 261 973 855 60.823\,068\,261\,973\,855\,6 0.808 379 492 800 846 90.808\,379\,492\,800\,846\,9
𝕄ent\mathbb{M}_{\mathrm{ent}} 0.850 983 157 734 525 40.850\,983\,157\,734\,525\,4 0.737 174 359 346 884 80.737\,174\,359\,346\,884\,8 0.828 888 414 850 207 30.828\,888\,414\,850\,207\,3 0.822 004 759 409 124 30.822\,004\,759\,409\,124\,3 0.807 349 382 701 857 90.807\,349\,382\,701\,857\,9
𝕄avgent\mathbb{M}_{\mathrm{avg\ ent}} 0.786 037 205 287 959 10.786\,037\,205\,287\,959\,1 0.669 325 406 486 967 80.669\,325\,406\,486\,967\,8 0.811 273 893 722 004 50.811\,273\,893\,722\,004\,5 0.776 957 417 981 966 80.776\,957\,417\,981\,966\,8 0.851 897 082 596 860 90.851\,897\,082\,596\,860\,9
𝕄CPα=0.05\mathbb{M}_{\mathrm{CP\ }\alpha=0.05} 0.709 120 977 241 586 50.709\,120\,977\,241\,586\,5 0.581 180 976 163 541 90.581\,180\,976\,163\,541\,9 0.730 149 638 662 945 70.730\,149\,638\,662\,945\,7 0.707 383 060 334 267 10.707\,383\,060\,334\,267\,1 0.769 746 928 993 299 20.769\,746\,928\,993\,299\,2
𝕄CPα=0.1\mathbb{M}_{\mathrm{CP\ }\alpha=0.1} 0.779 412 254 877 580 40.779\,412\,254\,877\,580\,4 0.658 822 060 466 765 60.658\,822\,060\,466\,765\,6 0.805 716 449 141 019 70.805\,716\,449\,141\,019\,7 0.772 905 819 787 983 50.772\,905\,819\,787\,983\,5 0.822 471 243 546 166 50.822\,471\,243\,546\,166\,5
𝕄CPα=0.2\mathbb{M}_{\mathrm{CP\ }\alpha=0.2} 0.525 487 656 704 118 8-0.525\,487\,656\,704\,118\,8 0.479 361 974 790 060 4-0.479\,361\,974\,790\,060\,4 0.553 813 104 688 775 2-0.553\,813\,104\,688\,775\,2 0.517 193 423 099 339 9-0.517\,193\,423\,099\,339\,9 0.533 163 756 435 052-0.533\,163\,756\,435\,052
(h) 1B models, hard labels, datapoints where most models succeed
Table 10: Spearman correlation on DynaSent re-balanced data between reference-dependent and reference-free indicators of data complexity, broken down by average model success or failure.

We have already mentioned the surprising anti-correlation of 𝕄CPα=0.2\mathbb{M}_{\mathrm{CP\ }\alpha=0.2} on DynaSent within the 1B pool in the main body of the text, here we see that this unexpected behavior also impacts its joint distributions. Another case worth highlighting concerns 𝕄CPα=0.05\mathbb{M}_{\mathrm{CP\ }\alpha=0.05} on MNLI within the 1B pool: correlations and anti-correlations are of remarkably lower magnitudes, which suggests that this specific indicator is not in line with any of the reference-dependent indicators we consider. This is in line with our remarks that the exact setup considered always plays a More broadly, these observations largely confirm our claims in the main body of this article: We find that in most cases, the discrepancy between reference-free and reference-dependent indicators is due to the former conflating model success and model failure.

B.3 Factors shaping model dissensus

We can also leverage the different pools of models to assess how their factors of variation might impact data complexity metrics. In particular, our heterogeneous group of 1B models was defined with respect to different PLMs and training subsets, and therefore we can measure whether pretraining conditions are more impactful than supervised fine-tuning data. In practice, we can measure how likely it is that two predictions for a specific datapoint will match, given that they were made by classifiers trained from the same model or by classifiers trained on the same training subset of SNLI. This can be measured using common language effect sizes derived from a Mann-Whitney U test. Doing suggests a statistically significant effect from both splits and models (p<1044p<10^{-44}) with a very small effect size (f51.2%f\approx 51.2\%) on SNLI. On MNLI, we find a somewhat stronger effect (f=53.10%,p<ϵf=53.10\%,p<\epsilon) when considering classifiers derived from the same PLM; as for the training data, it appears to yield the opposite effect, though with a much higher pp-value (f=49.77%,p<103f=49.77\%,p<10^{-3}). For DynaSent, recall we have no sub-splits to experiment with; however we do find a positive effect when considering classifiers derived from the same PLMs (f=53.63%,p<ϵf=53.63\%,p<\epsilon).

Our homogeneous <1B pool also allows us to look into whether responses are more likely to differ for two models with a larger difference in number of parameters. To test this, we can measure the likelihood of the parameter count difference being larger when the predictions differ using U tests. Doing so, we can observe a common language effect size of f=45.96%f=45.96\% on SNLI, f=45.63%f=45.63\% on MNLI, and f=45.69%f=45.69\% on DynaSent. We can likewise observe a similar effect when focusing on our heterogeneous pool: we find a common language effect size of f=48.90%f=48.90\% for SNLI, f=45.63%f=45.63\% for MNLI, and f=43.72%f=43.72\% on DynaSent. In other words, predictions that match tend to come from models with more similar parameter counts.

B.4 Replication of DynaSent experiments without re-balancing

For the sake of exhaustiveness, we include experimental results derived all usable datapoints in DynaSent, i.e., without applying the label re-balancing step we detail in §5. This entails several key differences. In particular, we now consider a classification with imbalanced labels among four possible classes (instead of three evenly split classes as per §5), but have access to more data to fit our classifiers. Also note that by construction Potts et al. (2021) exclude datapoints classified by a majority of annotators as ‘mixed’ from the test sets, meaning there is a clear distributional shift between train and test.

<1B pool 1B pool
soft hard soft hard
𝕄dis\mathbb{M}_{\mathrm{dis}} 0.069 4600.069\,460 0.069 9300.069\,930 0.138 0160.138\,016 0.133 2440.133\,244
𝕄ent\mathbb{M}_{\mathrm{ent}} 0.071 1700.071\,170 0.080 0610.080\,061 0.144 8650.144\,865 0.136 7780.136\,778
𝕄avgent\mathbb{M}_{\mathrm{avg\ ent}} 0.141 5440.141\,544 0.130 0620.130\,062 0.208 1420.208\,142 0.131 9720.131\,972
𝕄CPα=0.05\mathbb{M}_{\mathrm{CP\ }\alpha=0.05} 0.127 8120.127\,812 0.126 4540.126\,454 0.188 0750.188\,075 0.153 3010.153\,301
𝕄CPα=0.1\mathbb{M}_{\mathrm{CP\ }\alpha=0.1} 0.129 2000.129\,200 0.125 0540.125\,054 0.195 1790.195\,179 0.155 6500.155\,650
𝕄CPα=0.2\mathbb{M}_{\mathrm{CP\ }\alpha=0.2} 0.124 7490.124\,749 0.108 6970.108\,697 0.029 4480.029\,448 0.070 8660.070\,866
𝕄failref\mathbb{M}_{\mathrm{fail}}^{\mathrm{ref}} 0.139 8670.139\,867 0.142 6330.142\,633 0.170 8670.170\,867 0.172 4660.172\,466
𝕄1stlayerref\mathbb{M}_{\mathrm{1^{st}\ layer}}^{\mathrm{ref}} 0.123 9160.123\,916 0.120 5250.120\,525 0.201 2570.201\,257 0.184 2860.184\,286
𝕄1stckptref\mathbb{M}_{\mathrm{1^{st}\ ckpt}}^{\mathrm{ref}} 0.141 1140.141\,114 0.143 7870.143\,787 0.198 9890.198\,989 0.200 6280.200\,628
𝕄avgckptref\mathbb{M}_{\mathrm{avg\ ckpt}}^{\mathrm{ref}} 0.134 4440.134\,444 0.137 0360.137\,036 0.173 9820.173\,982 0.174 8680.174\,868
𝕄avgckptpref\mathbb{M}_{\mathrm{avg\ ckpt\ }p}^{\mathrm{ref}} 0.162 7320.162\,732 0.160 5260.160\,526 0.221 3950.221\,395 0.188 5180.188\,518
Table 11: Spearman’s ρ\rho between model-based indicators vs. human-based (entropy) indicator on DynaSent.

Comparisons between model-based and human-based indicators are shown in Table˜11. The main point to be stressed is that we replicate the core findings stressed in the main body of the text, with two key differences. First, we do not observe an anti-correlation for 𝕄CPα=0.2\mathbb{M}_{\mathrm{CP\ }\alpha=0.2} within the 1B pool pof models. Second, the use of soft labels does not appear to be beneficial to any indicator derived from the <1B pool of models. Soft labels do remain useful to 1B models, and we still observe that soft labels are not sufficient for reference-free indicators to systematically bridge the gap separating them from reference-dependent indicators.

𝕄failref\mathbb{M}_{\mathrm{fail}}^{\mathrm{ref}} 𝕄1stlayerref\mathbb{M}_{\mathrm{1^{st}\ layer}}^{\mathrm{ref}} 𝕄1stckptref\mathbb{M}_{\mathrm{1^{st}\ ckpt}}^{\mathrm{ref}} 𝕄avgckptref\mathbb{M}_{\mathrm{avg\ ckpt}}^{\mathrm{ref}} 𝕄avgckptpref\mathbb{M}_{\mathrm{avg\ ckpt\ }p}^{\mathrm{ref}}
𝕄dis\mathbb{M}_{\mathrm{dis}} 0.778 569 665 678 730 1-0.778\,569\,665\,678\,730\,1 0.757 439 462 327 021 1-0.757\,439\,462\,327\,021\,1 0.787 502 125 632 680 1-0.787\,502\,125\,632\,680\,1 0.770 913 270 900 132 6-0.770\,913\,270\,900\,132\,6 0.704 065 031 394 969 6-0.704\,065\,031\,394\,969\,6
𝕄ent\mathbb{M}_{\mathrm{ent}} 0.733 930 186 982 442 2-0.733\,930\,186\,982\,442\,2 0.720 175 361 056 670 3-0.720\,175\,361\,056\,670\,3 0.740 227 818 716 558 5-0.740\,227\,818\,716\,558\,5 0.732 661 147 258 595 4-0.732\,661\,147\,258\,595\,4 0.644 807 103 832 146 2-0.644\,807\,103\,832\,146\,2
𝕄avgent\mathbb{M}_{\mathrm{avg\ ent}} 0.534 749 888 454 062 2-0.534\,749\,888\,454\,062\,2 0.508 555 656 874 351 2-0.508\,555\,656\,874\,351\,2 0.505 933 429 545 280 6-0.505\,933\,429\,545\,280\,6 0.545 969 870 059 206 7-0.545\,969\,870\,059\,206\,7 0.511 570 161 123 357 4-0.511\,570\,161\,123\,357\,4
𝕄CPα=0.05\mathbb{M}_{\mathrm{CP\ }\alpha=0.05} 0.491 356 744 040 869 43-0.491\,356\,744\,040\,869\,43 0.461 005 631 129 833 3-0.461\,005\,631\,129\,833\,3 0.467 253 892 498 652 73-0.467\,253\,892\,498\,652\,73 0.504 906 003 381 028 9-0.504\,906\,003\,381\,028\,9 0.460 007 798 544 836 75-0.460\,007\,798\,544\,836\,75
𝕄CPα=0.1\mathbb{M}_{\mathrm{CP\ }\alpha=0.1} 0.496 342 548 351 868 36-0.496\,342\,548\,351\,868\,36 0.470 110 641 966 406 56-0.470\,110\,641\,966\,406\,56 0.467 163 844 671 333 9-0.467\,163\,844\,671\,333\,9 0.508 977 695 396 073 6-0.508\,977\,695\,396\,073\,6 0.474 080 077 750 776 2-0.474\,080\,077\,750\,776\,2
𝕄CPα=0.2\mathbb{M}_{\mathrm{CP\ }\alpha=0.2} 0.543 261 108 846 019 5-0.543\,261\,108\,846\,019\,5 0.528 764 949 303 155-0.528\,764\,949\,303\,155 0.514 633 692 869 216 1-0.514\,633\,692\,869\,216\,1 0.553 460 820 151 879 9-0.553\,460\,820\,151\,879\,9 0.546 990 100 517 256 6-0.546\,990\,100\,517\,256\,6
(a) <1B models, soft labels, datapoints where most models fail
𝕄failref\mathbb{M}_{\mathrm{fail}}^{\mathrm{ref}} 𝕄1stlayerref\mathbb{M}_{\mathrm{1^{st}\ layer}}^{\mathrm{ref}} 𝕄1stckptref\mathbb{M}_{\mathrm{1^{st}\ ckpt}}^{\mathrm{ref}} 𝕄avgckptref\mathbb{M}_{\mathrm{avg\ ckpt}}^{\mathrm{ref}} 𝕄avgckptpref\mathbb{M}_{\mathrm{avg\ ckpt\ }p}^{\mathrm{ref}}
𝕄dis\mathbb{M}_{\mathrm{dis}} 0.944 941 000 131 587 20.944\,941\,000\,131\,587\,2 0.909 969 550 052 717 30.909\,969\,550\,052\,717\,3 0.941 638 037 809 040 90.941\,638\,037\,809\,040\,9 0.931 239 541 797 643 50.931\,239\,541\,797\,643\,5 0.886 499 009 656 984 50.886\,499\,009\,656\,984\,5
𝕄ent\mathbb{M}_{\mathrm{ent}} 0.936 551 019 228 686 60.936\,551\,019\,228\,686\,6 0.910 575 519 373 889 40.910\,575\,519\,373\,889\,4 0.934 219 149 115 678 80.934\,219\,149\,115\,678\,8 0.924 588 167 317 892 60.924\,588\,167\,317\,892\,6 0.895 264 297 306 2890.895\,264\,297\,306\,289
𝕄avgent\mathbb{M}_{\mathrm{avg\ ent}} 0.741 083 558 870 904 90.741\,083\,558\,870\,904\,9 0.796 584 545 441 159 20.796\,584\,545\,441\,159\,2 0.756 571 127 538 5380.756\,571\,127\,538\,538 0.728 347 646 214 028 30.728\,347\,646\,214\,028\,3 0.954 395 292 251 739 50.954\,395\,292\,251\,739\,5
𝕄CPα=0.05\mathbb{M}_{\mathrm{CP\ }\alpha=0.05} 0.711 450 404 279 1070.711\,450\,404\,279\,107 0.786 951 172 654 887 90.786\,951\,172\,654\,887\,9 0.724 216 086 704 363 30.724\,216\,086\,704\,363\,3 0.704 006 467 119 936 50.704\,006\,467\,119\,936\,5 0.927 045 284 954 434 10.927\,045\,284\,954\,434\,1
𝕄CPα=0.1\mathbb{M}_{\mathrm{CP\ }\alpha=0.1} 0.739 031 007 970 2190.739\,031\,007\,970\,219 0.797 339 695 637 041 30.797\,339\,695\,637\,041\,3 0.753 850 241 135 489 90.753\,850\,241\,135\,489\,9 0.728 556 130 374 621 70.728\,556\,130\,374\,621\,7 0.945 261 361 249 564 50.945\,261\,361\,249\,564\,5
𝕄CPα=0.2\mathbb{M}_{\mathrm{CP\ }\alpha=0.2} 0.787 305 550 895 728 40.787\,305\,550\,895\,728\,4 0.818 911 560 353 3120.818\,911\,560\,353\,312 0.803 824 441 198 123 60.803\,824\,441\,198\,123\,6 0.773 447 520 815 227 20.773\,447\,520\,815\,227\,2 0.949 309 956 875 071 90.949\,309\,956\,875\,071\,9
(b) <1B models, soft labels, datapoints where most models succeed
𝕄failref\mathbb{M}_{\mathrm{fail}}^{\mathrm{ref}} 𝕄1stlayerref\mathbb{M}_{\mathrm{1^{st}\ layer}}^{\mathrm{ref}} 𝕄1stckptref\mathbb{M}_{\mathrm{1^{st}\ ckpt}}^{\mathrm{ref}} 𝕄avgckptref\mathbb{M}_{\mathrm{avg\ ckpt}}^{\mathrm{ref}} 𝕄avgckptpref\mathbb{M}_{\mathrm{avg\ ckpt\ }p}^{\mathrm{ref}}
𝕄dis\mathbb{M}_{\mathrm{dis}} 0.799 657 878 200 981 3-0.799\,657\,878\,200\,981\,3 0.752 611 597 444 261 6-0.752\,611\,597\,444\,261\,6 0.795 708 319 837 715 8-0.795\,708\,319\,837\,715\,8 0.788 480 982 115 323 9-0.788\,480\,982\,115\,323\,9 0.721 650 857 333 218-0.721\,650\,857\,333\,218
𝕄ent\mathbb{M}_{\mathrm{ent}} 0.756 750 459 768 371 6-0.756\,750\,459\,768\,371\,6 0.715 410 088 723 545 6-0.715\,410\,088\,723\,545\,6 0.751 374 901 627 042 6-0.751\,374\,901\,627\,042\,6 0.752 785 414 984 108 4-0.752\,785\,414\,984\,108\,4 0.667 986 159 019 300 7-0.667\,986\,159\,019\,300\,7
𝕄avgent\mathbb{M}_{\mathrm{avg\ ent}} 0.580 728 236 203 617 9-0.580\,728\,236\,203\,617\,9 0.538 792 599 161 751 9-0.538\,792\,599\,161\,751\,9 0.548 319 180 944 930 9-0.548\,319\,180\,944\,930\,9 0.593 790 369 481 737-0.593\,790\,369\,481\,737 0.550 716 069 069 956 3-0.550\,716\,069\,069\,956\,3
𝕄CPα=0.05\mathbb{M}_{\mathrm{CP\ }\alpha=0.05} 0.509 010 351 450 946 2-0.509\,010\,351\,450\,946\,2 0.457 877 171 407 875 2-0.457\,877\,171\,407\,875\,2 0.480 517 316 481 804 24-0.480\,517\,316\,481\,804\,24 0.525 080 163 304 441 8-0.525\,080\,163\,304\,441\,8 0.474 901 215 723 172 84-0.474\,901\,215\,723\,172\,84
𝕄CPα=0.1\mathbb{M}_{\mathrm{CP\ }\alpha=0.1} 0.510 709 478 151 483 7-0.510\,709\,478\,151\,483\,7 0.472 091 730 933 977 94-0.472\,091\,730\,933\,977\,94 0.482 595 326 448 523 93-0.482\,595\,326\,448\,523\,93 0.521 302 752 625 332 8-0.521\,302\,752\,625\,332\,8 0.494 378 417 895 460 44-0.494\,378\,417\,895\,460\,44
𝕄CPα=0.2\mathbb{M}_{\mathrm{CP\ }\alpha=0.2} 0.556 499 188 547 315 3-0.556\,499\,188\,547\,315\,3 0.529 922 006 083 104 5-0.529\,922\,006\,083\,104\,5 0.524 387 811 757 357 7-0.524\,387\,811\,757\,357\,7 0.562 178 865 013 177 8-0.562\,178\,865\,013\,177\,8 0.571 005 115 092 926 8-0.571\,005\,115\,092\,926\,8
(c) <1B models, hard labels, datapoints where most models fail
𝕄failref\mathbb{M}_{\mathrm{fail}}^{\mathrm{ref}} 𝕄1stlayerref\mathbb{M}_{\mathrm{1^{st}\ layer}}^{\mathrm{ref}} 𝕄1stckptref\mathbb{M}_{\mathrm{1^{st}\ ckpt}}^{\mathrm{ref}} 𝕄avgckptref\mathbb{M}_{\mathrm{avg\ ckpt}}^{\mathrm{ref}} 𝕄avgckptpref\mathbb{M}_{\mathrm{avg\ ckpt\ }p}^{\mathrm{ref}}
𝕄dis\mathbb{M}_{\mathrm{dis}} 0.943 184 175 229 645 50.943\,184\,175\,229\,645\,5 0.876 117 879 153 099 10.876\,117\,879\,153\,099\,1 0.937 612 474 105 917 30.937\,612\,474\,105\,917\,3 0.922 652 123 958 487 20.922\,652\,123\,958\,487\,2 0.887 835 311 532 840 10.887\,835\,311\,532\,840\,1
𝕄ent\mathbb{M}_{\mathrm{ent}} 0.936 113 100 940 828 30.936\,113\,100\,940\,828\,3 0.881 680 637 262 972 70.881\,680\,637\,262\,972\,7 0.932 109 376 783 198 70.932\,109\,376\,783\,198\,7 0.918 060 020 676 1830.918\,060\,020\,676\,183 0.896 318 798 998 1280.896\,318\,798\,998\,128
𝕄avgent\mathbb{M}_{\mathrm{avg\ ent}} 0.792 454 759 195 125 50.792\,454\,759\,195\,125\,5 0.808 961 787 030 797 60.808\,961\,787\,030\,797\,6 0.810 389 356 454 547 90.810\,389\,356\,454\,547\,9 0.783 768 624 346 992 30.783\,768\,624\,346\,992\,3 0.969 060 671 295 173 70.969\,060\,671\,295\,173\,7
𝕄CPα=0.05\mathbb{M}_{\mathrm{CP\ }\alpha=0.05} 0.742 734 449 616 212 30.742\,734\,449\,616\,212\,3 0.781 682 460 168 9470.781\,682\,460\,168\,947 0.759 588 430 914 189 90.759\,588\,430\,914\,189\,9 0.738 122 681 271 365 20.738\,122\,681\,271\,365\,2 0.936 308 143 826 725 30.936\,308\,143\,826\,725\,3
𝕄CPα=0.1\mathbb{M}_{\mathrm{CP\ }\alpha=0.1} 0.760 825 384 819 046 50.760\,825\,384\,819\,046\,5 0.784 015 702 087 863 10.784\,015\,702\,087\,863\,1 0.778 754 596 734 784 40.778\,754\,596\,734\,784\,4 0.750 905 001 696 303 30.750\,905\,001\,696\,303\,3 0.946 731 521 156 848 80.946\,731\,521\,156\,848\,8
𝕄CPα=0.2\mathbb{M}_{\mathrm{CP\ }\alpha=0.2} 0.814 595 191 421 9030.814\,595\,191\,421\,903 0.809 632 307 434 720 30.809\,632\,307\,434\,720\,3 0.832 725 028 046 499 70.832\,725\,028\,046\,499\,7 0.798 889 359 525 8860.798\,889\,359\,525\,886 0.950 607 541 632 706 30.950\,607\,541\,632\,706\,3
(d) <1B models, hard labels, datapoints where most models succeed
𝕄failref\mathbb{M}_{\mathrm{fail}}^{\mathrm{ref}} 𝕄1stlayerref\mathbb{M}_{\mathrm{1^{st}\ layer}}^{\mathrm{ref}} 𝕄1stckptref\mathbb{M}_{\mathrm{1^{st}\ ckpt}}^{\mathrm{ref}} 𝕄avgckptref\mathbb{M}_{\mathrm{avg\ ckpt}}^{\mathrm{ref}} 𝕄avgckptpref\mathbb{M}_{\mathrm{avg\ ckpt\ }p}^{\mathrm{ref}}
𝕄dis\mathbb{M}_{\mathrm{dis}} 0.758 137 137 374 850 7-0.758\,137\,137\,374\,850\,7 0.693 812 611 965 747 7-0.693\,812\,611\,965\,747\,7 0.759 087 232 501 410 6-0.759\,087\,232\,501\,410\,6 0.697 279 155 213 629 4-0.697\,279\,155\,213\,629\,4 0.461 751 479 541 632 54-0.461\,751\,479\,541\,632\,54
𝕄ent\mathbb{M}_{\mathrm{ent}} 0.673 092 973 184 066 9-0.673\,092\,973\,184\,066\,9 0.625 910 345 305 990 5-0.625\,910\,345\,305\,990\,5 0.685 579 143 885 9-0.685\,579\,143\,885\,9 0.620 157 832 757 849 1-0.620\,157\,832\,757\,849\,1 0.361 607 141 004 168 3-0.361\,607\,141\,004\,168\,3
𝕄avgent\mathbb{M}_{\mathrm{avg\ ent}} 0.407 335 103 258 649 2-0.407\,335\,103\,258\,649\,2 0.315 450 676 913 826-0.315\,450\,676\,913\,826 0.382 919 948 192 304-0.382\,919\,948\,192\,304 0.403 022 840 207 652 06-0.403\,022\,840\,207\,652\,06 0.117 965 250 514 705 72-0.117\,965\,250\,514\,705\,72
𝕄CPα=0.05\mathbb{M}_{\mathrm{CP\ }\alpha=0.05} 0.371 060 318 680 235 6-0.371\,060\,318\,680\,235\,6 0.292 440 742 454 583 24-0.292\,440\,742\,454\,583\,24 0.353 037 638 326 331 56-0.353\,037\,638\,326\,331\,56 0.366 666 479 068 536 83-0.366\,666\,479\,068\,536\,83 0.113 438 103 815 981 71-0.113\,438\,103\,815\,981\,71
𝕄CPα=0.1\mathbb{M}_{\mathrm{CP\ }\alpha=0.1} 0.579 437 691 788 969-0.579\,437\,691\,788\,969 0.484 859 499 690 084 2-0.484\,859\,499\,690\,084\,2 0.469 057 094 585 568-0.469\,057\,094\,585\,568 0.580 599 719 956 403 6-0.580\,599\,719\,956\,403\,6 0.577 776 829 187 245 3-0.577\,776\,829\,187\,245\,3
𝕄CPα=0.2\mathbb{M}_{\mathrm{CP\ }\alpha=0.2} 0.065 429 287 526 620 2-0.065\,429\,287\,526\,620\,2 0.086 236 195 885 977 17-0.086\,236\,195\,885\,977\,17 0.010 342 620 206 129 6850.010\,342\,620\,206\,129\,685 0.066 322 502 045 638 39-0.066\,322\,502\,045\,638\,39 0.332 732 439 753 065 5-0.332\,732\,439\,753\,065\,5
(e) 1B models, soft labels, datapoints where most models fail
𝕄failref\mathbb{M}_{\mathrm{fail}}^{\mathrm{ref}} 𝕄1stlayerref\mathbb{M}_{\mathrm{1^{st}\ layer}}^{\mathrm{ref}} 𝕄1stckptref\mathbb{M}_{\mathrm{1^{st}\ ckpt}}^{\mathrm{ref}} 𝕄avgckptref\mathbb{M}_{\mathrm{avg\ ckpt}}^{\mathrm{ref}} 𝕄avgckptpref\mathbb{M}_{\mathrm{avg\ ckpt\ }p}^{\mathrm{ref}}
𝕄dis\mathbb{M}_{\mathrm{dis}} 0.867 174 654 794 658 90.867\,174\,654\,794\,658\,9 0.696 509 750 330 569 30.696\,509\,750\,330\,569\,3 0.836 240 216 611 065 80.836\,240\,216\,611\,065\,8 0.831 786 634 717 193 40.831\,786\,634\,717\,193\,4 0.791 989 630 801 215 40.791\,989\,630\,801\,215\,4
𝕄ent\mathbb{M}_{\mathrm{ent}} 0.865 391 911 570 521 50.865\,391\,911\,570\,521\,5 0.695 587 617 180 003 70.695\,587\,617\,180\,003\,7 0.834 185 864 818 044 80.834\,185\,864\,818\,044\,8 0.830 387 426 188 685 10.830\,387\,426\,188\,685\,1 0.792 306 353 176 030 70.792\,306\,353\,176\,030\,7
𝕄avgent\mathbb{M}_{\mathrm{avg\ ent}} 0.780 302 546 131 801 20.780\,302\,546\,131\,801\,2 0.760 461 516 736 105 50.760\,461\,516\,736\,105\,5 0.809 885 412 039 387 40.809\,885\,412\,039\,387\,4 0.779 894 358 478 938 80.779\,894\,358\,478\,938\,8 0.934 622 640 603 469 40.934\,622\,640\,603\,469\,4
𝕄CPα=0.05\mathbb{M}_{\mathrm{CP\ }\alpha=0.05} 0.737 988 111 028 881 70.737\,988\,111\,028\,881\,7 0.700 686 034 675 8150.700\,686\,034\,675\,815 0.768 745 021 662 9490.768\,745\,021\,662\,949 0.737 746 319 495 4580.737\,746\,319\,495\,458 0.897 485 455 053 132 70.897\,485\,455\,053\,132\,7
𝕄CPα=0.1\mathbb{M}_{\mathrm{CP\ }\alpha=0.1} 0.774 599 695 963 064 20.774\,599\,695\,963\,064\,2 0.702 284 690 318 009 10.702\,284\,690\,318\,009\,1 0.819 862 141 668 3930.819\,862\,141\,668\,393 0.769 957 117 253 504 90.769\,957\,117\,253\,504\,9 0.882 258 804 978 219 40.882\,258\,804\,978\,219\,4
𝕄CPα=0.2\mathbb{M}_{\mathrm{CP\ }\alpha=0.2} 0.168 595 136 911 407 40.168\,595\,136\,911\,407\,4 0.085 647 764 444 882 840.085\,647\,764\,444\,882\,84 0.196 971 286 321 393 440.196\,971\,286\,321\,393\,44 0.164 672 714 277 215 750.164\,672\,714\,277\,215\,75 0.139 610 831 091 039 140.139\,610\,831\,091\,039\,14
(f) 1B models, soft labels, datapoints where most models succeed
𝕄failref\mathbb{M}_{\mathrm{fail}}^{\mathrm{ref}} 𝕄1stlayerref\mathbb{M}_{\mathrm{1^{st}\ layer}}^{\mathrm{ref}} 𝕄1stckptref\mathbb{M}_{\mathrm{1^{st}\ ckpt}}^{\mathrm{ref}} 𝕄avgckptref\mathbb{M}_{\mathrm{avg\ ckpt}}^{\mathrm{ref}} 𝕄avgckptpref\mathbb{M}_{\mathrm{avg\ ckpt\ }p}^{\mathrm{ref}}
𝕄dis\mathbb{M}_{\mathrm{dis}} 0.752 323 619 931 766 4-0.752\,323\,619\,931\,766\,4 0.723 247 692 121 742-0.723\,247\,692\,121\,742 0.744 962 930 587 969 3-0.744\,962\,930\,587\,969\,3 0.710 881 445 489 736 8-0.710\,881\,445\,489\,736\,8 0.688 333 643 780 122 1-0.688\,333\,643\,780\,122\,1
𝕄ent\mathbb{M}_{\mathrm{ent}} 0.675 362 910 433 859 3-0.675\,362\,910\,433\,859\,3 0.649 048 380 552 167 2-0.649\,048\,380\,552\,167\,2 0.677 237 831 946 812 9-0.677\,237\,831\,946\,812\,9 0.642 997 409 743 934 9-0.642\,997\,409\,743\,934\,9 0.610 376 056 159 710 4-0.610\,376\,056\,159\,710\,4
𝕄avgent\mathbb{M}_{\mathrm{avg\ ent}} 0.498 538 818 163 503 5-0.498\,538\,818\,163\,503\,5 0.419 764 604 306 318 96-0.419\,764\,604\,306\,318\,96 0.394 320 495 396 560 44-0.394\,320\,495\,396\,560\,44 0.495 335 674 915 664 5-0.495\,335\,674\,915\,664\,5 0.481 435 256 520 002 24-0.481\,435\,256\,520\,002\,24
𝕄CPα=0.05\mathbb{M}_{\mathrm{CP\ }\alpha=0.05} 0.422 788 533 396 342 37-0.422\,788\,533\,396\,342\,37 0.349 312 065 083 362 3-0.349\,312\,065\,083\,362\,3 0.366 302 519 485 482 87-0.366\,302\,519\,485\,482\,87 0.426 843 460 514 482 6-0.426\,843\,460\,514\,482\,6 0.400 120 685 617 332 4-0.400\,120\,685\,617\,332\,4
𝕄CPα=0.1\mathbb{M}_{\mathrm{CP\ }\alpha=0.1} 0.465 699 367 443 010 5-0.465\,699\,367\,443\,010\,5 0.392 496 605 257 901 53-0.392\,496\,605\,257\,901\,53 0.399 886 969 715 086 4-0.399\,886\,969\,715\,086\,4 0.471 594 041 400 731-0.471\,594\,041\,400\,731 0.444 036 267 064 685 5-0.444\,036\,267\,064\,685\,5
𝕄CPα=0.2\mathbb{M}_{\mathrm{CP\ }\alpha=0.2} 0.306 167 372 917 830 36-0.306\,167\,372\,917\,830\,36 0.250 803 759 970 516 6-0.250\,803\,759\,970\,516\,6 0.248 437 181 752 080 27-0.248\,437\,181\,752\,080\,27 0.303 936 391 525 614 36-0.303\,936\,391\,525\,614\,36 0.309 034 589 213 682 65-0.309\,034\,589\,213\,682\,65
(g) 1B models, hard labels, datapoints where most models fail
𝕄failref\mathbb{M}_{\mathrm{fail}}^{\mathrm{ref}} 𝕄1stlayerref\mathbb{M}_{\mathrm{1^{st}\ layer}}^{\mathrm{ref}} 𝕄1stckptref\mathbb{M}_{\mathrm{1^{st}\ ckpt}}^{\mathrm{ref}} 𝕄avgckptref\mathbb{M}_{\mathrm{avg\ ckpt}}^{\mathrm{ref}} 𝕄avgckptpref\mathbb{M}_{\mathrm{avg\ ckpt\ }p}^{\mathrm{ref}}
𝕄dis\mathbb{M}_{\mathrm{dis}} 0.857 367 377 865 078 60.857\,367\,377\,865\,078\,6 0.746 552 440 439 353 30.746\,552\,440\,439\,353\,3 0.823 946 295 074 937 80.823\,946\,295\,074\,937\,8 0.822 072 297 620 899 50.822\,072\,297\,620\,899\,5 0.816 994 612 629 784 60.816\,994\,612\,629\,784\,6
𝕄ent\mathbb{M}_{\mathrm{ent}} 0.854 973 285 579 516 50.854\,973\,285\,579\,516\,5 0.744 864 473 194 425 80.744\,864\,473\,194\,425\,8 0.821 199 866 701 595 30.821\,199\,866\,701\,595\,3 0.819 607 750 186 322 10.819\,607\,750\,186\,322\,1 0.814 791 734 373 477 40.814\,791\,734\,373\,477\,4
𝕄avgent\mathbb{M}_{\mathrm{avg\ ent}} 0.763 882 728 648 433 20.763\,882\,728\,648\,433\,2 0.635 779 835 296 552 50.635\,779\,835\,296\,552\,5 0.798 846 984 175 952 60.798\,846\,984\,175\,952\,6 0.750 585 157 786 737 80.750\,585\,157\,786\,737\,8 0.809 100 366 385 752 20.809\,100\,366\,385\,752\,2
𝕄CPα=0.05\mathbb{M}_{\mathrm{CP\ }\alpha=0.05} 0.702 251 779 689 721 90.702\,251\,779\,689\,721\,9 0.610 321 487 247 841 10.610\,321\,487\,247\,841\,1 0.723 433 649 031 881 50.723\,433\,649\,031\,881\,5 0.702 575 417 937 919 20.702\,575\,417\,937\,919\,2 0.735 744 720 281 843 10.735\,744\,720\,281\,843\,1
𝕄CPα=0.1\mathbb{M}_{\mathrm{CP\ }\alpha=0.1} 0.748 239 795 592 540 40.748\,239\,795\,592\,540\,4 0.624 103 757 098 900 10.624\,103\,757\,098\,900\,1 0.776 898 879 598 135 50.776\,898\,879\,598\,135\,5 0.743 839 300 686 841 30.743\,839\,300\,686\,841\,3 0.788 373 076 503 282 30.788\,373\,076\,503\,282\,3
𝕄CPα=0.2\mathbb{M}_{\mathrm{CP\ }\alpha=0.2} 0.482 983 895 350 3730.482\,983\,895\,350\,373 0.415 369 285 877 670 860.415\,369\,285\,877\,670\,86 0.497 665 126 615 8690.497\,665\,126\,615\,869 0.478 247 741 395 325 050.478\,247\,741\,395\,325\,05 0.489 819 260 239 978 570.489\,819\,260\,239\,978\,57
(h) 1B models, hard labels, datapoints where most models succeed
Table 12: Spearman correlation on DynaSent data (without label re-balancing) between reference-dependent and reference-free indicators of data complexity, broken down by average model success or failure.

We further include evidence for the inverted U-shapes of the joint distributions of reference-free and reference-dependent indicators in Table˜12. Remarks similar to what we already discussed in §B.2 can be made.

Overall, this supplementary experiment suggests an interesting perspective for future work: Label-imbalance does impact our indicators, as Ho and Basu (2002) suggest, but its exact effects appear to be contingent on the exact pool of models under consideration.