Topological Invariants in Invasion Percolation
Abstract
Based on bond percolation theory, a method is presented here to calculate the relationship between capillary pressure and saturation in porous media from first principles. The governing equations are formulated on the undirected graph of the pore network. The graph is a simplified mathematical object that accounts for the topology of the pore structure. Thus, the calculation is extremely computationally efficient since it is mesh-free and voxel-free. Two topological invariants are identified: The bond percolation threshold and the residual saturation. Bond percolation theory is used to obtain a closed-form pressure-saturation relation in terms of the geometry of the pores (pore throat distribution) and material parameters (contact angle and interfacial tension), universal exponents, and topological invariants, based on scaling relations.
The movement of one fluid, displacing another in a porous medium, appears in various fields such as physics [1], geology [2], hydrology [3], and social sciences [4]. Understanding this process, known as invasion percolation [5], is of paramount importance. Our productivity each day depends on two factors: (1) whether hot water can pass through the ground coffee in our coffee machine and (2) how efficiently hot water extracts the richness of the coffee compounds. The first factor is controlled by the percolation threshold, while the second factor is related to residual saturation. This Letter shows that these two quantities are topological invariants; they do not depend on neither material properties nor geometry of porous media. Instead, these depend only on the topology of the porous network and can be derived from the percolation theory.
Percolation is one of the most documented emerging phenomena in complex systems. It appears when the nodes or bonds in a random network are progressively activated, creating connected clusters where complex patterns emerge [1, 4]. In bond percolation theory, the control parameter is defined as the probability of bond occupancy in a network. A phase transition occurs at a critical value . above this value, large-scale connectivity begins to emerge in the lattice. Perhaps the most exciting theoretical advance on bond percolation is the Kensen theorem [6] that provides a rigorous demonstration that the bond percolation threshold for infinite-square lattices is . Kersten theorem confirmed previous analytical derivations by Sykes and Essan, who also showed bond percolation threshold of , , and for triangular, rectangular,and honeycomb lattices [7]. Far less theoretical advances have been presented on invasion percolation. To date, it is still not clear how the percolation transition and the residual saturation in invasion percolation are related to the topology and morphology of the porous media and the material parameters of the pores and fluids. This Letter closes this gap by using bond percolation theory to relate the capillary pressure-saturation relations to the topological invariants, pore throat distribution, and interfacial properties of solid and liquids.
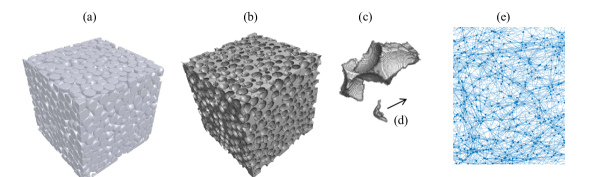
It is assumed that the porous medium is initially filled with a resident fluid, and it is progressively invaded by another fluid in an immiscible and incompressible fashion. The pore network is represented as the complement of the binary image of the solid matrix, as shown in Fig. 1. The void space can be segmented into pores by binary watershed segmentation: First, pores are defined as the catching basins of the distance map; then the throats are resolved as the narrowest surfaces between the pores [9, 10]. The pore network can be morphologically eroded to convert it to an one-dimensional object called the skeleton. The skeleton is the center-line passing through the pores that preserves the topology of pore network [11]. To describe the fluid displacement, we take a throat and project its image over the perpendicular plane to the skeleton. Let us define and as area and the perimeter of the projected surface, the balance of forces along the skeleton line is given by the contribution of the capillary pressure and the surface tension in the solid-liquid-liquid interface . where and are the interfacial tension and the contact angle. The equilibrium of forces along the skeleton line leads , that can be written as
| (1) |
Where is the throat radius; note that for a cylindrical throat it reduces to the radius of the cylinder. Let assume that the contact angle is homogeneous. For a given capillary pressure, we can define the active throats as the ones that can potentially be invaded, in virtue to Eq. 1 all throats whose radius satisfies will be potentially invaded. The situation is a bit different for natural porous media, where the mineralogy of the solid matrix is non-homogeneous. In this case, it is necessary to assume that the contact angle changes from throat to throat. To consider this variation on mineralogy, it is assumed that each throat has a contact angle that deviates from the average contact angle . Then, Eq. 1 is expressed as
| (2) |
where is the effective throat radius. Now we can define the active throats as these whose effective radius satisfies . In the same way, we define the active graph from the collection of all active throats
| (3) |
Now lets define the throats as bonds of a random graph. Then the occupancy is defined as the fraction of throats that belong to , i.e , where is the number active bonds and is total the number of bonds. based on Eq. 3, the occupation probability can be calculated in terms of the function , that is the cumulative distribution function of the effective throat radii,
| (4) |
Note that in case of the homogeneous case so that reduces to a cumulative distribution of throat radii. Eq. 4 leads to a beautiful parallel between the quasistatic invasion percolation and bond percolation theory, where the percolation is controlled by the occupation probability . A percolation threshold is expected, above which a phase transition occur, leading to the emergence of giant connected component in the pore network. The order parameter in bond percolation is typically defined as the probability that a given node belongs to the largest cluster [6]. In our case, it is more convenient to use another order parameter that is the saturation; This is defined as the fraction of invaded pores, . It is assumed that all the nodes connected to the invaded throats are invaded.
In addition, we need to extend the bond percolation theory to include residual saturation, which is defined as the amount of resident fluid that gets disconnected to the extraction zone, and hence is trapped during the pore-invasion process. With this aim, the following algorithm is proposed: first, the database for the algorithm is defined by a graph. The undirected graph is defined as a collection of edges (throats) and nodes (pores). Each edge has the indexes of the two nodes to which it connects. The graph is assumed to be a partition of three subgraphs: the defensive, invasive, and trapped ones. These are the collection of pores and throats occupied by the defensive, invasive, and trapped fluid.
As boundary conditions, some of the graph nodes are assumed to be connected to the reservoir where the invasive fluid is injected, and some of the nodes are connected to the evacuation zone where the resident fluid escapes. As for the initial condition, the whole graph corresponds to the defensive graph and the capillary pressure is zero.
In each step of the quasi-static simulation, the capillary pressure is increased, which corresponds to an increase of the occupancy in virtue of Eq. 4. Based on these increments, the following procedure is implemented:
-
1.
(and ) is incremented,
-
2.
is calculated,
-
3.
The active throats are calculated based on the relation ,
-
4.
The active throats and its nodes are added to the active graph,
-
5.
The part of the active graph that is not trapped and is connected to the reservoir is added to the invaded graph.
-
6.
The defended graph is calculated as the graph that is not invaded and is connected to the evacuation zone.
-
7.
The graph that is neither invaded nor defended is added to the trapped graph.
-
8.
Return to Step 1
This algorithm presents sleek advantages over other methods for multiphase flow in porous media, such as the lattice Boltzmann method [12], the level set computational fluid dynamics [13], and the pore morphology methods [14]. This is because the method is quasistatic, mesh-free, voxel-free, and has an unprecedented reduction of the computational complexity since the operations are performed in the extremely reduced dataset of the graph of the pore network. A detailed analysis of the computational complexities is presented in the Supplementary Material.
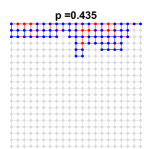
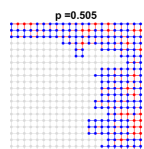
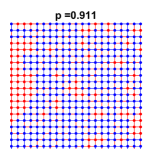
Some snapshots of a simulation with a square lattice are shown in Fig. 2. The upper nodes are connected to the injection zone and the lower one with the evacuation zone. The first stage of the simulation corresponds to the subcritical regime () that is characterized by slow growth of the invaded region with minimal trapping. The percolation transition occurs near and corresponds to the point where the percolation occurs. After percolation, a short regime is detected that starts with the growth of the initial invaded percolation cluster and finishes when the invaded cluster is fully established, creating a backbone where the flow of invaded fluid is fully established. The final stage is characterized by a slow filling of the invaded and trapped fluid that ends with a residual saturation, that is, the final saturation of the resident fluid: . Note that both critical percolation and residual saturation are calculated directly from the graph, so they are topological invariants. They depend only on the topology of the network and not on its geometry or the material properties of the solid matrix and fluids.
An intriguing aspect of the percolation process is the finite-size effects. The percolation transition becomes sharper as the graph size increases, which is a characteristic of critical systems. In addition, strong statistic fluctuations in the residual saturation are observed from sample to sample, so a large number of simulations with the same parameters set are needed to achieve averaged representative pressure-saturation curves. An extensive set of simulations was performed using three different networks: square, triangular, and Voronoi. The critical bond percolation of these lattice is well known [6, 7, 15]. To check the dependence of the pressure-saturation relations on the sample size, we run lattice sizes of , where . For each case, the simulation was performed on random realizations. In each realization, the throat radii were generated using a log-normal distribution. After simulations, the averaged values and standard errors were calculated.
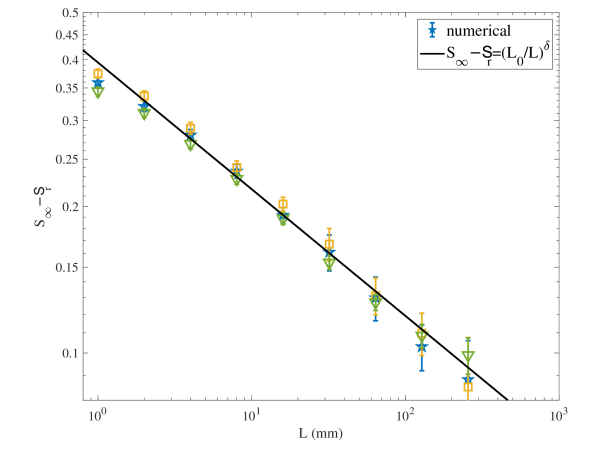
The relation between residual saturation and sample size is shown in Fig. 3. For all cases, the same power law exponent is obtained, suggesting it as a universal exponent in the universality class of regular two-dimensional networks. The exponent is significantly small, indicates a strong size-dependency effect and a slow convergence to the statistical limit. The best fit for the residual saturation is given by
| (5) |
where is the statistical limit of the residual saturation of the resident fluid, and . Based on the residual saturation, we define the normalized saturation as the order parameter of the percolation process. This is given in terms of the lattice site and the occupancy probability
| (6) |
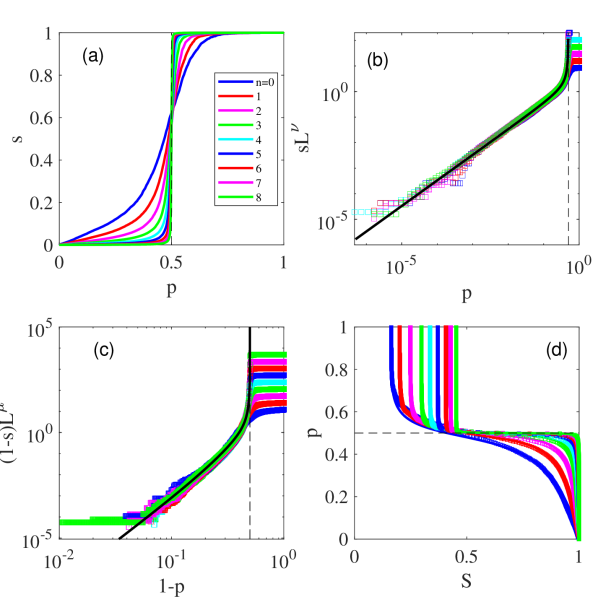
where is the saturation of the resident fluid and is its residual saturation. In percolation theory, it is customary to perform a finite-size scaling analysis of the relation between the order parameter and the control parameter for values close to the critical percolation where a behavior is expected as , see [14]. The curves for different sample sizes are shown in Fig. 4a. These curves suggest self-similar solutions in the subcritical () and supercritical () regimes, with a clear asymmetry in both solutions. To find the self-similar solutions, an asymptotic matching analysis is proposed, by first finding the scaling relations in the sub/super critical regimes, and then asymptotically matching the solutions. For the inner solution, or subcritical solution, (), the following scaling law is proposed
| (7) |
The outer solution, or supercritical solution () shall satisfy the scaling law
| (8) |
Figs. 4(b-c) show a very good collapse in the sub/super critical regimes. The calculated exponents are , , , and . They are the same for all three different lattice topologies used in this Letter, suggesting that these exponents are universal in the universality class of the regular two-dimensional lattices. The self-similar scaling functions and , on the other hand, are lattice dependent and should be estimated from the collapsed curves. The method for obtaining these functions is explained in detail in the Supplementary Material.
The last steps of the scaling analysis is the asymptotic matching. Eq. 7 provides an implicit functional dependency of in terms of that is expressed as . In the same way, is implicitly given in terms of from Eq. 8, which is expressed as . Then, the uniform solution is given by asymptotic matching
| (9) |
The matching solution is compared with the numerical data in Fig. 4(d). An excellent agreement between the numerical results and the self-similar closed-form solution is achieved. Interestingly, these solutions consider only the classical percolation threshold , and they prescind from the backbone percolation transition discussed in the literature [16].
In summary, the relationship between capillary pressure and saturation has been calculated by converting the multiphase flow problem into a bond percolation problem, where the capillary pressure is assigned to the occupancy probability, that is, the control parameter, and normalized saturation is interpreted as the order parameter of the percolation problem. The percolation transition and residual saturation are topological invariants, since they depend on the graph properties only. The closed-form pressure-saturation relation is given in terms of four universal exponents. The topological invariance and the universality of the exponents are quite relevant since they allow one to retrieve general laws that do not depend neither the geometry of the porous medium nor the material properties. The occupation probability is given by an explicit function on the capillary pressure, the cumulative distribution function of throat radii and the material parameters of the solid-liquid-liquid interfaces (interfacial tension and contact angle). Thus, this formulation provides an analytical derivation of the pressure-saturation relationship from first principles.
An outstanding issue is the slow convergence of the residual saturation to the statistical limit. This has implications on the finite-size effects on the representative element volumes (REV) used to obtain the constitutive relations for large-scale simulations. From Eq. 5, the deviation of the residual saturation from its statistical limit is given by . This means that to reduce this deviation by 50%, the REV size must be increased 14 times! This poses a serious question about the way we perform large-scale simulations. These simulations are based on the assumption that the constitutive relations at each grid point are obtained from REVs that is large enough to avoid size effects. However, these effects can only be removed by REV sizes larger than the grid size required to obtain accurate results, establishing a fundamental limit in the accuracy of these simulations. New lights on this fundamental issue can be gained by the analysis of other networks, such as 3D, space-correlated, multi-scale, and small-world networks.
Acknowledgements.
I acknowledge useful discussions with Morteza N. Najafi, and thank Abdullah Alqubalee for assistance in producing Fig. 1, and Laurent Bernard of ReactivIP for support the IPSDK image analysis software.References
- Furuberg et al. [1988] L. Furuberg, J. Feder, A. Aharony, and T. Jøssang, Dynamics of invasion percolation, Physical review letters 61, 2117 (1988).
- Hunt and Sahimi [2017] A. G. Hunt and M. Sahimi, Flow, transport, and reaction in porous media: Percolation scaling, critical-path analysis, and effective medium approximation, Reviews of Geophysics 55, 993 (2017).
- Assouline et al. [1998] S. Assouline, D. Tessier, and A. Bruand, A conceptual model of the soil water retention curve, Water Resources Research 34, 223 (1998).
- Shao et al. [2009] J. Shao, S. Havlin, and H. E. Stanley, Dynamic opinion model and invasion percolation, Physical review letters 103, 018701 (2009).
- Wilkinson and Willemsen [1983] D. Wilkinson and J. F. Willemsen, Invasion percolation: a new form of percolation theory, Journal of physics A: Mathematical and general 16, 3365 (1983).
- Kesten [1980] H. Kesten, The critical probability of bond percolation on the square lattice equals 1/2, Communications in Mathematical Physics 74, 41 (1980).
- Sykes and Essam [1963] M. Sykes and J. Essam, Some exact critical percolation probabilities for bond and site problems in two dimensions, Physical Review Letters 10, 3 (1963).
- Bijeljic et al. [2013] B. Bijeljic, A. Raeini, P. Mostaghimi, and M. J. Blunt, Predictions of non-fickian solute transport in different classes of porous media using direct simulation on pore-scale images, Physical Review E—Statistical, Nonlinear, and Soft Matter Physics 87, 013011 (2013).
- Beucher and Meyer [2018] S. Beucher and F. Meyer, The morphological approach to segmentation: the watershed transformation, in Mathematical morphology in image processing (CRC Press, 2018) pp. 433–481.
- Münch et al. [2006] B. Münch, P. Gasser, L. Holzer, and R. Flatt, Fib-nanotomography of particulate systems—part ii: Particle recognition and effect of boundary truncation, Journal of the American Ceramic Society 89, 2586 (2006).
- Rabbani et al. [2014] A. Rabbani, S. Jamshidi, and S. Salehi, An automated simple algorithm for realistic pore network extraction from micro-tomography images, Journal of Petroleum Science and Engineering 123, 164 (2014).
- Connington and Lee [2012] K. Connington and T. Lee, A review of spurious currents in the lattice boltzmann method for multiphase flows, Journal of mechanical science and technology 26, 3857 (2012).
- Olsson and Kreiss [2005] E. Olsson and G. Kreiss, A conservative level set method for two phase flow, Journal of computational physics 210, 225 (2005).
- Hilpert and Miller [2001] M. Hilpert and C. T. Miller, Pore-morphology-based simulation of drainage in totally wetting porous media, Advances in water resources 24, 243 (2001).
- Becker and Ziff [2009] A. M. Becker and R. M. Ziff, Percolation thresholds on two-dimensional voronoi networks and delaunay triangulations, Physical Review E—Statistical, Nonlinear, and Soft Matter Physics 80, 041101 (2009).
- Sampaio Filho et al. [2018] C. I. Sampaio Filho, J. S. Andrade Jr, H. J. Herrmann, and A. A. Moreira, Elastic backbone defines a new transition in the percolation model, Physical review letters 120, 175701 (2018).