The bolometric Bond albedo and energy balance of Uranus
Abstract
Using a newly developed ‘holistic’ atmospheric model of the aerosol structure in Uranus’s atmosphere, based upon observations made by HST/STIS, Gemini/NIFS and IRTF/SpeX from 2000 – 2009, we make a new estimate the bolometric Bond albedo of Uranus during this time of , with a phase integral of . Then, using a simple seasonal model, developed to be consistent with the disc-integrated blue and green magnitude data from the Lowell Observatory from 1950 – 2016, we model how Uranus’s reflectivity and heat budget vary during its orbit and determine new orbital-mean average value for the bolometric Bond albedo of and for the absorbed solar flux of W m-2. Assuming the outgoing thermal flux to be W m-2, as previously determined from Voyager 2 observations, we arrive at a new estimate of Uranus’s average heat flux budget of , finding considerable variation with time due to Uranus’s significant orbital eccentricity of 0.046. This leads the flux budget to vary from near perihelion, to 1.24 near aphelion. We conclude that although is considerably smaller than for the other giant planets, Uranus is not in thermal equilibrium with the Sun.
keywords:
planets and satellites: atmospheres – radiative transfer – scattering – techniques: photometric1 Introduction
All the solar system giant planets appear to emit more thermal radiation to space than they absorb from the Sun, indicating that they have substantial reservoirs of internal heat left over from formation. For planets in thermal equilibrium with the Sun the ratio of the total power thermally emitted to the total solar power absorbed, i.e., , would be equal to 1.0, but generally accepted estimates of this ratio for the giant planets, based on observations made by the NASA Voyager missions, are Jupiter: (Hanel et al., 1981), Saturn: (Hanel et al., 1983), Uranus: (Pearl et al., 1990), and Neptune: (Pearl & Conrath, 1991), although the values for Jupiter and Saturn have recently been updated from Cassini observations to (Li et al., 2018) and (Wang et al., 2024), respectively. The flux ratio seems to be particularly low for Uranus and is consistent with Uranus being in thermal equilibrium with the Sun, which would make it a very notable outlier from the rest of the giant planets.
The low level of the ratio for Uranus, combined with its very high obliquity (i.e., inclination of its spin axis relative to its orbital plane) of led Stevenson (1986) to suggest that towards the end of its initial formation Uranus suffered an oblique impact with a large planetesimal (of approximately 2 Earth masses) that tipped Uranus’s spin axis over on its side, heated just the outer shell of the planet, which has since cooled, and threw off of a disc of material, which has since coalesced to form a regular, compact satellite system. Stevenson (1986) argued that Neptune, in contrast, may have suffered a more head-on collision that created high internal temperatures and did not throw off a disc of material, which could explain Neptune’s high observed ratio and absence of a compact satellite system. This hypothesis has been returned to a number of times since, most recently by Reinhardt et al. (2020), who performed Smoothed Particle Hydrodynamics (SPH) simulations that support this scenario. Alternatively, it has been proposed that compositional gradients deep in Uranus’s atmosphere may give rise to a deep thermal boundary layer, inhibiting convection and trapping heat (Nettelmann et al., 2016; Vazan & Helled, 2020; Scheibe et al., 2021), thus reducing . Another possibility is that since existing observations of Uranus cover only a fraction of a Uranian year, they may have been made during a quiescent meteorological period when heat release was low. In Saturn’s atmosphere, for example, increased storm activity was found to affect the planet’s heat budget by modifying both the amount of regional emitted heat and absorbed solar energy (Li & Ingersoll, 2015). Increased storm activity at Uranus could result in changes in heat release by varying the atmosphere’s reflectivity and therefore the amount of absorbed sunlight (e.g., Fletcher et al., 2020), and also the degree of vertical heat transport via cumulus convection driven by the condensation of species such as CH4, H2O, NH4SH, NH3, and/or H2S (Sromovsky & Fry, 2005; Hueso et al., 2020). Finally, there remains the possibility that the Voyager measurement of Uranus’s outgoing thermal flux may be underestimated due to calibration uncertainties (e.g., Li et al., 2018). However, all these conclusions and interpretations are contingent upon the accuracy of the estimates, and it can be seen that for Uranus this ratio is only currently constrained to lie in rather a broad range from 0.98 to 1.14.
In this paper we use the ‘holistic’ aerosol model of Uranus and Neptune, developed by Irwin et al. (2022) and based upon observations made by HST111HST - Hubble Space Telescope/STIS, Gemini/NIFS and IRTF222IRTF - NASA Infrared Telescope Facility/SpeX from 2000 – 2009 to improve upon the estimate for Uranus. We first determine the bolometric Bond albedo and flux ratio of Uranus in the early 2000s and then use a simple seasonal model, developed by Irwin et al. (2024) and consistent with the disc-integrated blue and green magnitude data from the Lowell Observatory (Lockwood, 2019), to model how Uranus’s reflectivity and heat budget vary during Uranus’s year.
| Reference | year | |||||
|---|---|---|---|---|---|---|
| Lockwood et al. (1983)(from Younkin, 1970) | 1962 | |||||
| Lockwood et al. (1983) | 1981 | " | " | |||
| Neff et al. (1985) | 1981 | |||||
| Pollack et al. (1986) | 1982 – 1985 | |||||
| Pollack et al. (1986) | orbital mean | " | " | |||
| Pearl et al. (1990) | 1986 | |||||
| Pearl et al. (1990) | orbital mean | " | " | |||
| This investigation | 2000 – 2009 | |||||
| This investigation | orbital mean | " | " |
2 Measurements of the Bond Albedo and power balance of Uranus
At a particular wavelength the geometric albedo of a planet is defined as the power of the reflected sunlight at a phase angle of compared with that from a flat, perfectly reflecting Lambertian surface of the same cross-sectional area. The Bond albedo , however, is the total fraction of sunlight incident on the planet that is reflected away in all directions and is related to the geometric albedo by the relation
| (1) |
where is the phase integral, defined as the integral of the flux scattered from the planet into phase angle :
| (2) |
If we integrate the incident and reflected powers over all wavelengths, then we arrive at ‘integrated’ or ‘bolometric’ values of these parameters, which we denote as: , , and .
The Bond albedo and radiative heat balance of Uranus has been addressed by a number of studies. Lockwood et al. (1983) analysed high resolution spectrophotometry observations of Uranus made in 1981 at the Lowell Observatory and found , , and . It was also found that the albedo had risen significantly since previous observations made between 1961 and 1963 (Younkin, 1970), for which the following values were computed: , and . Using the estimated absorbed solar power per unit area over the whole planet in 1981 was estimated to be 0.563 – 0.643 W m-2, while assuming the effective black body temperature of Uranus in the infrared to be K (Courtin et al., 1979), the outgoing flux was estimated to be 0.500 – 0.711 W m-2. Hence, Lockwood et al. (1983) estimated the internal heat flux to be W m-2. From these results (summarised in Table LABEL:tab:albedos), we here derive an estimate (adding errors in quadrature) of . For the 1961 - 1963 data, we estimate from these data that
Neff et al. (1985) analysed high resolution spectrophotometry observations of Titan, Uranus and Neptune made in around 1981 by the International Ultraviolet Explorer (Caldwell et al., 1981), Macdonald Observatory (Neff et al., 1984) and IRTF, and estimated , , and . The absorbed solar flux was estimated to be the same as that emitted from a black body of temperature K. Assuming the effective black body temperature of Uranus in the infrared to be K (Hildebrand et al., 1985), the internal luminosity of Uranus was estimated to be W. From these results we estimate the internal heat flux (using their assumed Uranus radius of 25,250 km) to be W m-2, and from this we here derive an estimate (adding errors in quadrature) of (Table LABEL:tab:albedos).
Pollack et al. (1986) constructed an atmospheric aerosol model that was consistent with phase angle observations (0 – ) from ground-based observatories (Neff et al., 1984) and Voyager-1/ISS observations made between 1982 and 1985. From this model, Pollack et al. (1986) calculated that in 1981, , , and . Since Lockwood et al. (1983) noted a 14% increase in Uranus’s albedo from 1961–1963 to 1981, Pollack et al. (1986) assumed that the orbitally-averaged values of their albedos should be reduced by 7% to , and . The orbitally-averaged absorbed solar flux was estimated to be the same as the flux emitted from a black body of temperature K. Assuming the effective black body temperature of Uranus in the infrared to be K (Orton, 1985), Pollack et al. (1986) concluded that the internal heat flux was W m-2. From these results, we here derive an estimate of (Table LABEL:tab:albedos). We have here also scaled this value (using the Bond albedo estimates) to an equivalent flux ratio in 1982 – 1985 of .
Pearl et al. (1990) used Voyager/IRIS-radiometer observations of Uranus made during the Voyager 2 flyby of Uranus in January 1986 to estimate Uranus’s Bond albedo. Measurements of the reflectivity of Uranus, integrated over the IRIS radiometer, were made at several phase angles and are shown in Fig. 1 and compared with the Voyager-1/ISS phase angle observations used by Pollack et al. (1986), and more recently extended by Wenkert et al. (2023). The IRIS radiometer is sensitive from 0.3 – 1.9 m and the IRIS radiometer sensitivity function is compared with the Voyager/ISS filter functions and a reference Uranus spectrum in Fig. 2. Pearl et al. (1990) assumed that the IRIS-radiometer-averaged reflectivities were equivalent with the bolometric values and thus reported , , and . These observations were made in 1986 near Uranus’s solstice, when Uranus is at its brightest. Pearl et al. (1990) noted that their albedoes were thus likely to be greater than the average value and so revised their Bond albedo figure down by 7% (from Lockwood et al., 1983) to arrive at an estimate of the orbital mean Bond albedo of . By analyzing the IRIS infrared spectrometer data (covering 11 to 55 m) and extending to longer wavelengths with modelling, Pearl et al. (1990) then estimated that the overall infrared flux emitted into all directions to be W m-2, equivalent to a black body of temperature of K, which is larger than all the other equivalent black body temperatures assumed in the previous studies discussed here. Using these numbers Pearl et al. (1990) concluded that . We have here also scaled this (from the Bond albedoes) to an equivalent flux ratio in 1986 of .
The comparison of these estimates for Uranus’s albedo and radiative heat balance from these studies is summarised in Table LABEL:tab:albedos.
3 Simulating the Bond Albedo of Uranus
Recently, Irwin et al. (2022) developed an ‘holistic’ aerosol model for Uranus and Neptune, which was simultaneously consistent with HST/STIS spectral imaging observations from 0.30 – 1.02 m, Gemini/NIFS spectral imaging observations from 1.4 – 1.8 m, and a central meridian line-averaged IRTF/SpeX observation from 0.8 – 1.9 m. For Uranus, the HST/STIS observations were made in 2002 (Karkoschka & Tomasko, 2009), the Gemini/NIFS observations made in 2009 (Irwin et al., 2011), and the IRTF/SpeX observation made in 2000 (Rayner et al., 2009). This model consisted of a vertically-extended semi-infinite deep cloud deck ‘Aerosol-1’, a vertically-thin middle ‘Aerosol-2’ layer, centred at 1–2 bar, coincident with the methane condensation level, and a vertically-extended upper-tropospheric ‘Aerosol-3’ haze at pressures less than 1.5 bar. By adjusting the cloud opacities, particle sizes, complex refractive index spectra of these three layers and also varying the pressure of the Aerosol-2 layer, the model was able to reproduce the observed reflectivity and limb-darkening curves of both Uranus and Neptune, where the limb-darkening was found to be consistent with the model of Minnaert (1941):
| (3) |
Here, is the cosine of the viewing zenith angle, is the cosine of the solar zenith angle and the fitted parameters are the nadir reflectances and the limb-darkening coefficients .
This holistic model has since been slightly revised by James et al. (2023) and Irwin et al. (2024), with the semi-infinite Aerosol-1 component replaced by a vertically-thin cloud deck centred at 5 bar. This revised model was found to fit the observations just as well, but made it easier to disentangle the spectral effects of the Aerosol-1 and Aerosol-2 layers, leading to more reliable and robust retrievals.
The disc-integrated magnitude of Uranus at Strömgren- and - wavelengths was measured nearly annually from 1950 to 2016 by observers at the Lowell Observatory (Lockwood, 2019), who compiled a unique record of the seasonal variation of Uranus’s brightness and colour. Irwin et al. (2024) converted these magnitude data to disc-averaged reflectivities and compared these with HST/WFC3 observations from 2014 – 2022, and HST/STIS observations made in 2002, 2012 and 2015 (Karkoschka & Tomasko, 2009; Sromovsky et al., 2014, 2019), finding very good photometric agreement between all three datasets. Irwin et al. (2024) then used the revised holistic model to simulate the seasonal variation in Uranus’s albedo at Strömgren- and - wavelengths.
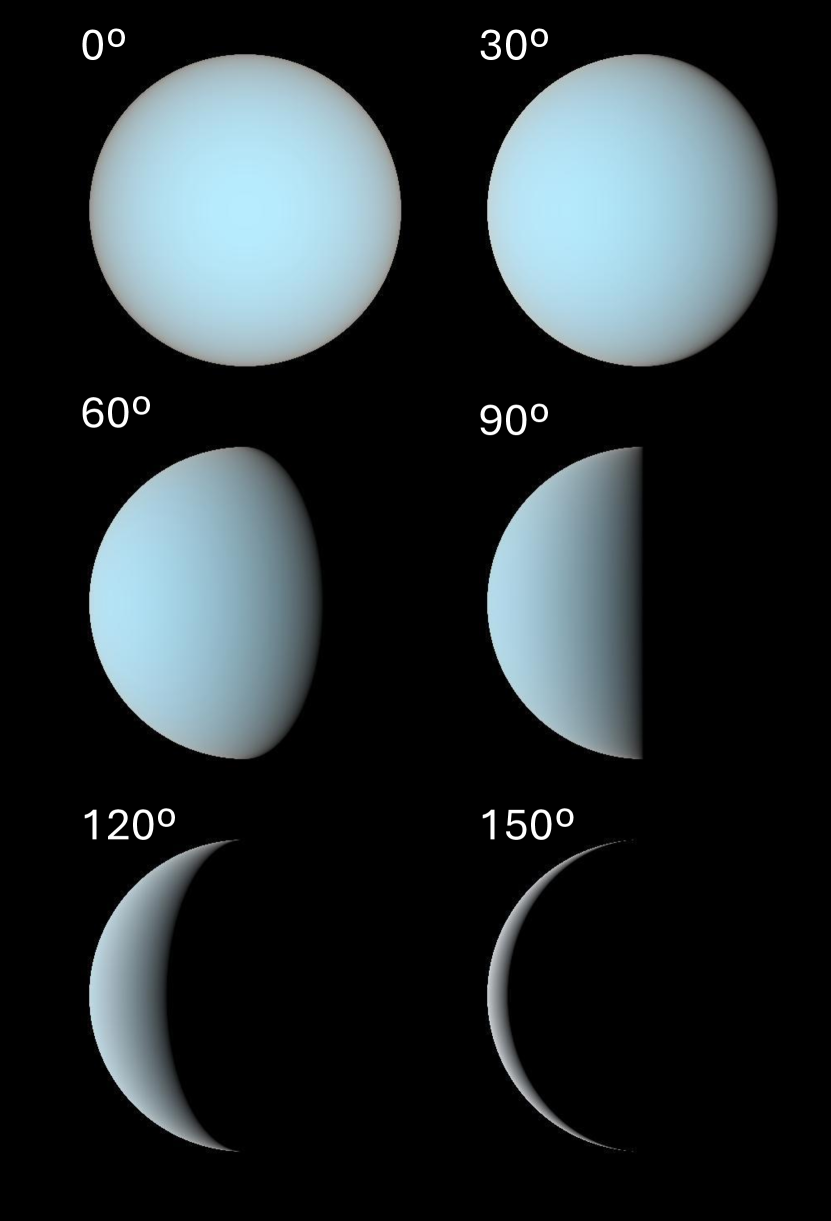
Taking our best modified holistic model fit to the Uranus data of Irwin et al. (2022) we computed the mean reflectivity spectrum of Uranus’s atmosphere from 0.2 - 1.9 m at all possible solar and viewing angles using our NEMESIS (Irwin et al., 2008) radiative transfer and retrieval model. NEMESIS uses the plane-parallel multiple scattering scheme of Plass et al. (1973), and for these simulations we used 21 angles in our zenith angle quadrature and 38 Fourier components in the azimuth decomposition. The computed spectra were then used to simulate the overall reflectivity spectrum of Uranus for different phase angles by interpolating the spectra to the local viewing zenith angle, solar zenith angle and azimuth angle at each location on the planet and integrating over the disc. The reflectance spectra were converted to disc-integrated spectral irradiance (W m-2 m-1) by multiplying by our standard reference solar spectrum, which was taken to be that of Chance & Kurucz (2010), extrapolated to longer/shorter wavelengths with the solar spectrum of Kurucz (1993). To simulate the visible appearance of Uranus at different phase angles, the interpolated spectra at each location on the planet were convolved with standard XYZ color-matching functions and then converted to the sRGB colour space as described by Stockman & Sharpe (2000), Stockman (2019) and Irwin et al. (2024). In Fig. 3 we show the simulated ‘true-colour’ appearance of Uranus at phase angles 0∘, 30∘, 60∘, 90∘, 120∘ and 150∘, where the images have been Gamma-corrected to give the appearance of Uranus as would be seen by an average human observer (see Irwin et al., 2024). As can be seen the apparent colour of Uranus becomes less blue as we go to higher phase angles and the integrated reflectivity drops333This best-fit model was also used to generate a revised simulated video of a future possible spacecraft’s approach to Uranus and the descent of an entry probe (https://www.youtube.com/watch?v=NPZeBLCjI-0), where this colour variation with phase angle can also be seen..
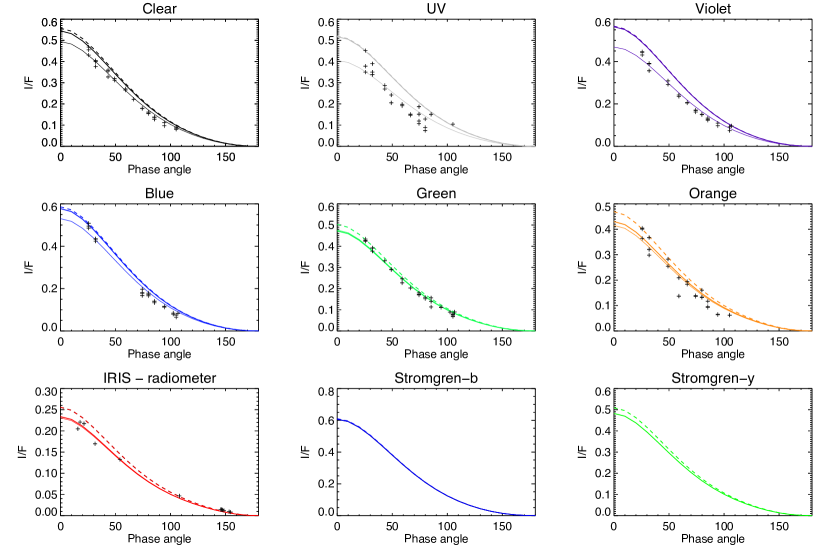
The computed disc-integrated spectra at each phase angle were then convolved with the Voyager/ISS filter functions and also the Voyager/IRIS radiometer responsivity function to calculate filter-averaged reflectivities of Uranus as a function of phase angle. These phase angle calculations are compared in Fig. 1 with the Voyager/ISS observations of Wenkert (2023) (from which phase curves have been extracted (Wenkert et al., 2023)) and the Voyager/IRIS observations of Pearl et al. (1990). In addition, simulated phase curves at Strömgren- and - wavelengths are also shown. It should be noted that Voyager observed increasingly equatorial regions of Uranus as it headed to higher phase angles due to the large inclination of Uranus’s axis and the fact that these observations were made near solstice. Since Uranus is known to form a ‘hood’ of increased haze opacity at polar latitudes near solstice, this means that the reflectivities observed by Voyager at different phase angles are weighted to regions of very different aerosol structure, which adds to the complexity of interpreting these phase curves.
It can be seen that the observed variation of reflectivity with phase angle is reasonably well defined in the Clear, Violet, Blue, and Green channels, where the signal-to-noise ratio of the Voyager/ISS observations are good, but is less clear in the UV and Orange channels. The UV and Orange reflectivities are known to be the least reliable observations in this dataset, due to increased noise caused by the lower radiances seen in these channels (Fig. 2) and insufficient exposure times. However, it can be seen that the simulated phase curves are in reasonably good agreement with observations, which adds confidence that NEMESIS models the reflectivity of Uranus at different phase angles reliably. Indeed, if we scale our simulations by single factor for each filter (for example for the Clear filter a factor of 0.908 has been applied), it can be seen that the simulations are in good agreement with the shape of the measured phase curves, which suggests that the differences could just be caused by photometric inconsistencies; such channel-to-channel variation was also seen when we analysed Voyager-2 ISS observations of Uranus (Irwin et al., 2024). We thus used our NEMESIS simulations to compute the phase integral (Eq. 2) numerically, validating these calculations against a model planet with a uniform perfectly scattering Lambertian surface, for which we computed the expected values of and , leading to .
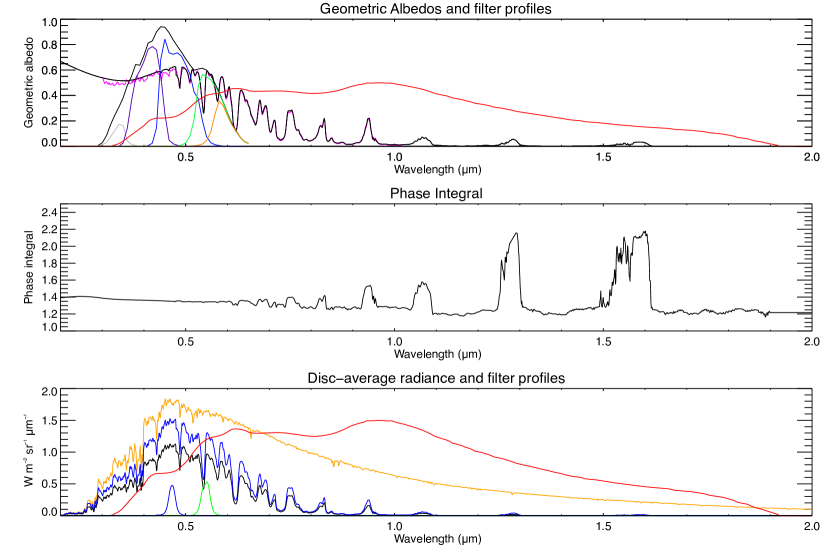
The calculated geometric albedo spectrum from our model is shown in Fig. 2 and can be seen to be in good agreement with the measured disc-averaged HST/STIS albedo spectrum of Karkoschka & Tomasko (2009), from which this model was derived. Figure 2 also shows the Voyager/ISS channel filter profiles (Danielson et al., 1981), the Voyager/IRIS-radiometer spectral response functions (Hanel et al., 1981), and the Strömgren- and Strömgren- filter functions (Crawford & Barnes, 1970). As can be seen, the observed and modelled geometric albedo spectrum of Uranus varies greatly with wavelength, with high albedos seen at visible and UV wavelengths, but decreasing rapidly at longer wavelengths due to the increasing absorption of gaseous methane. Hence, the mean albedo of a filter passband depends strongly on these responsivity curves.
From the computed irradiance spectra (W m-2 m-1) at wavelength and phase angle we calculated the phase integral spectrum , which is also shown in Fig. 2. It can be seen that our computed phase integrals lie in the range 1.3 to 1.4 at visible wavelengths, reducing to 1.2 to 1.3 at longer methane-absorbing wavelengths, but increasing in the methane windows. This is expected as the main reflection is from the Aerosol-‘2’ layer at 1.5 bar, which is modelled as being composed of micron-sized particles that are rather forward scattering at these wavelengths, thus increasing . We calculated filter-averaged geometric and Bond albedoes using the following equations:
| (4) |
Here, is the solar irradiance spectrum for a perfectly reflecting Lambertian disc of Uranus’s size and distance from the Sun, and is the filter sensitivity profile. It is important to stress that we computed these filter-averaged albedos by taking ratios of the filter-averaged irradiances, rather than filter-averaging the albedo spectra and using:
| (5) |
The spectra of both Uranus and the Sun can be seen to vary greatly with wavelength in Fig. 2. Hence, while and for narrow filters, it is not a good approximation for the wide filter passbands we consider here.
Our computed averaged albedos for a range of filters and wavelength ranges are listed in Table LABEL:tab:calculations. In this table, the quoted effective phase integrals are computed as . Since the reflectivity of Uranus decreases greatly with wavelength, the filter-averaged albedoes for the Voyager/IRIS-radiometer filter are significantly lower than those of shorter-wavelength filters. It can also be seen in Fig. 2 that the IRIS radiometer filter biases against the reflectivity at very short wavelengths. If instead we calculate the albedoes using a filter that is uniformly transmitting from 0.2 to 1.9 m, we find significantly higher albedoes. However, even this calculation ignores some reflected radiance, as the solar spectrum is non-negligible at longer wavelengths and Uranus still has some reflectivity. To address this, we first matched a combined reference IRTF/SpeX and JWST/NIRSpec spectrum to the computed radiance spectra from 1.5 to 1.6 m and used these scaled spectra to extend the calculation from 1.9 m to 2.5 m. Secondly, since 3.7% of the Sun’s irradiance is at wavelengths longer then 2.5 m, we extended the computed spectra further to 100 m, assuming that Uranus has insignificant reflectivity at wavelengths longer than 2.5 m. As can be seen, these extensions have the effect of slightly decreasing the computed albedos, but they are still 6% greater than the Voyager/IRIS estimate. Averaging our simulated spectra over the Voyager/IRIS-radiometer responsivity function, we calculate values of , and . With regard to possible errors, the 2000 – 2009 observations that our model is derived from are believed to be accurate to 1 to 2%, and we are able to fit to these data to within this precision. The error on the calculation of the phase integral is harder to check, but the shape of our phase curves looks consistent to first order with the Voyager phase curves shown in Fig. 1. Assuming 2% for the observation and fitting errors and adding these in quadrature, this amounts to 2.8% for , giving . Assuming 2% uncertainty for gives and combining these errors in quadrature gives . Our estimates for these IRIS albedoes from 2000 – 2009 are thus consistent with the values determined by Pearl et al. (1990) in 1986 of and . However, we will see in the next section that the albedo of Uranus is known to have decreased significantly from 1986 to the early 2000s, which leads us to suspect that the albedoes of Pearl et al. (1990) may be underestimated. This conclusion is also consistent with Table LABEL:tab:albedos, where it can be seen that values of Pearl et al. (1990) are lower than the previous three studies considered.
Integrating over all wavelengths (0.2 – 100 m) we conclude that in the period 2000 – 2009: , , and . Our estimate for is well within the range of previous estimates (Table LABEL:tab:albedos), but as we will see in the next section and vary significantly with time, and this variation must be accurately accounted for in order to arrive at robust estimates of the orbital-mean Bond albedo and radiative balance.
| Instrument or range | Geometric albedo | Bond albedo | Phase integral |
|---|---|---|---|
| Strömgren- (467 nm) | 0.606742 | 0.819338 | 1.35039 |
| Strömgren- (551 nm) | 0.482306 | 0.647710 | 1.34295 |
| Voyage/ISS – Clear | 0.545037 | 0.737174 | 1.35252 |
| Voyager/ISS – UV | 0.517394 | 0.709903 | 1.37207 |
| Voyager/ISS – Violet | 0.564171 | 0.767374 | 1.36018 |
| Voyager/ISS – Blue | 0.577464 | 0.779424 | 1.34974 |
| Voyager/ISS – Green 1 | 0.474723 | 0.637848 | 1.34362 |
| Voyager/ISS – Green 2 | 0.471953 | 0.634109 | 1.34359 |
| Voyager/ISS – Orange | 0.430355 | 0.578334 | 1.34385 |
| HST/STIS (0.3 – 1.02 m) | 0.344325 | 0.465665 | 1.35240 |
| Voyager/IRIS Radiometer | 0.233810 | 0.316006 | 1.35155 |
| 0.2 – 1.9 m | 0.268850 | 0.364617 | 1.35621 |
| 0.2 – 2.5 m | 0.258426 | 0.350479 | 1.35620 |
| 0.2 – 100 m | 0.248886 | 0.337540 | 1.35620 |
4 Seasonal Cycle Modelling
Our Bond albedo estimate comes from our modified holistic model fit to HST/STIS, IRTF/SpeX and Gemini/NIFS observations made from 2000 – 2009 and near equinox when the albedo of Uranus is known to be significantly lower than it is near solstice (Lockwood, 2019). To compare more directly with Voyager-2 observations we need to correct for this albedo change. Furthermore, in order to best estimate the orbital-mean Bond albedo, we need to accurately model the average absorbed solar energy during Uranus’s orbit about the Sun.
Irwin et al. (2024) found that the seasonal variations in reflectivity determined from the Lowell Observatory observations of Lockwood (2019) could be moderately well approximated by a model where polewards of 40∘S and 40∘N an additional opacity ( at 800 nm) of conservatively-scattering micron-sized particles were added to the Aerosol-2 layer at 1.5 bar to simulate the effects of Uranus’s polar ‘hood’. Although this was used by Irwin et al. (2024) to model just Strömgren- and Strömgren- reflectivity variations, we assumed the same model could be used here to simulate the variations in reflectivity at all other wavelengths.
To make the new simulation, we took our reference modified holistic model and computed the Minnaert nadir and limb-darkening spectra and . Then, adding an additional opacity ( at 800 nm) of conservatively scattering particles to the Aerosol-2 layer at 1.4 bar with the same mean radius of 0.8 m we computed new Minnaert spectra and , more appropriate for polar regions. Then, for one orbit about the Sun, and using geometry ephemeris data from JPL Horizons444https://ssd.jpl.nasa.gov/horizons/, following the procedure of Irwin et al. (2024), we computed the radiance at each point on Uranus’s disc as seen from Earth using the Minnaert model for both cases, combining them depending on latitude as:
| (6) |
where the weighting factor was assumed to vary with latitude (in degrees) as:
| (7) |
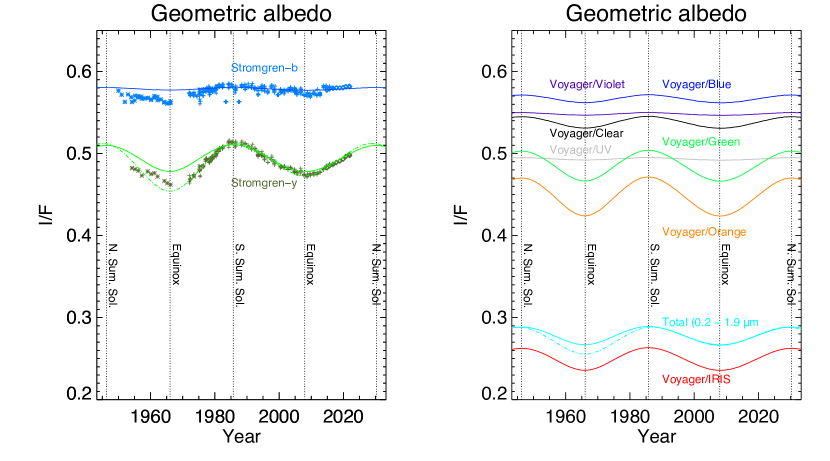
This distribution gives at the equator and at the poles, with a cross-over latitude of 40∘. We then integrated the computed spectra over the disc to determine the disc-averaged geometric reflectivity in the various filters. Finally, to account for the fact that our reference reflectivity spectrum was calculated from disc-averaged data, rather than equatorial data as assumed by Irwin et al. (2024), the final reflectivities were multiplied by a factor of 0.99 to ensure a good match to the observed Strömgren- and Strömgren- Lowell Observatory reflectivities of Lockwood (2019). Our simulated Strömgren reflectivity curves are compared with the observed Lowell reflectivities in Fig. 4 and also to HST/WFC3 observations from 2014 to 2022 (Irwin et al., 2024). This figure is very similar to Fig. 13 of Irwin et al. (2024) and shows moderately good agreement between the observed and simulated curves between 1985 and 2022. However, the observed reflectivities are lower than those simulated from 1950 to 1985 (especially at green wavelengths) for reasons that are currently unclear. Irwin et al. (2024) suggest that the reflectivity may be dependent on Uranus’s mean distance from the Sun. Uranus was closest to the Sun in 1965 and furthest in 2009 and Irwin et al. (2024) suggest that increased solar flux may lead to a higher concentration of dark chromophore particles near perihelion, causing asymmetry in the reflectivity cycles.
The apparent correlation between giant planet atmospheric colouring agents, atmospheric dynamics and solar irradiation is under active investigation. Pérez-Hoyos et al. (2009) purported that colour changes over Oval BA, one of Jupiter’s largest storms, might have been caused by increased insolation after the material was lofted to a higher altitude, in turn increasing the rate of photochemical reactions affecting the color change. A correlation between chromophore darkness and UV fluence was also noted by Carlson et al. (2016), who performed laboratory experiments to find a candidate for Jupiter’s red chromophore (Carlson et al., 2016) and may indicate that the deeper redness of Jupiter’s Great Red Spot is caused by the haze particles being trapped in a vortex and exposed to sunlight for extended periods. This correlation between UV irradiation and chromophore colour is currently under further investigation (Carlson et al., 2023).
To see if the observed assymetry in the observed seasonal curves might affect our orbitally-averaged heat balance calculations, we also generated an empirical fit to the Strömgren- curve using:
| (8) |
where is our simulated Strömgren- seasonal curve (shown as solid green in Fig. 4) and , where is the solar insolation curve, shown later in Fig. 5, and is the insolation when Uranus is at a distance of 19.2 AU from the Sun.
Figure 4 also shows reflectivity curves calculated when averaged over the Voyager/ISS filters, the Voyager/IRIS radiometer response function, and finally when averaged over all calculation wavelengths (0.2 – 1.9 m). It can be seen that the amplitude of the reflectivity variations increases as we go to longer wavelengths and can be seen to vary from roughly 0.27 to 0.29. We used these curves to estimate how much more reflective Uranus was in 1986 (during the Voyager-2 encounter) compared with the year of our HST/STIS observations in 2002, and phase integral curves including these factors are also shown in Fig. 1 as dashed lines. In particular, averaging over the Voyager/IRIS radiometer response function we estimate that Uranus should have been more reflective by 9.5% in 1986. Hence, with this additional correction we estimate the likely geometric and Bond albedos in 1986, averaged over the IRIS response function to have been and , which are considerably larger than the estimates of Pearl et al. (1990), but still within the estimated error of their values. Finally, Fig. 4 also shows an additional 0.2 – 1.9 m curve derived by scaling the empirical Strömgren- seasonal curve by the mean ratio between the computed curves integreted over the Strömgren- filter and over the range 0.2 to 1.9 m. This is used later to investigate how much the asymmetry in the observed Strömgren- seasonal curve might affect the orbitally-averaged heat balance.
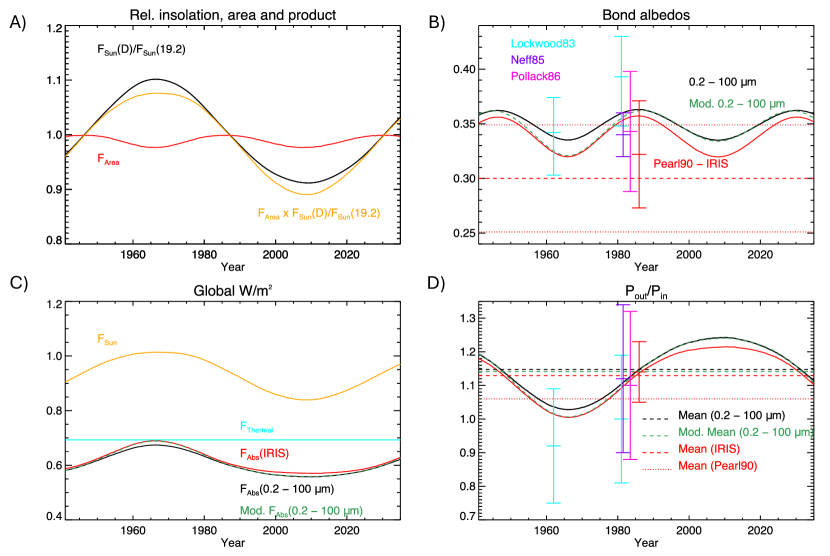
Using the calculated seasonal curve for we computed the seasonal cycle of the Bond albedo using , taking from Table LABEL:tab:calculations to be 1.36. In the previous section we saw that the Bond albedo estimated from averaging from 0.2 – 1.9 m is likely lower than the total bolometric Bond albedo by a factor of 1.08 and hence our final bolometric albedo is corrected by this factor, assuming it does not change with season. However, to compute the total power absorbed by Uranus, we need to consider not only how the Bond albedo varies with season, but also that the incident solar flux varies during Uranus’s eccentric orbit by approximately %, as can be seen in Fig. 5A. In addition, the area of Uranus presented to the Sun varies since Uranus is significantly oblate and has a high axial inclination. Hence, the presented area is maximum at the solstices and minimum at the equinoxes, varying by approximately 1%. Combining these effects we can compute the total solar power intercepted by Uranus and divide this by the planet’s total surface area to determine the average incident solar flux per unit area of the atmosphere, . We find that this varies from 0.84 to 1.01 W/m2 during Uranus’s orbit (Fig. 5C). Fig. 5B shows how the Bond albedo varies with time, either averaging over all wavelengths (0.2 - 100 m), or averaging over the Voyager/IRIS radiometer filter. Combining these effects, we can compute the bolometric value of the absorbed flux per unit area , which we show in Fig. 5C. The bolometric value of this can be seen to vary from 0.558 to 0.674 W/m2, with a mean value of 0.604 W/m2. The confidence of this value depends on several factors:
-
1.
The accuracy of the HST/STIS, Gemini/NIFS and IRTF/SpeX observations fitted to by Irwin et al. (2022), which we estimated previously to be 2.8%;
-
2.
The accuracy of our seasonal cycle model, which we show to be consistent with the Lowell observations of Lockwood (2019), but which we have extrapolated here to 1.9 m in our radiative transfer calculation. The accuracy of this extrapolation is more difficult to evaluate, but since the bulk of Uranus’s reflectivity comes from visible wavelengths, we believe that 2% is a conservative estimate of the likely error;
-
3.
The accuracy of using the same phase integral value of for all seasons and all wavelengths. We model the poles to be more reflective to match the seasonal cycles, but we have no way of assessing how much the phase integral varies with season. Again, to be conservative we assume here 2%.
-
4.
The accuracy of the factor of 1.08 we used to convert calculated from 0.2 – 1.9 m to all wavelengths (0.2 – 100 m). This was computed from our reference holistic model, which did not have a separate polar hood and hence may in reality vary with season. To account for this we again conservatively estimate this value to be accurate to 2%.
- 5.
All other elements in our calculation come from well-established solar spectra, or geometrical considerations, which we estimate to have errors insignificant with those listed above. Adding all these components in quadrature we arrive at a likely percentage error for and of 4.5%. Hence, including all factors we find orbital mean averages of and W/m2. To determine the flux ratio we assume to be W/m2, as determined by Pearl et al. (1990) from Voyager/IRIS spectrometer observations, and we conclude an orbital mean of of (i.e., 4.9%), varying during Uranus’s year from 1.03 to 1.24.
To see what effect the observed asymmetry of Uranus’s reflectivity curves (Lockwood, 2019) might have on these calculations, we repeated them using the empirically adjusted curve shown in Fig. 4 and find values of , W/m2, and , which are well within the error limits of our formal calculations and show that the observed asymmetry in the observed Strömgren- seasonal curve likely does not significantly affect Uranus’s heat balance.
Finally, if we instead average over the IRIS filter function we find orbital-mean values of , W/m2, and . These values are within error of those calculated by averaging from 0.2 – 100 m, showing that the assumption made by Pearl et al. (1990) that is reasonable when averaged over a whole Uranus year. The values are consistent with those of Pearl et al. (1990) of and , but are better constrained, taking a much fuller account of Uranus’s seasons and the variation of incident sunlight at Uranus as it orbits the Sun.
5 Discussion
We have concluded in this study that the bolometric (i.e., averaged over all wavelengths) value of for Uranus is significantly greater than 1.0 and thus that Uranus is not in thermal equilibrium with the Sun. Hence, Uranus appears to be much less of an outlier compared with the other planets than previously thought, although the Uranian value of is still significantly smaller than for the other three giant planets, for which values of are generally accepted.
The planet is furthest from equilibrium near the northern summer equinox period, a period which has just passed (equinox was in 2007), which may help to explain the increased storm cloud activity seen in Uranus’s atmosphere near this time. It may be that increased solar heating at other times helps to stabilise the atmosphere by heating the upper levels and suppressing convection from the interior. This may thus help explain why Uranus appeared to be so quiescent and dormant during the Voyager 2 flyby in 1986. If this interpretation is correct, then it is likely that the planet’s storm activity will now decrease as the incident solar flux increases and the upper levels of Uranus’s atmosphere become warmer. In addition, as Uranus now starts to move closer to the Sun and the insolation starts to increase again, the Lowell observatory data of Lockwood (2019) would suggest that Uranus should become slightly darker heading towards the next equinox in 2049 than it was in 2007. Continued observations are essential to confirm whether Uranus’s seasonal albedo cycle really is asymmetric.
In addition to the seasonal cycles considered here, there is also a small variation in Uranus’s albedo detected in the Lowell Observatory data of Lockwood (2019) on the timescale of the solar cycle (i.e. 11 years, Aplin & Harrison, 2017). There are two mechanisms suggested to account for this solar modulation: nucleation onto ions or electrons created by galactic cosmic rays (GCR), or UV-induced aerosol color changes. Given that a slower seasonal variation of albedo is seen in the Lowell Observatory data (Lockwood, 2019) that may be related to Uranus’s distance from the Sun, this suggests that the second explanation may be more likely. However, such solar-cycle variations are too rapid and too small to affect our orbital-mean estimates here.
Finally, our estimate for is critically dependent on the assumed value of the outgoing thermal flux, which we have assumed to be W m-2 (Pearl et al., 1990) and to not vary with season. If, however, there has been a mis-calibration of this value, or if, in fact, the outgoing thermally emitted flux varies during the Uranian year, then this will affect the flux ratio.
6 Conclusions
In this study we used the modified ‘holistic’ aerosol model of Irwin et al. (2022), James et al. (2023), and Irwin et al. (2024) to compute a new estimate of the bolometric Bond albedo of Uranus in the early 2000s. Then, using a seasonal model of Uranus based on Irwin et al. (2024), we have calculated how this albedo varies with season and make a new estimate of the orbitally-averaged mean solar flux absorbed by Uranus, comparing this with the assumed outgoing thermal flux of W/m2, determined from Voyager-2/IRIS observations by Pearl et al. (1990). We arrive at the following conclusions.
-
1.
Averaging from 0.2 – 100 m we find an orbital-average bolometric Bond albedo of , noting that this varies significantly during the year from 0.335 to 0.363.
-
2.
Combining these computed reflectivity curves with solar flux and projected area orbital variations, and averaging from 0.2 – 100 m we find the total solar power absorbed by Uranus to be W/m2, varying during the year from 0.558 to 0.674 W/m2.
-
3.
Assuming the orbital mean outgoing thermal flux of W/m2 from Voyager-2/IRIS (Pearl et al., 1990), we find, averaging from 0.2 – 100 m, that , varying during the year from 1.03 to 1.24.
-
4.
If we instead use the empirical geometric albedo curve derived from the observed asymmetric Strömgren- seasonal curve of Lockwood (2019) and extrapolate to 0.2 – 100 m we find values of , W/m2, and , which are well within the error limits of our formal calculation. Hence, we conclude that the observed asymmetry in the observed Strömgren- seasonal curve does not significantly affect Uranus’s heat balance.
-
5.
Finally, if we instead average over the Voyager/IRIS-radiometer responsivity function (Hanel et al., 1981), we find values of , W/m2, and . These are just within the error limits of our 0.2 – 100 m calculations and show that assuming , as was done by Pearl et al. (1990), is a reasonable approximation.
While we have used our simulations to greatly improve the estimated values of and for Uranus, our estimate of is critically dependent on the assumed value of the outgoing thermal flux W m-2 (Pearl et al., 1990). We have assumed this value to be correct and have also assumed that it does not vary with time. If, however, there has been a mis-calibration of this value, or if, in fact, the outgoing thermally emitted flux varies with season, then this will affect the flux ratio. We thus recommend that the value of the outgoing thermal flux from Uranus’s atmosphere be restudied, perhaps using more recent ground-based and JWST observations. In the meantime, assuming W m-2 we conclude that although Uranus is not in thermal equilibrium with the incident solar flux, is still significantly less than for the other three gas giants, for which values of are generally accepted. We also note that the high eccentricity of Uranus’s orbit leads to significant change in the incident solar flux, which if correlated with the production of dark photochemical haze products may help to explain the asymmetry in Uranus’s seasonal albedo cycle observed in Lowell Observatory observations (Lockwood, 2019). To explore this further, the next step in this project will be to analyze Hubble visible wavelength data from 1994 through 2025 to gain a clearer understanding of how Uranus’s reflectivity changes at other wavelengths while the planet moved from just before the northern spring equinox towards northern summer solstice.
Acknowledgements
We are grateful to the United Kingdom Science and Technology Facilities Council for funding the early stages of this research (Irwin: ST/S000461/1. This review includes observations made with the NASA/ESA Hubble Space Telescope obtained from the Space Telescope Science Institute, which is operated by the Association of Universities for Research in Astronomy, Inc. (AURA), under NASA contract NAS 5–26555. These observations are associated with STIS programme(s) GO9035, GO9330, GO12894, GO14113, and WFC3 programmes GO13937, GO14334, GO14756, GO15262, GO15502, GO15929, GO16266, GO16790, GO16995. AAS was supported by a grant associated with continuing program GO13937.
Data Availability
The data underlying this article will be shared on reasonable request to the corresponding author.
References
- Aplin & Harrison (2017) Aplin K. L., Harrison R. G., 2017, Geophys. Res. Lett., 44, 12,083
- Caldwell et al. (1981) Caldwell J., Owen T., Rivolo A. R., Moore V., Hunt G. E., Butterworth P. S., 1981, AJ, 86, 298
- Carlson et al. (2016) Carlson R. W., Baines K. H., Anderson M. S., Filacchione G., Simon A. A., 2016, Icarus, 274, 106
- Carlson et al. (2023) Carlson R., Dahl E., Baines K., Jovanovic L., Anderson M., 2023, in AAS/Division for Planetary Sciences Meeting Abstracts #55. p. 505.02
- Chance & Kurucz (2010) Chance K., Kurucz R. L., 2010, J. Quant. Spectrosc. Radiative Transfer, 111, 1289
- Courtin et al. (1979) Courtin R., Lena P., de Muizon M., Rouan D., Nicollier C., Wijnbergen J., 1979, Icarus, 38, 411
- Crawford & Barnes (1970) Crawford D. L., Barnes J. V., 1970, AJ, 75, 978
- Danielson et al. (1981) Danielson G. E., Kupferman P. N., Johnson T. V., Soderblom L. A., 1981, J. Geophys. Res., 86, 8683
- Fletcher et al. (2020) Fletcher L. N., de Pater I., Orton G. S., Hofstadter M. D., Irwin P. G. J., Roman M. T., Toledo D., 2020, Space Sci. Rev., 216, 21
- Hanel et al. (1981) Hanel R., Conrath B., Herath L., Kunde V., Pirraglia J., 1981, J. Geophys. Res., 86, 8705
- Hanel et al. (1983) Hanel R. A., Conrath B. J., Kunde V. G., Pearl J. C., Pirraglia J. A., 1983, Icarus, 53, 262
- Hildebrand et al. (1985) Hildebrand R. H., Loewenstein R. F., Harper D. A., Orton G. S., Keene J., Whitcomb S. E., 1985, Icarus, 64, 64
- Hueso et al. (2020) Hueso R., Guillot T., Sánchez-Lavega A., 2020, Philosophical Transactions of the Royal Society of London Series A, 378, 20190476
- Irwin et al. (2008) Irwin P. G. J., et al., 2008, J. Quant. Spectrosc. Radiative Transfer, 109, 1136
- Irwin et al. (2011) Irwin P. G. J., Teanby N. A., Davis G. R., Fletcher L. N., Orton G. S., Tice D., Kyffin A., 2011, Icarus, 212, 339
- Irwin et al. (2022) Irwin P. G. J., et al., 2022, J. Geophys. Res.:Planets, 127, e07189
- Irwin et al. (2024) Irwin P. G. J., et al., 2024, MNRAS, 527, 11521
- James et al. (2023) James A., et al., 2023, J. Geophys. Res.:Planets, 128, e07904
- Karkoschka & Tomasko (2009) Karkoschka E., Tomasko M., 2009, Icarus, 202, 287
- Kurucz (1993) Kurucz R., 1993, ATLAS9 Stellar Atmosphere Programs and 2 km/s grid. Kurucz CD-ROM No. 13. Cambridge, 13
- Li & Ingersoll (2015) Li C., Ingersoll A. P., 2015, Nature Geoscience, 8, 398
- Li et al. (2018) Li L., et al., 2018, Nature Communications, 9, 3709
- Lockwood (2019) Lockwood G. W., 2019, Icarus, 324, 77
- Lockwood et al. (1983) Lockwood G. W., Lutz B. L., Thompson D. T., Warnock A., 1983, ApJ, 266, 402
- Minnaert (1941) Minnaert M., 1941, ApJ, 93, 403
- Neff et al. (1984) Neff J. S., Humm D. C., Bergstralh J. T., Cochran A. L., Cochran W. D., Barker E. S., Tull R. G., 1984, Icarus, 60, 221
- Neff et al. (1985) Neff J. S., Ellis T. A., Apt J., Bergstralh J. T., 1985, Icarus, 62, 425
- Nettelmann et al. (2016) Nettelmann N., Wang K., Fortney J. J., Hamel S., Yellamilli S., Bethkenhagen M., Redmer R., 2016, Icarus, 275, 107
- Orton (1985) Orton G. S., 1985, in Bulletin of the American Astronomical Society. p. 745
- Pearl & Conrath (1991) Pearl J. C., Conrath B. J., 1991, J. Geophys. Res., 96, 18921
- Pearl et al. (1990) Pearl J. C., Conrath B. J., Hanel R. A., Pirraglia J. A., Coustenis A., 1990, Icarus, 84, 12
- Pérez-Hoyos et al. (2009) Pérez-Hoyos S., Sánchez-Lavega A., Hueso R., García-Melendo E., Legarreta J., 2009, Icarus, 203, 516
- Plass et al. (1973) Plass G. N., Kattawar G. W., Catchings F. E., 1973, Appl. Opt., 12, 314
- Pollack et al. (1986) Pollack J. B., Rages K., Baines K. H., Bergstralh J. T., Wenkert D., Danielson G. E., 1986, Icarus, 65, 442
- Rayner et al. (2009) Rayner J. T., Cushing M. C., Vacca W. D., 2009, ApJS, 185, 289
- Reinhardt et al. (2020) Reinhardt C., Chau A., Stadel J., Helled R., 2020, MNRAS, 492, 5336
- Scheibe et al. (2021) Scheibe L., Nettelmann N., Redmer R., 2021, Astronomy & Astrophysics, 650, A200
- Sromovsky & Fry (2005) Sromovsky L., Fry P., 2005, Icarus, 179, 459
- Sromovsky et al. (2014) Sromovsky L. A., Karkoschka E., Fry P. M., Hammel H. B., de Pater I., Rages K., 2014, Icarus, 238, 137
- Sromovsky et al. (2019) Sromovsky L. A., Karkoschka E., Fry P. M., de Pater I., Hammel H. B., 2019, Icarus, 317, 266
- Stevenson (1986) Stevenson D. J., 1986, in Lunar and Planetary Science Conference. pp 1011–1012
- Stockman (2019) Stockman A., 2019, Current Opinion in Behavioral Sciences, 30, 87
- Stockman & Sharpe (2000) Stockman A., Sharpe L. T., 2000, Vision Research, 40, 1711
- Vazan & Helled (2020) Vazan A., Helled R., 2020, Astronomy & Astrophysics, 633, A50
- Wang et al. (2024) Wang X., et al., 2024, Nature Communications, 15, 5045
- Wenkert (2023) Wenkert D., 2023, Restoring and Archiving Voyager 1 Cruise Images of Uranus and Neptune (RAV1CIUN) PDART Bundle, doi:10.17189/T2R8-RK88
- Wenkert et al. (2023) Wenkert D. D., Kenyon M. E., Kleinboehl A., Dahl E., Orton G. S., 2023, in Uranus Flagship: Investigations and Instruments for Cross-Discipline Science Workshop. p. 8048
- Younkin (1970) Younkin R. L., 1970, PhD thesis, University of California, Los Angeles