These authors contributed equally to this work.
These authors contributed equally to this work.
[1]\fnmLiansheng \surWang
[1]\orgdivDepartment of Computer Science at School of Informatics, \orgnameXiamen University, \orgaddress\cityXiamen, \postcode361001, \countryChina
[2]\orgdivNational Institute for Data Science in Health and Medicine, \orgnameXiamen University, \orgaddress\cityXiamen, \postcode361001, \countryChina
Unveiling Institution-Specific Bias in Pathology Foundation Models: Detriments, Causes, and Potential Solutions
Abstract
Pathology foundation models (PFMs) extract valuable discriminative features from images for downstream clinical tasks. PFMs have simplified the development of deep learning models, effectively leveraging prior knowledge to improve diagnostic accuracy in diverse scenarios. However, we find that PFMs sometimes struggle with certain challenges. Specifically, features extracted by PFMs are often contaminated by diagnosis-irrelevant information, i.e., institution-specific features associated with the images. This contamination can lead to spurious correlations, undermining the models’ generalization ability when applied in real-world clinical settings. In this work, we first reveal the issue of feature contamination in PFMs, demonstrate the presence of institution-specific features, thoroughly investigate its negative impacts, analyze the underlying causes, and provide insights into potential solutions. Specifically, we find that institution-specific information is embedded in pathological images and can be readily captured by current PFMs. Through extensive experiments, we demonstrate the detrimental impact of this irrelevant information, particularly in out-of-distribution (OOD) settings, where reliance on contaminated features leads to significant performance degradation. This indicates that the models are being misled by non-diagnostic information. We further delve into the reasons PFMs extract such institution-specific information and validate our findings. Finally, we propose a simple yet effective solution to mitigate the influence of irrelevant information. This study is not intended to criticize existing PFMs, as they have indeed greatly advanced the development of computational pathology. our aim is to inspire future research to focus on innovative training strategies, rather than relying exclusively on scaling laws, to realize more generalized PFMs.
keywords:
Feature Contamination, Pathology Foundation Models, Institution-Specific Information, Model Generalization1 Introduction
Pathological examination provides definitive insights into the nature and progression of diseases at the cellular and tissue levels. It serves as the gold standard for identifying malignancies, infections, and various other conditions, providing critical information that guides treatment decisions [1, 2]. Pathological slides are typically digitized into whole slide images (WSIs) with extremely high resolution, often exceeding 10 billion pixels at magnification [3, 4]. Few devices can process them directly, even when multiple instance learning models are employed. As a result, a pretrained pathological patch encoder is commonly used as a feature extractor. When this encoder generates features that perform well across a variety of downstream tasks, it is referred to as a pathology foundation model (PFM). In general, PFMs are pretrained on large-scale pathological image datasets, providing discriminative semantic features applicable to a wide range of diagnostic tasks [5]. The emergence of PFMs has simplified the development of deep learning models, effectively leveraging prior knowledge to improve diagnostic accuracy in diverse scenarios.
Recently, PFMs have seen significant advancements and can be categorized into three main groups. The first group consists of models pretrained on natural images, with the ImageNet-pretrained ResNet50 [6] and DenseNet[7] being representative examples. The second group comprises PFMs pretrained on pathological patches using self-supervised learning methods, including notable models like CTransPath [8], UNI [9], Prov-GigaPath [10], and Virchow [11]. The third group includes multi-modal PFMs, such as PLIP [12], CONCH [13], and PathChat [14], where the visual branch serves as a highly effective feature extractor. These PFMs are widely applied and have demonstrated excellent performance across various downstream tasks, such as disease diagnosis and patient survival prognosis prediction [15].
However, we found that PFMs struggle in some scenarios. The features extracted by some PFMs are at risk of contamination. In addition to diagnostic information (i.e., pathological patterns), they also capture non-diagnostic information related to irrelevant factors such as tissue processing workflows, staining intensity, scanning devices, image resolution, and storage protocols. This extraneous information is often referred to as institution-specific information, as it reflects characteristics of the institution providing the images [16]. Such diagnosis-independent information can introduce spurious correlations, undermining the generalization ability of models trained on these features.
In this work, we are the first to uncover the issue of feature contamination in PFMs, thoroughly investigating its negative impacts, underlying causes and insights into potential solutions. First, we demonstrate that the features extracted by existing PFMs indeed contain institution-specific information. Moreover, we show that it is relatively straightforward to pretrain an institution-specific feature extractor. In both cases, we task the model with using these extracted features for institution classification, i.e., predicting the institution to which an image belongs. The experimental results consistently exhibit strong performance in this task. Next, we explore the potential risks posed by this diagnosis-independent information in various out-of-distribution (OOD) settings. For almost all downstream tasks, performance experiences significant degradation, indicating that such contaminated features introduce spurious correlations and mislead the models. We then delve deeper into why PFMs capture institution-specific information and validate our findings through further analysis. Finally, we propose a simple yet effective solution to mitigate the influence of irrelevant information, improving the generalization capabilities in OOD tasks.
We pioneer the study of feature contamination in PFMs and conduct a comprehensive analysis. Our main contributions can be summarized as follows:
-
•
Uncovering Feature Contamination in PFMs: We are the first to identify and thoroughly investigate the presence of institution-specific information in features extracted by PFMs, and demonstrated that such information can be easily captured.
-
•
Examining the Negative Impact: We are the first to reveal that such irrelevant information hinders the generalization of models for downstream tasks, resulting in performance degradation in out-of-distribution (OOD) settings.
-
•
Exploring the Origin: We identify and validate the reasons why PFMs capture such irrelevant information. This insight paves the way for future research to focus on innovative training strategies and model architectures, rather than solely relying on scaling laws.
-
•
Mitigating the Detriment: We propose a simple yet effective solution to mitigate the negative impact of such institution-specific information, improving the generalization ability and fairness of models for downstream tasks in OOD settings.
2 Results
2.1 The Overview
In this work, we aim to investigate feature contamination in PFMs, revealing the existence of institution-specific information, the negative impact it brings, the reason why PFMs capture such information. Lastly, we propose a simple yet effective method to mitigate the negative impact of such irrelevant information. Specifically, we employ UNI, Prov-GigaPath and Virchow to conduct extensive experiments, as they are regarded as state-of-the-art PFMs. The experiments include institution classification, downstream diagnosis tasks, analysis of training strategies and the performance when utilizing the proposed solution. Downstream tasks include patch (ROI, regions of interest) classification, WSI classification and ROI retrieval. More experimental setup and results will be described in detail in the following sections.
2.2 Analysis of institution-specific information
2.2.1 Features from PFMs perform well in institution classification
Image features extracted by existing PFMs contain diagnosis-independent information, specifically institution-specific features, which stem from variations in tissue processing workflows, staining intensity, scanning devices, image resolution, and storage protocols. In this section, we conduct experiments to investigate the role of such extraneous information. Specifically, we task the model with utilizing these extracted features for institution classification, i.e., predicting the institution to which an image belongs.
Specifically, we used the TCGA-UT dataset [17], a large-scale collection of pathological patches derived from human cancer tissues. From this dataset, we selected patches related to the lung and kidney to construct two new datasets (LUNG-INS, RCC-INS) for evaluating institution classification performance. As shown in Table 1, all three types of features from PFMs effectively classify the institutions, demonstrating that PFMs successfully capture institution-specific information from the images.
UNI Prov-GigaPath Virchow Class No. ACC F1-score ACC F1-score ACC F1-score LUNG-INS 12 0.7169 0.4867 0.5911 0.3127 0.5202 0.2686 RCC-INS 8 0.7871 0.6204 0.7683 0.5601 0.7423 0.5130 BRCA-INS w/o norm 13 0.6750 0.5430 0.7370 0.6717 0.5628 0.4128 BRCA-INS w/ norm 13 0.4998 0.3575 0.5792 0.5026 0.4705 0.3568 COAD-INS w/o norm 9 0.6600 0.4954 0.6438 0.4811 0.5368 0.3415 COAD-INS w/ norm 9 0.5611 0.4085 0.5442 0.3867 0.5490 0.4001
2.2.2 Staining differences partly account for institution-specific information
It is well known that pathological images from different institutions or batches exhibit staining differences [18]. Therefore, in multi-center studies, we often perform stain normalization on images from different centers. To determine whether the institution-specific information is solely caused by staining differences, we perform institution classification as described in the previous section. The difference here is that we apply stain normalization [19] to all the images. The results show a decline in classification performance, but the accuracy remains relatively high, indicating that institution-specific information still exists. In summary, staining differences only partly account for institution-specific information.
2.2.3 Institution-specific information can be extracted and generalized
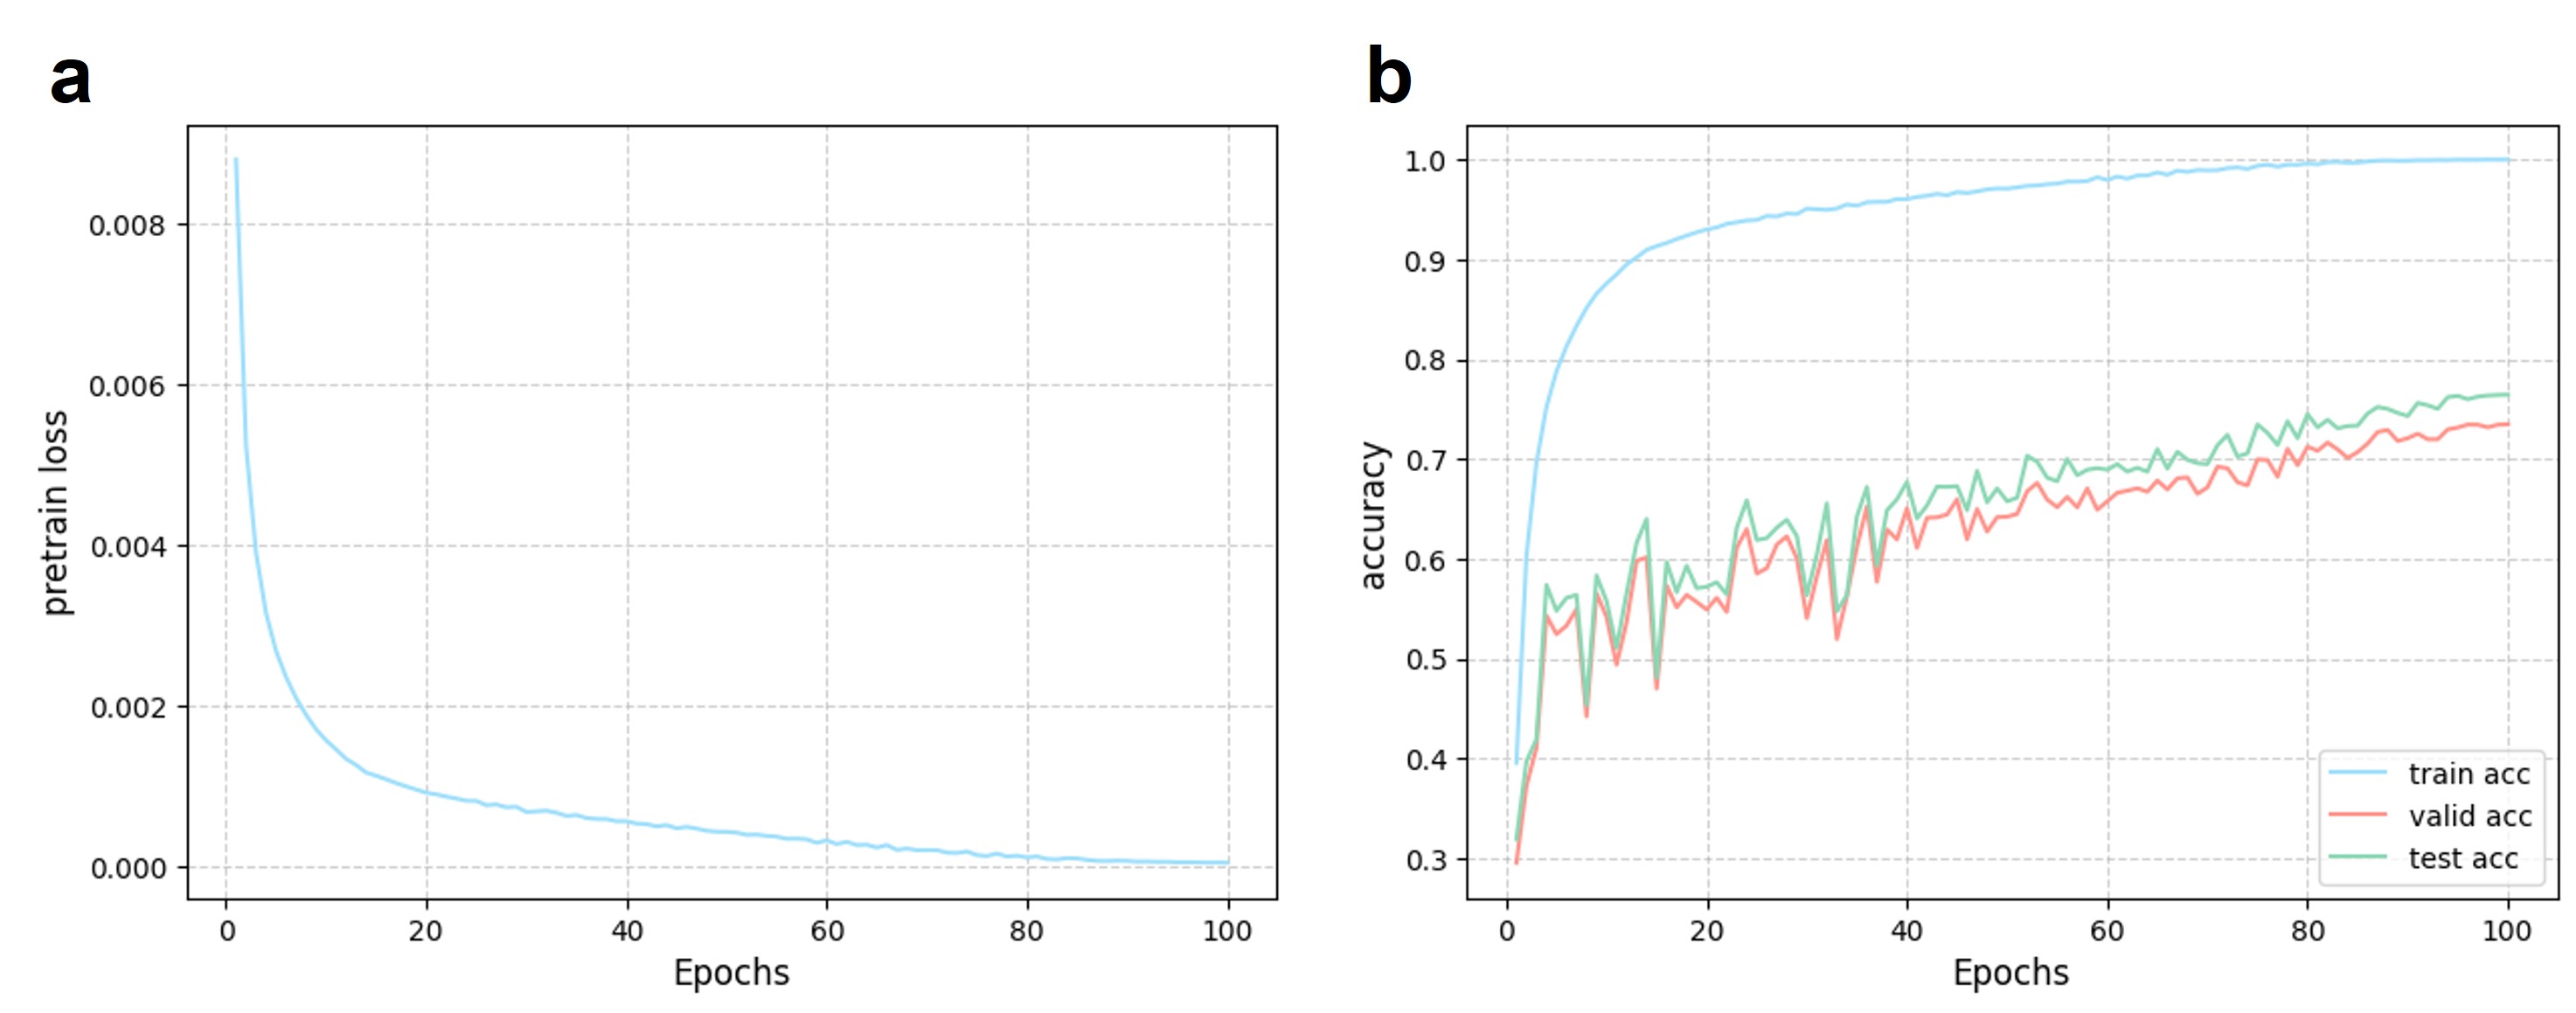
Specifically, we employed the ViT architecture [20] and the TCGA-UT dataset, using the institution of each image as the label to perform supervised pretraining. This approach encourages the model to learn institution-specific information. The dataset consists of pathological images from 32 cancer types, among which images from 27 cancer types were split into training, validation, and test sets (i.e., pretrain_test) for pretraining and validating the institution information extraction model. Additionally, five cancer types related to the lung and kidney (i.e., LUNG-INS and RCC-INS) were designated as an external test sets. Pretraining such an institution-specific information extraction model is relatively straightforward, as evidenced by the obvious decline in loss during training, as shown in Figure 1.
We treat the pretrained model as an institution feature foundation model (IFFM). Using this IFFM, we extracted institution-specific features from images for institution classification. Institution classification experiments were conducted on the LUNG-INS, RCC-INS, and OA-INS datasets. Here, OA is a dataset originally used for tumor detection and histological regression grading in oesophageal adenocarcinomas [21]. We replaced the pathology-related labels with institution labels, creating the OA-INS dataset for institution classification experiments. As shown in Table 2, the pretrained model successfully captures institution-specific features, achieving high classification performance. Notably, images from TCGA were excluded from the OA-INS dataset. Therefore, compared to the dataset used for pretraining, OA-INS serves as an external validation set. The IFFM still demonstrated strong institution classification performance on this dataset. These results suggest that institution-specific features can be effectively extracted and generalized.
| Class No. | ACC | F1-score | |
|---|---|---|---|
| pretrain_test | 103 | 0.7644 | 0.6422 |
| LUNG-INS | 12 | 0.7621 | 0.6285 |
| RCC-INS | 8 | 0.8183 | 0.6715 |
| OA-INS | 3 | 0.9507 | 0.9258 |
2.3 The Impact of Institution-specific information
If institution-specific information exhibits spurious correlations with the pathological labels in downstream tasks, the model may rely on such information for pathological decisions. It can lead to the learning of irrelevant features rather than those genuinely associated with diagnosis. These spurious correlations do not reflect true medical knowledge and often lack consistency across different datasets, ultimately compromising the model’s generalization.
In this section, we further investigate the impact of diagnosis-independent information on the performance of downstream tasks. Specifically, we assess how downstream task models perform in OOD settings when leveraging features extracted from existing PFMs. To this end, we conduct extensive experiments on common pathology analysis tasks, including ROI classification, WSI classification, and image retrieval. For each task, the performance in the in-distribution (ID) test scenario serves as a baseline, and we examine the extent of performance degradation across various OOD scenarios.
To assess the potential impact of such irrelevant information in OOD scenarios, we carefully designed three distinct OOD settings and conducted extensive experiments. The first setting involves training and test samples originating from different institutions, a common challenge encountered when developing downstream task models. In the second setting, training samples are sourced from multiple institutions, but each institution contributes samples from only a single class (e.g., Institution A provides only Class 0 samples, while Institution B provides only Class 1 samples). This setup simulates a scenario where institution-specific information exhibits spurious correlations with pathological labels. However, the test set is uniformly drawn from other institutions. The third setting shares the same training set as the second, but in the test set, each institution again provides only a single class of samples, with the institution-class correspondence completely reversed. In other words, the spurious correlations present in the training set are deliberately inverted in the test set. For example, if in the training set, Institution A provides only Class 0 samples and Institution B provides only Class 1 samples, then in the test set, Institution A provides only Class 1 samples and Institution B provides only Class 0 samples. Table 3 provides a visual illustration of these three OOD settings.
| INS 0 | INS 1 | INS 2 | INS 3 | ||||||
|---|---|---|---|---|---|---|---|---|---|
| Class 0 | Class 1 | Class 0 | Class 1 | Class 0 | Class 1 | Class 0 | Class 1 | ||
| ID (Baseline) | Train | ||||||||
| Test | |||||||||
| OOD1 | Train | ||||||||
| Test | |||||||||
| OOD2 | Train | ||||||||
| Test | |||||||||
| OOD3 | Train | ||||||||
| Test | |||||||||
2.3.1 Patch classification performance declines in OOD settings
Patch classification refers to the task of classifying small image patches cropped from WSIs into different categories, such as normal, benign, or malignant tissue. Patch classification plays a crucial role in various pathology applications, including automated diagnosis, biomarker discovery, and aiding pathologists in identifying regions of interest.
In this section, we selected patches related to lung and kidney tissues from the TCGA-UT dataset while excluding institutions with a limited number of patch images. This led to the creation of two new datasets for cancer subtype classification, LUNG-patch and RCC-patch. We applied the three predefined OOD settings to split the training and test sets for patch classification. Patches were input into three PFMs to obtain the corresponding feature embeddings, which are then used to train classification models. Through these experiments, we systematically evaluate the impact of institution-specific information on patch classification tasks.
| UNI | Prov-GigaPath | Virchow | ||||
|---|---|---|---|---|---|---|
| ACC | F1-score | ACC | F1-score | ACC | F1-score | |
| Baseline 1&2 | 0.8934 | 0.8924 | 0.8958 | 0.8951 | 0.8883 | 0.8874 |
| OOD1 | 0.8481 | 0.8470 | 0.8648 | 0.8634 | 0.8642 | 0.8625 |
| OOD2 | 0.8095 | 0.8057 | 0.8082 | 0.8043 | 0.7612 | 0.7488 |
| Baseline 3 | 0.7410 | 0.6622 | 0.9010 | 0.8997 | 0.8855 | 0.8840 |
| OOD3 | 0.4455 | 0.3536 | 0.5809 | 0.5798 | 0.6082 | 0.6077 |
Table 4 and Table 5 present the performance of the two datasets under the three OOD settings when using three commonly adopted PFMs. Notably, each OOD scenario shares the exact same set of samples with its corresponding baseline, differing only in the partitioning of training and test data. Due to the stricter sample distribution requirements in the OOD3 setting, the number of included patches is slightly lower than in OOD1 and OOD2. Consequently, the baseline for OOD3 differs from those of OOD1 and OOD2. The results reveal a significant decline in patch classification accuracy across all three OOD settings. As the spurious correlation between pathological labels and institution labels becomes progressively stronger across the OOD scenarios, the extent of performance degradation also increases.
| UNI | Prov-GigaPath | Virchow | ||||
|---|---|---|---|---|---|---|
| ACC | F1-score | ACC | F1-score | ACC | F1-score | |
| Baseline 1&2 | 0.9394 | 0.9259 | 0.7265 | 0.4876 | 0.8419 | 0.7347 |
| OOD1 | 0.8968 | 0.8638 | 0.7163 | 0.4513 | 0.7806 | 0.5976 |
| OOD2 | 0.8160 | 0.7787 | 0.6897 | 0.5149 | 0.8010 | 0.7543 |
| Baseline 3 | 0.9437 | 0.9306 | 0.8233 | 0.6634 | 0.7776 | 0.5736 |
| OOD3 | 0.7219 | 0.6946 | 0.5208 | 0.4099 | 0.5256 | 0.4137 |
2.3.2 WSI prediction performance declines in OOD settings
WSI analysis refers to the task of assigning a diagnostic or prognostic prediction to an entire WSI, such as distinguishing between different cancer subtypes or grading tumor severity. It is essential for automated pathology diagnosis, treatment decision support, and large-scale histopathological studies.
In this section, we selected multiple WSI analysis datasets covering various tasks, including cancer subtype classification (LUNG-subtype, RCC-subtype, SARC-subtype), gene mutation prediction (LUAD-TP53, GBM&LGG-IDH1), and survival prediction (LUAD-sur, KIRC-sur, UCEC-sur). Similarly, we adopted predefined OOD settings for partitioning the training and validation sets. Feature extraction was performed using three widely used PFMs, followed by the application of ABMIL [22] as the downstream task model. Through these experiments, we systematically evaluated the impact of institution-specific information on WSI analysis tasks.
For cancer subtype classification, we conducted experiments on three datasets, with the results presented in Table 6. The LUNG-subtype dataset consists of TCGA-LUAD and TCGA-LUSC, corresponding to two common lung cancer subtypes, lung adenocarcinoma (LUAD) and lung squamous cell carcinoma (LUSC). The RCC-subtype dataset comprises TCGA-KIRC, TCGA-KIRP, and TCGA-KICH, representing three major kidney cancer subtypes, kidney renal clear cell carcinoma (KIRC), kidney renal papillary cell carcinoma (KIRP), and kidney chromophobe carcinoma (KICH). The SARC-subtype dataset includes two common types of soft tissue sarcomas, liposarcoma and leiomyosarcoma. Notably, due to the limited number of WSIs, constructing the OOD2 setting was not feasible, and thus only OOD1 and OOD3 were evaluated. The results across all three datasets indicate an obvious performance decline in downstream task models under OOD conditions. Similarly, this degradation is more pronounced in the OOD3 setting.
| UNI | Prov-GigaPath | Virchow | |||||
|---|---|---|---|---|---|---|---|
| ACC | F1-score | ACC | F1-score | ACC | F1-score | ||
| LUNG-subtype | Baseline 1&2 | 0.9478 | 0.9476 | 0.9393 | 0.9391 | 0.9335 | 0.9333 |
| OOD1 | 0.9333 | 0.9223 | 0.9249 | 0.9127 | 0.9033 | 0.8883 | |
| Baseline 3 | 0.9425 | 0.9416 | 0.9378 | 0.9368 | 0.9213 | 0.9195 | |
| OOD3 | 0.7960 | 0.7943 | 0.7967 | 0.7955 | 0.7728 | 0.7624 | |
| RCC-subtype | Baseline 1&2 | 0.9477 | 0.9392 | 0.9520 | 0.9409 | 0.9435 | 0.9316 |
| OOD1 | 0.8674 | 0.8218 | 0.8663 | 0.8174 | 0.8826 | 0.8479 | |
| Baseline 3 | 0.9472 | 0.9309 | 0.9366 | 0.9117 | 0.9525 | 0.9356 | |
| OOD3 | 0.6919 | 0.6080 | 0.7387 | 0.6576 | 0.6661 | 0.5865 | |
| SARC-subtype | Baseline 1&2 | 0.9590 | 0.9572 | 0.9552 | 0.9537 | 0.9524 | 0.9503 |
| OOD1 | 0.8749 | 0.8618 | 0.8455 | 0.8248 | 0.8682 | 0.8540 | |
| Baseline 3 | 0.9396 | 0.9395 | 0.9470 | 0.9469 | 0.9190 | 0.9188 | |
| OOD3 | 0.2235 | 0.2069 | 0.3068 | 0.2742 | 0.3922 | 0.3388 | |
For the gene mutation prediction task, we conducted experiments on two datasets, LUAD-TP53 and GBM&LGG-IDH1. The LUAD-TP53 dataset consists of WSIs from TCGA-LUAD, with labels indicating whether the TP53 gene is mutated. The GBM&LGG-IDH1 dataset includes WSIs from TCGA-GBM and TCGA-LGG, with labels indicating the mutation status of the IDH1 gene. Table 7 presents the performance of downstream task models using feature embeddings extracted from three PFMs. Similarly, model performance significantly declines in OOD settings.
| UNI | Prov-GigaPath | Virchow | |||||
|---|---|---|---|---|---|---|---|
| ACC | F1-score | ACC | F1-score | ACC | F1-score | ||
| LUAD-TP53 | Baseline 1&2 | 0.6875 | 0.6854 | 0.6744 | 0.6732 | 0.6705 | 0.6697 |
| OOD1 | 0.5009 | 0.4860 | 0.5197 | 0.4870 | 0.5265 | 0.5140 | |
| Baseline 3 | 0.6704 | 0.6679 | 0.7111 | 0.7081 | 0.6259 | 0.6232 | |
| OOD3 | 0.2919 | 0.2889 | 0.3292 | 0.3252 | 0.2756 | 0.2742 | |
| GBM&LGG-IDH1 | Baseline 1&2 | 0.9177 | 0.9174 | 0.9235 | 0.9233 | 0.9016 | 0.9011 |
| OOD1 | 0.7594 | 0.7380 | 0.8688 | 0.8467 | 0.5938 | 0.5898 | |
| Baseline 3 | 0.9112 | 0.9110 | 0.9197 | 0.9196 | 0.8942 | 0.8940 | |
| OOD3 | 0.2924 | 0.2889 | 0.3527 | 0.3457 | 0.1876 | 0.1872 | |
For survival analysis, we conducted experiments on three datasets, LUAD-sur, KIRC-sur, and UCEC-sur, corresponding to TCGA-LUAD, TCGA-KIRC, and TCGA-UCEC, respectively. Since survival analysis tasks do not involve categorical labels, constructing OOD2 and OOD3 settings was not feasible. Therefore, we only evaluated model performance under the OOD1 setting. The results, presented in Table 8, similarly demonstrate a decline in model performance in the OOD scenario.
| UNI | Prov-GigaPath | Virchow | ||
|---|---|---|---|---|
| LUAD-sur | Baseline 1&2 | 0.6059 | 0.6284 | 0.6345 |
| OOD1 | 0.5970 | 0.6158 | 0.5901 | |
| KIRC-sur | Baseline 1&2 | 0.7164 | 0.7383 | 0.7058 |
| OOD1 | 0.6950 | 0.7144 | 0.6908 | |
| UCEC-sur | Baseline 1&2 | 0.7220 | 0.7161 | 0.7252 |
| OOD1 | 0.6623 | 0.7025 | 0.6891 |
In WSI-based analysis, cancer subtype classification and survival analysis are relatively common and comparatively straightforward tasks. However, existing PFMs still capture institution-specific information when extracting features for these downstream models, resulting in noticeable performance degradation under OOD settings. Predicting gene mutation status from WSIs is a more challenging task, and the performance gap between ID and OOD scenarios is even more pronounced. This suggests that downstream models may be relying on spurious correlations, raising concerns that the performance of existing PFMs on complex tasks like gene mutation prediction may be overestimated.
2.3.3 Image retrieval performance declines in OOD settings
Pathology image retrieval refers to the task of searching for and retrieving similar WSIs or image patches from a large database based on a given query image. It enables pathologists to compare a query case with archived cases, aiding in more accurate and consistent diagnoses.
We conducted image retrieval experiments using the TCGA-Pan-Cancer dataset [23] and the experimental setup from UNI. Similarly, we evaluated retrieval performance under OOD scenarios by using feature embeddings extracted from three PFMs. Notably, limited by institutional distribution of samples in this dataset, the OOD2 setting could not be constructed, and experiments were conducted only on OOD1 and OOD3. As shown in Table 9, image retrieval performance significantly degraded under OOD conditions, indicating that institution-specific information also negatively impacts retrieval tasks.
| Acc@1 | Acc@3 | Acc@5 | MVAcc@5 | ||
|---|---|---|---|---|---|
| UNI | Baseline 1&2 | 0.7406 | 0.8326 | 0.8686 | 0.7743 |
| OOD1 | 0.5690 | 0.6880 | 0.7385 | 0.6108 | |
| Baseline 3 | 0.7365 | 0.8291 | 0.8660 | 0.7702 | |
| OOD3 | 0.5648 | 0.6887 | 0.7434 | 0.6086 | |
| Prov-GigaPath | Baseline 1&2 | 0.7268 | 0.8178 | 0.8544 | 0.7586 |
| OOD1 | 0.5518 | 0.6686 | 0.7199 | 0.5913 | |
| Baseline 3 | 0.7215 | 0.8133 | 0.8504 | 0.7519 | |
| OOD3 | 0.5475 | 0.6691 | 0.7232 | 0.5866 | |
| Virchow | Baseline 1&2 | 0.6988 | 0.8021 | 0.8428 | 0.7344 |
| OOD1 | 0.5571 | 0.6789 | 0.7308 | 0.5969 | |
| Baseline 3 | 0.6936 | 0.7976 | 0.8393 | 0.7284 | |
| OOD3 | 0.5439 | 0.6743 | 0.7313 | 0.5896 |
2.4 Stain normalization fails to address the performance gap
As discussed in Section 2.2.2, staining differences are one of the factors contributing to institution-specific features in images. Therefore, reducing such variations through stain normalization is a common approach to mitigating institution-specific biases, as seen in previous studies. To further investigate the effectiveness of this method, we conducted experiments to evaluate the impact of stain normalization on improving the generalization and robustness of downstream models. As shown in Table 10, applying stain normalization only improves classification performance in some OOD settings. This indicates that stain normalization cannot completely eliminate institution-specific features in pathological images.
| UNI | Prov-GigaPath | Virchow | |||||
|---|---|---|---|---|---|---|---|
| w/ norm | ACC | F1-score | ACC | F1-score | ACC | F1-score | |
| OOD1 | 0.8968 | 0.8638 | 0.7163 | 0.4513 | 0.7806 | 0.5976 | |
| 0.8916 | 0.8507 | 0.7299 | 0.6615 | 0.8794 | 0.8352 | ||
| OOD2 | 0.8160 | 0.7787 | 0.6897 | 0.5149 | 0.8010 | 0.7543 | |
| 0.8258 | 0.7833 | 0.6913 | 0.5132 | 0.8195 | 0.7699 | ||
| OOD3 | 0.7219 | 0.6946 | 0.5208 | 0.4099 | 0.5256 | 0.4137 | |
| 0.5891 | 0.4956 | 0.6386 | 0.5684 | 0.5717 | 0.4796 | ||
3 Reasons why PFMs learn institution-specific features
In this section, we explore why PFMs capture institution-specific information from images and provide a simple validation of this phenomenon. One possible reason is that most of these foundation models are pretrained using self-supervised learning, a paradigm that tends to capture all differences between images rather than focusing solely on diagnostically relevant features. To learn diverse and generalizable representations, pathology foundation models typically require large-scale datasets for pretraining. However, the amount of data available from a single institution is often limited, necessitating the use of multi-institutional datasets. This, in turn, increases the risk of PFMs learning institution-specific features. Table 11 provides a brief summary of the algorithms and data used for these three PFMs, all of which employ the classic self-supervised learning method DINOv2 [24].
| Algorithm | Tissue No. | Patch No. | WSI No. | Institution No. | |
|---|---|---|---|---|---|
| UNI | DINOv2 | 20 | million | 100426 | 3 |
| Prov-GigaPath | DINOv2 | 31 | billion | 171189 | 28 |
| Virchow | DINOv2 | 17 | million | 1 |
To validate this hypothesis, we conducted a set of experiments. Specifically, we trained two small-scale foundation models (VIT-S-SSL and VIT-S-FSL) using the same training data and model architecture but with different learning paradigms, self-supervised and fully supervised learning. Both models adopt the ViT-S architecture and are trained on the TCGA-UT dataset, where images from 27 cancer types are used for training, while the remaining 5 cancer types serve as the test set. The self-supervised model (VIT-S-SSL) is trained using the DINOv2 method, whereas the fully supervised model (VIT-S-FSL) is trained with the cancer-type labels provided by TCGA-UT.
We then evaluated the institution classification performance of these two models using the LUNG-INS and RCC-INS datasets. As shown in Table 12, the self-supervised model (VIT-S-SSL) captured more institution-specific information, achieving higher institution classification accuracy. In contrast, the fully supervised model (VIT-S-FSL), guided by cancer-type labels during training, exhibited a reduced tendency to focus on institution-specific information.
| LUNG-INS | RCC-INS | |||
| ACC | F1-score | ACC | F1-score | |
| UNI | 0.7169 | 0.4867 | 0.7871 | 0.6204 |
| Prov-GigaPath | 0.5911 | 0.3127 | 0.7683 | 0.5601 |
| Virchow | 0.5202 | 0.2686 | 0.7423 | 0.5130 |
| CONCH-V | 0.6296 | 0.4110 | 0.6486 | 0.5014 |
| ViT-S-SSL | 0.7927 | 0.7248 | 0.8797 | 0.8214 |
| ViT-S-FSL | 0.6835 | 0.5866 | 0.8093 | 0.7258 |
On the other hand, we introduced CONCH, a vision-language foundation model designed for computational pathology. Unlike UNI, Prov-GigaPath, and Virchow, CONCH is trained by optimizing image-text matching loss rather than using a self-supervised approach. Its text branch serves as a supervised signal for the visual branch (CONCH-V), making the visual encoder functionally equivalent to a vision foundation model trained in a supervised manner. To further investigate the reasons why PFMs capture institution-specific information, we evaluated this visual encoder on institution classification and WSI classification in OOD settings, comparing its performance against the three previously mentioned PFMs. In most cases, using CONCH-V as the feature extractor results in poorer institution classification performance (Table 12), indicating that its feature embeddings indeed contain less institution-specific information. Table 13 presents the results of WSI classification. When using feature embeddings from CONCH-V, the downstream model maintains good performance in OOD3 settings, with only a slight decline compared to the corresponding baseline. In contrast, with the other three PFMs, the downstream models exhibit a significant performance decline in OOD3 settings. This suggests that CONCH-V is indeed less affected by the spurious correlation between institution-specific information and pathological labels.
Baseline 1&2 OOD1 Baseline 3 OOD3 ACC F1-score ACC F1-score ACC F1-score ACC F1-score LUNG-subtype UNI 0.9478 0.9476 0.9333 0.9223 0.9425 0.9416 0.7960 0.7943 Prov-GigaPath 0.9393 0.9391 0.9249 0.9127 0.9378 0.9368 0.7967 0.7955 Virchow 0.9335 0.9333 0.9033 0.8883 0.9213 0.9195 0.7728 0.7624 CONCH-V 0.9297 0.9296 0.9249 0.9119 0.9330 0.9318 0.9020 0.9008 RCC-subtype UNI 0.9477 0.9392 0.8674 0.8218 0.9472 0.9309 0.6919 0.6080 Prov-GigaPath 0.9520 0.9409 0.8663 0.8174 0.9366 0.9117 0.7387 0.6576 Virchow 0.9435 0.9316 0.8826 0.8479 0.9525 0.9356 0.6661 0.5865 CONCH-V 0.9445 0.9309 0.8761 0.8291 0.9314 0.9014 0.8435 0.7706
4 A Simple Solution
In the previous section, we observed that feature extractors trained using fully supervised learning captured fewer institution-specific features compared to those trained with self-supervised learning. And the vision encoder in CONCH, which is trained with the guidance of pathological knowledge, demonstrates better performance in OOD setting. These insights suggest that applying some level of supervision during finetuning could be beneficial when adapting PFMs for clinical downstream tasks. Given the large number of parameters in PFMs, we employed LoRA [25] for efficient fine-tuning. We evaluated this approach on the patch classification task, evaluating its performance in OOD scenarios. As shown in Table 14, patch classification models with the fine-tuned PFM demonstrated improved performance across all three OOD settings on both datasets, especially in OOD3, where spurious correlations were the most severe.
| OOD1 | OOD2 | OOD3 | |||||
|---|---|---|---|---|---|---|---|
| UNI | UNI+LoRA | UNI | UNI+LoRA | UNI | UNI+LoRA | ||
| LUNG-patch | ACC | 0.8481 | 0.8632 | 0.8095 | 0.8255 | 0.4455 | 0.6549 |
| F1-score | 0.8470 | 0.8619 | 0.8057 | 0.8226 | 0.3536 | 0.6545 | |
| RCC-patch | ACC | 0.8968 | 0.9036 | 0.8160 | 0.8757 | 0.7219 | 0.8454 |
| F1-score | 0.8638 | 0.8683 | 0.7787 | 0.8363 | 0.6946 | 0.8370 | |
5 Discussion
5.1 Existing PFMs still perform well in various tasks
Existing PFMs capture institution-specific features unrelated to diagnosis, leading to performance degradation of downstream models in OOD settings, which is undesirable. However, despite this limitation, these PFMs still exhibit strong performance across a wide range of pathology image analysis tasks, representing a significant improvement over earlier feature extractors pretrained on natural images.
In this study, we designed three OOD settings to examine how downstream models are affected by spurious correlations between institution-specific features captured by PFMs from pathology images and pathology labels. Among them, OOD1 represents the most likely scenario in real clinical settings, where the performance of downstream models declines slightly but remains effective, demonstrating the practicality of current PFMs. In contrast, OOD2 and OOD3 serve as rigorous test scenarios to evaluate the performance of PFMs’ feature embeddings under extreme conditions. Ideally, PFMs should maintain strong performance even in these settings. However, if performance degradation occurs, it does not imply that PFMs are unusable. Instead, it suggests that PFMs capture both diagnostically relevant pathology patterns and institution-specific features unrelated to diagnosis. In common clinical scenarios, pathology features dominate, allowing PFMs to remain broadly applicable to pathology analysis tasks. However, in extreme settings, the spurious correlation between institution-specific features and pathology labels becomes too strong, leading downstream models to rely more on institution-specific information.
It is important to note that this study is not intended to negate or criticize existing PFMs. The usability, superiority, and revolutionary impact of these PFMs on computational pathology remain undeniable. PFMs serve as the foundation and a crucial component of computational pathology and will continue to be a key focus of future research. We hope that our findings and analyses can provide insights for the development of next-generation PFMs, encouraging not only data-driven advancements but also improvements in training algorithms to enhance the generalization and robustness of PFMs.
5.2 Innovations in training strategies are worth considering
The PFMs evaluated in this study were all trained using self-supervised learning, without explicitly provided supervision signals related to pathological features. As a result, these PFMs were inherently encouraged to learn all differences between images, including both pathological features and institution-specific information. In Section 2.4, we analyzed how self-supervised and fully supervised training methods influence the retention of institution-specific features. Additionally, we evaluated another vision-language PFM, CONCH, whose vision encoder (CONCH-V) can be considered a vision foundation model trained with supervision. We found that CONCH-V performed significantly better in OOD settings compared to purely vision-based PFMs trained with self-supervised learning. Similarly, in Section 2.5, we found that fine-tuning pretrained PFMs with downstream task labels can also mitigate the spurious correlation between institution-specific features and pathological labels, thereby improving the performance of downstream models in OOD settings. This case can be considered a form of post-finetuning for PFMs.
Therefore, incorporating supervision or guidance related to pathological features during PFM training is meaningful. However, due to the ultra-high resolution of pathology images, obtaining fine-grained annotations is relatively challenging. Thus, fully supervised training is impractical. In conclusion, we encourage innovation in existing self-supervised algorithms by designing specific self-supervised signals for pathological features and institution-specific features to decouple the two or suppress institution-specific features.
5.3 PFM performance in extreme scenarios requires attention
To evaluate the impact of institution-specific information on downstream model performance, this study defines three OOD scenarios. OOD1 represents the most common setting, covering the majority of clinical diagnostic tasks. However, for rare diseases where data from a single institution may not encompass all categories, scenarios described by OOD2 and OOD3 could emerge. Therefore, to ensure that PFMs remain applicable to a wide range of pathology analysis tasks, the extreme conditions represented by OOD2 and OOD3 also warrant attention.
On the other hand, evaluating OOD performance in extreme scenarios helps determine whether a downstream model relies on spurious correlations for decision-making. When tackling challenging tasks, such as predicting gene mutations from WSI, the pathological features learned by PFMs may be subtle. In such cases, if institution-specific features are spuriously correlated with pathological labels, the downstream model may rely on these features for gene mutation prediction, leading to an overestimation of its performance. By testing under extreme OOD settings, where the likelihood of spurious correlations remaining consistent between the training and test sets is lower, we can identify such spurious correlations through a noticeable decline in model performance on OOD test sets.
6 Conclusion
In this study, we discovered that PFMs extract institution-specific information from pathological images and experimentally verified the existence of such features. The feature embeddings provided by PFMs enable effective institution classification. These institution-specific features are not solely caused by staining differences and can be easily learned and generalized.
We realized that when this institution-specific information has a spurious correlation with the pathological labels in downstream tasks, it can negatively impact downstream models. Therefore, we then designed OOD scenarios to assess the negative impact of these institution-specific features on downstream models across various pathological analysis tasks. The three OOD settings represent both common multi-center studies and more extreme distribution shift scenarios. We found that feature embeddings from PFMs led to a significant performance decline in patch classification, WSI analysis, and image retrieval tasks. Moreover, this performance gap cannot be bridged simply by applying stain normalization.
Subsequently, we analyzed why PFMs learn institution-specific features in images, attributing this to the self-supervised learning , which lacks any prior knowledge guidance. Using the same dataset and model architecture, we compared the institution-specific information captured by PFMs under both fully supervised and self-supervised training approaches. Additionally, we introduced a vision-language PFM (not trained with self-supervised learning) to further demonstrate that incorporating supervision or guidance related to pathological knowledge during PFMs training helps mitigate the impact of institution-specific features. Finally, inspired by this finding, we proposed a simple solution, to finetune PFMs using pathological labels from downstream tasks, which resulted in improved performance in OOD scenarios.
However, despite inevitably extracting irrelevant information such as institution-specific features, these PFMs remain excellent. Their emergence has been revolutionary for the advancement of computational pathology, and the development and refinement of PFMs continue to be a key research focus in the future. We hope that the experimental results, findings, and analysis in this study will help downstream models minimize the interference of irrelevant features, promoting their application in clinical settings. At the same time, we also hope to inspire researchers to develop more generalized and robust foundational models.
References
- \bibcommenthead
- Song et al. [2023] Song, A.H., Jaume, G., Williamson, D.F., Lu, M.Y., Vaidya, A., Miller, T.R., Mahmood, F.: Artificial intelligence for digital and computational pathology. Nature Reviews Bioengineering 1(12), 930–949 (2023)
- Cui and Zhang [2021] Cui, M., Zhang, D.Y.: Artificial intelligence and computational pathology. Laboratory Investigation 101(4), 412–422 (2021)
- Quellec et al. [2017] Quellec, G., Cazuguel, G., Cochener, B., Lamard, M.: Multiple-instance learning for medical image and video analysis. IEEE reviews in biomedical engineering 10, 213–234 (2017)
- Gadermayr and Tschuchnig [2024] Gadermayr, M., Tschuchnig, M.: Multiple instance learning for digital pathology: A review of the state-of-the-art, limitations & future potential. Computerized Medical Imaging and Graphics, 102337 (2024)
- Chanda et al. [2024] Chanda, D., Aryal, M., Soltani, N.Y., Ganji, M.: A new era in computational pathology: A survey on foundation and vision-language models. arXiv preprint arXiv:2408.14496 (2024)
- He et al. [2016] He, K., Zhang, X., Ren, S., Sun, J.: Deep residual learning for image recognition. In: Proceedings of the IEEE Conference on Computer Vision and Pattern Recognition, pp. 770–778 (2016)
- Huang et al. [2017] Huang, G., Liu, Z., Van Der Maaten, L., Weinberger, K.Q.: Densely connected convolutional networks. In: Proceedings of the IEEE Conference on Computer Vision and Pattern Recognition, pp. 4700–4708 (2017)
- Wang et al. [2022] Wang, X., Yang, S., Zhang, J., Wang, M., Zhang, J., Yang, W., Huang, J., Han, X.: Transformer-based unsupervised contrastive learning for histopathological image classification. Medical image analysis 81, 102559 (2022)
- Chen et al. [2024] Chen, R.J., Ding, T., Lu, M.Y., Williamson, D.F., Jaume, G., Song, A.H., Chen, B., Zhang, A., Shao, D., Shaban, M., et al.: Towards a general-purpose foundation model for computational pathology. Nature Medicine 30(3), 850–862 (2024)
- Xu et al. [2024] Xu, H., Usuyama, N., Bagga, J., Zhang, S., Rao, R., Naumann, T., Wong, C., Gero, Z., González, J., Gu, Y., et al.: A whole-slide foundation model for digital pathology from real-world data. Nature, 1–8 (2024)
- Vorontsov et al. [2024] Vorontsov, E., Bozkurt, A., Casson, A., Shaikovski, G., Zelechowski, M., Severson, K., Zimmermann, E., Hall, J., Tenenholtz, N., Fusi, N., et al.: A foundation model for clinical-grade computational pathology and rare cancers detection. Nature medicine 30(10), 2924–2935 (2024)
- Huang et al. [2023] Huang, Z., Bianchi, F., Yuksekgonul, M., Montine, T.J., Zou, J.: A visual–language foundation model for pathology image analysis using medical twitter. Nature medicine 29(9), 2307–2316 (2023)
- Lu et al. [2024a] Lu, M.Y., Chen, B., Williamson, D.F., Chen, R.J., Liang, I., Ding, T., Jaume, G., Odintsov, I., Le, L.P., Gerber, G., et al.: A visual-language foundation model for computational pathology. Nature Medicine 30(3), 863–874 (2024)
- Lu et al. [2024b] Lu, M.Y., Chen, B., Williamson, D.F., Chen, R.J., Zhao, M., Chow, A.K., Ikemura, K., Kim, A., Pouli, D., Patel, A., et al.: A multimodal generative ai copilot for human pathology. Nature 634(8033), 466–473 (2024)
- Bilal et al. [2025] Bilal, M., Raza, M., Altherwy, Y., Alsuhaibani, A., Abduljabbar, A., Almarshad, F., Golding, P., Rajpoot, N., et al.: Foundation models in computational pathology: A review of challenges, opportunities, and impact. arXiv preprint arXiv:2502.08333 (2025)
- Howard et al. [2021] Howard, F.M., Dolezal, J., Kochanny, S., Schulte, J., Chen, H., Heij, L., Huo, D., Nanda, R., Olopade, O.I., Kather, J.N., et al.: The impact of site-specific digital histology signatures on deep learning model accuracy and bias. Nature communications 12(1), 4423 (2021)
- Komura and Ishikawa [2020] Komura, D., Ishikawa, S.: Histology images from uniform tumor regions in tcga whole slide images. (No Title) (2020)
- Hoque et al. [2024] Hoque, M.Z., Keskinarkaus, A., Nyberg, P., Seppänen, T.: Stain normalization methods for histopathology image analysis: A comprehensive review and experimental comparison. Information Fusion 102, 101997 (2024)
- Macenko et al. [2009] Macenko, M., Niethammer, M., Marron, J.S., Borland, D., Woosley, J.T., Guan, X., Schmitt, C., Thomas, N.E.: A method for normalizing histology slides for quantitative analysis. In: 2009 IEEE International Symposium on Biomedical Imaging: from Nano to Macro, pp. 1107–1110 (2009). IEEE
- Alexey [2020] Alexey, D.: An image is worth 16x16 words: Transformers for image recognition at scale. arXiv preprint arXiv: 2010.11929 (2020)
- Tolkach et al. [2023] Tolkach, Y., Wolgast, L.M., Damanakis, A., Pryalukhin, A., Schallenberg, S., Hulla, W., Eich, M.-L., Schroeder, W., Mukhopadhyay, A., Fuchs, M., et al.: Artificial intelligence for tumour tissue detection and histological regression grading in oesophageal adenocarcinomas: a retrospective algorithm development and validation study. The Lancet Digital Health 5(5), 265–275 (2023)
- Ilse et al. [2018] Ilse, M., Tomczak, J., Welling, M.: Attention-based deep multiple instance learning. In: International Conference on Machine Learning, pp. 2127–2136 (2018). PMLR
- Komura et al. [2022] Komura, D., Kawabe, A., Fukuta, K., Sano, K., Umezaki, T., Koda, H., Suzuki, R., Tominaga, K., Ochi, M., Konishi, H., et al.: Universal encoding of pan-cancer histology by deep texture representations. Cell Reports 38(9) (2022)
- Oquab et al. [2023] Oquab, M., Darcet, T., Moutakanni, T., Vo, H., Szafraniec, M., Khalidov, V., Fernandez, P., Haziza, D., Massa, F., El-Nouby, A., et al.: Dinov2: Learning robust visual features without supervision. arXiv preprint arXiv:2304.07193 (2023)
- Hu et al. [2021] Hu, E.J., Shen, Y., Wallis, P., Allen-Zhu, Z., Li, Y., Wang, S., Wang, L., Chen, W.: Lora: Low-rank adaptation of large language models. arXiv preprint arXiv:2106.09685 (2021)