Optimizing Lead-Free Chalcogenide Perovskites for High-Efficiency Photovoltaics via Alloying Strategies
Abstract
Lead-free chalcogenide perovskites are emerging as game-changers in the race for sustainable, high-performance photovoltaics. These materials offer a perfect trifecta: non-toxic elemental composition, exceptional phase stability, and outstanding optoelectronic properties. However, unlocking their full potential for solar cell applications requires advanced strategies to fine-tune their electronic and optical behavior. In this study, we take CaHfS—a promising but underexplored candidate—and revolutionize its performance by introducing targeted substitutions: Ti at the cation site and Se at the anion site. Using cutting-edge computational techniques, including density functional theory, GW calculations, and the Bethe-Salpeter equation (BSE), we reveal how these substitutions transform the material’s properties. Our findings highlight that alloyed compounds such as CaHfSSe and CaHfTiX (X = S, Se) are not only phase-stable but also feature adjustable direct GW@PBE bandgaps (1.29–2.67 eV), reduced exciton binding energies, and significantly improved polaron mobility. These modifications enable better light absorption, reduced electron-hole recombination, longer exciton lifetimes, and enhanced quantum yield. Impressively, the alloyed perovskites, specifically, for the Ti-rich Se-based perovskites, achieve a spectroscopic-limited maximum efficiency of up to 28.06%, outperforming traditional lead-based halide perovskites. Our results demonstrate that strategic alloying is a powerful tool to supercharge the optoelectronic properties of lead-free chalcogenide perovskites, positioning them as strong contenders for next-generation photovoltaic technologies.
I Introduction:
Inorganic−organic halide perovskites (IOHPs) have garnered unparalleled attention over the past decade due to their exceptional electronic and optical properties [chapter2-12, chapter3-8, chapter3-9, chapter3-10]. Consequently, the popularity of IOHPs in solar cell research has skyrocketed in recent years, with their record power conversion efficiency (PCE) increasing dramatically from 3.8% to 26.7% [chapter2-12, chapter2-53]. Despite these advances, a critical challenge persists: the majority of IOHPs are lead (Pb)-based, raising serious concerns about toxicity. Additionally, issues such as degradability, along with thermal and chemical instability attributed to the organic components, present formidable barriers to their large-scale industrial deployment [chapter3-12, chapter1-16]. These challenges have driven research toward designing stable, nontoxic alternative perovskites, paving the way for new, efficient photovoltaic materials.
Recently, chalcogenide perovskites (CPs) materials have garnered significant attention as promising alternatives to lead-based perovskites for solar cell technology [chapter3-11, chapter3-16, chapter3-17, chapter3-18]. The chemical formula of CPs is represented as ABX [chapter3-3, chapter3-18], where A and B correspond to divalent alkali-earth metal cations (Ca, Sr, Ba) and tetravalent transition metal cations (Ti, Zr, Hf), respectively. The X site is typically occupied by a chalcogen anion such as S or Se. Numerous experimental and theoretical studies have successfully demonstrated the synthesis of CPs, revealing their fascinating and promising properties [chapter3-11, chapter3-13, chapter3-16, chapter3-17, chapter3-18, chapter3-19, chapter3-37]. Also, at ambient temperature, two distinct phases of CPs have been identified: a needle-like orthorhombic phase (NHCdCl-type) and a distorted orthorhombic structure (GdFeO-type). Despite their structural differences, both phases share the same space group, (No. 62) [chapter3-18].
Among these CPs, ABS (A = Ca, Sr, Ba; B = Zr, Hf) have been experimentally synthesized with distorted structures featuring corner-sharing BS octahedra connected in a three-dimensional network [chapter3-37]. Also, a distorted CaTiS CP has been recently synthesized experimentally, exhibiting a bandgap of 1.59 eV [chapter6-1]. In addition, several first-principles-based studies have predicted that ABX (A = Ca, Sr, Ba; B = Zr, Hf and X = S, Se) CPs exhibit promising electronic and optical properties, making them attractive for optoelectronic applications [chapter3-19, chapter1-63, chapter5-16]. However, the performance of ABS (A = Ca, Sr, Ba; B = Zr, Hf) CPs in photovoltaic applications is significantly hindered compared to conventional lead-based HPs [chapter5-11, chapter5-12, chapter5-14, chapter5-13, chapter5-15, chapter5-17, chapter2-20], due to their higher bandgaps (1.832.46 eV), large exciton binding energies (0.190.26 eV), lower charge carrier mobilities (6.8418.77 cmVs), and reduced PCE (10.5625.02%) [chapter3-19, chapter1-63, chapter3-37]. Another study shows that selenide-based CPs outperform sulfur-based CPs in photovoltaic properties [chapter5-16]. However, their performance remains inferior to that of lead-based conventional HPs, with lower charge carrier mobilities (56.0877.59 cmVs) and reduced PCE (17.4523.08%). Therefore, it is essential to investigate CPs with optimal photovoltaic properties to address these challenges effectively.
It is well-known that the BX octahedra, which form the core of ABX perovskite materials, play a crucial role in determining the material’s electronic band structure, influencing properties such as the bandgap, charge carrier mobility, and efficiency. Recently, several studies have focused on tuning the electronic structure of CPs by chemically substituting cations or anions at the B and X sites. For instance, Meng et al. demonstrated a significant reduction in the bandgap of BaZrS through first-principles simulations by alloying Ti with Zr. They reported that doping the perovskite (BaZrTiS, = 0.1) reduced the bandgap to 1.47 eV, making it suitable for single-junction solar cell applications [chapter6-4]. Similarly, several experimental and first-principles-based studies have shown that alloying in CPs, such as BaHfTiS (0 0.05) [chapter6-3], BaHfZrS ( 1) [chapter6-6], and BaZrSnS ( 0.25) [chapter6-5], significantly enhances their photovoltaic properties. Liu et al. also explored anion-site engineering in Hf-based CPs to tailor their optoelectronic properties and enhance their photovoltaic performance [chapter6-7]. However, the excitonic and polaronic properties of the above mentioned mixed and alloyed CPs have not been explored for efficient solar cell applications, largely due to the substantial computational demands.
Inspired by the alloying strategies in CPs for designing efficient materials for optoelectronic applications, this study takes a systematic leap into designing next-gen materials for high-performance optoelectronic applications. We delve into the comprehensive study on the electronic, optical, transport, excitonic, and polaronic properties of CaHfSSe ( = 0, 1, 2, 3) and CaHfTiX ( = 0, 0.25, 0.50, 0.75, 1; X = S and Se) compounds within the framework of density functional theory (DFT) [chapter2-36, chapter2-37] and many-body perturbation theory (MBPT) [chapter3-1, chapter3-2]. Our findings are electrifying: these CPs exhibit direct GW@PBE [chapter1-69, chapter1-70] bandgaps in the ideal range of 1.29–2.67 eV, setting the stage for exceptional optoelectronic performance. Leveraging the Bethe-Salpeter equation (BSE) method [chapter1-67, chapter1-68], we calculated exciton binding energies () between 0.008 and 0.204 eV, ensuring robust excitonic stability. Adding depth, we employed density functional perturbation theory (DFPT) [chapter1-60] to assess ionic contributions to dielectric behavior, followed by the Fröhlich and Hellwarth models to explore polaronic phenomena. Our findings indicate that these CPs exhibit carrier-phonon coupling paired with remarkably high polaron mobility, far outpacing traditional lead-based CPs. Pushing boundaries further, we evaluated the spectroscopic limited maximum efficiency (SLME), revealing an impressive potential efficiency of up to 28.06%—a breakthrough for solar cell technology. These results underscore the power of alloying as a game-changing strategy to fine-tune the optoelectronic properties of CPs, paving the way for more efficient, sustainable, and lead-free alternatives in energy applications. This work highlights the transformative potential of alloying to unlock high-efficiency materials and sets a new benchmark for the future of optoelectronics.
II Computational Details:
In this paper, state-of-the-art calculations based on first-principles density functional theory (DFT) [chapter2-36, chapter2-37], density functional perturbation theory (DFPT) [chapter1-60], and many-body perturbation theory (MBPT) [chapter3-1, chapter3-2] were conducted using the Vienna Ab initio Simulation Package (VASP) [chapter1-31, chapter1-32]. The interactions between the valence electrons and the ion cores were described using projector augmented wave (PAW) pseudopotentials [chapter1-33]. The PAW potentials with valence-electron configurations considered for Ca, Ti, Hf, S, and Se were 3s3p4s, 3p4s3d, 5p6s5d, 3s3p, and 4s4p, respectively. The structural optimizations were performed using the Perdew-Burke-Ernzerhof (PBE) exchange-correlation (xc) functional within the generalized gradient approximation (GGA) [chapter1-34], which accounts for electron-electron interactions. The kinetic energy cutoff was set to 400 eV and the electronic self-consistent-field iteration energy convergence criteria was chosen at 10 eV. The lattice parameters as well as coordinates of all the atoms are fully optimized until the Helmann-Feynman forces on each atom’s were less than 0.01 eV/Å. In order to determine the optimized structures, Brillouin zone integrations were performed using a -centered -point grid. The optimized crystal structures were visualized using the VESTA (Visualization for Electronic and STructural Analysis) software [chapter2-3]. The phonon dispersion curves were computed using the DFPT method with supercells, employing the PHONOPY package [chapter3-6]. The electronic band structures were computed using the PBE xc functional, incorporating the spin-orbit coupling (SOC) effect, although it does not influence the overall trend. In addition, the electronic bandgaps were simultaneously calculated using the hybrid HSE06 xc functional [chapter1-35] and the MBPT-based GW method [chapter1-69, chapter1-70] for more accurate estimation. The initial step of the GW calculation was carried out using the PBE xc functional. The effective masses of the charge carriers were estimated using the SUMO code, which performed a parabolic fitting at the band edges. The Bethe-Salpeter equation (BSE) [chapter1-67, chapter1-68] calculations were also performed on top of the single-shot GW (GW)@PBE to more accurately estimate the optical properties, specifically incorporating the electron-hole interaction. Here, a -centered -grid and a converged number of bands (NBANDS) of 640 were used for the GW-BSE calculations. The electron-hole kernel for the BSE calculations was generated using 24 occupied and 24 unoccupied bands. The VASPKIT [chapter1-48] package was employed for the post-processing of the elastic and optical properties. The ionic contribution to the dielectric constant was also determined using the DFPT method.
Using the hydrogenic Wannier-Mott (WM) model, the exciton binding energy () for an electron-hole pair with screened Coulomb interaction is calculated as follows [chapter2-38, chapter5-16]:
| (1) |
where is the reduced mass of the charge carriers, represents the rest mass of electron, denotes the effective dielectric constant, and is the Rydberg constant. The effective mass has been determined using the following equation [chapter3-35]:
| (2) |
where is the effective mass in the -th direction (i = x, y, z). The reduced mass of the carrier, , is given by,
| (3) |
The correction to the exciton binding energy () due to phonon screening is expressed as [chapter3-39]:
| (4) |
where denotes the characteristic phonon angular frequency, and and represent the electronic (optical) and static (electronic + ionic) dielectric constants, respectively. The thermal "B" approach developed by Hellwarth et al. [chapter2-22] is employed to determine by averaging the spectral contributions of multiple phonon branches (for details, see the Supplemental Material).
The exciton radius () is computed using the following formula [chapter2-38, chapter5-16]:
| (5) |
where represents the exciton energy level and = 0.0529 nm is the Bohr radius. In our study, the electronic contribution to the dielectric function () is taken as the effective value and , which yields the smallest exciton radius. Using the exciton radius, the probability of the wave function at zero separation () can be calculated as follows [chapter5-16, chapter5-18]:
| (6) |
Within the framework of Fröhlich’s polaron model, the interaction between longitudinal optical phonons and an electron traveling through the lattice is governed by the dimensionless Fröhlich parameter, , which is expressed as [chapter5-16],
| (7) |
where represents the permittivity of free space and denotes the effective mass of the carrier. By determining the value of , the polaron energy () can be calculated using the following expression [chapter5-16]:
| (8) |
Using Feynman’s approach, the polaron’s effective mass () can be expressed as follows (for a small ) [chapter2-23]:
| (9) |
Finally, the polaron mobility () is estimated using the Hellwarth polaron model [chapter2-22] as follows:
| (10) |
where denontes the electronic charge, , and both are the temperature-dependent variational parameters, and is a function of , , and (for details, see the Supplemental Material).
III Results and Discussions:
In this present study, we conducted a comprehensive investigation to evaluate the effects of doping in both the cationic and anionic sites on the optoelectronic properties of CaHfS chalcogenide perovskite. The following sections provide an in-depth analysis of the stability, structural and electronic properties, transport behavior, optical properties, excitonic dynamics, polaronic effects, and the spectroscopic limited maximum efficiency (SLME) of CaHfSSe ( = 0, 1, 2, 3) and CaHfTiX ( = 0, 0.25, 0.50, 0.75, 1; X = S and Se) chalcogenide perovskites. These findings aim to build a fundamental understanding and provide valuable insights to guide future experimental investigations.
III.1 Structural Properties:
III.1.1 Crystal structure and crystallographic stability:
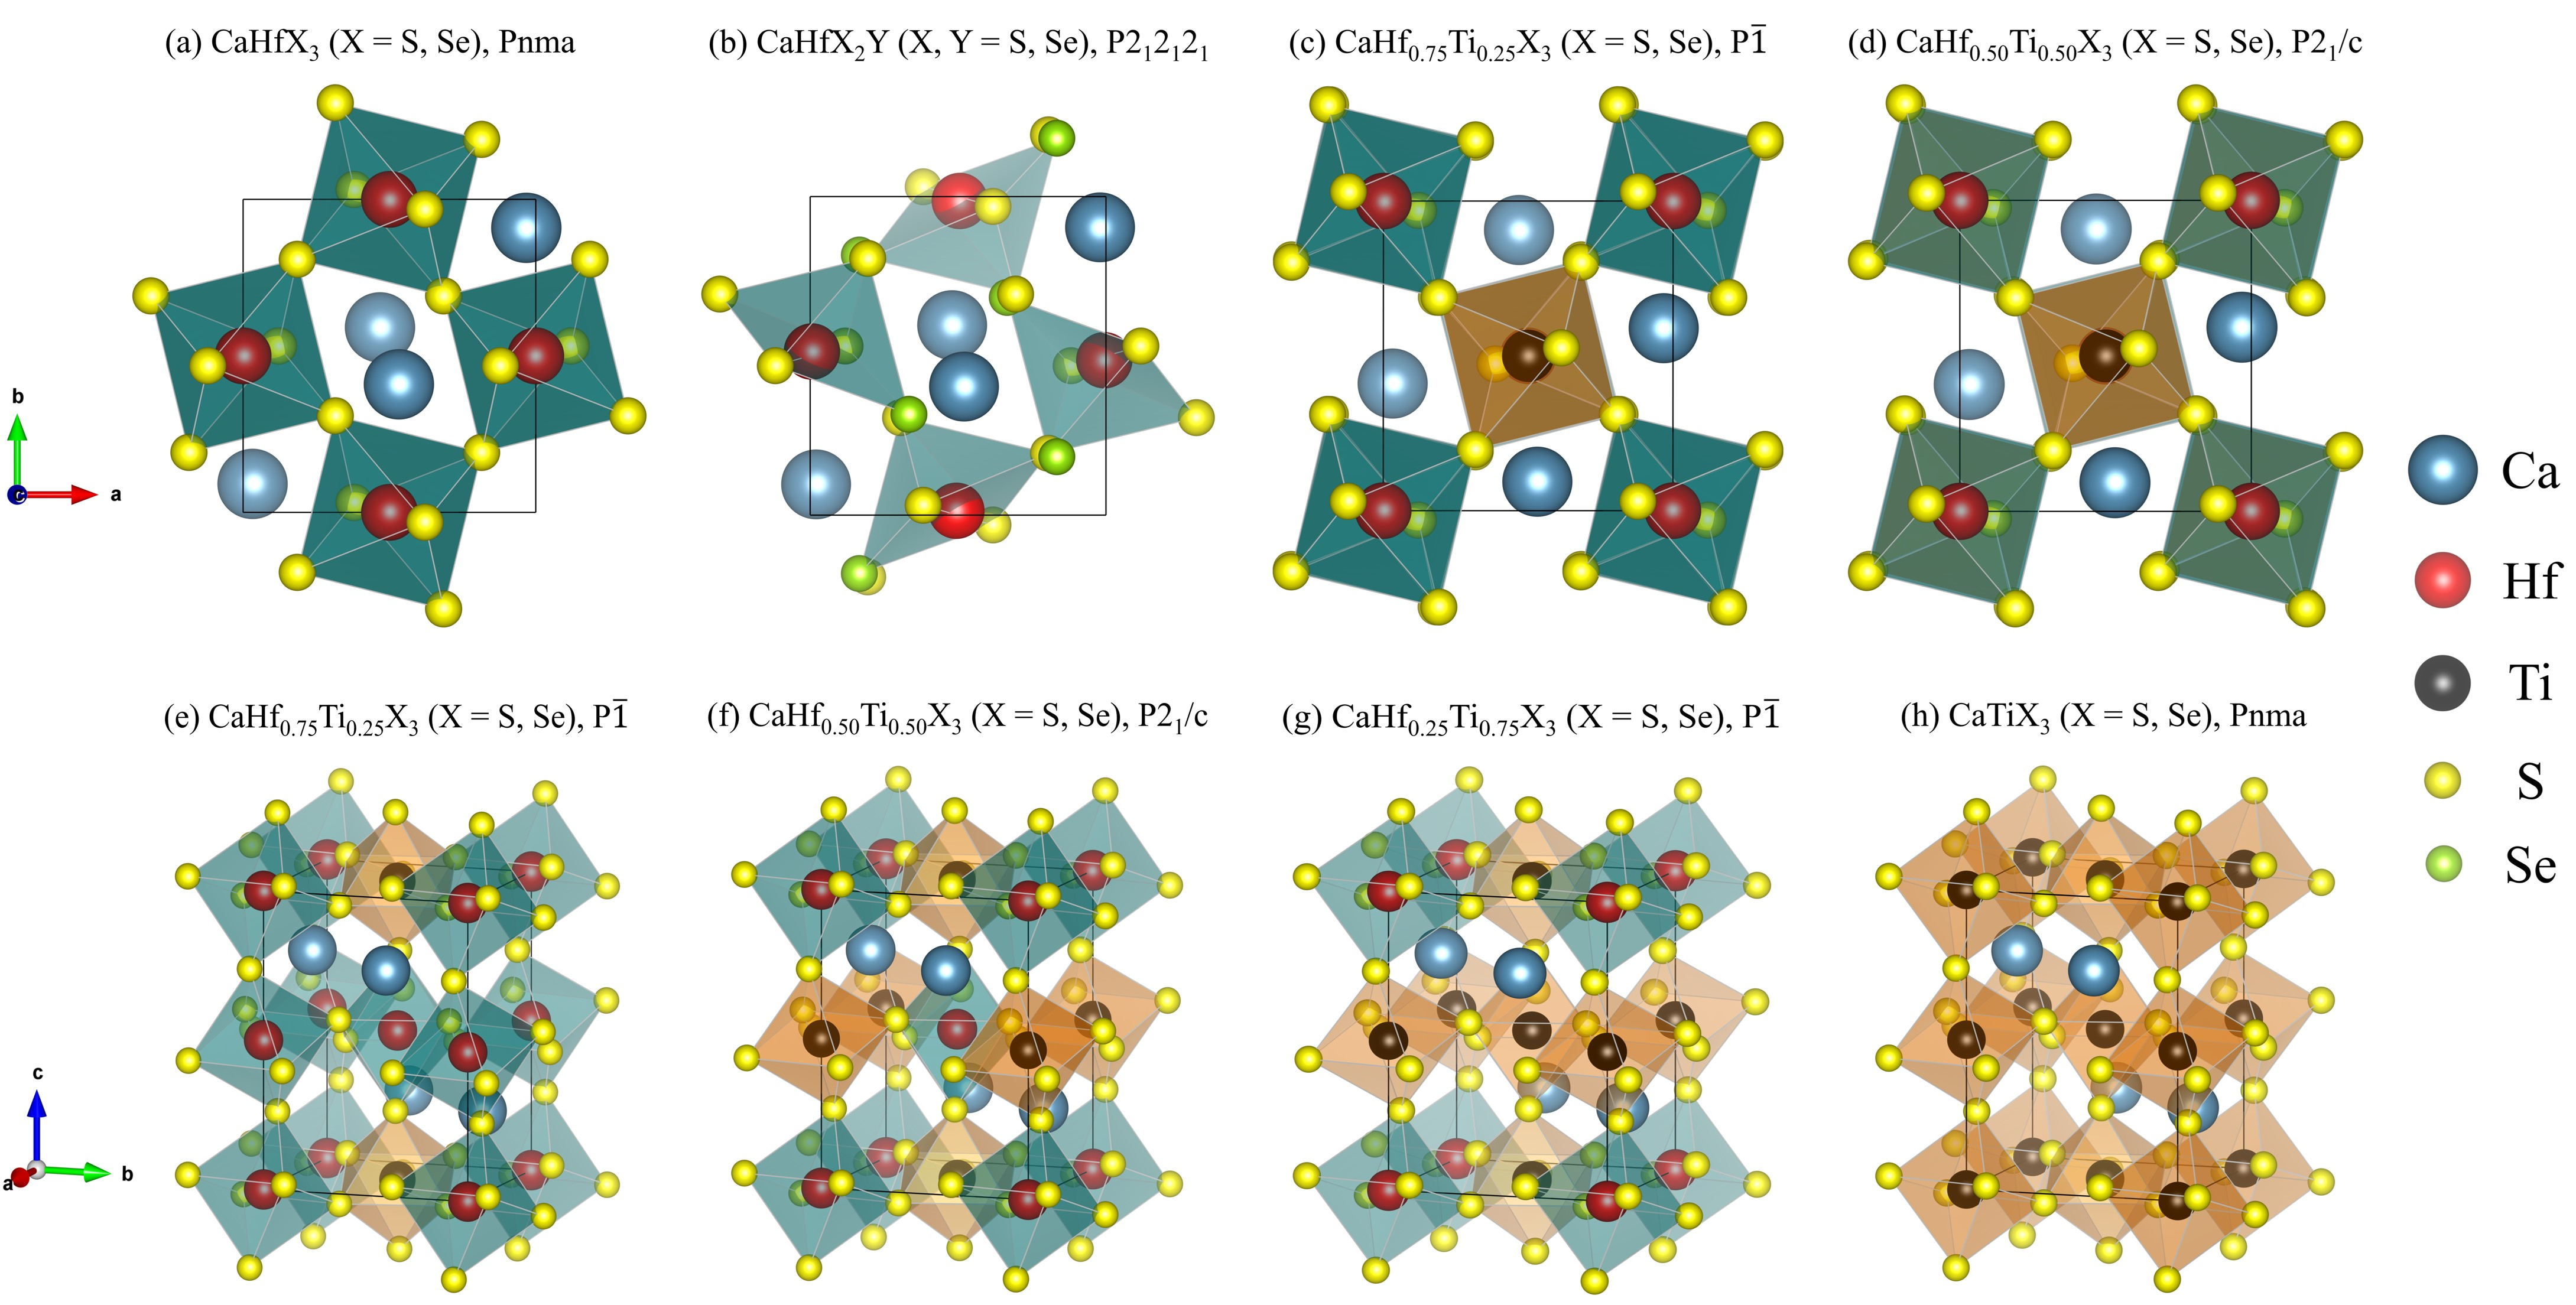
Figure 1(a) illustrates the crystal structure of the distorted orthorhombic phase of the chalcogenide perovskite CaHfX (X = S, Se), which belongs to the space group (No. 62). The crystal structures of these compounds typically consist of four unit cells containing a total of 20 atoms, including 4 Ca, 4 Hf, and 12 S/Se atoms. In the distorted phase, Ca cation exhibits 12-fold coordination, forming cuboctahedral structures with chalcogenides X (S or Se). Meanwhile, the Hf cation undergoes 6-fold coordination with chalcogen atoms X (S or Se), resulting in the formation of corner-sharing [HfX] distorted octahedra, characterized by tilting and structural distortion. To form mixed CP CaHfSSe, sulfur atoms are progressively substituted by selenium atoms. Similarly, in the alloy CaHfTiX, hafnium atoms are partially replaced by titanium atoms. The crystal structure of CaHfSSe ( = 1, 2) transitions to a lower-symmetry orthorhombic structure [space group (19)] when one chalcogenide site is replaced by another. Similarly, the crystal structures of CaHfTiX alloys undergo symmetry reduction when hafnium is partially substituted by titanium. For = 0.25 or 0.75, the structures reduce to a triclinic phase [space group (2)], while for = 0.50, they adopt a monoclinic phase [space group (14)]. When = 1, where hafnium is fully replaced by titanium, the structure transitions back to a higher-symmetry orthorhombic phase [space group (62)]. These systems are modeled using their primitive cell, comprising 20 atoms. The primitive crystal structures of CaHfSSe ( = 1, 2) and CaHfTiX ( = 0.25, 0.5, 0.75, 1; X = S, Se) CPs are also presented in Figure 1(b)-(h).
The calculated lattice parameters, space group (no.), and volume of the mixed and alloyed CPs are presented in Table 1. Notably, the computed lattice parameters for CaHfS show excellent agreement with the available experimental result (a = 6.52 Å, b = 6.98 Å, c = 9.54 Å) [chapter3-37]. It is also observed that the lattice parameters and volume of these mixed CPs increase with higher selenium content, attributed to the larger ionic radius of Se (1.98 Å) compared to S (1.84 Å). Conversely, in alloyed CPs with higher titanium content, the lattice parameters and volume decrease due to the smaller ionic radius of Ti (0.605 Å) compared to Hf (0.71 Å). In addition, the octahedral distortion parameters, including the average bond length, bond angle variance, polyhedral volume, and distortion index (bond length) for the HfX and TiXoctahedra in CaHfTiX ( = 0, 0.25, 0.5, 0.75, 1; X = S, Se) CPs, are computed and presented in Table S1. A very low distortion index for the HfX and TiX octahedra in these CPs suggests that the octahedra remain nearly ideal across the composition range, leading to enhanced structural stability, uniform electronic behavior, and predictable optoelectronic properties. This is beneficial for applications where consistent and tunable properties are essential, such as optoelectronic devices.
| Configurations | Lattice Parameters (Å) | Space group | Volume | ||||||
|---|---|---|---|---|---|---|---|---|---|
| a | b | c | (No.) | () | (eV/atom) | (eV/atom) | |||
| CaHfS | 6.56 | 7.01 | 9.58 | (62) | 440.87 | -0.0365 | - | ||
| CaHfSSe | 6.68 | 7.19 | 9.61 | (19) | 460.96 | -0.0617 | 0.0001 | ||
| CaHfSSe | 6.79 | 7.28 | 9.74 | (19) | 481.45 | -0.0423 | 0.0063 | ||
| CaHfSe | 6.84 | 7.34 | 10.03 | (62) | 504.27 | -0.0739 | - | ||
| CaHfTiS | 6.51 | 6.96 | 9.51 | (2) | 431.49 | -0.0491 | -0.0048 | ||
| CaHfTiSe | 6.79 | 7.29 | 9.96 | (2) | 493.72 | -0.0846 | -0.0039 | ||
| CaHfTiS | 6.47 | 6.90 | 9.43 | (14) | 421.37 | -0.0568 | -0.0048 | ||
| CaHfTiSe | 6.75 | 7.24 | 9.89 | (14) | 483.76 | -0.0911 | -0.0038 | ||
| CaHfTiS | 6.42 | 6.86 | 9.36 | (2) | 411.86 | -0.2184 | -0.0051 | ||
| CaHfTiSe | 6.71 | 7.19 | 9.81 | (2) | 473.70 | -0.0982 | -0.0041 | ||
| CaTiS | 6.38 | 6.79 | 9.27 | (62) | 402.07 | -0.0676 | - | ||
| CaTiSe | 6.67 | 7.13 | 9.74 | (62) | 463.27 | -0.1007 | - | ||
As the structural stability of perovskites plays a pivotal role in determining their suitability for high-performance device applications, we have evaluated the crystallographic stability of these materials. The crystallographic stability of mixed and alloyed perovskites has been analyzed by calculating Goldschmidt’s tolerance factor () [chapter1-36, chapter1-37] and the octahedral factor () [chapter1-37, chapter1-38] (for details, see the Supplemental Material). The calculated values of and are presented in Table S2, ranging from 0.8730.920 and 0.3060.386, respectively, confirming the stability of the investigated perovskites.
III.1.2 Thermodynamic stability:
To evaluate the thermodynamic stability of the mixed and alloyed CPs, their decomposition energies are calculated using the PBE xc functional. In our study, the stability of CaHfSSe and CaHfTiX compounds is estimated by calculating the energies needed to decompose them into their binary phases, such as CaX, HfX, and TiX, or into ternary phases like CaHfX and CaTiX (for details, see the Supplemental Material). The positive decomposition energies () indicate that these compounds will remain stable and will not break down into their respective binary (B) or ternary (T) phases. As shown in Table 1, the compounds CaHfSSe and CaHfSSe do not decompose into ternary phases at 0 K, while the remaining compounds have a high possibility of decomposing into both phases at 0 K. Notably, the probability of decomposition into binary phases is considerably higher than that into ternary phases at 0 K. Nevertheless, there is still a chance for these compounds to stabilize at elevated temperatures, as exemplified by the successful synthesis of CaTiS perovskite at 600-900°C in a vacuum [chapter6-1], suggesting their potential for higher temperature stability. In our study, thermodynamic stability does not ensure the stability of these materials; thus, we also assess their dynamical and mechanical stability.
III.1.3 Dynamical stability:
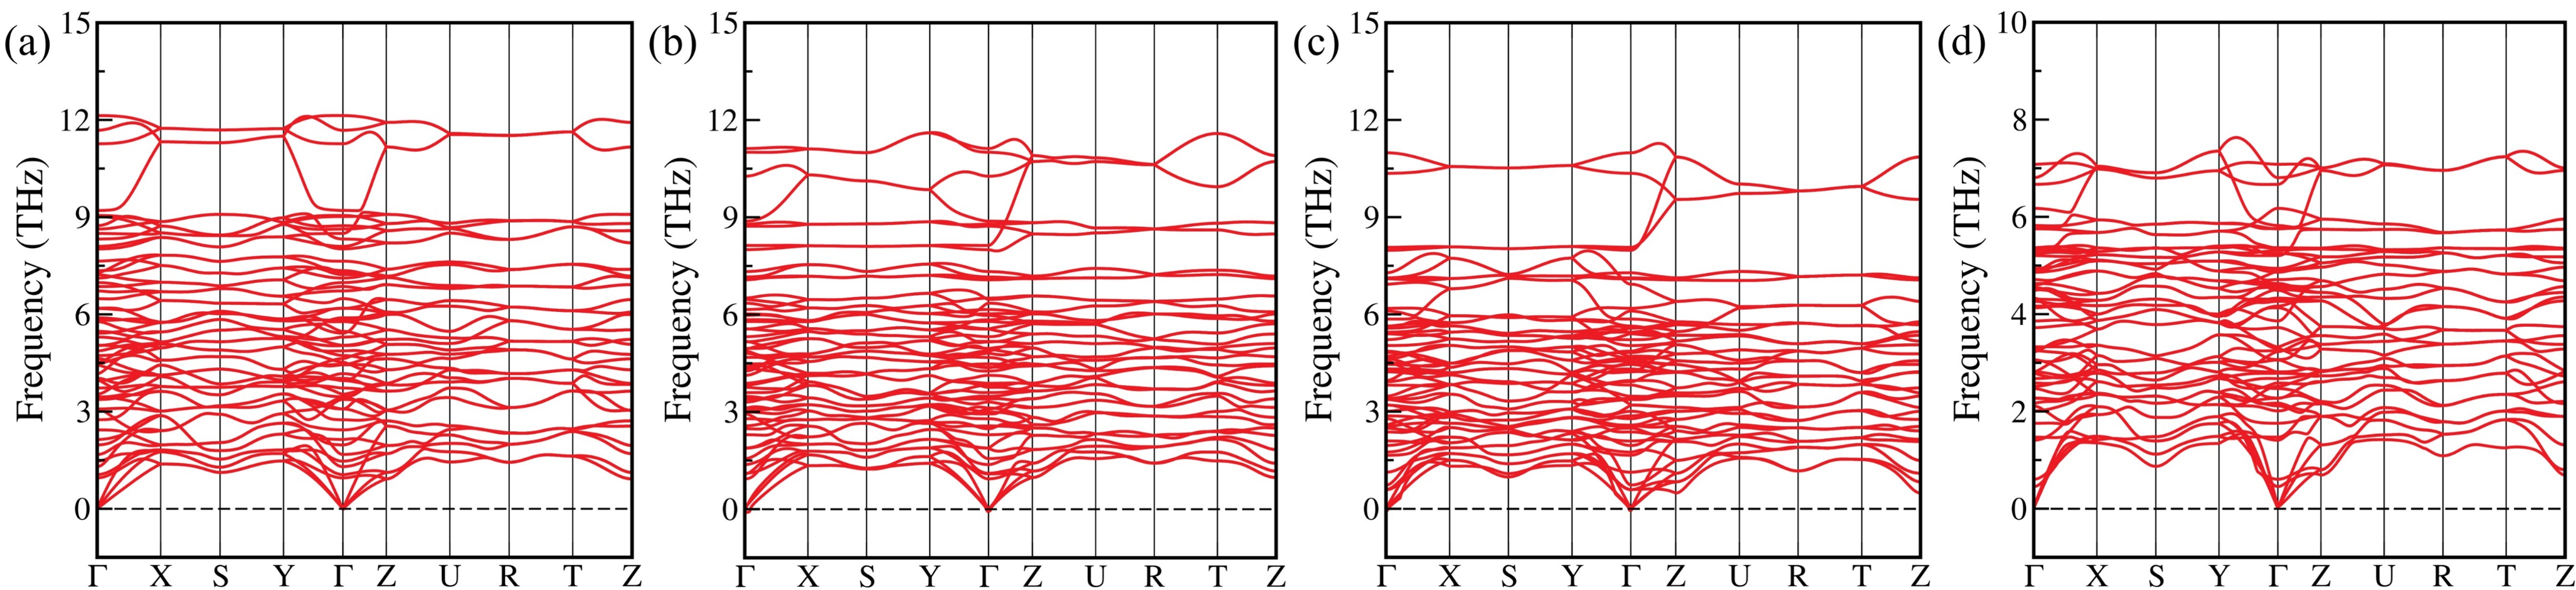
The dynamical stability of the investigated CPs is also evaluated, as it is a critical factor in determining material stability, directly related to the behavior of phonon modes. To assess this, self-consistent phonon calculations are performed using the DFPT method [chapter1-60]. The phonon dispersion curves of CaHfSSe ( = 0, 1, 2, 3), shown in Figure 2(a)-(d), indicate that these compounds are dynamically stable at 0 K. The remaining compounds are found to be unstable at 0 K; however, they may achieve dynamical stability at higher temperatures, as discussed before. For CaHfSSe ( = 0, 1, 2, 3) perovskites, the structural symmetry results in 60 phonon modes corresponding to 20 atoms. Of these, 3 are acoustic, while the remaining 57 are optical, categorized as low- and high-frequency phonons, respectively. Notably, the highest optical frequency decreases significantly with increasing Se () concentration.
III.1.4 Mechanical stability and elastic properties:
To assess the mechanical stability of these CPs, the second-order elastic coefficients () are calculated using the energy-strain approach [chapter1-47] (for details, see the Supplemental Material). Since the CPs examined in this study belong to different crystal symmetry classes, they exhibit varying numbers of independent elastic constants. The calculated values for these compounds are presented in Table S4 of the Supplemental Material, and they satisfy the Born stability criteria [chapter1-47]. This certifies the mechanical stability of these alloyed chalcogenide perovskites. The bulk modulus (), shear modulus (), Young’s modulus (), and Poisson’s ratio () of all these materials are also determined using their respective elastic coefficients [chapter1-49, chapter1-50], and are presented in Table S5 of the Supplemental Material. Our estimated values for are significantly higher than those for in all cases, indicating a stronger resistance to volumetric deformation compared to shape deformation. The lower values reflect the flexibility of the materials. The fragility of the materials is assessed using Pugh’s ratio () and Poisson’s ratio () [chapter1-51]. The computed values of (> 1.75) and (> 0.26) indicate that the investigated CPs exhibit ductile behavior, with the exceptions of CaHfSSe and CaTiSe, which are found to be brittle. These particular mechanical properties make the selected CPs well-suited for use in flexible and durable devices.
III.2 Electronic properties:
After ensuring the stability of these CPs, electronic structure calculations are performed, as this is crucial for designing photoelectric devices. Therefore, the electronic density of states (DOS), as well as band structures and their nature, are evaluated to provide deep insights into the electronic structure.
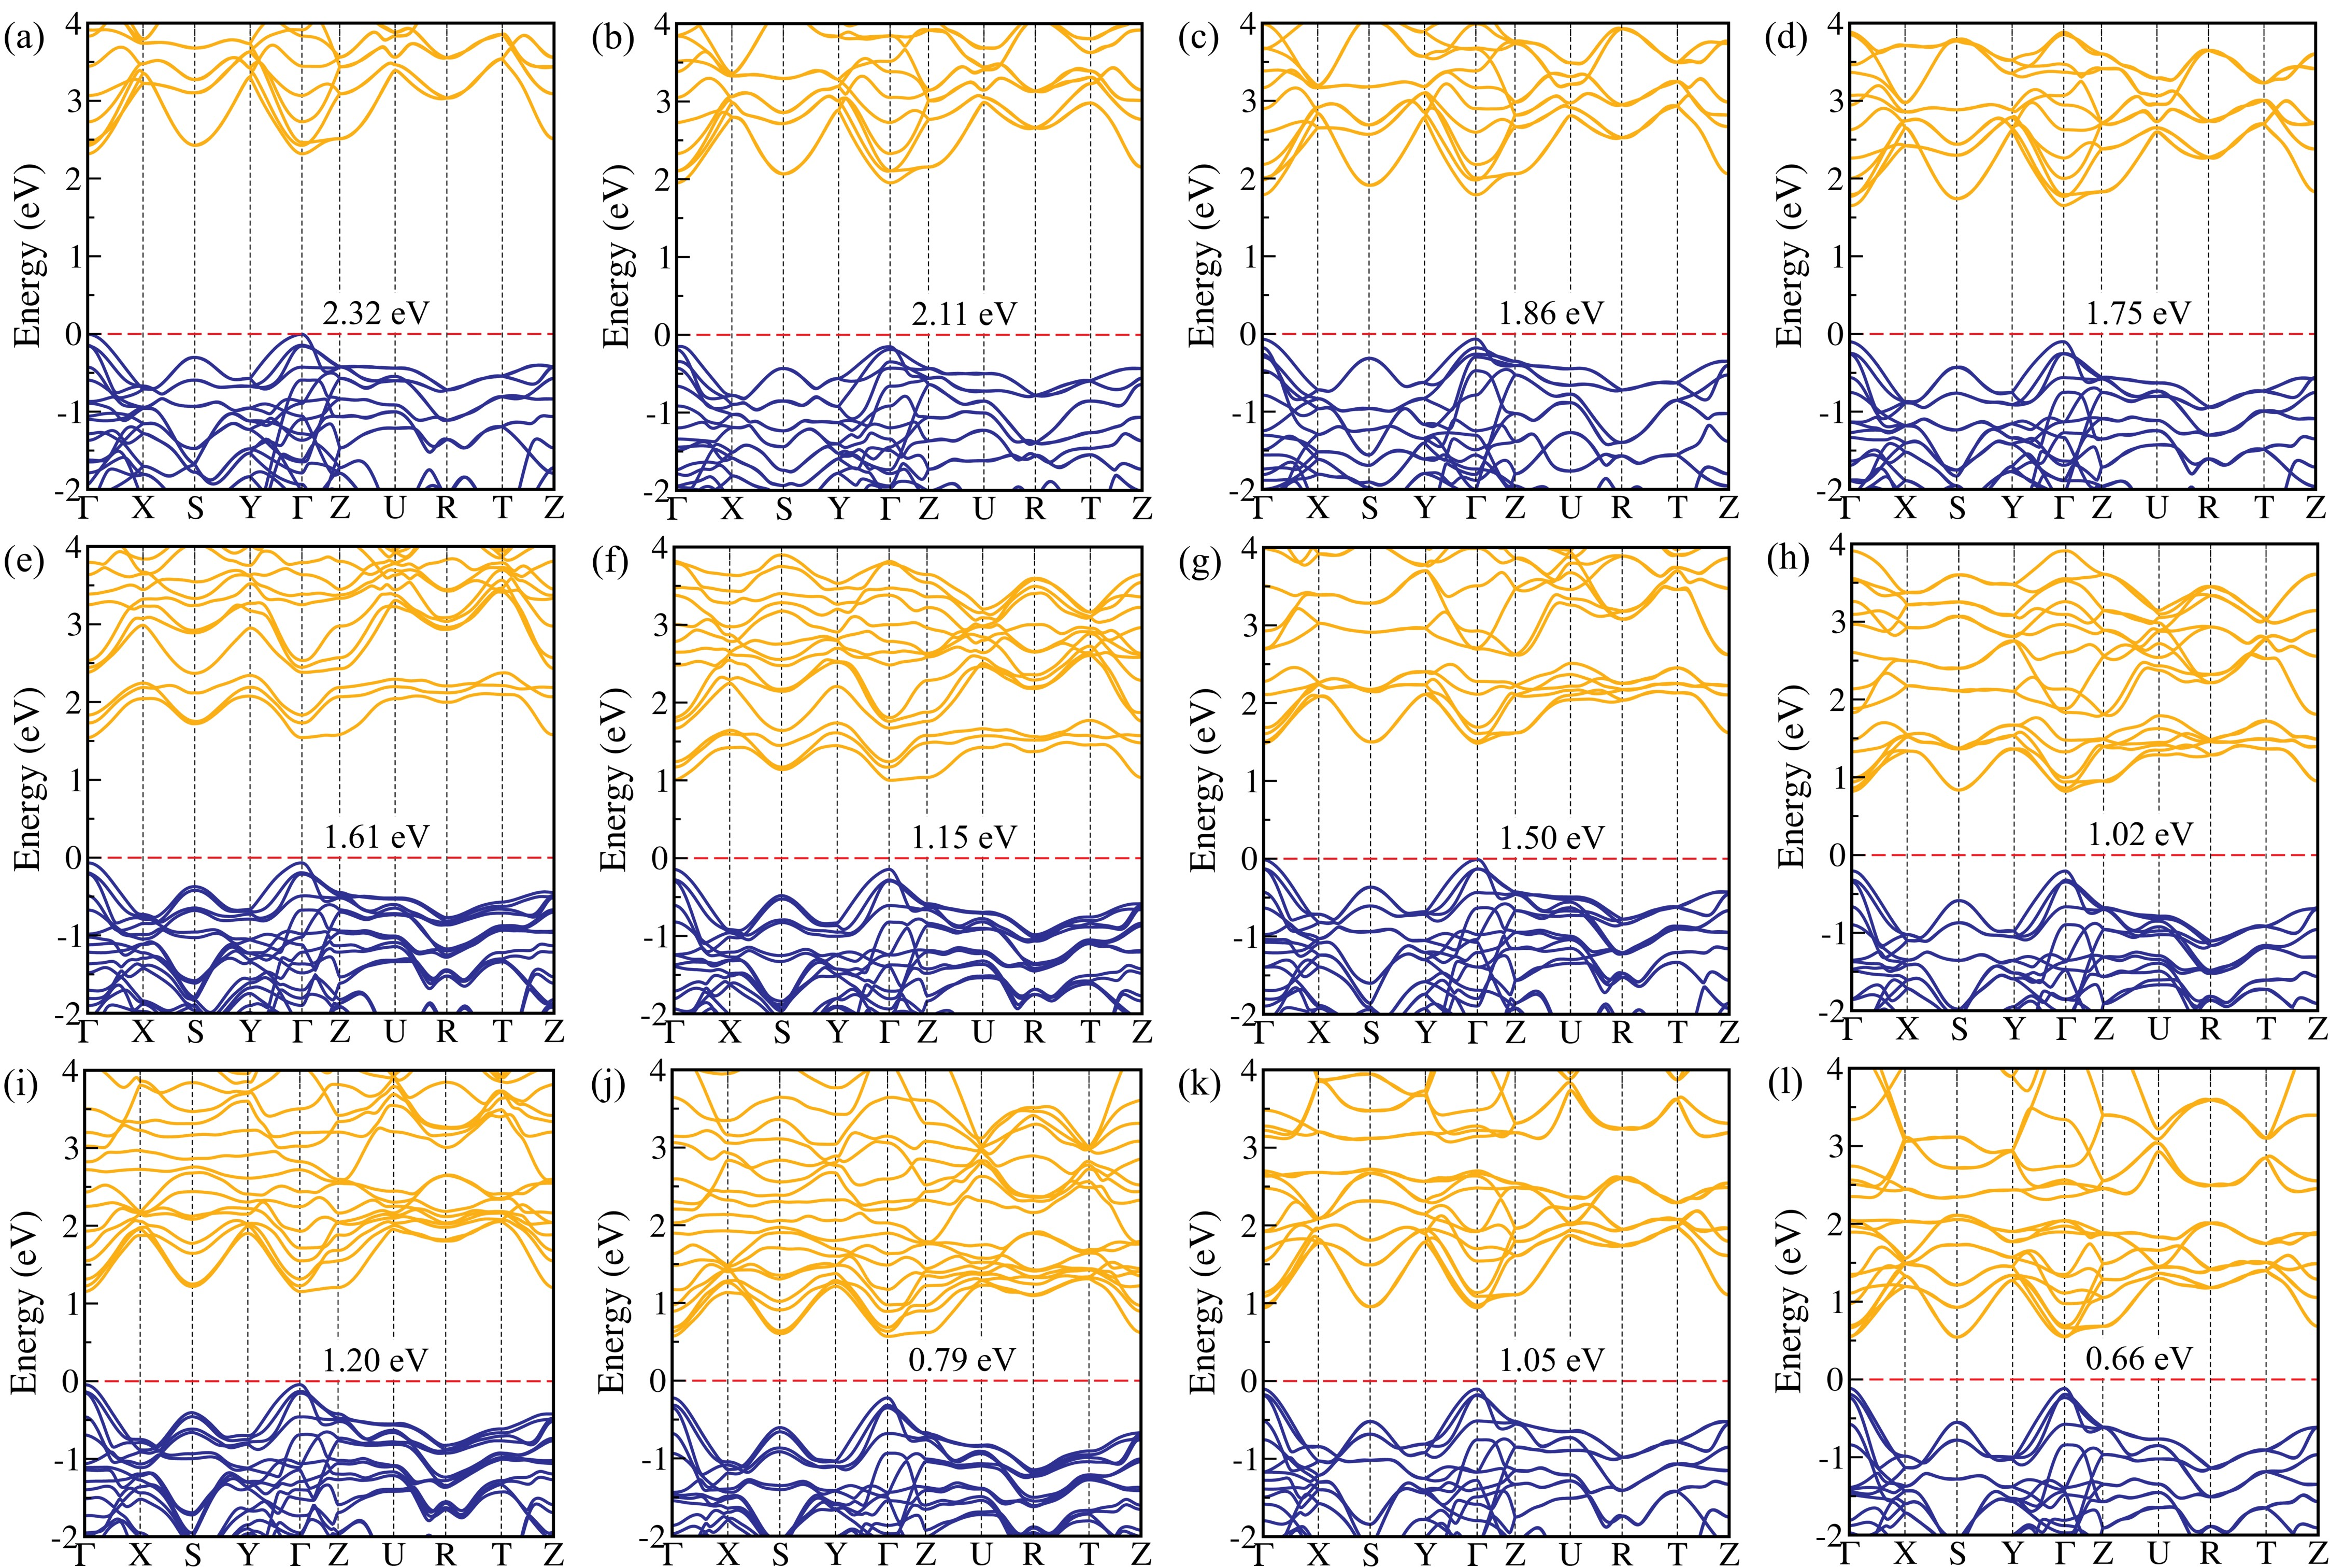
Initially, electronic structure calculations for these alloyed CPs are carried out using the widely adopted semilocal PBE xc functional, both with and without including spin-orbit coupling (SOC) effects. However, it is well-established that PBE underestimates the bandgap of chalcogenide perovskites due to self-interaction error [chapter1-63, chapter3-19, chapter5-16]. Additionally, our results indicate that SOC has a minimal effect on bandgaps (see Table S5 of the Supplemental Material). Therefore, the hybrid HSE06 xc functional, along with the MBPT-based GW@PBE method, has been utilized for precise bandgap estimation of these CPs. The band structures of these compounds, as calculated using HSE06 and GW@PBE, are shown in Figure 3 and Figure S2, respectively. It is observed that all compounds exhibit a direct bandgap, as both the conduction band minimum (CBM) and valence band maximum (VBM) are located at the same -point, specifically at the -point in the Brillouin zone. It is noteworthy that CaTiSe exhibits a slightly indirect bandgap, only 10 meV smaller than the direct bandgap, attributed to the pronounced octahedral tilting of the TiSe units. The bandgaps of these CPs, estimated using different functionals/methods, are presented in Table 2 and show a close agreement with previous theoretical predictions and available experimental data. For example, the GW@PBE bandgap of CaTiS is 1.83 eV, which closely matches its experimental bandgap of 1.59 eV [chapter6-1]. The difference in bandgap values may be due to temperature, as the experimental measurement was taken at 600°C in a vacuum. The direct bandgaps of these CPs, calculated using HSE06 and GW@PBE, fall within the ranges of 0.692.32 eV and 1.292.67 eV, respectively. The bandgaps of these alloyed CPs indicate their suitability for photovoltaic applications, aligning closely with those of conventional lead-based HPs (1.50–3.13 eV) [chapter5-11, chapter5-12, chapter5-13].
| Configurations | PBE | HSE06 | GW@PBE | Previous Work | () | () | () |
|---|---|---|---|---|---|---|---|
| CaHfS | 1.52 | 2.32 | 2.67 | 2.46 [chapter3-19] | 0.431 | 0.380 | 0.202 |
| CaHfSSe | 1.34 | 2.11 | 2.39 | 0.420 | 0.370 | 0.197 | |
| CaHfSSe | 1.15 | 1.86 | 2.09 | 0.361 | 0.309 | 0.166 | |
| CaHfSe | 1.05 | 1.75 | 1.92 | 0.358 | 0.274 | 0.155 | |
| CaHfTiS | 0.80 | 1.61 | 2.48 | 0.552 | 0.347 | 0.213 | |
| CaHfTiSe | 0.43 | 1.15 | 1.89 | 0.444 | 0.243 | 0.157 | |
| CaHfTiS | 0.72 | 1.50 | 2.34 | 0.463 | 0.312 | 0.186 | |
| CaHfTiSe | 0.37 | 1.02 | 1.64 | 0.345 | 0.202 | 0.127 | |
| CaHfTiS | 0.46 | 1.20 | 1.99 | 0.406 | 0.273 | 0.163 | |
| CaHfTiSe | 0.16 | 0.79 | 1.49 | 0.277 | 0.160 | 0.101 | |
| CaTiS | 0.35 | 1.05 | 1.83 | 1.59 [chapter6-1] | 0.264 | 0.224 | 0.121 |
| CaTiSe | 0.07 (0.08) | 0.66 (0.69) | 1.17 (1.29) | 0.162 | 0.103 | 0.063 |
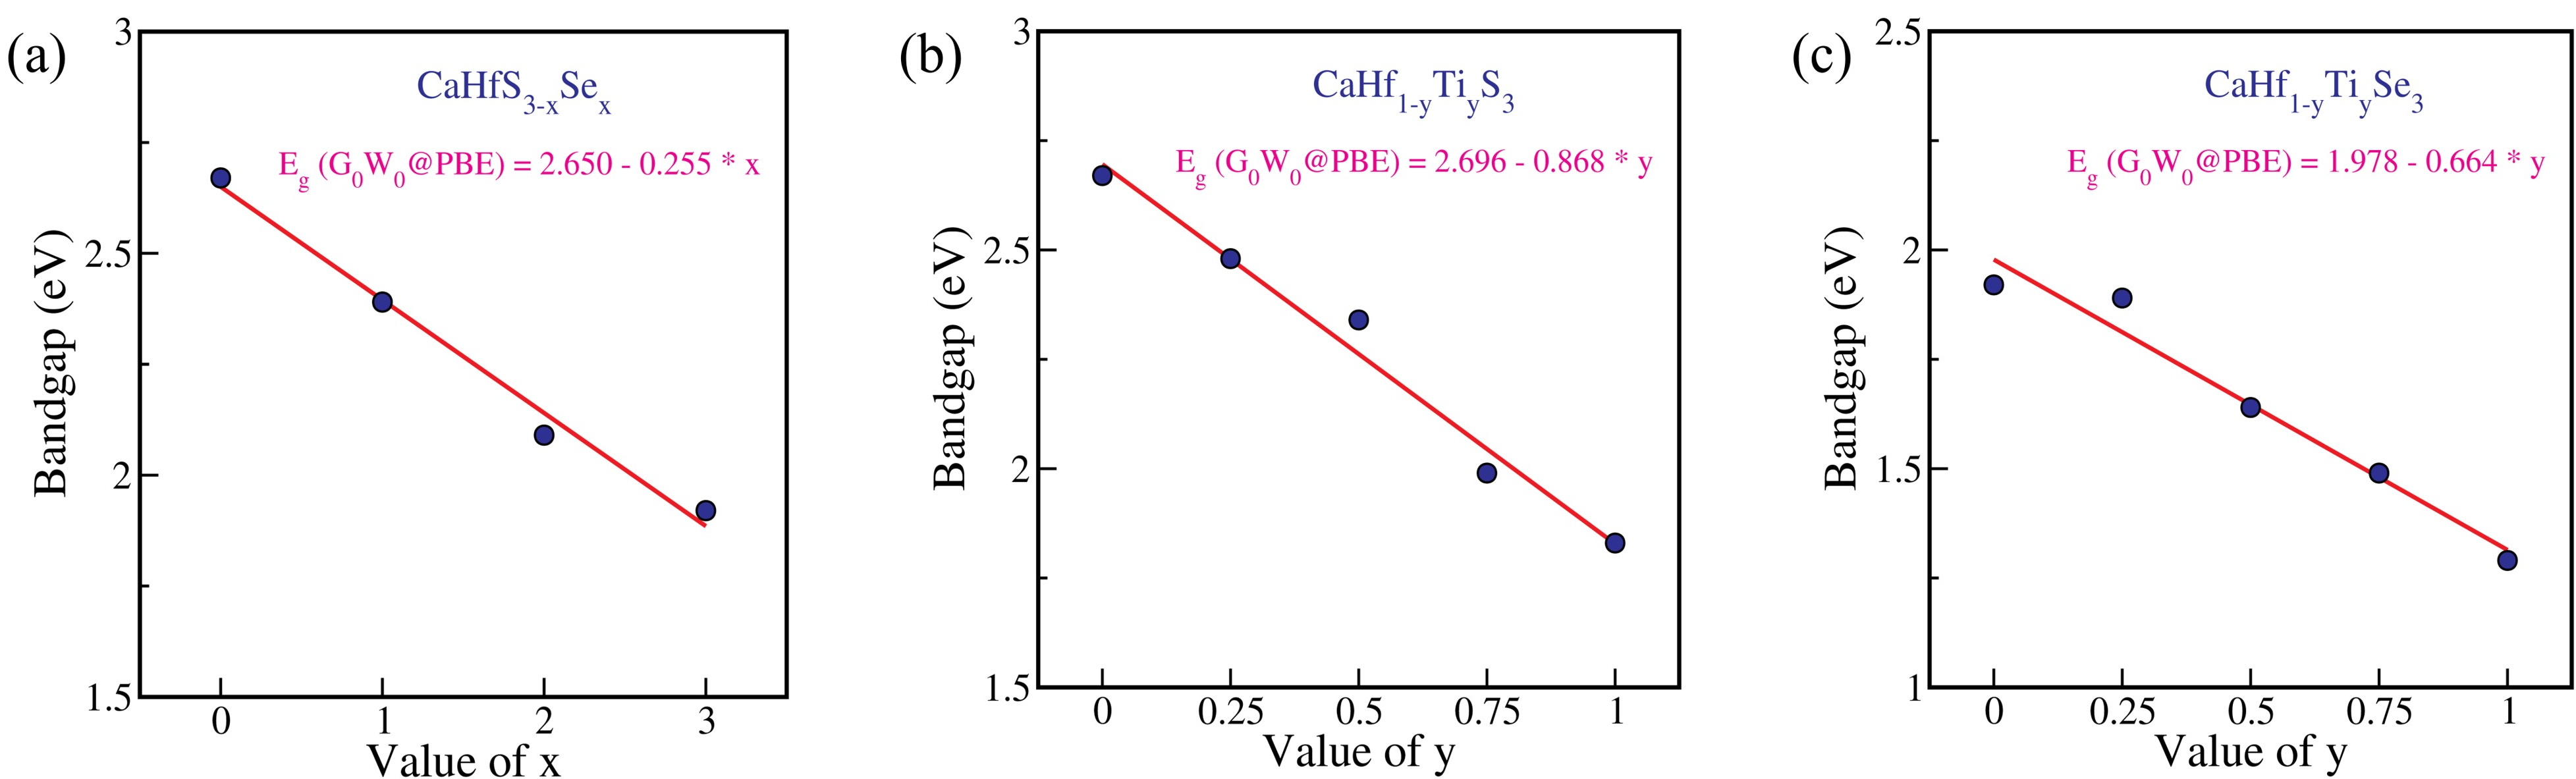
Furthermore, the variation in bandgap for the mixed CaHfSSe ( = 0, 1, 2, 3) and alloyed CaHfTiX ( = 0, 0.25, 0.5, 0.75, 1; X = S, Se) CPs as a function of and is shown in Figure 4 and fitted for GW@PBE method. It is observed that the bandgap of these compounds decreases linearly as the values of (Se) and (Ti) increase, with deviations of 255 meV, 868 meV, and 664 meV for CaHfSSe, CaHfTiS, and CaHfTiSe, respectively. These trends may aid in predicting the bandgap of mixed and alloyed compounds with different and values, which is often encountered during the synthesis of these materials [chapter6-2, chapter6-3].
To provide a more comprehensive analysis of the electronic band structures of these alloyed compounds, both the total (TDOS) and partial (PDOS) density of states have been calculated using the HSE06 xc functional. The results are illustrated in Figure S1 of the Supplemental Material. For CaHfS, the VBM primarily consists of the S-3 orbitals with a small contribution from Hf-5 orbitals, whereas the CBM is predominantly derived from the Hf-5 orbitals with a minor contribution from S-3 orbitals. Similarly, as the Se content increases in CaHfSSe, the contribution of Se-4 orbitals becomes more significant compared to S-3 orbitals. Since the S-3 orbitals are at a lower energy level than the Se-4 orbitals, the higher energy of the Se-4 orbitals reduces the energy difference between the VBM (primarily Se-) and the CBM. This leads to a decrease in bandgap as the Se content increases in CaHfSSe compounds. Conversely, when the Ti content in CaHfTiX (X = S, Se) alloys increases, the contribution of Ti-3 orbitals increases with respect to Hf-5 orbitals. The Ti-3 orbitals are more localized than the Hf-5 orbitals, so alloying with Ti lowers the energy of the CBM and reduces the bandgaps of these alloys.
Further, to gain a deep insight into charge carrier transport, we computed the effective masses of electrons () and holes () for all the investigated compounds by fitting the dispersion curves obtained from GW@PBE band structures. The effective masses of these CPs are determined using the relation, and the corresponding values are presented in Table 2. Note that, effective masses of the charge carriers are estimated along three different directions: ΓX, ΓY, and ΓZ, and then calculate their harmonic mean values using Eq. 2 (for details, see the Supplemental Material). From Table 2, it is evident that and lie in the range of 0.1620.552 and 0.1030.380, respectively. These values suggest high ambipolar carrier mobility, which implies enhanced charge carrier transport in these materials.
III.3 Optical Properties:
To gain a comprehensive understanding of the suitability of a material for optoelectronic applications, an in-depth analysis of its optical properties, including the dielectric function and absorption coefficient, is indispensable. To enhance the reliability of our predictions, we have employed MBPT-based GW-BSE simulations, which explicitly incorporate electron-hole interactions. GW calculations determine the fundamental bandgap, which is considered more accurate and closely aligned with results from experimental photoelectron spectroscopy (PES) and inverse photoelectron spectroscopy (IPES) [chapter1-69, chapter1-70]. On the other hand, BSE calculations predict the optical bandgap, providing results comparable to experimental optical absorption spectroscopy [chapter1-67, chapter1-68]. To obtain the optical response of these CPs, a single-shot GW (GW) calculation is first performed based on the PBE functional. Following this, the Bethe-Salpeter equation (BSE) is solved using the GW@PBE results. The optical response is assessed by calculating the frequency-dependent dielectric function, , expressed as = [Re()] + i[Im()], where [Re()] denotes the real part, and [Im()] represents the imaginary part of the dielectric function.
The real part of the dielectric function, [Re()], represents how a material responds to an electric field through polarization. Higher values of [Re()] indicate stronger polarization, which influences the material’s optical properties, including its refractive index and light absorption. The calculated [Re()] of the investigated CPs obtained using BSE@GW@PBE is depicted in Figure 5(a)-(c). Furthermore, the real part of the dielectric function [Re()], at zero energy, is commonly referred to as the electronic or optical dielectric constant ()—characterizes the dielectric screening effect during electron-hole Coulomb interactions. Our results show that the value of increases with the incorporation of Ti and Se in these CPs. This trend indicates reduced charge carrier recombination rates and improved optoelectronic performance in these materials, as a higher suggests stronger electronic screening and enhanced dielectric response. Notably, for CaTiSe reaches 29.93, the highest among the studied compounds, highlighting its superior potential for optoelectronic applications.
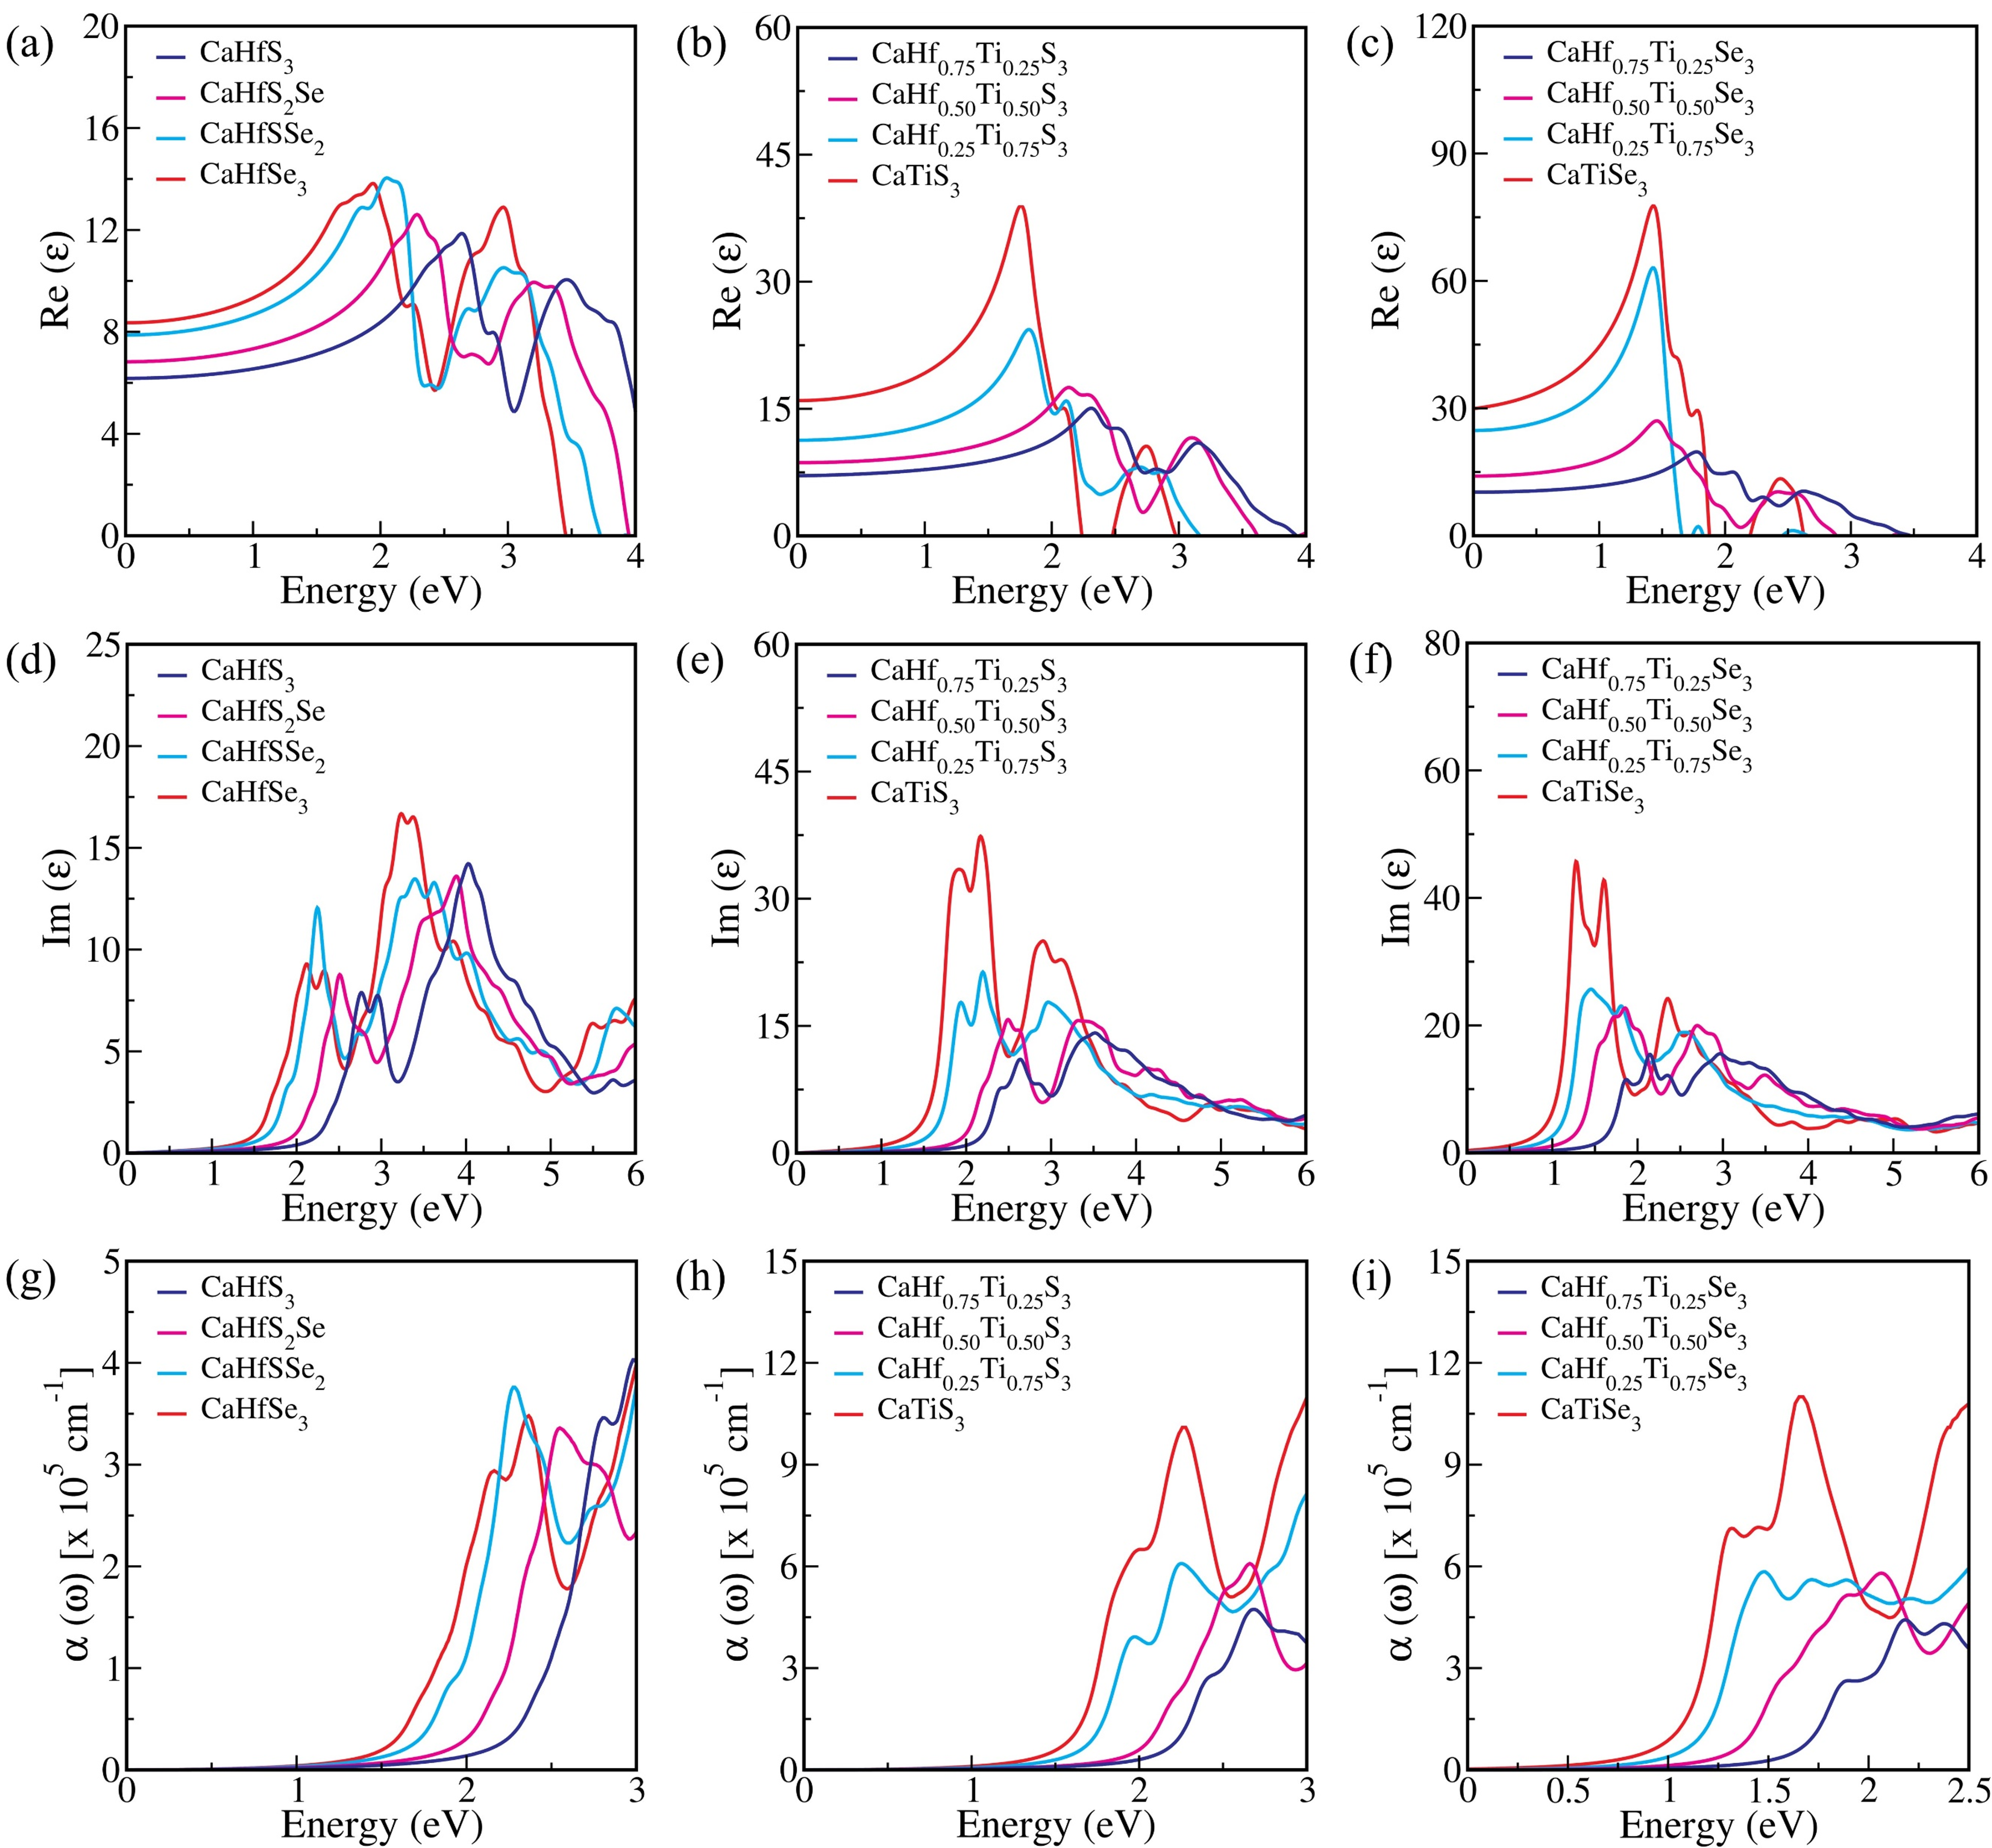
On the other hand, the imaginary part of the dielectric function, [Im()], plays a key role in determining the linear absorption properties of a material. Figure 5(d)-(f) represents the [Im()] of these CPs calculated using BSE@GW@PBE. It has been observed that both the absorption onset and the position of the first peak () of these CPs exhibit a gradual red shift with increasing concentrations of Ti and Se. This shift corresponds to a decrease in the quasiparticle (QP) bandgap, as detailed in Table 2. For example, the value for CaHfS is 2.45 eV, whereas it decreases to 1.27 eV for CaTiSe. It should be emphasized that these CPs exhibit an absorption onset from the near-infrared to the visible region, making them advantageous for solar cell applications.
One of the most crucial parameters for evaluating a material’s suitability for photovoltaic applications is the absorption coefficient. This metric is essential for determining the material’s potential for optimal solar energy conversion efficiency. Consequently, the absorption coefficient [] for each of the examined CPs is calculated using the following formula [chapter1-60],
| (11) |