ActiveSSF: An Active-Learning-Guided Self-Supervised Framework for Long-Tailed Megakaryocyte Classification
Abstract
Precise classification of megakaryocytes is crucial for diagnosing myelodysplastic syndromes. Although self-supervised learning has shown promise in medical image analysis, its application to classifying megakaryocytes in stained slides faces three main challenges: (1) pervasive background noise that obscures cellular details, (2) a long-tailed distribution that limits data for rare subtypes, and (3) complex morphological variations leading to high intra-class variability. To address these issues, we propose the ActiveSSF framework, which integrates active learning with self-supervised pretraining. Specifically, our approach employs Gaussian filtering combined with K-means clustering and HSV analysis (augmented by clinical prior knowledge) for accurate region-of-interest extraction; an adaptive sample selection mechanism that dynamically adjusts similarity thresholds to mitigate class imbalance; and prototype clustering on labeled samples to overcome morphological complexity. Experimental results on clinical megakaryocyte datasets demonstrate that ActiveSSF not only achieves state-of-the-art performance but also significantly improves recognition accuracy for rare subtypes. Moreover, the integration of these advanced techniques further underscores the practical potential of ActiveSSF in clinical settings. To foster further research, the code and datasets will be publicly released in the future.
I INTRODUCTION
Megakaryocytes are essential components of the hematological system, and their accurate classification is crucial for the early diagnosis of myelodysplastic syndrome (MDS) [3, 4]. In recent years, rapid advances in deep learning have dramatically enhanced both the accuracy and efficiency of computer-aided diagnosis in medical imaging [5, 6, 7, 8, 9]. However, automatic classification of megakaryocytes still encounters several challenges, including the underutilization of vast amounts of unlabeled data, limited discriminative features in cell images, and imbalanced class distributions among megakaryocyte subtypes. To address these issues, various deep learning–based methods have been proposed for cell classification—for example, Su et al. [3] leveraged the HSI color space to extract key cellular features and combined them with neural networks for efficient classification.
Despite these advances, effectively utilizing unlabeled data remains a significant hurdle. Recently, self-supervised learning has emerged as a promising approach that enables models to learn robust representations from unlabeled data [10, 11, 12, 13, 14]. For instance, the Masked Autoencoder (MAE) introduced by He et al. [13] reconstructs missing pixels by randomly masking regions in large-scale images, thereby capturing essential structural information. Nevertheless, given the inherently limited discriminative features in megakaryocyte images and the challenge of class imbalance, current self-supervised models continue to face difficulties in this classification task.
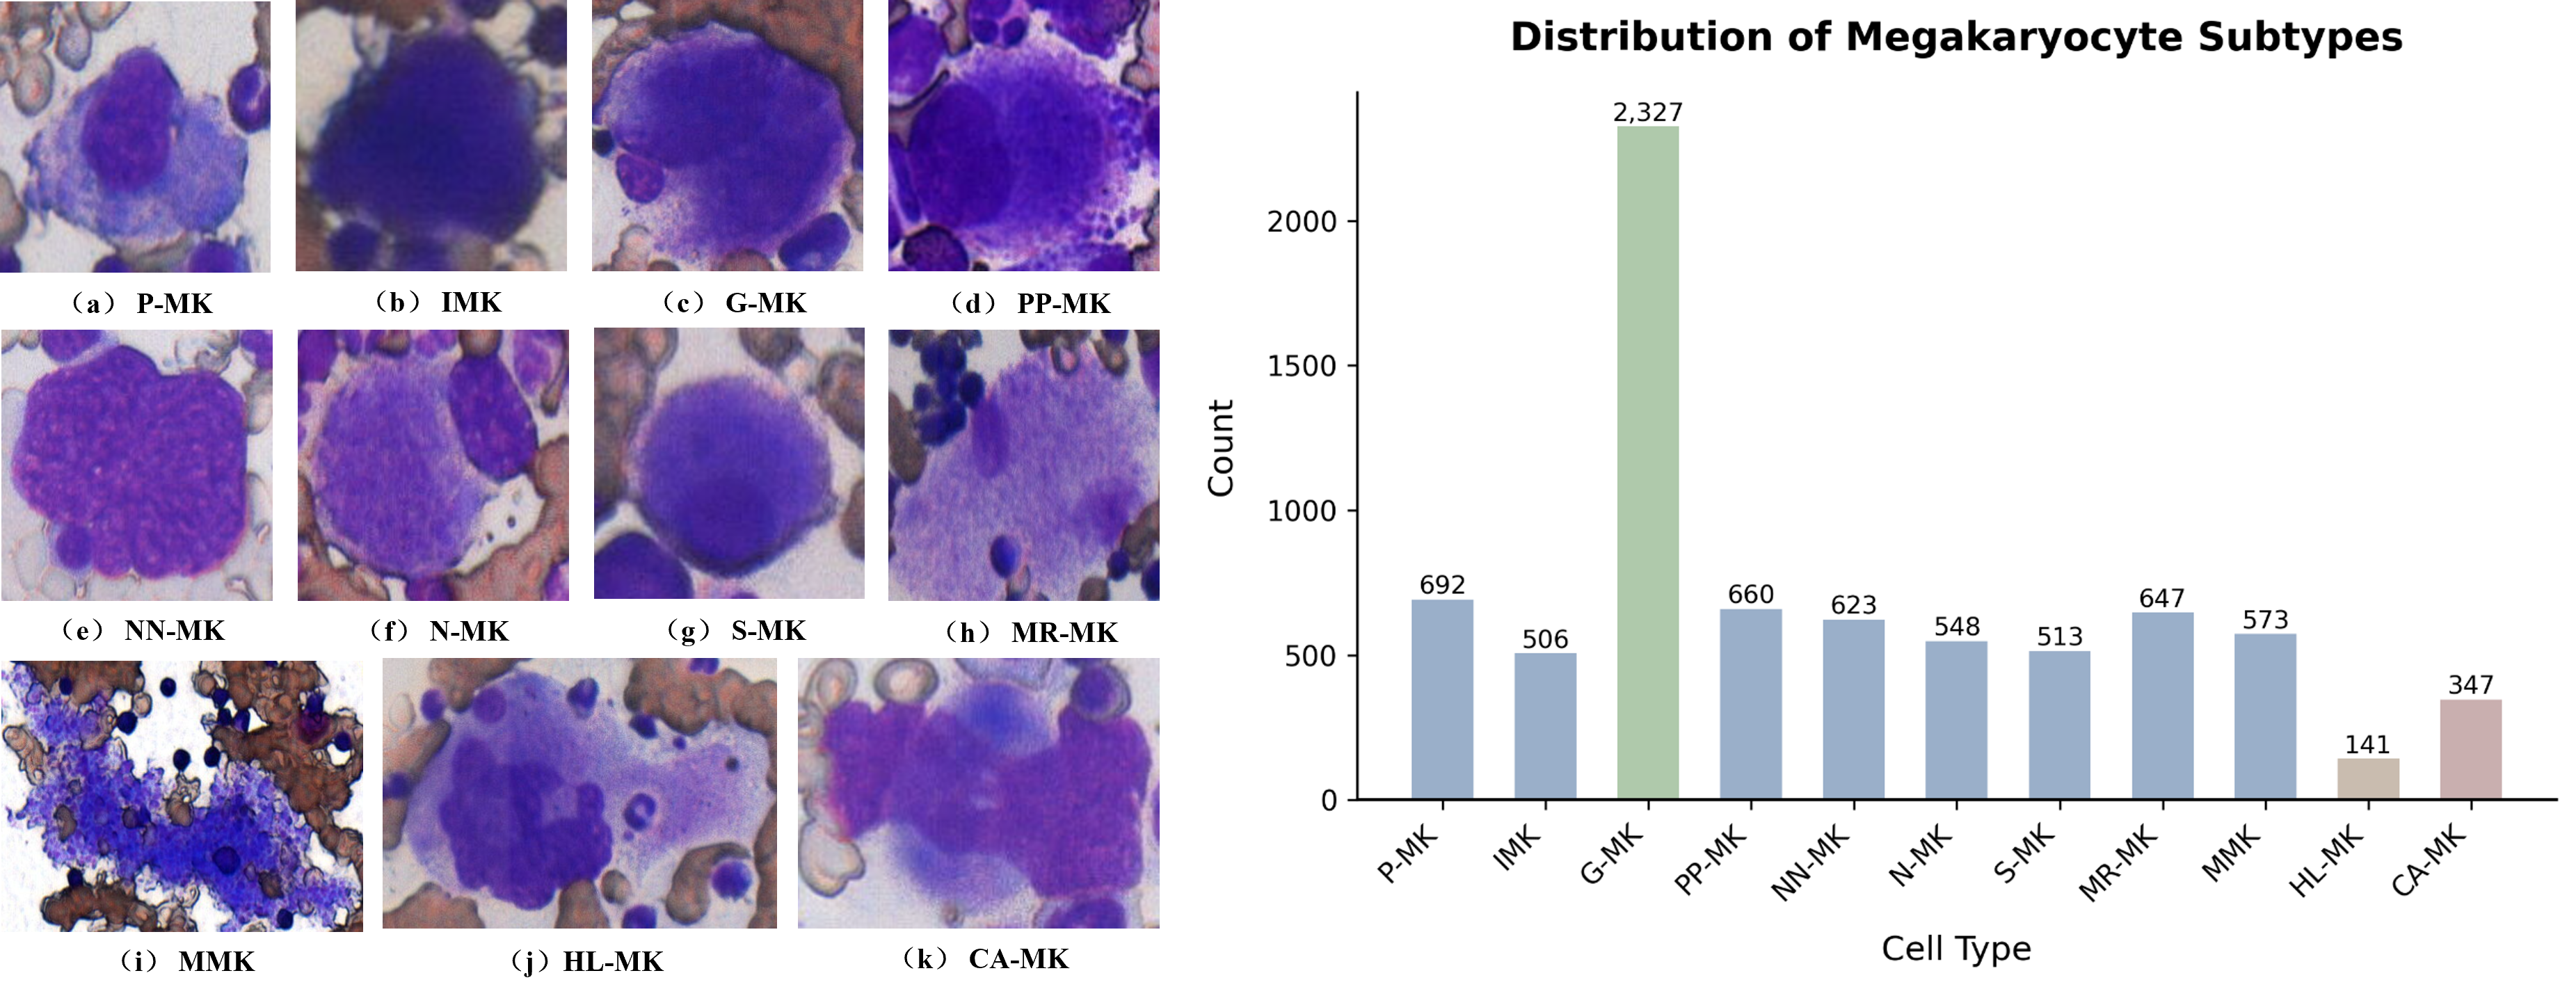
In this study, we introduce a comprehensive dataset encompassing eleven distinct megakaryocyte subtypes (see Fig. 1) to enable a more complete characterization of their morphological variations. To the best of our knowledge, this is the first attempt to apply deep learning techniques for the fine-grained classification of megakaryocyte subtypes. Our analysis reveals that routine bone marrow smear scans not only contain a variety of non-megakaryocyte cell types but also involve extensive background regions, with the dataset exhibiting a pronounced long-tailed distribution where certain subtypes are extremely rare. Motivated by these findings, we propose ActiveSSF—a novel self-supervised learning framework that incorporates active learning strategies during the pretraining phase to enhance model performance.
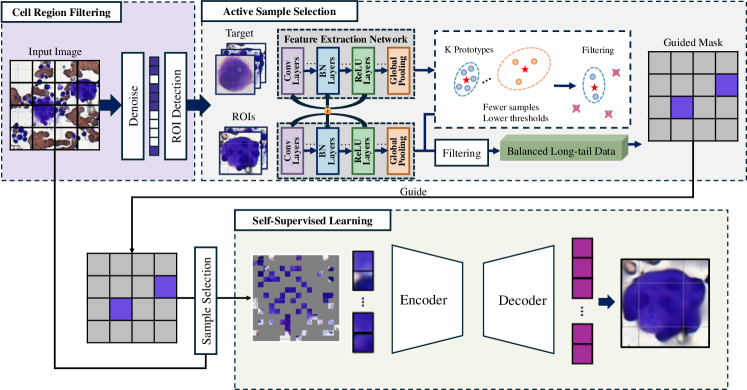
Specifically, to mitigate the issue of extensive background regions in slide images, we first apply Gaussian blur and K-means clustering [2] to reduce noise, followed by focusing on high-energy density regions in the HSV color space to extract key cellular information—a process we term Cell Region Filtering. Furthermore, recognizing the complex morphological variations exhibited by megakaryocytes—where intra-class differences often surpass inter-class differences—we begin by clustering the labeled samples to generate representative prototypes for each subtype. These prototypes are subsequently compared with unlabeled samples to accurately isolate megakaryocytes while filtering out irrelevant ones. To effectively tackle the long-tailed distribution, we dynamically adjust similarity thresholds, applying higher thresholds for common subtypes and lower thresholds for rare subtypes—a process we refer to as Active Sample Selection.
Collectively, these active learning techniques guide the pretraining data selection process, significantly enhancing the utilization of unlabeled data and the recognition of rare samples. Experimental results demonstrate that our proposed method substantially improves classification accuracy—particularly for rare megakaryocyte subtypes—thereby underscoring its potential for clinical applications in MDS diagnosis.
II Methods
II-A Overview of the Method
As illustrated in Fig. 2, our framework comprises two key stages: cell region filtering and active sample selection. In the cell region filtering stage, we first apply a combination of Gaussian blur and K-means clustering [2] to suppress background noise, and then utilize HSV color space analysis along with clinical prior knowledge to accurately extract the regions corresponding to target cells. In the active sample selection stage, we extract features from labeled samples using a ResNet [1] backbone network, and perform clustering to generate representative prototypes. Notably, we propose a dynamic similarity threshold adjustment mechanism—where the threshold is modulated based on the size of each cluster—to guide the selection of samples from the unlabeled target domain. This adaptive strategy prioritizes samples from rare classes, thereby effectively mitigating the long-tailed distribution issue during self-supervised pretraining.
II-B Cell Region filtering based on clinical priors
II-B1 Noise Suppression
Megakaryocyte images often contain complex background noise and non-uniform illumination, which significantly impact classification accuracy. To address this challenge, we propose a preprocessing method based on Gaussian filtering and clustering. For each image in the dataset , the processing pipeline proceeds as follows:
First, to mitigate variations in illumination, we normalize the image using standard normalization techniques. Subsequently, we apply a Gaussian kernel with for spatial filtering, as described by:
| (1) |
This filtering operation effectively suppresses high-frequency noise, generating a smoothed intermediate image . To further separate cellular regions from the background, we design a two-stage K-means clustering strategy [2]. In the first stage, the algorithm partitions the image into 20 color clusters to capture the primary color distribution patterns; in the second stage, adaptive cluster merging refines the number of clusters to 10. The cluster centers are updated as follows:
| (2) |
where represents the RGB values of a pixel, and denotes the set of pixels in cluster . The optimization objective is to minimize the squared Euclidean distance between pixels and their corresponding cluster centers:
| (3) |
This iterative optimization continues until convergence, ultimately yielding the denoised image . Our hierarchical processing strategy not only effectively suppresses background interference but also preserves key morphological features of megakaryocytes, thereby laying a solid foundation for subsequent classification tasks. Nevertheless, while noise suppression greatly improves image quality, accurately identifying megakaryocyte regions in these preprocessed images remains challenging due to their complex morphological characteristics. To address this, we further propose a specialized detection method leveraging the HSV color space.
II-B2 Cell Region Detection in HSV Color Space
Accurate identification of megakaryocyte regions is crucial for subsequent classification tasks. However, the RGB color space often fails to effectively distinguish cells from the background. To address this limitation, we propose a region extraction method that combines HSV color space analysis with morphological feature filtering.
First, we transform the preprocessed image into the HSV color space to better capture the chromatic properties of the cells. Based on clinical expertise, we establish two specific HSV threshold ranges: one for a purple mask (H: 30–140, S: 100–255, V: 0–255) and another for a deep blue mask (e.g., H: 95–105, S: 150–255, V: 50–255) to capture the characteristic staining patterns of megakaryocytes. These thresholds were carefully determined through empirical validation with clinical experts. By performing a pixel-wise logical OR operation on these two masks, we obtain a composite mask that effectively highlights potential cellular regions while minimizing false positives from background artifacts.
To further enhance detection precision, we introduce a morphological feature-based filtering mechanism. For each detected region, we compute its bounding box and apply two key constraints: the bounding box must be at least pixels in size, and the region must have a fill rate of at least 70% (i.e., at least 70% of the pixels within the bounding box belong to the candidate region). This dual-constraint approach effectively filters out background noise and non-target regions. Consequently, for image , we obtain high-quality candidate regions denoted as .
With reliable cell regions identified, the next crucial step is to develop an effective strategy for selecting representative samples, particularly for rare subtypes, to guide the self-supervised learning process.
II-C Active Sample Selection
II-C1 Clustering on the Labeled Samples
Effective prototype generation from labeled samples is crucial for guiding unlabeled data selection in self-supervised learning. However, directly applying clustering on raw features may lead to suboptimal prototypes due to the complex nature of megakaryocyte morphology. To address this challenge, we propose a feature-based clustering strategy that leverages deep neural networks and iterative optimization.
Specifically, we first employ the ResNet50 [1] backbone network to extract high-dimensional features from the labeled dataset . These features capture essential morphological characteristics of megakaryocytes. We then apply K-means clustering [2] with the number of clusters set to 11 to generate representative prototypes through iterative optimization. The objective function is defined as:
| (4) |
where represents the center of cluster , and denotes the feature vector of a sample. The algorithm updates cluster assignments based on:
| (5) |
and refines cluster centers through:
| (6) |
This iterative process continues until convergence, yielding a set of robust prototypes that effectively characterize the different megakaryocyte subtypes. These prototypes serve as reliable references for subsequent sample selection, particularly benefiting the identification of rare subtypes in the unlabeled data pool. Building upon these robust prototypes, we further introduce an adaptive sample selection strategy to address the challenge of long-tailed distribution in megakaryocyte datasets.
II-C2 Sample Selection
A critical challenge in megakaryocyte classification is the long-tailed distribution of cell subtypes, where rare subtypes often receive insufficient attention during training. To address this issue, we propose an adaptive sample selection strategy that dynamically adjusts the selection criteria based on class distribution.
For each candidate region obtained from the previous cell detection stage, we first extract deep features using the ResNet [1] backbone network. The representativeness of each sample is then evaluated by computing its Euclidean distance to the nearest cluster prototype:
where denotes the extracted feature vector and corresponds to its closest cluster center.
To balance the selection between common and rare subtypes, we introduce a density-aware threshold mechanism:
where LB and UB are the minimum and maximum distances within each cluster, is the number of samples in cluster , is the size of the largest cluster, and is a scaling factor that controls the adjustment rate. This adaptive mechanism automatically lowers the threshold for rare subtypes () while maintaining stricter criteria for common subtypes ().
The final sample selection is performed as follows:
where denotes the set of selected samples for cluster . By integrating deep features with adaptive thresholds, this strategy effectively prioritizes the inclusion of underrepresented subtypes while ensuring quality control for common ones, thereby addressing the inherent class imbalance in megakaryocyte datasets.
Moreover, as outlined in Algorithm 1, our ActiveSSF framework seamlessly integrates cell region filtering, prototype generation, and adaptive sample selection into a unified pipeline, providing a systematic approach to leverage unlabeled data while mitigating the challenges posed by the long-tailed distribution in megakaryocyte classification.
III Experiment and Results
III-A Datasets
In this study, we assembled a comprehensive clinical dataset comprising stained blood cell slides specifically curated for megakaryocyte classification. The dataset includes 11 distinct subtypes of megakaryocytes: Primitive megakaryocyte (P-MK), Immature megakaryocyte (IMK), Megakaryocyte with cytoplasmic abnormalities (CA-MK), Granular megakaryocyte (G-MK), Platelet-producing megakaryocyte (PP-MK), Naked nucleus megakaryocyte (NN-MK), Normal-sized megakaryocyte with unlobed or minimally lobed nucleus (N-MK), Small megakaryocyte with unlobed or minimally lobed nucleus (S-MK), Micromegakaryocyte (mMK), Multinucleated round megakaryocyte (MR-MK), and Large megakaryocyte with highly lobulated nucleus (HL-MK).
| Method | Accuracy (%) | PR-AUC (%) | F1-score (%) |
| ResNet [1] | 76.15 ± 1.18 | 77.78 ± 1.77 | 71.97 ± 1.45 |
| ViT [15] | 68.45 ± 1.63 | 67.78 ± 1.68 | 60.03 ± 2.36 |
| MoCo v3 [10] w/o ActiveSSF | 72.98 ± 0.68 | 73.31 ± 1.94 | 67.29 ± 1.71 |
| MoCo v3 w/ ActiveSSF | 73.91 ± 1.13∗ | 74.99 ± 1.73∗ | 68.42 ± 1.50∗ |
| ConvMAE [11] w/o ActiveSSF | 76.66 ± 0.59 | 79.72 ± 1.64 | 73.37 ± 1.36 |
| ConvMAE w/ ActiveSSF | 81.10 ± 0.92∗ | 84.37 ± 1.71∗ | 78.85 ± 1.28∗ |
| MIXMIM [12] w/o ActiveSSF | 72.52 ± 2.66 | 65.93 ± 4.48 | 72.80 ± 4.41 |
| MIXMIM w/ ActiveSSF | 74.83 ± 0.67∗ | 70.51 ± 0.68∗ | 77.39 ± 1.34∗ |
| MAE [13] w/o ActiveSSF | 78.76 ± 1.06 | 82.27 ± 1.35 | 76.34 ± 1.31 |
| MAE w/ ActiveSSF | 80.36 ± 1.03∗ | 84.05 ± 1.37∗ | 77.64 ± 1.47∗ |
| Methods | P-MK | IMK | CA-MK† | G-MK∗ | PP-MK | NN-MK | N-MK | S-MK | MMK | MR-MK | HL-MK† |
| ResNet [1] | 98.02 ± 1.12 | 69.21 ± 4.84 | 64.76 ± 8.01 | 83.34 ± 1.64 | 68.52 ± 3.66 | 95.64 ± 1.94 | 64.92 ± 1.31 | 61.73 ± 5.86 | 95.74 ± 1.22 | 88.52 ± 4.82 | 65.18 ± 6.91 |
| ViT [15] | 98.15 ± 0.94 | 62.95 ± 8.89 | 52.91 ± 11.12 | 72.81 ± 2.48 | 58.42 ± 3.37 | 93.57 ± 0.93 | 51.54 ± 5.50 | 48.66 ± 6.58 | 92.24 ± 3.10 | 70.45 ± 2.64 | 43.85 ± 16.73 |
| \hdashlineMoCo v3 [10] w/o ActiveSSF | 97.51 ± 1.23 | 68.71 ± 5.16 | 57.62 ± 7.55 | 78.79 ± 2.19 | 65.31 ± 2.03 | 95.20 ± 0.57 | 55.57 ± 4.74 | 52.43 ± 8.55 | 94.14 ± 1.77 | 81.36 ± 4.32 | 59.75 ± 13.04 |
| MoCo v3 w/ ActiveSSF | 97.64 ± 1.38 | 71.85 ± 5.82 | 60.92 ± 6.82 | 79.70 ± 1.91 | 65.45 ± 3.37 | 96.17 ± 0.27 | 57.34 ± 4.59 | 57.62 ± 6.49 | 94.61 ± 1.80 | 85.45 ± 4.64 | 58.11 ± 10.00 |
| \hdashlineConvMAE [11] w/o ActiveSSF | 98.49 ± 1.09 | 74.33 ± 5.77 | 68.09 ± 7.63 | 83.98 ± 0.69 | 70.76 ± 2.78 | 96.99 ± 0.87 | 62.22 ± 4.15 | 64.06 ± 10.90 | 95.75 ± 2.59 | 90.05 ± 2.78 | 72.24 ± 11.33 |
| ConvMAE w/ ActiveSSF | 98.73 ± 0.98 | 79.04 ± 4.79 | 73.67 ± 6.35 | 87.84 ± 0.88 | 75.52 ± 3.71 | 97.12 ± 0.51 | 73.54 ± 5.47 | 70.76 ± 8.21 | 96.72 ± 2.02 | 94.03 ± 1.50 | 81.12 ± 7.26 |
| \hdashlineMIXMIM [12] w/o ActiveSSF | 98.13 ± 1.09 | 68.13 ± 8.03 | 58.11 ± 4.26 | 79.69 ± 3.51 | 62.89 ± 7.04 | 95.08 ± 1.60 | 53.77 ± 8.98 | 56.03 ± 8.54 | 94.84 ± 1.52 | 79.32 ± 4.67 | 54.80 ± 19.83 |
| MIXMIM w/ ActiveSSF | 98.28 ± 0.87 | 71.21 ± 2.76 | 63.17 ± 7.50 | 82.77 ± 1.62 | 67.79 ± 3.49 | 96.47 ± 0.98 | 58.26 ± 5.23 | 61.18 ± 10.81 | 96.41 ± 1.71 | 85.17 ± 2.44 | 70.54 ± 1.93 |
| \hdashlineMAE [13] w/o ActiveSSF | 98.53 ± 1.05 | 75.13 ± 5.13 | 70.54 ± 8.09 | 86.05 ± 0.59 | 74.25 ± 3.04 | 96.60 ± 0.72 | 67.66 ± 3.45 | 69.23 ± 7.68 | 97.00 ± 1.57 | 92.74 ± 2.77 | 77.20 ± 5.45 |
| MAE w/ ActiveSSF | 98.63 ± 1.16 | 75.51 ± 6.56 | 74.20 ± 5.70 | 88.04 ± 0.71 | 76.51 ± 3.50 | 97.26 ± 0.74 | 73.17 ± 4.54 | 70.75 ± 8.23 | 97.68 ± 1.37 | 94.03 ± 1.67 | 78.79 ± 6.46 |
As shown in Fig. 1, our dataset exhibits a pronounced long-tailed distribution, with the G-MK subtype being dominant while CA-MK and HL-MK are notably underrepresented. In total, the dataset comprises 7,577 labeled images and 10,000 unlabeled blood cell slides, all acquired using professional medical scanning equipment. All cell annotations have been rigorously validated by experienced clinical experts to ensure high data quality. For experimental evaluation, we employed a five-fold cross-validation strategy to assess our method.
III-B Implementation Details
The proposed method was implemented using the PyTorch framework and evaluated on NVIDIA RTX 3090 GPUs. For the cell region filtering stage, we processed 10,000 unlabeled megakaryocyte images utilizing a Gaussian kernel with , which resulted in 7,299 filtered samples.
For model training, we employed the AdamW optimizer (with a weight decay of 0.05) and a batch size of 64. The learning rate was set to , with a warmup phase lasting 5 epochs. The model was first pre-trained for 400 epochs, followed by 50 epochs of fine-tuning. During both the pre-training and fine-tuning stages, a layer-wise learning rate decay of 0.75 was maintained.
We evaluated our approach using various backbone networks including ResNet [1], ViT [15], and SOTA self-supervised models [10, 11, 13]. The dynamic threshold used in sample selection was set to with a temperature parameter of 1. To ensure a fair comparison, all models were fine-tuned on the same 11-class classification task with a uniform input size of . All experiments were conducted using five-fold cross-validation, and statistical significance was assessed using paired t-tests (all p-values ).
(a)
(b)
(c)
III-C Results
Comparison with State-of-the-Art. We comprehensively evaluated our ActiveSSF framework against state-of-the-art methods in megakaryocyte classification. The baseline methods include traditional architectures (ResNet [1], ViT [15]) and recent self-supervised learning approaches (MAE [13], ConvMAE [11], MoCo v3 [10], and MIXMIM [12]).
As shown in Table I, ActiveSSF consistently improves performance across various self-supervised models. Notably, when integrated with ConvMAE, our framework achieves the best overall performance.
Furthermore, as detailed in Table II, we evaluated ActiveSSF against several SOTA self-supervised learning methods across the 11 megakaryocyte subtypes. The results demonstrate that ActiveSSF consistently outperforms existing approaches across different backbone networks. Of particular note, our method yields significant improvements in classifying rare subtypes.
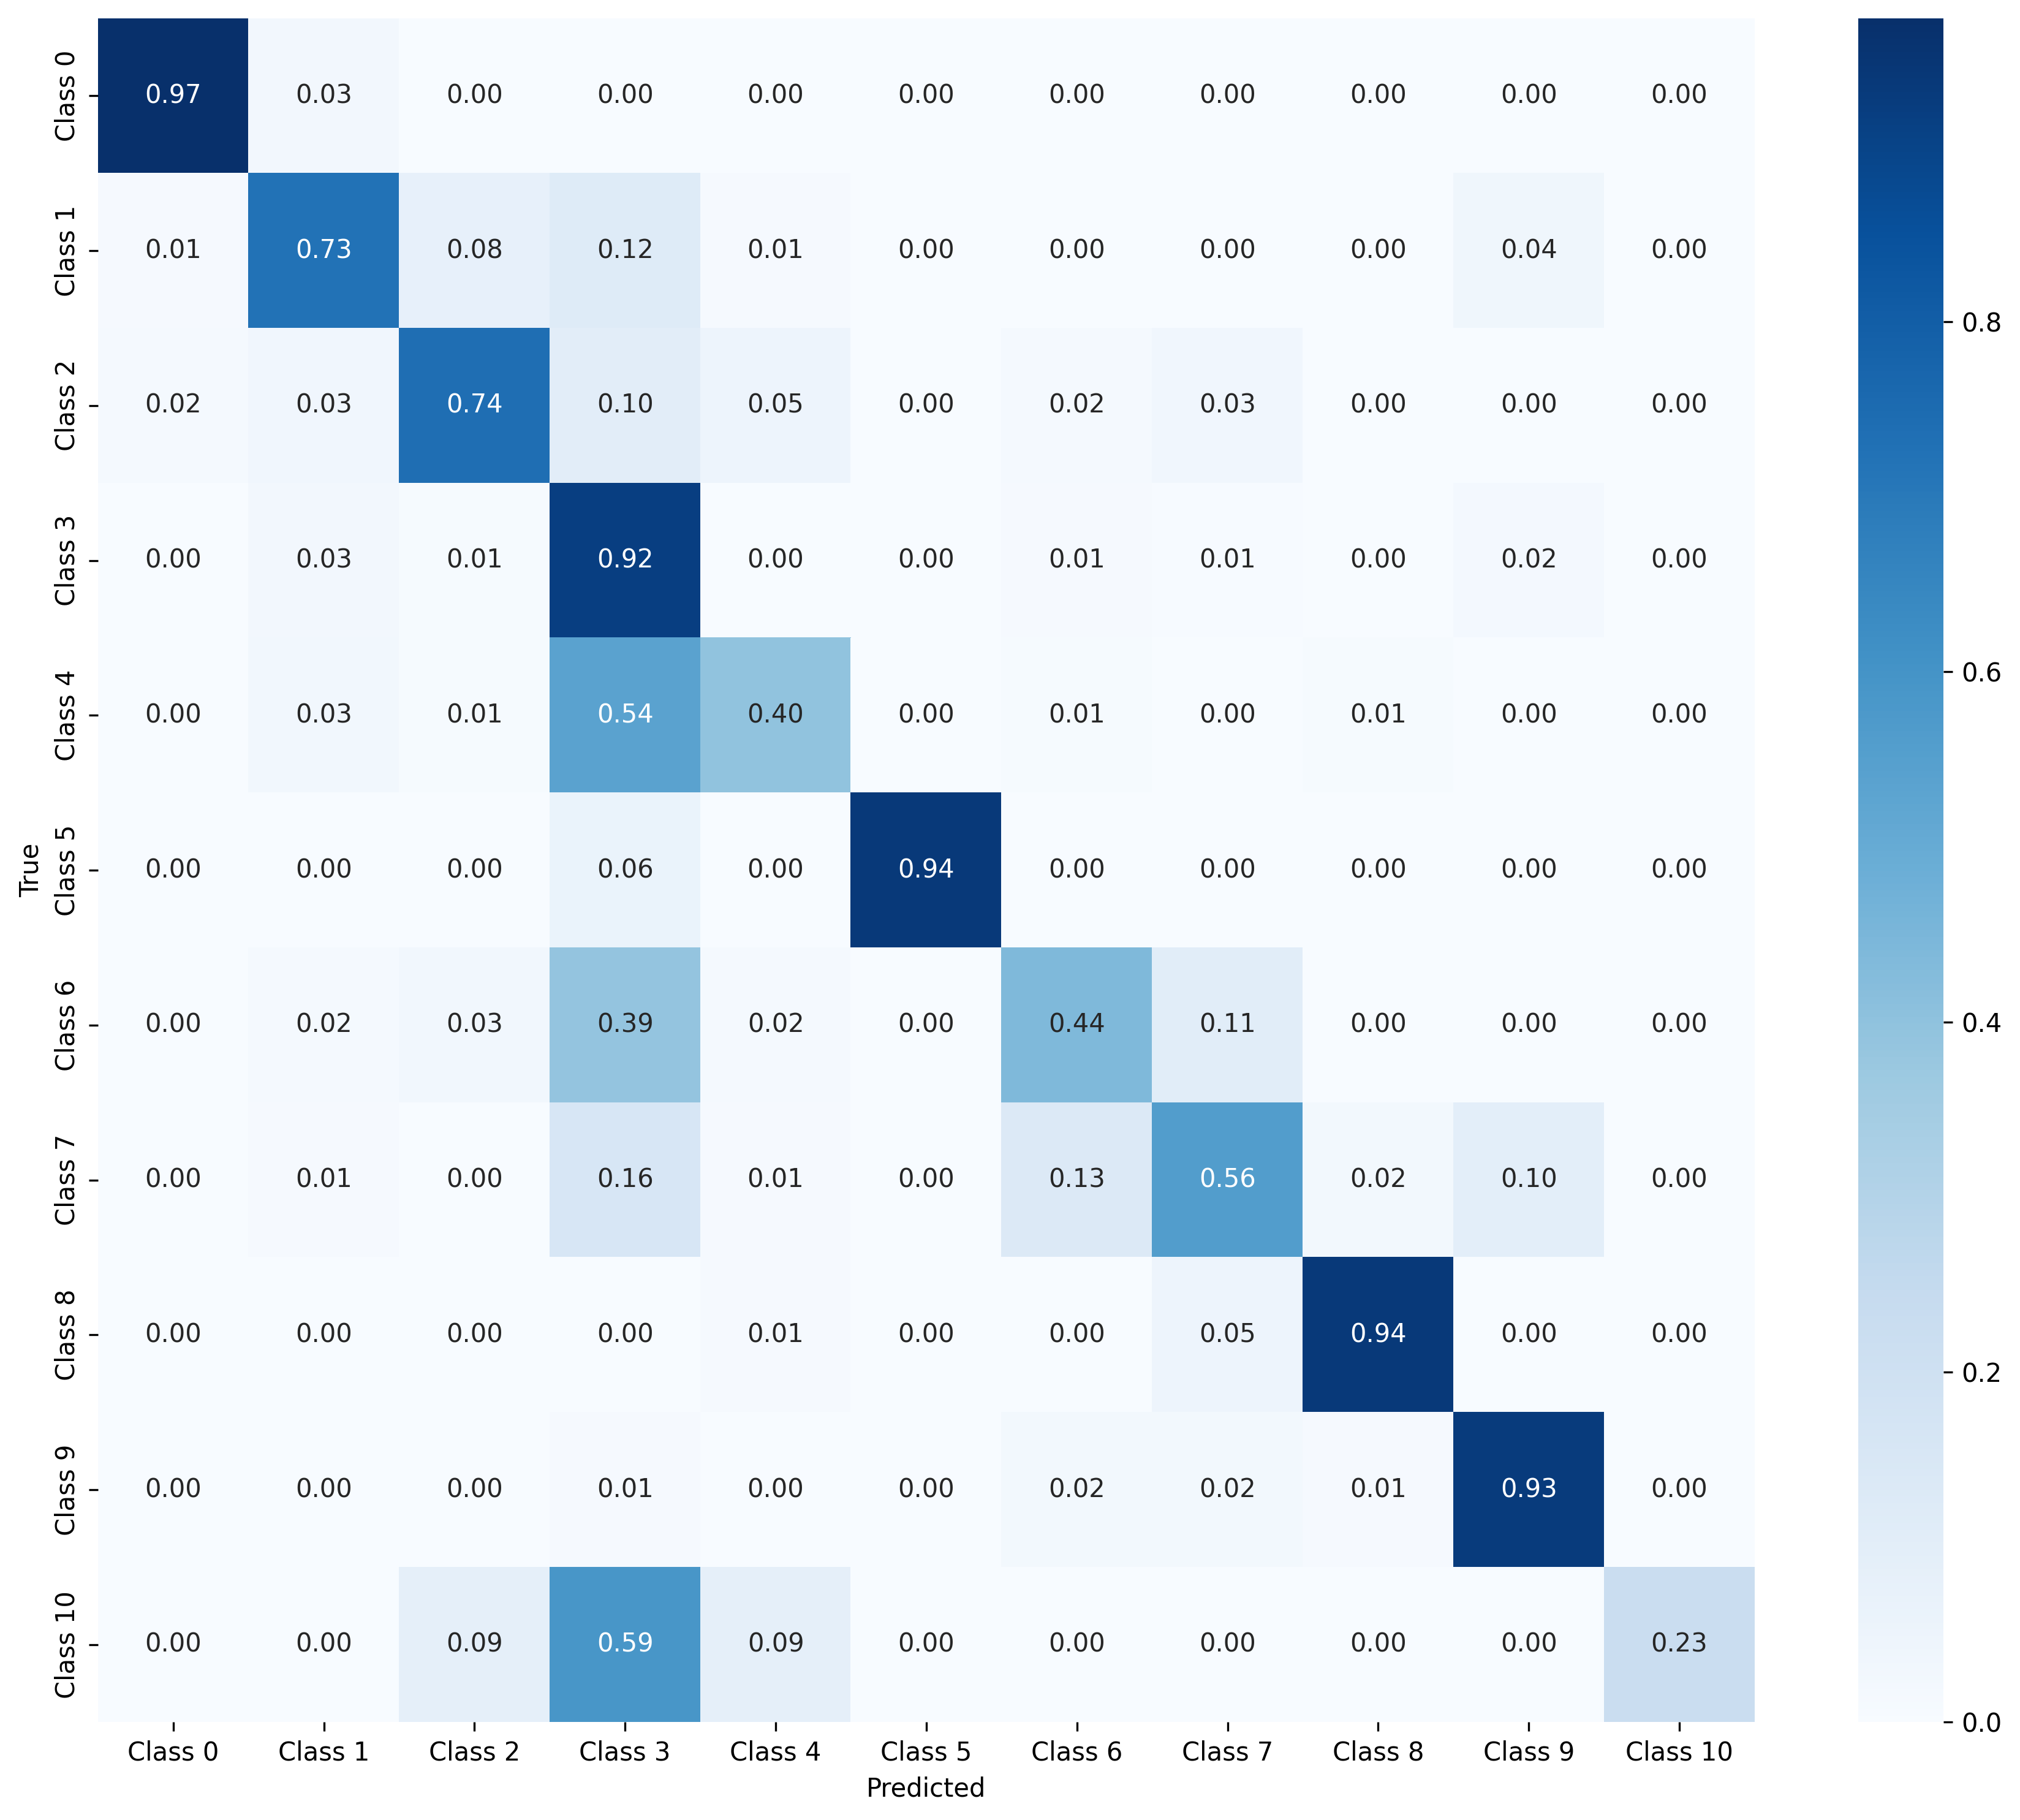
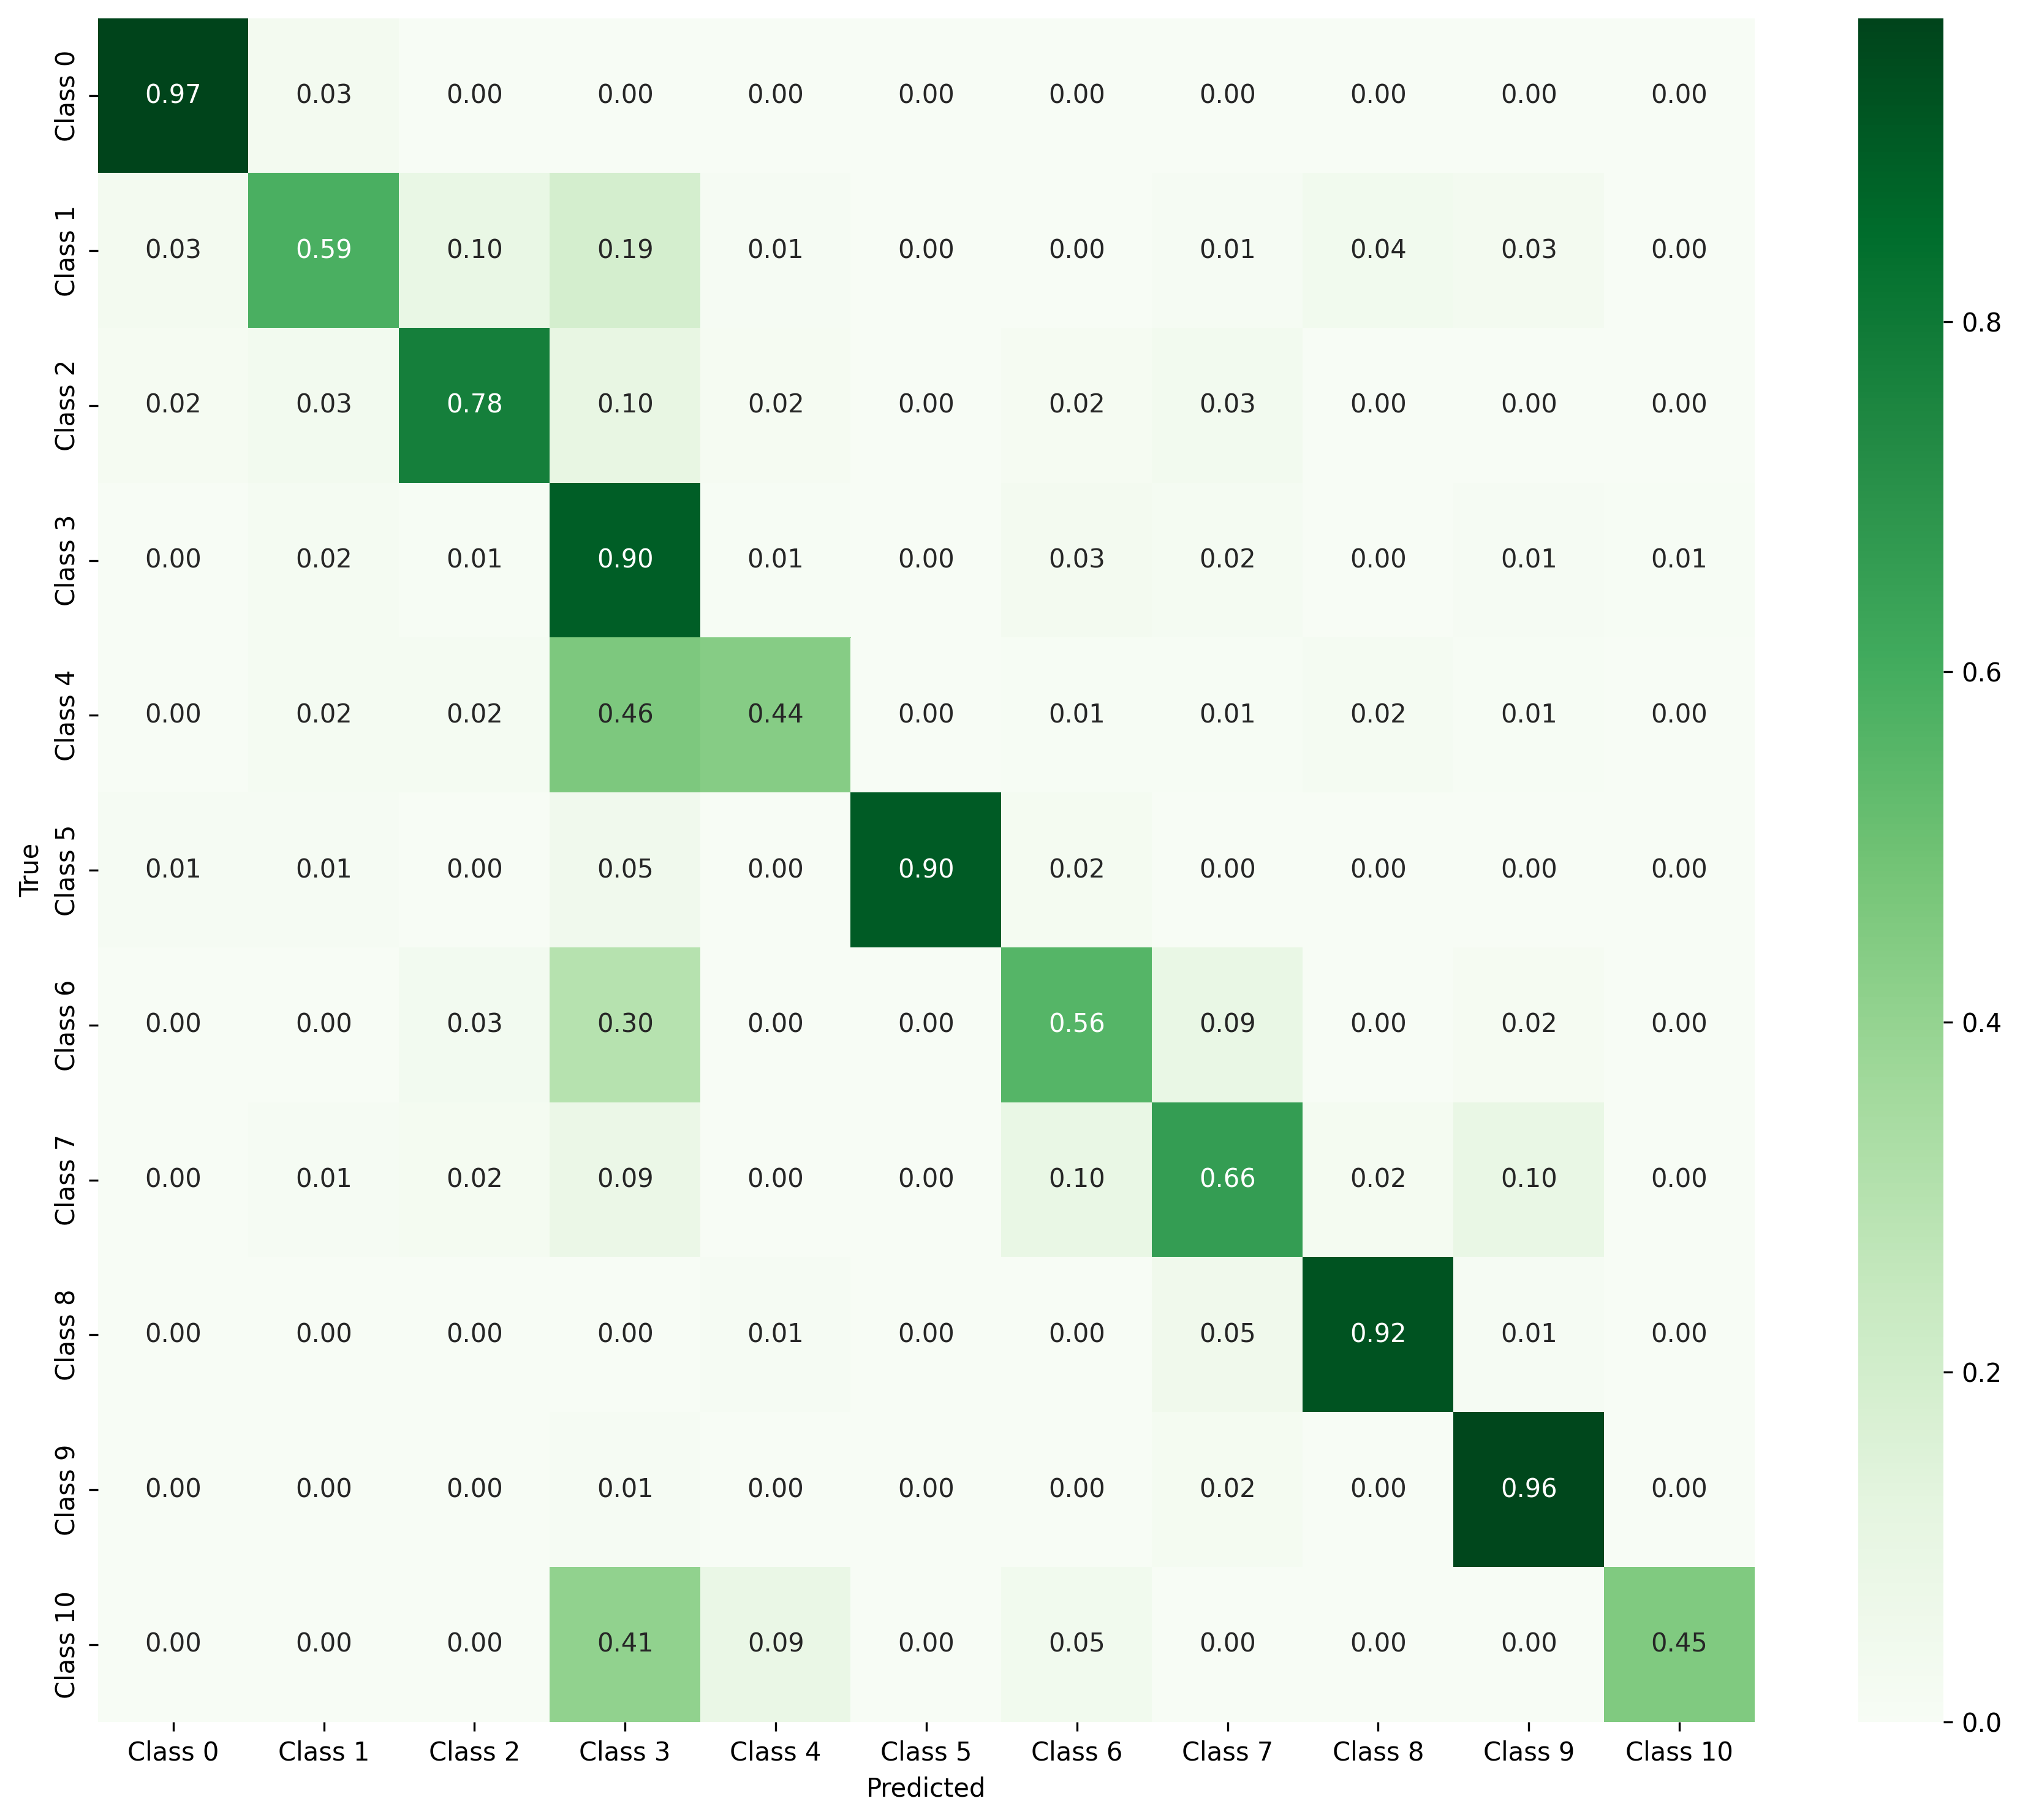
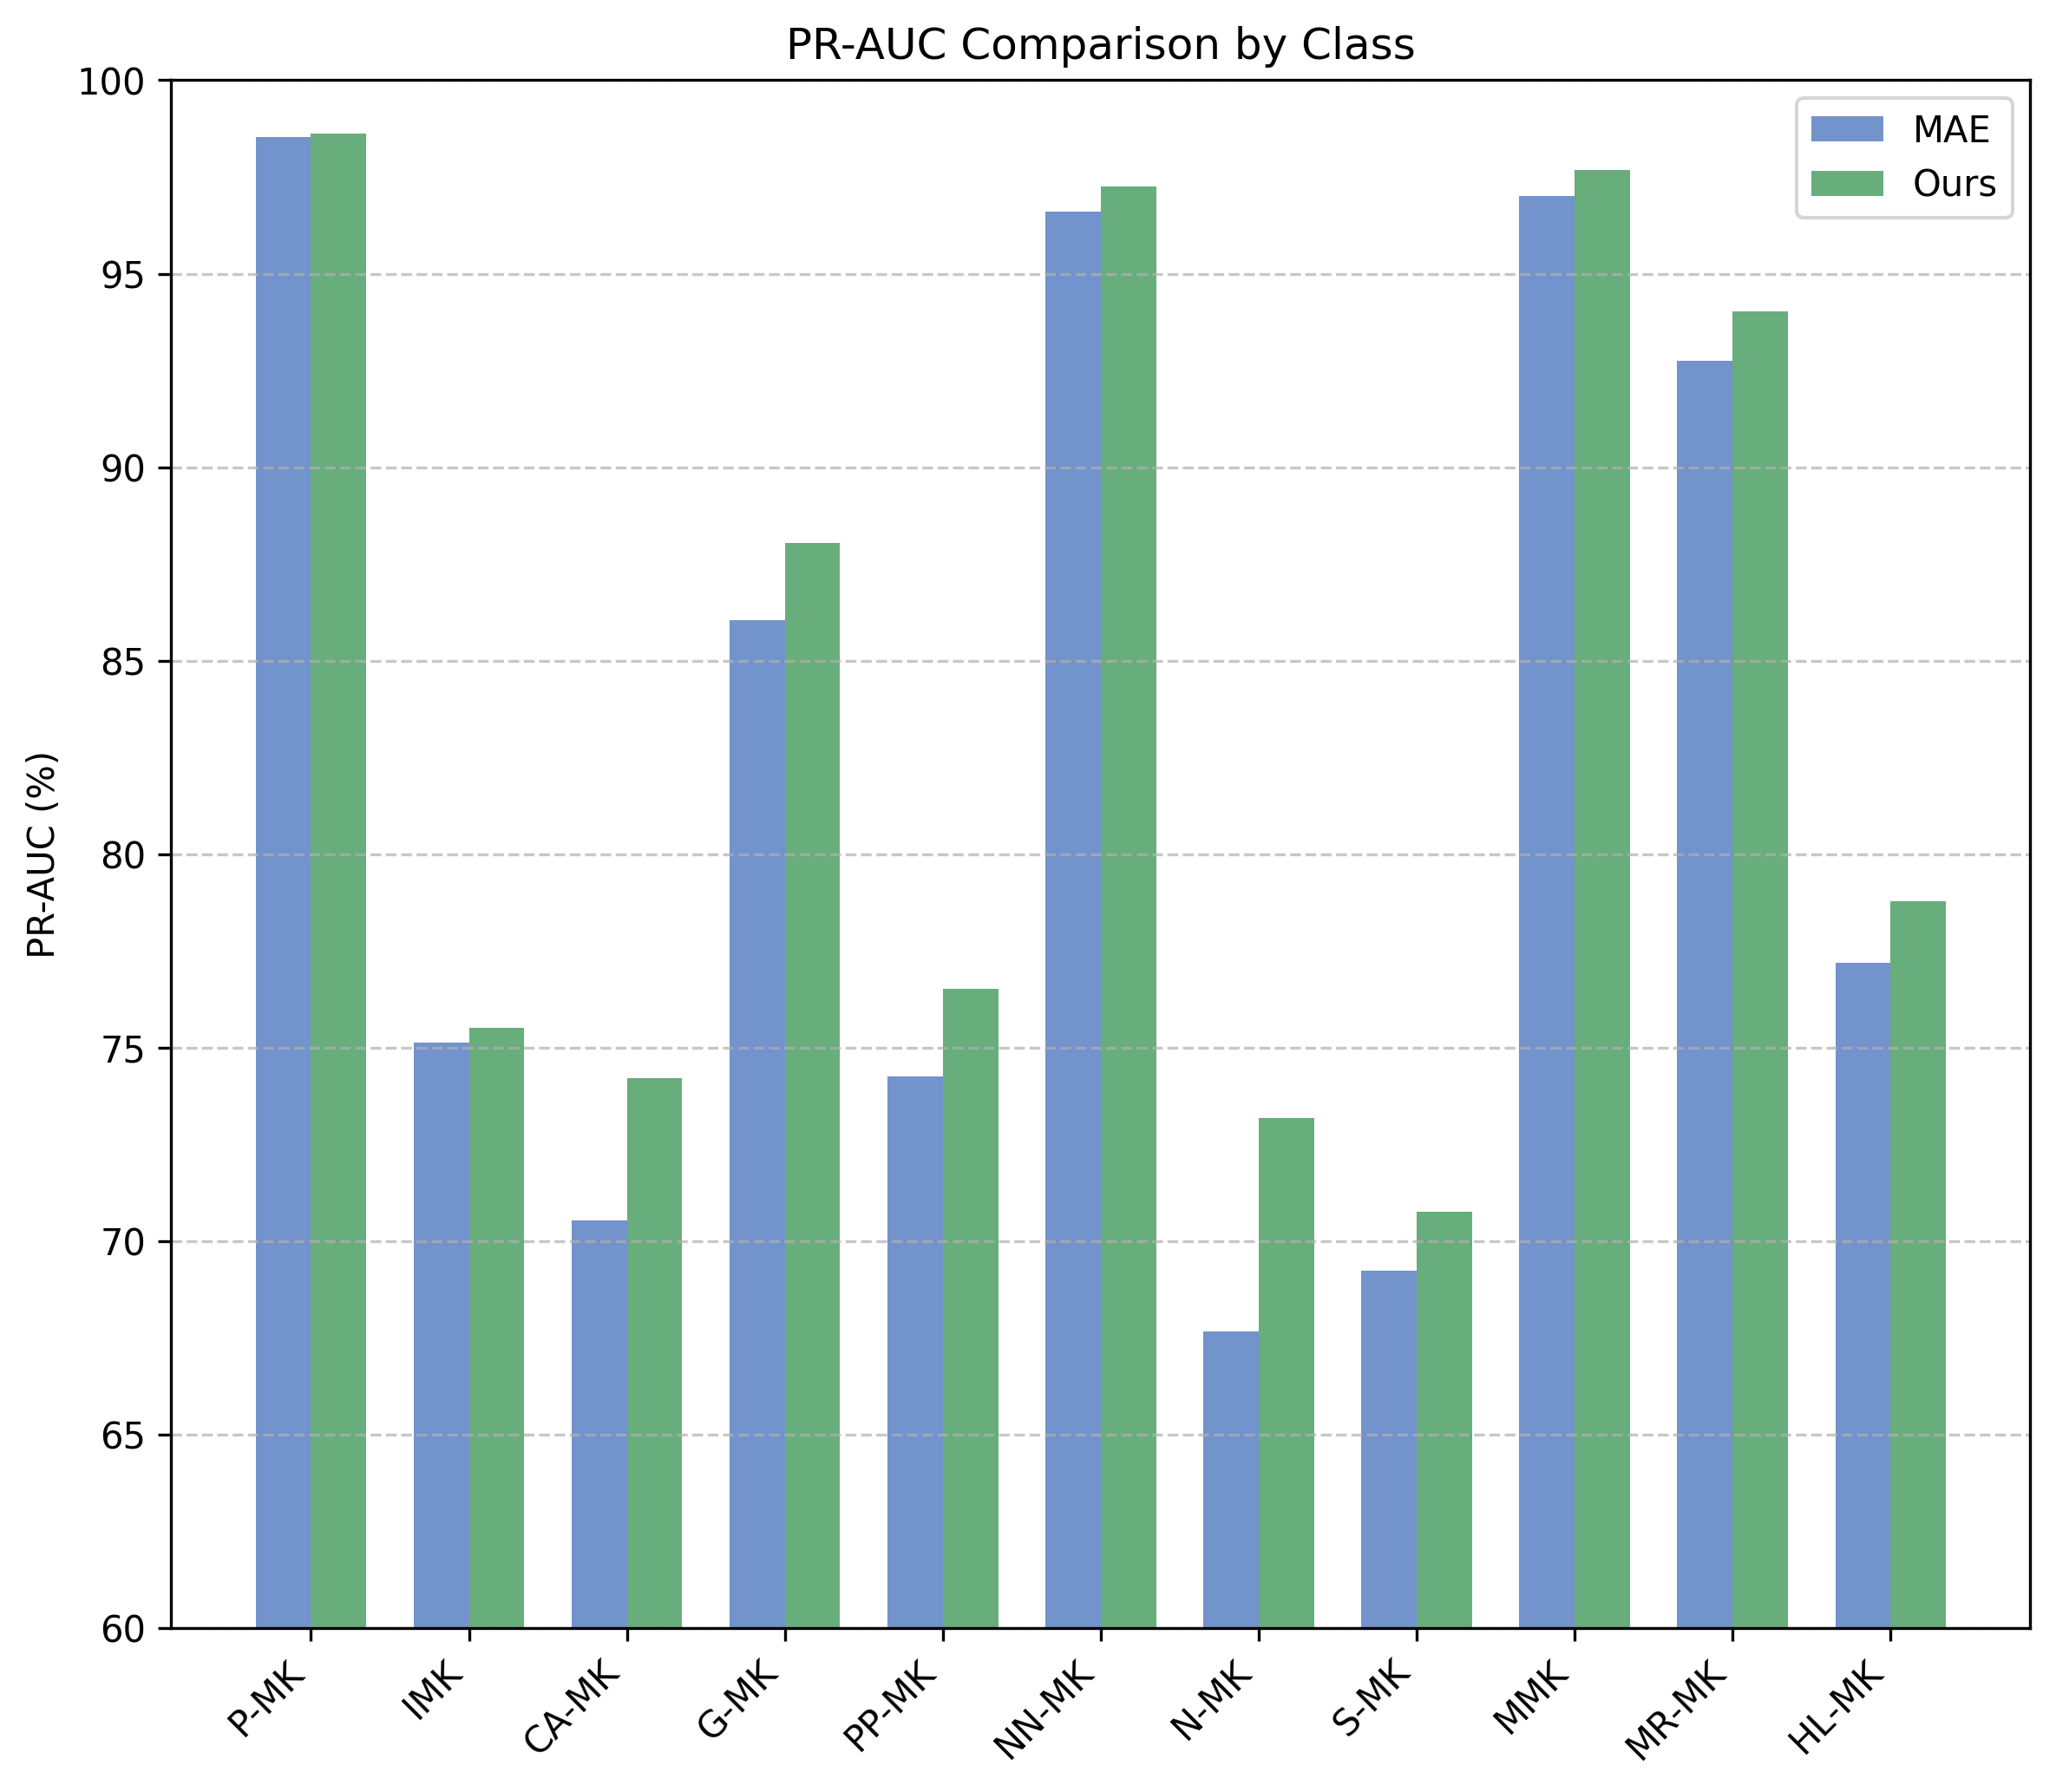
Moreover, our framework demonstrates a superior capability in addressing long-tailed distributions, as visualized in Figure 3. The performance improvements are particularly pronounced for rare subtypes, indicating that ActiveSSF effectively mitigates the class imbalance challenge in megakaryocyte classification.
Ablation Study. We conducted a series of ablation experiments to evaluate the contribution of each module within our framework. Specifically, we compared four configurations: (1) using the Vision Transformer (ViT) [15] as the baseline without any additional modules; (2) incorporating MAE [13] pretraining; (3) further applying Cell Region Filtering (CRF); and (4) finally, integrating Active Sample Selection (ASS), where similarity thresholds are dynamically adjusted based on sample density information to enhance performance on long-tailed distributions. Table III summarizes the quantitative results, clearly demonstrating the specific contributions of each module to the overall performance.
IV Conclusion and Discussion
In this paper, we introduced ActiveSSF, a novel framework that integrates active learning strategies with self-supervised pretraining for the classification of megakaryocytes. By combining clinical prior knowledge-based cell region filtering, adaptive sample selection, and prototype clustering on labeled samples, our approach effectively addresses three critical challenges: (1) suppressing background noise to reveal informative cellular regions, (2) managing long-tailed class distributions through dynamic threshold adjustment, and (3) mitigating the impact of complex morphological variations by generating representative feature prototypes. Extensive experiments on clinical datasets demonstrate that ActiveSSF achieves significant improvements over state-of-the-art methods, particularly enhancing the recognition accuracy of rare subtypes. These promising results suggest that ActiveSSF provides a robust solution for automated blood cell analysis in clinical settings. Future work will explore extending this framework to other medical imaging domains characterized by scarce labeled data and inherently imbalanced class distributions.
References
- [1] K. He, X. Zhang, S. Ren, and J. Sun, “Identity mappings in deep residual networks,” in Computer Vision–ECCV 2016: 14th European Conference, Amsterdam, The Netherlands, October 11–14, 2016, Proceedings, Part IV 14. Springer, 2016, pp. 630–645.
- [2] J. MacQueen, “Some methods for classification and analysis of multivariate observations,” in Proceedings of 5-th Berkeley Symposium on Mathematical Statistics and Probability/University of California Press, 1967.
- [3] M.-C. Su, C.-Y. Cheng, and P.-C. Wang, “A neural-network-based approach to white blood cell classification,” The scientific world journal, vol. 2014, no. 1, p. 796371, 2014.
- [4] R. Tomari, W. N. W. Zakaria, M. M. A. Jamil, F. M. Nor, and N. F. N. Fuad, “Computer aided system for red blood cell classification in blood smear image,” Procedia Computer Science, vol. 42, pp. 206–213, 2014, medical and Rehabilitation Robotics and Instrumentation (MRRI2013). [Online]. Available: https://www.sciencedirect.com/science/article/pii/S1877050914014914
- [5] X. Dong, M. Li, P. Zhou, X. Deng, S. Li, X. Zhao, Y. Wu, J. Qin, and W. Guo, “Fusing pre-trained convolutional neural networks features for multi-differentiated subtypes of liver cancer on histopathological images,” BMC Medical Informatics and Decision Making, vol. 22, no. 1, p. 122, 2022.
- [6] X. Zhao, Z. Li, X. Luo, P. Li, P. Huang, J. Zhu, Y. Liu, J. Zhu, M. Yang, S. Chang, and J. Dong, “Ultrasound nodule segmentation using asymmetric learning with simple clinical annotation,” IEEE Transactions on Circuits and Systems for Video Technology, pp. 1–1, 2024.
- [7] X. Zhao, P. Li, X. Luo, M. Yang, S. Chang, and Z. Li, “Sam-driven weakly supervised nodule segmentation with uncertainty-aware cross teaching,” in 2024 IEEE International Symposium on Biomedical Imaging (ISBI), 2024, pp. 1–5.
- [8] H. Zhao, X. Zhao, L. Zhu, W. Zheng, and Y. Xu, “Hfgs: 4d gaussian splatting with emphasis on spatial and temporal high-frequency components for endoscopic scene reconstruction,” arXiv preprint arXiv:2405.17872, 2024.
- [9] Z. Li, Z. Shang, J. Liu, H. Zhen, E. Zhu, S. Zhong, R. N. Sturgess, Y. Zhou, X. Hu, X. Zhao et al., “D-lmbmap: a fully automated deep-learning pipeline for whole-brain profiling of neural circuitry,” Nature Methods, vol. 20, no. 10, pp. 1593–1604, 2023.
- [10] X. Chen, S. Xie, and K. He, “An empirical study of training self-supervised vision transformers,” in Proceedings of the IEEE/CVF international conference on computer vision, 2021, pp. 9640–9649.
- [11] P. Gao, T. Ma, H. Li, Z. Lin, J. Dai, and Y. Qiao, “Convmae: Masked convolution meets masked autoencoders,” arXiv preprint arXiv:2205.03892, 2022.
- [12] K. Chen, Z. Liu, L. Hong, H. Xu, Z. Li, and D.-Y. Yeung, “Mixed autoencoder for self-supervised visual representation learning,” in Proceedings of the IEEE/CVF Conference on Computer Vision and Pattern Recognition (CVPR), June 2023, pp. 22 742–22 751.
- [13] K. He, X. Chen, S. Xie, Y. Li, P. Dollár, and R. Girshick, “Masked autoencoders are scalable vision learners,” in Proceedings of the IEEE/CVF conference on computer vision and pattern recognition, 2022, pp. 16 000–16 009.
- [14] K. He, H. Fan, Y. Wu, S. Xie, and R. Girshick, “Momentum contrast for unsupervised visual representation learning,” in Proceedings of the IEEE/CVF conference on computer vision and pattern recognition, 2020, pp. 9729–9738.
- [15] D. Alexey, “An image is worth 16x16 words: Transformers for image recognition at scale,” arXiv preprint arXiv: 2010.11929, 2020.