\ul
Data-driven Causal Discovery for Pedestrians-Autonomous Personal Mobility Vehicle Interactions with eHMIs: From Psychological States to Walking Behaviors
Abstract
Autonomous personal mobility vehicle (APMV) is a new type of small smart vehicle designed for mixed-traffic environments, including interactions with pedestrians. To enhance the interaction experience between pedestrians and APMVs and to prevent potential risks, it is crucial to investigate pedestrians’ walking behaviors when interacting with APMVs and to understand the psychological processes underlying these behaviors. This study aims to investigate the causal relationships between subjective evaluations of pedestrians and their walking behaviors during interactions with an external human-machine interface (eHMI) equipped with an APMV. An experiment of pedestrian-APMV interaction () was conducted, in which various eHMIs on the APMV were designed to induce participants to experience different levels of subjective evaluations and generate the corresponding walking behaviors. Based on the hypothesized model of the pedestrian’s cognition-decision-behavior process, the results of causal discovery align with the previously proposed model. Furthermore, this study further analyzes the direct and total causal effects of each factor and investigates the causal processes affecting several important factors in the field of human-vehicle interaction, such as situation awareness, trust in vehicle, risk perception, hesitation in decision making, and walking behaviors.
Index Terms:
Autonomous Personal Mobility Vehicle (APMV); Pedestrian-Vehicle Interactions; External human-machine interface (eHMI); Causal DiscoveryI INTRODUCTION
Autonomous personal mobility vehicles (APMVs) are innovative small autonomous transportation devices designed to provide convenient, safe, and efficient mobility for individuals [1, 2] (see Fig. 1). APMVs typically feature autonomous driving levels ranging from SAE levels 3 to 5 [3]. While many well-known APMVs are currently developed based on electric wheelchairs iiiWHILL Autonomous developed by WHILL Inc.: https://youtu.be/vJWhwNnUPRs or semi-open small vehicles iiiiiiRakuRo developed by ZMP Inc.: https://youtu.be/lWhbJ0rBwjM, APMVs are not exclusively designed for the elderly or people with disabilities. Indeed, APMVs aim to address the “last one mile” problem and enhance short-distance mobility for a broader range of users [2].
APMVs usually operate at low speed, especially in environments shared with pedestrians or other non-motorized vehicles. For example, APMVs can serve as last-mile transportation solutions in urban areas [4], connecting public transit stops to final destinations within city centers, commercial zones, or residential neighborhoods. They are also ideal for short-distance commutes within university campuses [5, 6, 1], parks, or shopping centers [7, 8]. As a result, APMVs will inevitably and frequently interact with other road users, such as pedestrians [9, 2, 10].
I-A Communication Issues in Pedestrians-APMV Interactions
Potential risks in the interaction between APMVs and pedestrians have been identified in some studies. For example, Liu et al. [11, 1] reported that pedestrians tended to perceive danger because they were confused in understanding the driving intentions of the APMV during the interaction. Yamin and Park [12] also emphasizes that a lack of effective communication between the APMV and pedestrians can lead to potential collision risks for pedestrians.
I-B Related Studies
At present, the a significant amount of studies on eHMI focus on interactions between pedestrians and autonomous vehicles (AVs) [13, 14, 15, 16, 17]. Only a limited number of studies have focused on interactions between small types of smart mobility vehicles, such as APMVs, with pedestrians in shared spaces using eHMIs [18, 19, 2]. These studies have drawn conclusions about the influence of eHMI usage on pedestrians’ subjective evaluations and behaviors by comparing different experimental conditions, such as various eHMIs and driving behavior scenarios. For example, clear information from the eHMI could help pedestrians understand the vehicle’s intention [20, 17, 19], enhanced sense of safety [21, 20, 14], allows pedestrians to trust the AV [21, 20, 17], reduce decision-making time and hesitation [13, 20] and improve the crossing initial time (CIT) [15, 16].
However, during interactions between pedestrians and AVs or APMVs equipped with eHMIs, the causal relationships, i. e., the causal paths and the causal effects, and causal process among various psychological states of pedestrians and their walking behaviors, remain insufficiently validated or explored. Furthermore, the examination of interactions involving pedestrians and APMVs is even less prevalent in existing research.
A preliminary work of this study has been published in [22]. In this preliminary work, we invited 18 participants as pedestrians to interact with the APMV. Through causal discovery, we found some direct causal relationships between some factors of subjective evaluations and walking behaviors. However, due to the small number of participants, some direct causal relationships of subjective factors, such as causal effects related to trust and perceived danger, are not statistically stable and have low reproducibility via bootstrap.
I-C Purpose
This study aims to discover and analyze the causal relationships between the subjective evaluations of pedestrians and their walking behaviors during interactions with APMVs equipped with eHMI. Furthermore, this study aims to validate the previously proposed hypothesized model (see Fig. 2) based on data-driven causal discovery results.
In this study, a large-scale comprehensive experiment is performed. Using data from these 42 participants, we conduct a data-driven causal discovery and find stable direct causal relationships between the factors. In addition, we further analyze the total causal effects of each factor and investigate the causal processes affecting several important factors, such as trust in the vehicle, in the field of human-vehicle interaction.
I-D Contributions
The contributions of this study are as follows:
-
1)
A data-driven causal discovery approach was used to validate a hypothesized model of pedestrians’ cognition-decision-behavior process in human-vehicle interaction (see Fig. 2).
-
2)
A direct causal effect of situational awareness on trust in APMV was identified, highlighting the need to calibrate trust by providing information that improves situational awareness and helps pedestrians form an accurate mental model.
-
3)
This study found that when the APMV conveyed its driving intentions to pedestrians through eHMI during or before changes in driving behavior, it enhanced subjective evaluations of pedestrians and made their walking behaviors more efficient during interactions.
II CAUSAL DISCOVERY
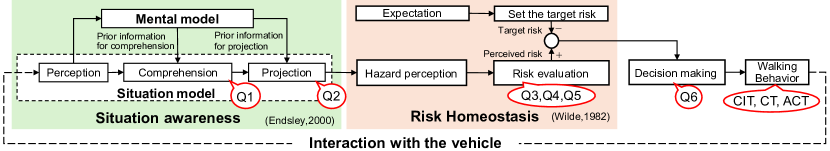
II-A Hypothesized Model of Pedestrian’s Cognition-Decision-Behavior Process
To discover the causal relationships between the subjective evaluations of pedestrians and their walking behaviors during interactions with APMV, this study adopts the conceptual model of the pedestrian cognition-decision-behavior process proposed by [11, 1] as the hypothesized model.
As shown in Fig. 2, the hypothesized model consists of four fundamental sections, namely i. e., awareness of the situation [23], risk homeostasis [24], decision making and behavior generation. The situation awareness section describes the cognitive processes of pedestrians, including perception, comprehension, and projection, which together form their overall awareness of the surrounding environment [23]. This process is supported by the mental model, which provides the necessary prior knowledge for situation awareness [25]. Afterwards, in the risk homeostasis section, pedestrians assess hazards based on predictions and evaluate subjective risks (e. g., sense of danger, sense of relief) in the current situation, taking into account their personal level of risk acceptance (i. e., target risk). Furthermore, Liu et al. [20] suggested that pedestrians’ trust in the APMV interacts with the target risk, influencing their subjective risk evaluations. Following this, pedestrians compare their subjective risk with the acceptable risk level (i. e., the target risk) to inform their decision-making. Once this decision-making process is complete, the body executes specific walking behaviors. As pedestrians engage in these walking behaviors, they interact with objects, e. g., APMV, in their surrounding environment, thereby perpetuating the aforementioned process in a continuous loop.
Importantly, it should be noted that pedestrians’ behaviors dynamically influence their future situation awareness through environmental interactions, as depicted by the dashed line in Fig. 2. This indirect effect or indirect causal relationship lies outside of this study’s scope. Therefore, we assume that the direct causal process from pedestrians’ perception in situational awareness to their behaviors is unidirectional and non-cyclical. This relation can be adequately represented by a directed acyclic graph (DAG).
II-B Causal Discovery via Direct Linear Non–Gaussian Acyclic Model (DirectLiNGAM)
Causal discovery aims to uncover and understand the relations between observed variables from observed data, estimating which variables have direct or indirect causal effects on others. Structural equation models (SEMs) are commonly used to investigate these causal relationships in studies of human-robot interactions [26, 27] and human-vehicle interactions [28, 29]. In which, Shimizu et al. [30] proposed a linear non–gaussian acyclic model (LiNGAM) for estimating DAG-based SEM by using non-Gaussianity of the data. Thus, LiNGAM is selected as the causal discovery method in this study because it is applicable to DAGs, which align with the structure of our proposed hypothesized model (see Fig. 2).
The LiNGAM presents a DAG as
| (1) |
in which denotes the observed variables, with its subscript specifying the causal order. The indicates an adjacency matrix and the indicates independent error variables. In matrix , represents the strength of the direct causal relationship from to , thereby illustrating the causal path and causal effect between these variables.
Generally, the objective of causal discovery using SEM is to estimate an optimal matrix that characterizes the data generative process, i. e., the causal relationships among the observed data. Since LiNGAM assumed that the causal process can be represented by a DAG, it permutes the matrix to a strictly lower triangular matrix by simultaneous equal row and column permutations. The lower triangular matrix could be estimated using the independent component analysis (ICA) [30]. However, most iterative method-based ICA algorithms, such as FastICA, may depend on the initial parameter states, making it challenging to guarantee that LiNGAM will converge to the correct solution in a finite number of steps [31].
Input: where .
Output: Adjacency matrix in Eq. 1.
To address this issue, Shimizu et al. proposed DirectLiNGAM which can directly extract causal structures from observed data [31]. As shown in Algorithm 1, DirectLiNGAM can be divided into two stages: 1) determining the causal order between variables, 2) optimizing the adjacency matrix .
In the first stage, DirectLiNGAM identifies an exogenous variable, that is most independent of the other variables, by minimizing the mutual information between the variables and their residuals (steps 2 and 3). Once the exogenous variable is identified, the remaining variables are updated using the residuals between them and the exogenous variables, effectively removing the exogenous variables’ influence (step 4). Next, the identified exogenous variable is recorded and excluded from (step 5). Then, DirectLiNGAM continues with the remaining variables to identify additional exogenous variables until (step 1 to 6). By iteratively repeating these steps, the causal orders among variables can be determined.
In the second stage, once the causal orders of all variables are identified, DirectLiNGAM will rearrange the order of variables in the vector (step 7). After that, DirectLiNGAM uses least squares regression to compute the adjacency matrix , ensuring it maintains a strictly lower triangular form in accordance with the determined causal order (step 8). For more details on the DirectLiNGAM algorithm, please refer to [31].
In this paper, as shown in Fig. 2, we assume that the data generation process, i. e., causal process, from subjective evaluations to walking behaviors of pedestrians is unidirectional and non-cyclical, indicating that it can be represented by a DAG. Consequently, DirectLiNGAM is used in this study.
III EXPERIMENT
A within-subjects experiment was conducted to discovery the causal relationship from pedestrians’ subjective evaluations to their walking behaviors during interactions with an APMV. This experiment was carried out with the approval of the Research Ethics Committee of Nara Institute of Science and Technology, Japan (No. 2022-I-55-1).
To induce varying levels of situation awareness in pedestrians during the interaction, four different eHMI conditions were designed. Moreover, this experiment simulated a scenario in which the APMV autonomously drives to pick up passengers or returns to standby after dropping them off, i.e., operates autonomously without a passenger, to induce pedestrians’ risk perception. This is because pedestrians’ trust in the passenger on the APMV could lead to biased their risk perceptions, as discussed in Liu et al. [1]. For example, pedestrians may assume that the passenger can take over control at any time, leading them to perceive the risk as low regardless of how dangerous the APMV’s driving behaviors might actually be. The specific experimental design is detailed in the following subsection.
III-A Participants
An a priori power analysis using G*Power 3.1.9.7 (effect size , , ) estimated the minimum sample size for repeated measures ANOVAs under the four eHMI conditions was 26. In this study, we invited 42 participants (self-reproted genders: male 34, female: 8) with ages from 22 to 38 years (Avg.: 26.69 years, Std.: 4.36 years) from multiple countries to participate in the experiment. There are 13 participants from Japan, 8 from Indonesia, 5 from China, 3 each from Malaysia and Bangladesh, 2 each from Pakistan, Philippines and Vietnam, and 1 participant each from Lebanon, Colombia, Sudan, and Nigeria. None of the participants had previous experience using or interacting with APMVs. The experiment lasted approximately one hour and each participant was compensated with 1,000 Japanese Yen for their participation.
III-B APMV and Its eHMI Device
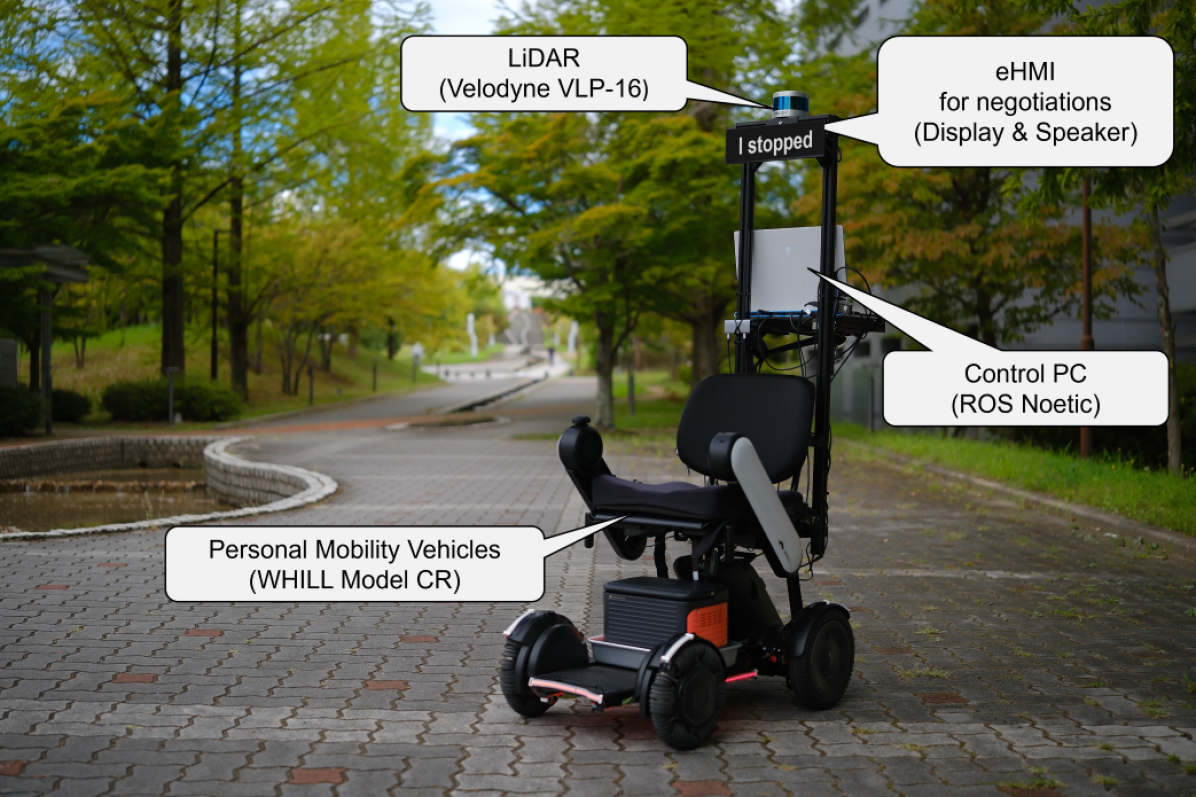
As shown in Fig. 1, a WHILL Model CR robotic wheelchair equipped with an autonomous driving system was used as the APMV. This APMV is equipped with a Velodyne VLP-16 LiDAR and a control PC for autonomous driving on a pre-designed route. A display with a speaker has been installed on top of the APMV to function as the eHMI. This eHMI communicates driving intentions by showing relevant text on the display and vocalizing the messages through the speaker.
III-C Experimental Site
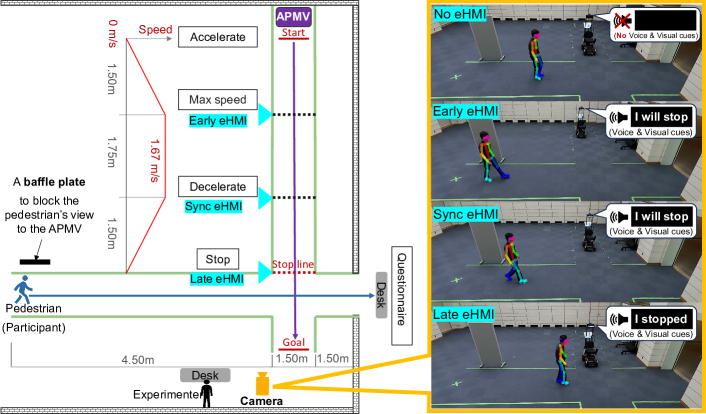
An indoor area measuring 10 m10 m was arranged to simulate a street crossing scene, as shown in Fig. 3. The pedestrian’s walking path spans 7.5 meters, consisting of 4.5 meters from the initial point to the intersection, a street width of 1.5 meters, and an additional 1.5 meters from the crossing to the exit. On the other hand, the APMV travels a route totaling 8.25 meters, which includes 4.75 meters from the starting position to the intersection, a crossing width of 2 meters, and 1.5 meters from the crossing to the end position.
A baffle plate is positioned near the pedestrians’ starting location. This plate is structured to block the pedestrians’ view, ensuring that they encounter the APMV from a consistent position only after they begin walking.
III-D Driving Behaviors of the APMV
In Fig. 3, the velocity profile of the APMV is depicted by the red line. The APMV departs from a start position 4.75 meters away from the intersection stop line, reaching a speed of 1.67 m/s after traveling 1.5 meters. It then maintains this speed for another 1.75 meters before beginning to decelerate and ultimately comes to a stop after covering an additional 1.5 meters. After the pedestrian has completely crossed the road, the APMV starts moving again and drives to the goal position. In all trials, the APMV’s velocity profiles are the same, regardless of variations in eHMI conditions.
III-E eHMI Conditions
This experiment designed four different eHMI conditions (see the right part of Fig. 3) to obtain varying degrees of paired psychological and behavioral data from pedestrians during their interactions with the APMV. It is assumed that the eHMI cue under each condition, in conjunction with the APMV’s driving behaviors, can help pedestrians to vary degrees in understanding the APMV’s driving intentions and predicting its driving behavior. Consequently, this may lead to differences in pedestrians’ subjective evaluations and walking behaviors. Moreover, the designed eHMIs incorporate both visual and voice cues to prevent differences in pedestrians’ perceptions of the eHMI information and the timing due to inconsistent attention. These conditions are detailed in Fig. 3.
III-E1 No eHMI Condition
Participants are required to depart at the same time as APMV. In encounters between pedestrians and APMVs, the eHMI neither shows information on the screen nor produces sound. Consequently, the eHMI does not assist pedestrians in comprehending the APMV’s driving intentions and predicting its behavior.
III-E2 Early eHMI Condition
Participants are required to depart at the same time as APMV. At a distance of 1.5 meters after departure, reaching a speed of 1.67 m/s, the APMV displays “I will stop” on the eHMI screen and provides a voice cue (see Fig. 3). After that, the eHMI will continuously display ”I will stop” until the APMV stops in front of the stop line. At stopping, the eHMI will be turned off. We assumed that pedestrians may easily understand the driving intentions of the APMV under. However, predicting driving behaviors may remain difficult because the eHMI provides cues before the APMV’s deceleration.
III-E3 Sync eHMI Condition
Participants are required to depart at the same time as APMV. At a distance of 1.5 meters from the stop line, the APMV begins to decelerate. At this moment, the eHMI issues visual and voice cues, stating “I will stop”(see Fig. 3). At the stopping line, the eHMI will be turned off. Since the Sync eHMI provides the information cues synchronously as the APMV’s driving behavior, it is assumed that it can help pedestrians to understand the driving intention and to predict the driving behavior of the APMV.
III-E4 Late eHMI Condition
Participants are required to depart at the same time as APMV. During the process from the APMV’s departure to its stop, the eHMI does not provide any information cues to pedestrians. When the APMV stopped, the eHMI will prompt “I stopped” using both visual and voice cues (see Fig. 3). The visual cue will continue until the APMV departs after the pedestrian completes crossing the road. As the eHMI does not provide information before the APMV stops, we assume that it cannot help pedestrians understand the APMV’s driving intentions or predict its driving behavior before the APMV comes to a stop. After the APMV stops and displays “I stopped”, it can help pedestrians understand the APMV’s driving intentions; however, pedestrians cannot derive predictive information about when it will depart from this message.
III-F Experimental Procedure
At the first, the participants were briefed on the experiment, covering details about the APMV’s hardware and its self-driving capabilities. Then, examples were used to familiarize them with the eHMI, demonstrating its visuals and voice cues. However, details on the eHMI conditions and their activation timing were not introduced. The participants provided their informed consent after all their questions were answered and then began the experiment.
Since all participants reported having no prior encounter experience with the APMV in their lives, we placed the No eHMI condition at the beginning of the experience order to familiarize them with the interaction and establish a baseline for comparison. The remaining three eHMI conditions provide six potential sequence combinations using a Latin square design. As detailed in Table I, each experience order is randomly assigned to seven participants to minimize the potential impact of the order effects on experimental results. Note that each eHMI condition will be carried out continuously for three interactive trials to obtain stable subjective evaluations and behavioral data.
| Participants | Order of experience with eHMI conditions | ||||||||||||||
| (N=42) | Dummy trial | 1st cond. | Dummy trial | 2nd cond. | Dummy trial | 3rd cond. | Dummy trial | 4th cond. | |||||||
| N=7 | Non-yielding | No eHMI3 | Non-yielding | Early eHMI3 | Non-yielding | Sync eHMI3 | Non-yielding | Late eHMI3 | |||||||
| N=7 | Non-yielding | No eHMI3 | Non-yielding | Early eHMI3 | Non-yielding | Late eHMI3 | Non-yielding | Sync eHMI3 | |||||||
| N=7 | Non-yielding | No eHMI3 | Non-yielding | Sync eHMI3 | Non-yielding | Early eHMI3 | Non-yielding | Late eHMI3 | |||||||
| N=7 | Non-yielding | No eHMI3 | Non-yielding | Sync eHMI3 | Non-yielding | Late eHMI3 | Non-yielding | Early eHMI3 | |||||||
| N=7 | Non-yielding | No eHMI3 | Non-yielding | Late eHMI3 | Non-yielding | Early eHMI3 | Non-yielding | Sync eHMI3 | |||||||
| N=7 | Non-yielding | No eHMI3 | Non-yielding | Late eHMI3 | Non-yielding | Sync eHMI3 | Non-yielding | Early eHMI3 | |||||||
Before each eHMI condition, a non-yielding dummy trial is performed to remind participants that the APMV might not always stop. specifically, the APMV departs one second before the participants. The APMV crosses the intersection without accelerating or stopping because pedestrians are about 1 to 1.5 meters from the intersection’s edge when it passes the stop line. The eHMI does not show any information during this process.
As prior instructions, participants were informed that during the experiment, you would encounter an APMV equipped with various types of eHMIs, and these eHMIs are randomly used in each trial. Participants were also informed that the eHMI could simultaneously convey both visual and voice cues but the specific configurations of each eHMI condition were not instruct to them. Finally, participants were given false information that the APMV would automatically decide whether to yield to them based on their distance and movement speed.
In each trial, participants were instructed to walk naturally from the initial point, cross the road, and exit through a door (refer to the blue line in Fig. 3). During this walking process, participants needed to decide whether to yield to the APMV, just as they would in real traffic. After completing each trial, participants were required to complete a post-trial questionnaire at the desk outside the door. Then, participants returned to the starting point to continue the next trial.
III-G Measurements
III-G1 Post-trial Questioners
Based on the hypothesized model shown in Fig. 2, Liu et al. [20] designed the following six questions to evaluate each step of this model. These six questions are:
-
Q1:
It was easy to understand the driving intentions of the APMV.
-
Q2:
It was easy to predict the driving behaviors of the APMV.
-
Q3:
I felt it was dangerous to cross the road when I encountered the APMV.
-
Q4:
I trusted the APMV to interact with me safely when I crossed the road.
-
Q5:
I felt a sense of relief when I crossed the road.
-
Q6:
I felt hesitant to make the decision of crossing the road or not when I encountered the APMV.
Q1 and Q2 assess comprehension and projection in pedestrian situation awareness. Q3, Q4, and Q5 evaluate the risk homeostasis process. Q6 measures hesitation in decision-making about crossing the road. These six questions were required to be answered using a 5-point Likert scale, i. e., 1=“strongly disagree”, 2=“disagree”, 3=“neutral”, 4=“agree”, and 5=“strongly agree”.
III-G2 Walking Time Durations in Three Crossing Phases
Walking time durations of the participants are calculated in the three crossing phases. Crossing Initiation Time (CIT) refers to the duration it takes for pedestrians to decide to cross the road. This metric was used to indicated the interval between the moment pedestrians perceive the APMV and the moment they step into the intersection. Crossing Time (CT) refers to the duration between the moment pedestrians move into the intersection and the moment they cross the intersection completely. After Crossing Time (ACT) refers to the duration pedestrians take to move from the end of the intersection to the end point.
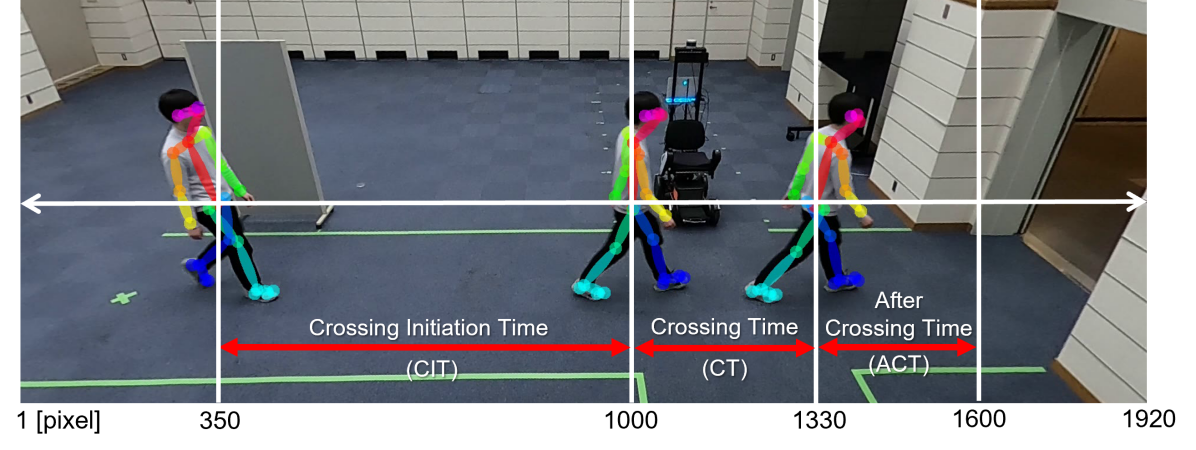
To measure the walking time durations mentioned above, the walking process of participants were recorded by a camera (19201080 pixels with 30 FPS) shown in Fig. 3. Then, OpenPose [32] based on the BODY 25 joint set is used to extract skeletal features of participants during their walking process (see Fig. 4). Then, the feature point of the waist called the MidHip point is used to represent the walking position of participants in the image coordinate system. The existence time of the MidHip point during the three stages is used to represent CIT, CT, and ACT. Specifically, as shown in Fig. 4, CIT is defined as the time taken for the pedestrian’s MidHip keypoint to move from 350 pixels to 1000 pixels; CT is the time taken for the MidHip keypoint to move from 1000 pixels to 1330 pixels; while ACT is the time taken for it to move from 1330 pixels to 1600 pixels on the image’s horizontal axis.
| Factor | Descriptive Statistics | Spearman Correlation Coefficient | |||||||||||||||
| N | mean | std. | median | IQR | min | max | Q1 | Q2 | Q3 | Q4 | Q5 | Q6 | CIT | CT | ACT | ||
| Q1 Understand | 504 | 3.97 | 1.20 | 4.00 | 2.00 | 1.00 | 5.00 | 1.00 | 0.78 | -0.67 | 0.68 | 0.42 | -0.70 | -0.32 | -0.11 | -0.08 | |
| Q2 Predict | 504 | 3.89 | 1.20 | 4.00 | 2.00 | 1.00 | 5.00 | 0.78 | 1.00 | -0.68 | 0.66 | 0.41 | -0.69 | -0.28 | -0.12 | -0.09 | |
| Q3 Dangerous | 504 | 2.17 | 1.20 | 2.00 | 2.00 | 1.00 | 5.00 | -0.67 | -0.68 | 1.00 | -0.75 | -0.46 | 0.77 | 0.19 | 0.03 | 0.02 | |
| Q4 Trust | 504 | 3.81 | 1.16 | 4.00 | 2.00 | 1.00 | 5.00 | 0.68 | 0.66 | -0.75 | 1.00 | 0.59 | -0.72 | -0.25 | -0.05 | 0.00 | |
| Q5 Relief | 504 | 3.81 | 1.17 | 4.00 | 2.00 | 1.00 | 5.00 | 0.42 | 0.41 | -0.46 | 0.59 | 1.00 | -0.43 | -0.25 | -0.07 | -0.02 | |
| Q6 Hesitant | 504 | 2.51 | 1.35 | 2.00 | 3.00 | 1.00 | 5.00 | -0.70 | -0.69 | 0.77 | -0.72 | -0.43 | 1.00 | 0.30 | 0.08 | 0.05 | |
| CIT | 504 | 3.06 | 0.83 | 2.87 | 1.00 | 1.70 | 6.11 | -0.32 | -0.28 | 0.19 | -0.25 | -0.25 | 0.30 | 1.00 | 0.45 | 0.44 | |
| CT | 504 | 1.19 | 0.18 | 1.17 | 0.20 | 0.73 | 2.37 | -0.11 | -0.12 | 0.03 | -0.05 | -0.07 | 0.08 | 0.45 | 1.00 | 0.80 | |
| ACT | 504 | 0.96 | 0.13 | 0.93 | 0.17 | 0.60 | 1.33 | -0.08 | -0.09 | 0.02 | 0.00 | -0.02 | 0.05 | 0.44 | 0.80 | 1.00 | |
|
|||||||||||||||||
III-H Prior Knowledge of DirectLiNGAM
After measuring the data on participants’ subjective evaluations and walking behaviors, we applied DirectLiNGAM to discover the causal relationships from their subjective evaluations to walking behaviors. Based on the hypothesized model shown in Fig. 2, we have set prior knowledge in DirectLiNGAM to specify the inputs and outputs of this process. Specifically, Q1 is designated as the input, i. e., a prior exogenous variable. This means that Q1 is assumed to be an independent factor within the model, unaffected by other variables but capable of influencing them. Furthermore, CIT, CT, and ACT are designated as the outputs, i. e., prior endogenous variables. This means they are assumed to be dependent variables, influenced by other variables but do not influence others. The causal relationships among the remaining variables are inferred using DirectLiNGAM.
IV RESULTS
IV-A Data Summary
Considering the differences in interaction timing and distance between pedestrians and the APMV in the non-yielding dummy condition compared to other eHMI conditions, data from this condition are excluded from the analysis.
Throughout the experiment, data from a total of 504 trials (126 trials per eHMI condition) were collected, each consisting of nine factors: six subjective evaluation factors (Q1 to Q6) and three factors of walking behavior (CIT, CT and ACT). Table II shows the descriptive statistics of each factor under all eHMI conditions. Assessing the maximum, minimum values, and standard deviation (std) of data for each factor, the collected dataset is deemed extensive, non-sparse, and conducive to causal discovery. Table II also shows Spearman correlation coefficients between each pair of factors, which helps us to preliminarily discover potential relationships among them.
![[Uncaptioned image]](/html/2502.02805/assets/x5.png)
. Factor W ddof1 ddof2 F p Q1 Understand 0.407 2.952 121.048 28.098 <.001 *** Q2 Predict 0.357 2.952 121.048 22.778 <.001 *** Q3 Dangerous 0.195 2.952 121.048 9.948 <.001 *** Q4 Trust 0.248 2.952 121.048 13.542 <.001 *** Q5 Relief 0.118 2.952 121.048 5.511 <.001 *** Q6 Hesitant 0.232 2.952 121.048 12.359 <.001 *** CIT 0.423 2.952 121.048 30.075 <.001 *** CT 0.257 2.952 121.048 14.212 <.001 *** ACT 0.188 2.952 121.048 9.468 <.001 *** ***:.
IV-B Subjective Evaluations and Walking Behaviors under each eHMI Condition
Under each eHMI condition, the results of subjective evaluation factors and walking behavior factors are presented in Fig. 5 as box plots with paired point plots. These box plots visualize a comparison of the median and distribution of responses under the different eHMI conditions. These paired-point plots show average factor values for each participant in three trials per eHMI condition. Lines between conditions indicate changes in the relevant factors for each participant. The green line shows higher average factor values on the right condition, while the red line shows the opposite.
This experiment aims to use various eHMI conditions to influence pedestrians’ subjective evaluations and walking behaviors when interacting with APMVs, facilitating causal analysis among these variables. To validate this motivation, the Friedman test was performed to determine whether there were differences in each factor among four eHMI conditions, as the Shapiro-Wilk test indicated that the results for each factor did not conform to a normal distribution. The results of the Friedman test are shown in Table III that all factors had significant differences among the four eHMI conditions, respectively. After that, the Wilcoxon signed-rank tests with Benjamini/Hochberg FDR corrections were used as post-hoc pairwise comparisons of the main effect of eHMI conditions on subjective evaluations and walking time durations, as shown in Table IV.
| Factor | Condition A | Condition B | Mean(A) | Std(A) | Mean(B) | Std(B) | W | p-Adj | CLES | |
| Q1 Understand | Early eHMI | Late eHMI | 4.571 | 0.643 | 3.587 | 1.205 | 42.0 | <.001 *** | 0.757 | |
| Early eHMI | No eHMI | 4.571 | 0.643 | 3.278 | 1.196 | 46.0 | <.001 *** | 0.816 | ||
| Early eHMI | Sync eHMI | 4.571 | 0.643 | 4.429 | 0.688 | 76.0 | .122 | 0.560 | ||
| Late eHMI | No eHMI | 3.587 | 1.205 | 3.278 | 1.196 | 188.0 | .157 | 0.579 | ||
| Late eHMI | Sync eHMI | 3.587 | 1.205 | 4.429 | 0.688 | 58.5 | <.001 *** | 0.291 | ||
| No eHMI | Sync eHMI | 3.278 | 1.196 | 4.429 | 0.688 | 15.5 | <.001 *** | 0.216 | ||
| Q2 Predict | Early eHMI | Late eHMI | 4.437 | 0.805 | 3.540 | 1.099 | 74.0 | <.001 *** | 0.762 | |
| Early eHMI | No eHMI | 4.437 | 0.805 | 3.302 | 1.157 | 81.0 | <.001 *** | 0.788 | ||
| Early eHMI | Sync eHMI | 4.437 | 0.805 | 4.294 | 0.707 | 128.0 | .145 | 0.592 | ||
| Late eHMI | No eHMI | 3.540 | 1.099 | 3.302 | 1.157 | 195.5 | .099 | 0.562 | ||
| Late eHMI | Sync eHMI | 3.540 | 1.099 | 4.294 | 0.707 | 61.5 | <.001 *** | 0.297 | ||
| No eHMI | Sync eHMI | 3.302 | 1.157 | 4.294 | 0.707 | 55.0 | <.001 *** | 0.253 | ||
| Q3 Dangerous | Early eHMI | Late eHMI | 1.905 | 0.969 | 2.254 | 1.109 | 121.0 | .076 | 0.411 | |
| Early eHMI | No eHMI | 1.905 | 0.969 | 2.675 | 1.233 | 84.5 | .002 ** | 0.312 | ||
| Early eHMI | Sync eHMI | 1.905 | 0.969 | 1.849 | 0.856 | 156.0 | .434 | 0.507 | ||
| Late eHMI | No eHMI | 2.254 | 1.109 | 2.675 | 1.233 | 156.0 | .066 | 0.400 | ||
| Late eHMI | Sync eHMI | 2.254 | 1.109 | 1.849 | 0.856 | 119.0 | .040 * | 0.600 | ||
| No eHMI | Sync eHMI | 2.675 | 1.233 | 1.849 | 0.856 | 55.0 | <.001 *** | 0.700 | ||
| Q4 Trust | Early eHMI | Late eHMI | 4.087 | 0.899 | 3.730 | 1.023 | 139.0 | .040 * | 0.598 | |
| Early eHMI | No eHMI | 4.087 | 0.899 | 3.254 | 1.229 | 51.5 | <.001 *** | 0.689 | ||
| Early eHMI | Sync eHMI | 4.087 | 0.899 | 4.167 | 0.766 | 156.0 | .629 | 0.480 | ||
| Late eHMI | No eHMI | 3.730 | 1.023 | 3.254 | 1.229 | 75.5 | .010 * | 0.613 | ||
| Late eHMI | Sync eHMI | 3.730 | 1.023 | 4.167 | 0.766 | 71.0 | .005 ** | 0.381 | ||
| No eHMI | Sync eHMI | 3.254 | 1.229 | 4.167 | 0.766 | 25.5 | <.001 *** | 0.285 | ||
| Q5 Relief | Early eHMI | Late eHMI | 3.976 | 1.083 | 3.817 | 0.960 | 105.0 | .149 | 0.562 | |
| Early eHMI | No eHMI | 3.976 | 1.083 | 3.413 | 1.207 | 86.0 | .022 * | 0.642 | ||
| Early eHMI | Sync eHMI | 3.976 | 1.083 | 4.048 | 1.035 | 156.5 | .637 | 0.489 | ||
| Late eHMI | No eHMI | 3.817 | 0.960 | 3.413 | 1.207 | 133.0 | .049 * | 0.598 | ||
| Late eHMI | Sync eHMI | 3.817 | 0.960 | 4.048 | 1.035 | 99.5 | .082 | 0.422 | ||
| No eHMI | Sync eHMI | 3.413 | 1.207 | 4.048 | 1.035 | 120.0 | .022 * | 0.351 | ||
| Q6 Hesitant | Early eHMI | Late eHMI | 2.071 | 1.081 | 2.722 | 1.262 | 96.5 | .005 ** | 0.348 | |
| Early eHMI | No eHMI | 2.071 | 1.081 | 3.230 | 1.237 | 57.5 | <.001 *** | 0.249 | ||
| Early eHMI | Sync eHMI | 2.071 | 1.081 | 2.024 | 0.834 | 195.0 | .864 | 0.483 | ||
| Late eHMI | No eHMI | 2.722 | 1.262 | 3.230 | 1.237 | 143.5 | .017 * | 0.389 | ||
| Late eHMI | Sync eHMI | 2.722 | 1.262 | 2.024 | 0.834 | 52.0 | <.001 *** | 0.654 | ||
| No eHMI | Sync eHMI | 3.230 | 1.237 | 2.024 | 0.834 | 17.5 | <.001 *** | 0.780 | ||
| CIT | Early eHMI | Late eHMI | 2.757 | 0.529 | 3.344 | 0.941 | 56.0 | <.001 *** | 0.322 | |
| Early eHMI | No eHMI | 2.757 | 0.529 | 3.318 | 0.759 | 54.0 | <.001 *** | 0.277 | ||
| Early eHMI | Sync eHMI | 2.757 | 0.529 | 2.818 | 0.508 | 339.0 | .196 | 0.470 | ||
| Late eHMI | No eHMI | 3.344 | 0.941 | 3.318 | 0.759 | 413.5 | .831 | 0.484 | ||
| Late eHMI | Sync eHMI | 3.344 | 0.941 | 2.818 | 0.508 | 89.5 | <.001 *** | 0.656 | ||
| No eHMI | Sync eHMI | 3.318 | 0.759 | 2.818 | 0.508 | 55.0 | <.001 *** | 0.694 | ||
| CT | Early eHMI | Late eHMI | 1.149 | 0.150 | 1.262 | 0.186 | 60.5 | <.001 *** | 0.312 | |
| Early eHMI | No eHMI | 1.149 | 0.150 | 1.175 | 0.163 | 335.5 | .228 | 0.471 | ||
| Early eHMI | Sync eHMI | 1.149 | 0.150 | 1.156 | 0.122 | 323.5 | .247 | 0.481 | ||
| Late eHMI | No eHMI | 1.262 | 0.186 | 1.175 | 0.163 | 133.5 | <.001 *** | 0.657 | ||
| Late eHMI | Sync eHMI | 1.262 | 0.186 | 1.156 | 0.122 | 59.5 | <.001 *** | 0.677 | ||
| No eHMI | Sync eHMI | 1.175 | 0.163 | 1.156 | 0.122 | 330.5 | .237 | 0.516 | ||
| ACT | Early eHMI | Late eHMI | 0.946 | 0.127 | 0.990 | 0.111 | 83.0 | <.001 *** | 0.390 | |
| Early eHMI | No eHMI | 0.946 | 0.127 | 0.953 | 0.120 | 389.5 | .539 | 0.478 | ||
| Early eHMI | Sync eHMI | 0.946 | 0.127 | 0.942 | 0.115 | 348.0 | .562 | 0.523 | ||
| Late eHMI | No eHMI | 0.990 | 0.111 | 0.953 | 0.120 | 204.5 | .007 ** | 0.585 | ||
| Late eHMI | Sync eHMI | 0.990 | 0.111 | 0.942 | 0.115 | 71.5 | <.001 *** | 0.623 | ||
| No eHMI | Sync eHMI | 0.953 | 0.120 | 0.942 | 0.115 | 358.0 | .526 | 0.527 | ||
|
||||||||||
IV-C Direct Causal Relationships and Their Statistical Reliability
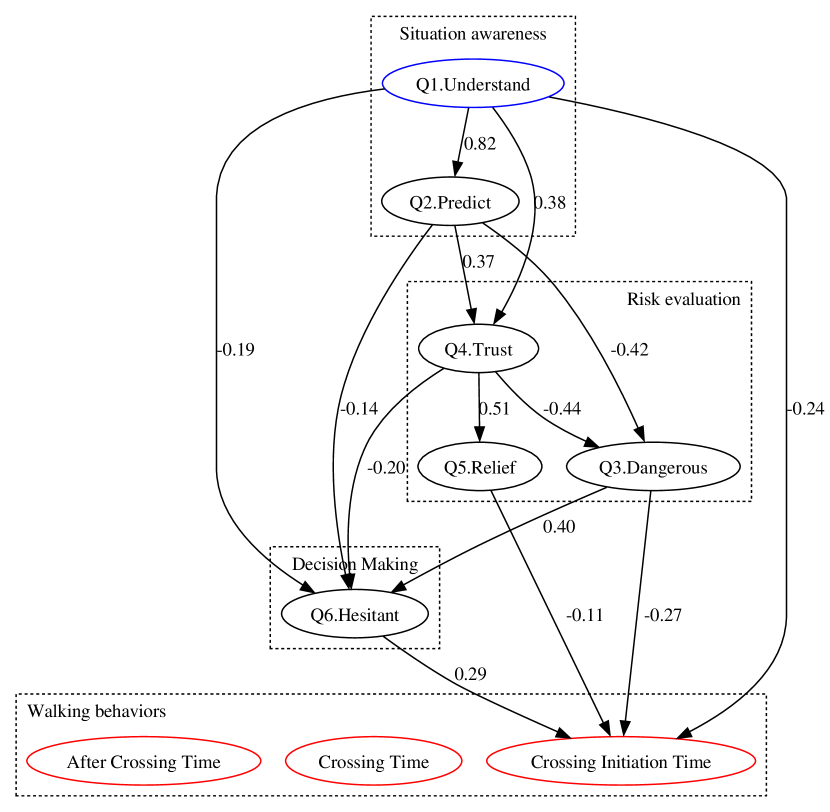
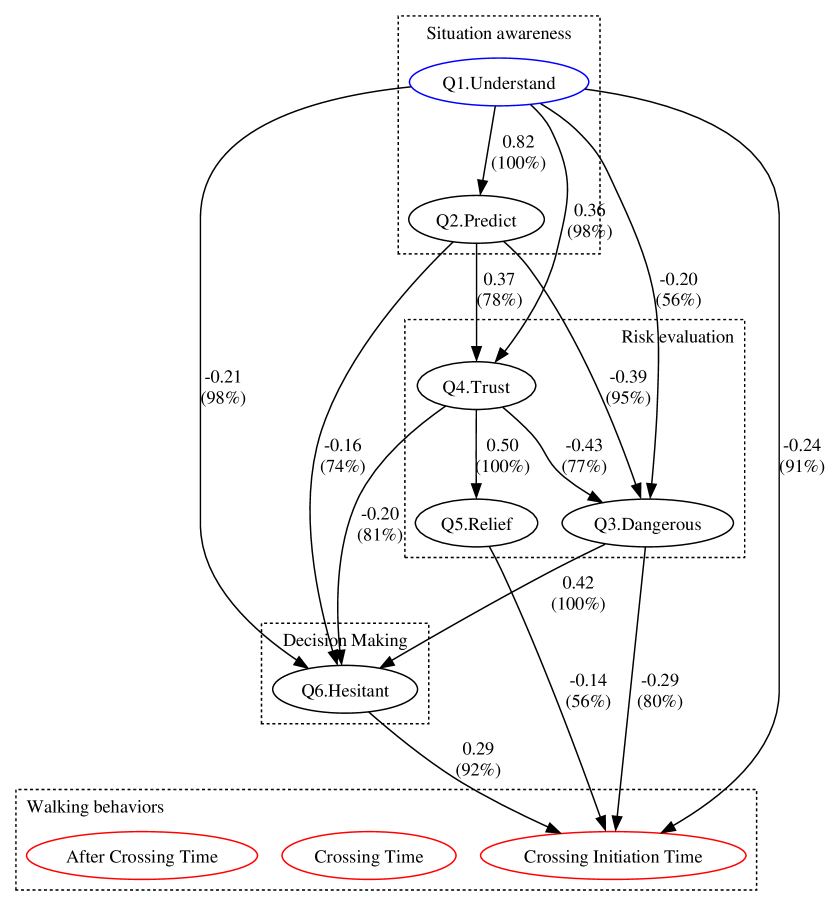
The direct causal relationship consists of two parts: the direct causal path and the direct causal effect. The estimated direct causal relationships using DirectLiNGAM are shown in Fig. 7. Arrows between nodes indicate the direct causal path. The value next to each arrow represents the direct causal effect, corresponding to elements of the adjacency matrix.
To verify the statistical reliability of the estimated direct causal relationships, the bootstrap method was applied [33]. Specifically, bootstrap resampling was conducted to generate new datasets by repeated random sampling from the measured dataset. Each resampled dataset retains the same size as the measured dataset. A total of 5,000 times of bootstrap resampling were performed, generating 5,000 new datasets. For each dataset, DirectLiNGAM was used to conduct causal discovery and independently estimate the adjacency matrix . Thereafter, the 5,000 adjacency matrices of were aggregated to calculate the median direct causal effects of non-zero elements and their probability of occurrence, i. e., the reproducibility probability of the direct causal relationships. Figure 7 shows the estimated median direct causal effects with reproducibility probabilities greater than 30%, as determined from the 5,000 bootstrap with DirectLiNGAM. The reproducibility probability for each direct causal relationship is labeled next to each arrow in Fig. 7.
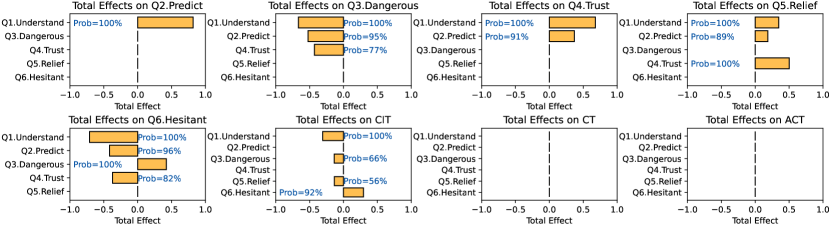
IV-D Total Causal Effects and Their Statistical Reliability
Total causal effect quantifies the change in the effect variable when the cause variable is altered (i. e., intervention) [34]. It includes both direct causal effects and indirect causal effects from the cause variable to the effect variable via a causal path (the causal path includes one or more direct causal paths among variables).
To calculate a more reliable total effect, the bootstrap method was also used 5,000 times. The bootstrap outputs the medians of total causal effects and their reproducibility probabilities (i. e., the probabilities of whether total effects are non-zero) over the DirectLiNGAM results via bootstrap samplings.
Since Q1 is assumed to be an exogenous variable, unaffected by other variables but capable of influencing them, the total causal effects of the other variables on Q2-Q6, as well as on CIT, CT, and ACT, were calculated separately. These total causal effects with reproducibility probabilities exceeding 30% are presented in Fig. 8.
V DISCUSSION
V-A Causal Discovery from subjective evaluations to Walking Behaviors
The direct causal relationships between the factors and the results of their bootstrap-based statistical reliability are shown in Figs. 7 and 7, respectively. All the direct causal relationships between factors shown in Fig. 7 are confirmed to have at least 56% reliability as shown in Fig. 7. The only difference is that, compared to the causal relationship discovered directly from the collected data, a new direct causal relationship from Q1 to Q3 is discovered after using 5000 times of bootstrap, with a reliability of 56%. This suggests that as the number of participants increases further, understanding the driving intention may directly affect their sense of danger during encounters with the APMV.
Overall, the general flow of the results from causal discovery aligns with the hypothesized model (see Fig. 2), where the outcomes of situation awareness lead to risk evaluation, the outcomes of risk evaluation lead to hesitation in decision-making, and the outcomes of hesitation lead to walking behaviors.
Next, we will discuss in detail the findings of causal effects on each factor by combining their reliable direct causal effects (see Fig. 7) and total causal effects (see Fig. 8).
V-A1 Causal Effects on the Prediction of APMV’s behaviors
Fig. 7 shows a high reproducibility probability (100%) direct causal relationship from Q1 to Q2. Furthermore, Fig. 8 also shows that the total causal effect on Q2 was attributed solely to Q1. Those results suggest that the participants’ understanding of the APMV’s driving intentions (Q1) positively affects their prediction (Q2) of the APMV’s driving behavior.
This result aligned with the process of situation awareness [23] in the hypothesized model (see Fig. 2). Additionally, [20, 19, 35] also mentions that a good understanding of the intentions of automation systems, such as AVs or APMVs, can improve the user’s ability to predict the behavior of these systems.
V-A2 Causal Effects on the Trust in APMV
Moreover, Fig. 7 shows that participants’ trust in APMV (Q4) tends to increase if the driving intentions of APMV could be easily understood (Q1) and the driving behavior could be easily predicted (Q2). This indicates that the understanding of pedestrians about the driving intentions of APMV and the prediction of its behaviors were significant factors in their trust in APMV. This understanding ensuring that their trust is well–founded rather than based on unwarranted reliance.
This finding is consistent with the results of [36, 37, 20, 38] in the interactions between humans and AV. In addition, Yang et al. [39] introduced from another perspective that the higher the transparency of an automation system, the more users tend to trust the system. Similarly, M. Faas et al. [40] used an eHMI to enhance the transparency of an AV system by displaying its status and intentions, which can improve pedestrian trust. These studies also indirectly indicate that users’ situational awareness of the automation system influences their trust in the system.
We considered that the above results and conclusions contribute to an important topic in human-machine systems: the calibration for human’s trust in automation systems. Specifically, Holländer et al. [41], Kaleefathullah et al. [42] reported that during interactions between pedestrians and AVs equipped with eHMIs, there is a potential risk that pedestrians develop overtrust in the eHMI and the AV, which could lead to unsafe situations. Therefore, we consider that, to calibrate the trust of human (i. e., pedestrians in this study) in automation systems, it is necessary to help them calibrate their situation models (see Fig. 2). Furthermore, Endsley [25] suggested that the situation model is supported by the mental model, which provides the necessary prior knowledge for situation awareness. Meanwhile, [43, 44] pointed out that the mental model is a highly organized and dynamic knowledge structure. It serves as an internal representation of a target system that contains meaningful declarative and procedural knowledge derived from long-term experience and study. Therefore, in summary, to calibrate the trust of humans (i. e., pedestrians in this study) in automation systems (i. e., the APMV in this study), it is essential to calibrate their mental model of the automation system. For example, some studies suggested the use of pre-instruction [20] and educational HMI [45] to help users develop an accurate mental model.
V-A3 Causal Effects on the sense of relief
From Fig. 7, we found that pedestrians feel relief (Q5) during interactions with an APMV only when they have established sufficient trust (Q4) in it, as Q4 was identified as the only direct causal effect on Q5, with a reproducibility probability of 100%. In fact, this result can be used to explain the findings in [20], which showed that when pedestrians have higher trust in AVs, they also experience a greater sense of relief when crossing the road.
From the total causal effects on Q5, Fig. 8 shows that, in addition to the direct causal effect from the trust in APMV (Q4), understanding the APMV’s driving intentions (Q1) and predicting its driving behavior (Q2) also have indirect effects on the sense of relief (Q5). This result further shows that pedestrians’ trust, based on their understanding of the APMV’s driving intention, improves their sense of relief during interactions with the APMV.
V-A4 Causal Effects on the sense of danger
We found that Q1, Q2, and Q4 have negative direct causal effects on Q3, as shown in Fig. 7. Similarly, Fig. 8 shows that only the above three factors (Q1, Q2, and Q4) have negative total causal effects on Q3. These findings suggest that participants experience a marked increase in perceived danger when they face challenges in understanding the APMV’s driving intentions, encounter difficulties in predicting its driving behavior, and exhibit a lack of trust in the APMV. This result corresponds to [20], noting that inadequate situational awareness of AVs heightens pedestrians’ perceived danger. Moreover, de Clercq et al. [14] demonstrated that clear AV driving intentions reduce this perceived risk. Similarly, Liu et al. [1] found that diminished comprehension of APMV driving intentions raises the conditional probability of perceived danger. Moreover, Kenesei et al. [46] observed that trust in the AV’s performance can reduce the user’s perceived risk, which aligns with our findings. In contrast, Zhang et al. [47] reported that perceived risk can inversely affect users’ initial trust in AVs. We hypothesize that, in human-machine systems, initial trust is influenced by subjective risk. Once trust reaches a certain level, it begins to inversely affect subjective risk. This hypothesis needs to be further validated in future studies.
V-A5 Causal Effects on the hesitation in decision-making
For both the direct and total causal effects, as shown in Fig. 7 and Fig. 8, Q6 was negatively influenced by Q1, Q2, and Q4, while being positively influenced by Q3. This suggests that participants showed increased hesitation in decision-making when they struggled to comprehend the APMV’s driving intentions, predict its behavior, had lower trust, and perceived higher danger.
This aligns with Liu et al. [1] regarding pedestrians’ subjective evaluations during encounters with AVs. However, [1] did not clarify the causal relationships between these factors. Additionally, Yang et al. [48] found that when pedestrians could better understand the AV’s intentions through eHMI, they turned their heads less before crossing the street, which means they greater confidence and reduced uncertainty in the crossing. The confidence in crossing the street observed here can also be interpreted as being negatively correlated with hesitation in decision-making. In other words, when pedestrians can more easily understand the AV’s intentions, their hesitation in decision-making decreases, which aligns with our finding.
V-A6 Causal Effects on Walking behaviors
Interestingly, in pedestrians’ walking behaviors, except for CIT, although Tables III and IV show significant differences in CT and ACT under different eHMI conditions, Fig. 7 and Fig. 8 indicated that ACT and CT are independent with no direct or total causal relationship with other factors of subjective evaluation. This could be considered as the subjective evaluations of different evaluations are similar for CT and ACT within the same eHMI condition (see Fig. 5). This is also reflected in Table II, where the correlation coefficients between CT and Q1-Q6, as well as ACT and Q1-Q6, are close to 0.
On the other hand, Figs. 7 and 8 show that CIT was negatively affected by Q1, Q3, Q5, and positively affected by Q6. Easier understanding in driving intention and higher sense of relief, allow pedestrians to start crossing the road more quickly, thereby shortening their CIT. In contrast, hesitation has a positive impact, delaying the initiation of crossing. The above findings are consistent with the conclusions of [15, 48], which suggested that when pedestrians can easily understand the driving intentions of AVs conveyed through eHMIs, their CIT was reduced. Furthermore, Lee et al. [16, 49] reported that as pedestrians become more familiar with the information displayed on eHMIs, meaning they are better able to understand these information, their CIT decreases.
Additionally, there seems to be a perplexing result where the direct causal effect from Q3 to CIT was negative, i. e., , shown in Fig. 7, but the correlation coefficient between Q3 and CIT was positive, i. e., , shown in Table II. This could be considered because correlation analysis focuses on the relation between two variables, whereas DirectLiNGAM based on SEM involves a multivariate linear regression analysis. Further evidence lies in the fact that while Q3 had a direct causal effect of on CIT (a negative influence, meaning increased perception of danger delays crossing initiation), its total causal effect on CIT is , which was smaller than the direct causal effect. This suggests that Q3 has a positive indirect causal effect on CIT through Q6. In other words, the perception of danger (Q3) increases hesitation (Q6), which in turn increases CIT, partially offsetting the negative direct effect.
V-B Effects of eHMI Conditions on Subjective Evaluations and Walking Behaviors based on Causal Discovery Results
Firstly, an obvious result is that the post-hoc multiple comparisons (see Table IV) did not reveal significant differences between Early eHMI and Sync eHMI in their effects on the six subjective evaluations and three walking behaviors. We considered that the limited size of the experimental site (see Fig. 3) resulted in a time difference of only about one second between the information cues of Early eHMI and Sync eHMI. This minor time difference was likely imperceptible to the participants, as a few participants reported after the experiment that they did not perceive any distinction in the timing of information cue between Early eHMI and Sync eHMI.
Secondly, guided by the causal discovery results in Fig. 7, the results of the post-hoc multiple comparisons in Table IV are further discussed. Since only under the conditions of Early eHMI and Sync eHMI was the driving intention of the APMV conveyed to participants via eHMI before the vehicle came to a stop, participants perceived the APMV’s driving intentions to be significantly easier to understand (Q1), which directly led to significantly easier to predict the driving behaviors (Q2), in these two conditions compared to Late eHMI and No eHMI, respectively. This suggests that providing anticipated information about future behaviors via eHMI before the APMV stops significantly enhances pedestrians’ situation awareness of the interaction, i. e., comprehension of the APMV’s driving intentions and their ability to predict driving behaviors.
The above result also directly led to both Early eHMI and Sync eHMI significantly improving participants’ trust in the APMV (Q4) compared to No eHMI and Late eHMI. Additionally, since stop-related information was displayed on the eHMI after stopping under Late eHMI but not under No eHMI, the trust in the APMV was significantly higher in the Late eHMI condition than in No eHMI. This suggests that the driving intention information provided by the eHMIs can enhanced participants’ trust in the APMV, with Late eHMI being less effective than Early eHMI and Sync eHMI, although still better than No eHMI.
This significant improvement in trust also led to participants feeling significantly more relieved (Q5) when interacting with the APMV under eHMI conditions with information cues, i. e., Early eHMI, Sync eHMI, and Late eHMI, compared to No eHMI. This suggests that providing participants with information about the APMV’s driving intentions through eHMI during encounters can help participants feel more relief when crossing the road.
Similarly, under the conditions of Early eHMI, Sync eHMI, and Late eHMI, the significant improvements in situational awareness and trust led to a significant reduction in participants’ perceived danger (Q3) during the interaction with the APMV, compared to No eHMI. Furthermore, considering that in the Early eHMI condition, the eHMI information was displayed earlier than the APMV’s deceleration, there was no significant difference in perceived danger between Early eHMI and Late eHMI. This suggests that the alignment of explicit and implicit information during the interaction between the APMV and pedestrians impacts the pedestrians’ perception of danger.
Under the Sync eHMI condition, the synchronized display of the APMV’s driving intentions through eHMI enhanced participants’ situational awareness, increased their trust in the APMV, and reduced their perceived danger, resulting in a significant reduction in hesitation (Q6) when making decisions, compared to all other conditions. Additionally, Early eHMI significantly reduced participants’ hesitation compared to Late eHMI and No eHMI, while Late eHMI was more effective than No eHMI in reducing hesitation. Overall, these results suggest that providing eHMI information can reduce participants’ hesitation, with Sync eHMI being the most effective.
Furthermore, the Early eHMI and Sync eHMI enhanced pedestrians’ situational awareness, builded trust in the APMV, and reduce feelings of danger. As a result, they minimized pedestrians’ hesitation when making crossing decisions, ultimately shortening their CIT and increasing the efficiency of walking behaviors.
Although Fig. 7 shows that CT and ACT are independent of the subjective evaluation factors, we found that participants’ CT and ACT were significantly longer under the Late eHMI condition compared to other eHMI conditions, as shown in Table IV. We considered that only under the Late eHMI condition does the APMV continue displaying “I stopped” after coming to a stop, until the participant finishes crossing and the vehicle resumes moving. This information reassures participants that the APMV will not move, allowing them to cross the road without haste. Although this finding was not validated by the causal discovery in this study, we will focus on it in future work.
In summary, this study found that it is important to convey information on the APMV’s driving intentions to pedestrians through eHMI when there is a change in driving behavior or before such a change occurs. Specifically, this information enhances pedestrians’ situational awareness and trust in APMVs, reduces perceived risks during interactions, enables quicker decision-making, and shortens the crossing initiation time, thereby improving the efficiency of the interaction.
V-C Limitations
The majority of participants in this study were from Asia, and cultural differences may have influenced their perceptions and behaviors, potentially leading to biases in the experimental results. Most of the participants self-identified as male, which may introduce gender-related factors that could affect the outcomes of the experiment, potentially limiting the generalizability of the results to other gender groups. Since the purpose of this study is causal discovery, a scenario without passengers was simulated to induce participants to have varying degrees of subjective evaluations and walking behaviors during their interaction with the APMV. Interactions between pedestrians and the APMV with passengers require further investigation. The design of the APMV and its eHMI is diverse, and the results of this experiment may be limited by the specific wheelchair-shaped APMV and eHMI design used in this study.
VI Conclusion
This study investigated the causal relationships from pedestrians’ subjective evaluations to their walking behavior during interactions with APMV. In the experiment, various eHMIs were designed to induce participants to experience different levels of subjective evaluations and generate corresponding walking behaviors. DirectLiNGAM was employed for causal discovery, and the results were consistent with the hypothesized model shown in Fig. 2. Furthermore, the experimental results enriched the detailed causal relationships in the hypothetical model, such as how the outcomes of situation awareness leaded to a sense of danger, trust in APMV, and a sense of relief; how situation awareness, the sense of danger, and trust in APMV contributed to hesitation in decision-making; and how situation awareness, the sense of danger, and hesitation influenced walking behaviors. Finally, this study found that when the APMV conveyed its driving intentions to pedestrians through eHMI during or before changes in driving behavior, it enhanced subjective evaluations of pedestrians and made their walking behaviors more efficient during interactions.
ACKNOWLEDGMENTS
This work was supported by JSPS KAKENHI Grant Numbers 20K19846 and 22H00246, Japan.
Conflict of Interest Statement
The authors declare that the research was conducted in the absence of any commercial or financial relationships that could be construed as a potential conflict of interest.
CRediT author statement
Hailong Liu: Conceptualization, Investigation, Methodology, Software, Validation, Formal analysis, Project administration, Funding acquisition, Writing - Original Draft.
Yang Li: Methodology, Investigation, Writing - review & editing.
Toshihiro Hiraoka: Conceptualization, Methodology, Writing - review & editing.
Takahiro Wada: Methodology, Writing - review & editing.
References
- Liu et al. [2023] H. Liu, T. Hirayama, L. Y. M. Saiki, and H. Murase, “Implicit interaction with an autonomous personal mobility vehicle: Relations of pedestrians’ gaze behavior with situation awareness and perceived risks,” International Journal of HumanâComputer Interaction, vol. 39, no. 10, pp. 2016–2032, 2023.
- Liu et al. [2024a] H. Liu, Y. Li, Z. Zeng, H. Cheng, C. Peng, and T. Wada, “Is silent ehmi enough? a passenger-centric study on effective ehmi for autonomous personal mobility vehicles in the field,” International Journal of HumanâComputer Interaction, 2024.
- SAE Technical Standards Board [2018] SAE Technical Standards Board, “J3016b: Taxonomy and definitions for terms related to driving automation systems for on-road motor vehicles.” SAE International, 2018, pp. 1–35.
- Morales et al. [2017] L. Y. Morales, T. Miyashita, and N. Hagita, “Social robotic wheelchair centered on passenger and pedestrian comfort,” Robotics and Autonomous Systems, vol. 87, pp. 355–362, 2017.
- Watanabe et al. [2015] A. Watanabe, T. Ikeda, Y. Morales, K. Shinozawa, T. Miyashita, and N. Hagita, “Communicating robotic navigational intentions,” in 2015 IEEE/RSJ International Conference on Intelligent Robots and Systems (IROS). IEEE, 2015, pp. 5763–5769.
- Andersen et al. [2016] H. Andersen, Y. H. Eng, W. K. Leong, C. Zhang, H. X. Kong, S. Pendleton, M. H. Ang, and D. Rus, “Autonomous personal mobility scooter for multi-class mobility-on-demand service,” in 2016 IEEE 19th International Conference on Intelligent Transportation Systems (ITSC). IEEE, 2016, pp. 1753–1760.
- Morales et al. [2018] L. Y. Morales, N. Akai, and H. Murase, “Personal mobility vehicle autonomous navigation through pedestrian flow: A data driven approach for parameter extraction,” in IEEE/RSJ IROS. IEEE, 2018, pp. 3438–3444.
- Isono et al. [2022] Y. Isono, H. Yoshitake, and M. Shino, “Autonomous navigation method considering passenger comfort recognition for personal mobility vehicles in crowded pedestrian spaces,” in International Joint Conference on Computer Vision, Imaging and Computer Graphics. Springer, 2022, pp. 182–202.
- Yoshitake et al. [2023] H. Yoshitake, Y. Isono, and M. Shino, “Pedestrian avoidance method considering passenger comfort for autonomous personal mobility vehicles,” Journal of Robotics and Mechatronics, vol. 35, no. 2, pp. 231–239, 2023.
- Liu et al. [2024b] H. Liu, S. Inoue, and T. Wada, “Subjective vertical conflict model with visual vertical: Predicting motion sickness on autonomous personal mobility vehicles,” IEEE Transactions on Intelligent Transportation Systems, 2024.
- Liu et al. [2020] H. Liu, T. Hirayama, L. Y. Morales, and H. Murase, “What timing for an automated vehicle to make pedestrians understand its driving intentions for improving their perception of safety?” in 2020 IEEE 23rd International Conference on Intelligent Transportation Systems (ITSC), 2020, pp. 1–6.
- Yamin and Park [2023] P. A. Yamin and J. Park, “Where did that come from? the effects of ehmi approach angle of an automated personal mobility vehicle (apmv) on pedestrian crossing behavior,” in Adjunct Proceedings of the 15th International Conference on Automotive User Interfaces and Interactive Vehicular Applications, 2023, pp. 203–208.
- Chang et al. [2017] C.-M. Chang, K. Toda, D. Sakamoto, and T. Igarashi, “Eyes on a car: an interface design for communication between an autonomous car and a pedestrian,” in Proceedings of the 9th international conference on automotive user interfaces and interactive vehicular applications, 2017, pp. 65–73.
- de Clercq et al. [2019] K. de Clercq, A. Dietrich, J. P. N. Velasco, J. de Winter, and R. Happee, “External human-machine interfaces on automated vehicles: Effects on pedestrian crossing decisions,” Human Factors, vol. 61, no. 8, pp. 1353–1370, 2019.
- Loew et al. [2022] A. Loew, J. Graefe, L. Heil, A. Guthardt, A. Boos, A. Dietrich, and K. Bengler, “Go ahead, please!―evaluation of external human―machine interfaces in a real-world crossing scenario,” Frontiers in Computer Science, vol. 4, p. 863072, 2022.
- Lee et al. [2022] Y. M. Lee, R. Madigan, C. Uzondu, J. Garcia, R. Romano, G. Markkula, and N. Merat, “Learning to interpret novel ehmi: The effect of vehicle kinematics and ehmi familiarity on pedestrian’crossing behavior,” Journal of safety research, vol. 80, pp. 270–280, 2022.
- Dey et al. [2021] D. Dey, A. Matviienko, M. Berger, B. Pfleging, M. Martens, and J. Terken, “Communicating the intention of an automated vehicle to pedestrians: The contributions of ehmi and vehicle behavior,” it-Information Technology, vol. 63, no. 2, pp. 123–141, 2021.
- Zhang et al. [2024] X. Zhang, Z. Song, Q. Huang, Z. Pan, W. Li, R. Gong, and B. Zhao, “Shared ehmi: Bridging human–machine understanding in autonomous wheelchair navigation,” Applied Sciences, vol. 14, no. 1, p. 463, 2024.
- Liehr et al. [2024] D. Liehr, I. Kreißig, J. Siegmund, S. Creutz, H. Meißner, and J. Krems, “Do you know what’s going on?–examining situation awareness for different communication concepts of an e-cargo bike autonomous parking function,” Human Interaction and Emerging Technologies (IHIET-AI 2024): Artificial Intelligence and Future Applications, vol. 120, no. 120, 2024.
- Liu et al. [2021] H. Liu, T. Hirayama, and M. Watanabe, “Importance of instruction for pedestrian-automated driving vehicle interaction with an external human machine interface: Effects on pedestrians’ situation awareness, trust, perceived risks and decision making,” in 2021 IEEE Intelligent Vehicles Symposium (IV). IEEE, 2021, pp. 748–754.
- Faas et al. [2020] S. M. Faas, L.-A. Mathis, and M. Baumann, “External hmi for self-driving vehicles: Which information shall be displayed?” Transportation research part F: traffic psychology and behaviour, vol. 68, pp. 171–186, 2020.
- Liu et al. [2024c] H. Liu, Y. Li, T. Hiraoka, and T. Wada, “Causal discovery from psychological states to walking behaviors for pedestrians interacting an apmv equipped with ehmis,” in 2024 IEEE Intelligent Vehicles Symposium (IV). IEEE, 2024, pp. 2976–2982.
- Endsley [1995] M. R. Endsley, “Toward a theory of situation awareness in dynamic systems,” Human factors, vol. 37, no. 1, pp. 32–64, 1995.
- Wilde [1982] G. J. Wilde, “The theory of risk homeostasis: implications for safety and health,” Risk analysis, vol. 2, no. 4, pp. 209–225, 1982.
- Endsley [2000] M. R. Endsley, “Situation models: An avenue to the modeling of mental models,” in Proceedings of the Human Factors and Ergonomics Society Annual Meeting, vol. 44, no. 1. SAGE Publications Sage CA: Los Angeles, CA, 2000, pp. 61–64.
- Kim et al. [2020] W. Kim, N. Kim, J. B. Lyons, and C. S. Nam, “Factors affecting trust in high-vulnerability human-robot interaction contexts: A structural equation modelling approach,” Applied ergonomics, vol. 85, p. 103056, 2020.
- Chen et al. [2024] Y. Chen, X. Wu, F. Jia, J. Yang, X. Bai, and R. Yu, “Exploring the impact of social robot design characteristics on users’ privacy concerns: Evidence from pls-sem and fsqca,” International Journal of Human–Computer Interaction, pp. 1–22, 2024.
- Nordhoff et al. [2021] S. Nordhoff, R. Madigan, B. Van Arem, N. Merat, and R. Happee, “Interrelationships among predictors of automated vehicle acceptance: A structural equation modelling approach,” Theoretical Issues in Ergonomics Science, vol. 22, no. 4, pp. 383–408, 2021.
- Li et al. [2024] X. Li, Z. You, X. Ma, X. Pang, X. Min, and H. Cui, “Effect of autonomous vehicles on car-following behavior of human drivers: Analysis based on structural equation models,” Physica A: Statistical Mechanics and its Applications, vol. 633, p. 129360, 2024.
- Shimizu et al. [2006] S. Shimizu, P. O. Hoyer, A. Hyvärinen, A. Kerminen, and M. Jordan, “A linear non-gaussian acyclic model for causal discovery.” Journal of Machine Learning Research, vol. 7, no. 10, 2006.
- Shimizu et al. [2011] S. Shimizu, T. Inazumi, Y. Sogawa, A. Hyvarinen, Y. Kawahara, T. Washio, P. O. Hoyer, K. Bollen, and P. Hoyer, “Directlingam: A direct method for learning a linear non-gaussian structural equation model,” Journal of Machine Learning Research-JMLR, vol. 12, no. Apr, pp. 1225–1248, 2011.
- Cao et al. [2019] Z. Cao, G. Hidalgo Martinez, T. Simon, S. Wei, and Y. A. Sheikh, “Openpose: Realtime multi-person 2d pose estimation using part affinity fields,” IEEE Transactions on Pattern Analysis and Machine Intelligence, 2019.
- Thamvitayakul et al. [2012] K. Thamvitayakul, S. Shimizu, T. Ueno, T. Washio, and T. Tashiro, “Bootstrap confidence intervals in directlingam,” in 2012 IEEE 12th International Conference on Data Mining Workshops. IEEE, 2012, pp. 659–668.
- Bollen [1989] K. A. Bollen, Model Notation, Covariances, and Path Analysis. John Wiley & Sons, Ltd, 1989, ch. Two, pp. 10–39.
- Kuge et al. [2024] M. Kuge, H. Liu, T. Hiraoka, and T. Wada, “An ehmi presenting request-to-intervene status of level 3 automated vehicles to surrounding vehicles,” in 2024 IEEE Intelligent Vehicles Symposium (IV). IEEE, 2024, pp. 2970–2975.
- Verberne et al. [2012] F. M. Verberne, J. Ham, and C. J. Midden, “Trust in smart systems: Sharing driving goals and giving information to increase trustworthiness and acceptability of smart systems in cars,” Human factors, vol. 54, no. 5, pp. 799–810, 2012.
- Petersen et al. [2019] L. Petersen, L. Robert, X. J. Yang, and D. M. Tilbury, “Situational awareness, drivers trust in automated driving systems and secondary task performance,” arXiv preprint arXiv:1903.05251, 2019.
- Avetisyan et al. [2022] L. Avetisyan, J. Ayoub, and F. Zhou, “Investigating explanations in conditional and highly automated driving: The effects of situation awareness and modality,” Transportation research part F: traffic psychology and behaviour, vol. 89, pp. 456–466, 2022.
- Yang et al. [2017] X. J. Yang, V. V. Unhelkar, K. Li, and J. A. Shah, “Evaluating effects of user experience and system transparency on trust in automation,” in Proceedings of the 2017 ACM/IEEE international conference on human-robot interaction, 2017, pp. 408–416.
- M. Faas et al. [2021] S. M. Faas, J. Kraus, A. Schoenhals, and M. Baumann, “Calibrating pedestrians’ trust in automated vehicles: does an intent display in an external hmi support trust calibration and safe crossing behavior?” in Proceedings of the 2021 CHI conference on human factors in computing systems, 2021, pp. 1–17.
- Holländer et al. [2019] K. Holländer, P. Wintersberger, and A. Butz, “Overtrust in external cues of automated vehicles: an experimental investigation,” in Proceedings of the 11th international conference on automotive user interfaces and interactive vehicular applications, 2019, pp. 211–221.
- Kaleefathullah et al. [2020] A. A. Kaleefathullah, N. Merat, Y. M. Lee, Y. B. Eisma, R. Madigan, J. Garcia, and J. d. Winter, “External human–machine interfaces can be misleading: an examination of trust development and misuse in a cave-based pedestrian simulation environment,” Human factors, p. 0018720820970751, 2020.
- Jones et al. [2011] N. A. Jones, H. Ross, T. Lynam, P. Perez, and A. Leitch, “Mental models: an interdisciplinary synthesis of theory and methods,” Ecology and Society, vol. 16, no. 1, 2011.
- Al-Diban [2012] S. Al-Diban, Mental Models. Boston, MA: Springer US, 2012, pp. 2200–2204.
- Matsuo et al. [2024] R. Matsuo, H. Liu, T. Hiraoka, and T. Wada, “Enhancing the driver’s comprehension of ads’s system limitations: An hmi providing request-to-intervene trigger and reason explanation,” in 2024 IEEE 4th International Conference on Human-Machine Systems (ICHMS). IEEE, 2024, pp. 1–7.
- Kenesei et al. [2022] Z. Kenesei, K. Ásványi, L. Kökény, M. Jászberényi, M. Miskolczi, T. Gyulavári, and J. Syahrivar, “Trust and perceived risk: How different manifestations affect the adoption of autonomous vehicles,” Transportation research part A: policy and practice, vol. 164, pp. 379–393, 2022.
- Zhang et al. [2019] T. Zhang, D. Tao, X. Qu, X. Zhang, R. Lin, and W. Zhang, “The roles of initial trust and perceived risk in public’s acceptance of automated vehicles,” Transportation Research Part C: Emerging Technologies, vol. 98, pp. 207–220, 2019.
- Yang et al. [2024] Y. Yang, Y. M. Lee, R. Madigan, A. Solernou, and N. Merat, “Interpreting pedestrians’ head movements when encountering automated vehicles at a virtual crossroad,” Transportation research part F: traffic psychology and behaviour, vol. 103, pp. 340–352, 2024.
- Lee et al. [2024] Y. M. Lee, V. Sidorov, R. Madigan, J. Garcia de Pedro, G. Markkula, and N. Merat, “Hello, is it me you’re stopping for? the effect of external human machine interface familiarity on pedestrians’ crossing behaviour in an ambiguous situation,” Human Factors, p. 00187208241272070, 2024.
![[Uncaptioned image]](/html/2502.02805/assets/bio/HailongLiu2.jpg) |
Hailong LIU (M’15) received his M.Eng. and Ph.D. degrees in Engineering from the Graduate School of Information Science and Engineering, Ritsumeikan University, Japan in 2015 and 2018, respectively. Meanwhile, he had been a Research Fellowship for Young Scientists (DC2) of JSPS from April 2016 to March 2018. From April 2018 to October 2021, he was a researcher at Nagoya University, Japan. He started as an Assistant Professor in November 2021 and was promoted to Associate Professor in February 2024, at Graduate School of Science and Technology, NAIST, Japan. His research has focused on human factors and machine learning in the intelligent transportation systems. He is a member of IEEE, JSAE, JSAI, and SICE. He is also a menber of IEEE SMC and a committee member of Human Factors in ITS of IEEE ITSS. |
![[Uncaptioned image]](/html/2502.02805/assets/x9.jpg) |
Yang Li is a PhD candidate at KIT, Germany, specializes in the human–machine interface for communication between AVs and human traffic partners on ambiguous roads. With a 12-month visiting study at the University of Leeds and participation in the Hi-Drive Program, she also visited NAIST in 2023. |
![[Uncaptioned image]](/html/2502.02805/assets/x10.png) |
Toshihiro Hiraoka (M’14) received B.E. and M.E. degrees in Precision Engineering from Kyoto University in 1994 and 1996, and a Ph.D. in Informatics from Kyoto University in 2005. He worked at Matsushita Electric Industrial Co. Ltd. from Apr. 1996 to Sep. 1998, the Department of Systems Science, Graduate School of Informatics, Kyoto University as an Assistant Professor from Oct. 1998 to Sep. 2017, a Designated Associate Professor at the Institutes of Innovation for Future Society, Nagoya University from Oct. 2017 to Jun. 2019, and a project professor at Institute of Industrial Science, The University of Tokyo from June 2019 to September 2022. He has been a senior chief researcher at Japan Automobile Research Institute since October 2022. His current research interests are human-machine systems, especially advanced driver-assistance systems and the automated driving system. He is a member of SICE, HIS, JSAE, JES, IATSS, and IEEE (ITS Society). |
![[Uncaptioned image]](/html/2502.02805/assets/bio/wada2017.jpg) |
Takahiro Wada (M’99) received a B.S. degree in Mechanical Engineering, a M.S. degree in Information Science and Systems Engineering, and a Ph.D. degree in Robotics from Ritsumeikan University, Japan, in 1994, 1996, and 1999, respectively. In 1999, he became a Research Associate at Ritsumeikan University. He spent 12 years at Kagawa University, Japan, as an Assistant Professor and Associate Professor in the Department of Intelligent Mechanical Systems Engineering. He has been a full professor for nine years at Ritsumeikan University in the College of Information Science and Engineering since 2012. Since 2021, he has been a full professor at Nara Institute of Science and Technology, Japan. In 2006 and 2007, he spent half a year at the University of Michigan Transportation Research Institute in Ann Arbor as a visiting researcher. His current research interests include robotics, human machine systems, and human modeling such as modeling motion sickness and motion perception. |