Risk-Aware Sensitive Property-Driven Resource Management in Cloud Datacenters
Abstract
Organizations are increasingly moving towards the cloud computing paradigm, in which an on-demand access to a pool of shared configurable resources is provided. However, security challenges, which are particularly exacerbated by the multitenancy and virtualization features of cloud computing, present a major obstacle. In particular, sharing of resources among potentially untrusted tenants in access controlled cloud datacenters can result in increased risk of data leakage. To address such risk, we propose an efficient risk-aware sensitive property-driven virtual resource assignment mechanism for cloud datacenters. We have used two information-theoretic measures, i.e., KL-divergence and mutual information, to represent sensitive properties in the dataset. Based on the vulnerabilities of cloud architecture and the sensitive property profile, we have formulated the problem as a cost-drive optimization problem. The problem is shown to be NP-complete. Accordingly, we have proposed two heuristics and presented simulation based performance results for cloud datacenters with multiple sensitivity.
Index Terms:
Cloud services, access control, risk assessment, vulnerability1 Introduction
Cloud computing provides access to a pool of shared configurable resources such as datacenters, software, and infrastructure. Organizations utilize cloud computing to save the cost of acquiring and maintaining computing resources on-premise. The main feature of cloud computing is the ability to dynamically assign and release physical and virtual resources to customers based on their demand. However, security challenges present a major obstacle towards a complete shift to cloud computing paradigm [1]. Cloud Security Alliance (CSA)111https://downloads.cloudsecurityalliance.org/assets/research/top-threats/Treacherous-12_Cloud-Computing_Top-Threats.pdf identifies the top security threat in cloud computing as the breach of confidential data stored on the cloud. Such breach can be resulted due to human error, poor security practice, or software vulnerabilities. A recent example of such data breach is the leakage of US voter data, which was stored on a data warehouse service hosted by Amazon S3. The breach was caused by a misconfiguration of the database leaving the data exposed to the public [2].
Data sharing among authorized users remains the main security concern among cloud tenants [3]. To mitigate the risk of data leakage, encryption-based techniques are used to preserve the confidentiality of the data stored on the cloud [4]. Recently, encryption primitive and homomorphic encryption techniques have been proposed to enable secure data search and computation on encrypted data. However, such techniques are computationally intensive and support limited operations. On the other hand, non-encryption based approaches to reduce the risk of data leakage by implementing resource isolation mechanisms, e.g., trusted virtual domain [5], secure hypervisor [6], and Chinese wall policies [7]. However, achieving resource isolation reduces resource utilization.
In datacenter applications, the confidentiality of the shared data is often preserved using authorization mechanisms to manage data access [8]. In essence, cloud providers controls data operations using Role-Based Access Control (RBAC) policy, in which a user can perform an action on the shared data if the user is assigned a role and the role has the authorization to perform the action. For a particular datacenter application, cloud providers allocate a number of virtual resources, i.e., Virtual Machines (VMs), that are either hosted in a single or multiple Physical Machines (PMs) such that cost of resource provisioning is minimized. A user attempting to access the datacenter using an access control role is assigned to a particular VM subject to the Service Level Agreement (SLA). From security perspective, it is imperative that the assignment of virtual resources takes into account the risk associated with the data leakage resulted from assigning roles to VMs. In [9, 10], risk-aware assignment techniques have been proposed with the objective to minimize the data leakage.
In general, data contains embedded properties that can be extracted using data mining and information retrieval techniques. For example, social network dataset generally contains patterns that represent relationships among users [11], enterprise dataset contains association and business rules [12], and healthcare data may contain infectious disease outbreak behavior [13]. Some embedded properties can be sensitive and need to be preserved from authorized users. Furthermore, colocating roles in a single PM can increase the risk of disclosing the sensitive properties due to the risk of resource sharing among VMs. In this paper, we propose an efficient resource allocation technique for cloud datacenter applications with the aim to mitigate the risk associated with disclosing the sensitive properties. In particular, we assume that global sensitive properties are defined over the entire dataset, and each individual role perceives local sensitive properties associated with the role’s permissible partial dataset. The local sensitive properties may disclose partial information about the global sensitive properties. To evaluate the information disclosure of the sensitive properties, we use information-theoretic measures to quantify the difference between global and local sensitive properties.
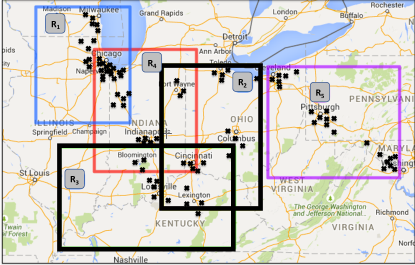
Motivating example: Consider a cloud datacenter hosting a location-based social network application that allows to share information about the location and time of users’ check-in activities. Furthermore, the access to check-in data is controlled using a fine-grained access control policy, e.g., Context-aware RBAC (CRBAC). In CRBAC, the time and location are used to define the context at which the access to check-in entries is controlled. Figure 1 depicts an example of a CRBAC policy with 5 roles with each role is represented as a rectangle in the map. The rectangle boundary of the roles defines the spatial extent of the check-in entries during the last 24 hours. Several sensitive properties associated with the check-in data can be envisioned based on the demographics [14] or commute distance [11]. For example, the rate at which users visit a certain type of locations, e.g., restaurants, theaters, etc, during certain time of the day, e.g., morning, afternoon, or evening, is a sensitive property. Such a property can be modeled as a statistical function, e.g., probability mass function (pmf). For each role in Figure 1, a local pmf of the sensitive property is computed and used to estimate the global pmf defined over the entire dataset. Subsequently, a role can exploit the vulnerabilities in the cloud architecture and attack the dataset assigned to other roles to gain more information about the global pmf. Any gain about the global pmf is a risk that needs to be controlled.
The contributions of this paper are as follows. First, we introduce a virtual resource management architecture that facilitates the assignment of virtual resources with objective to reduce the risk of data leakage. Accordingly, we formulate the risk-aware assignment problem that protects the global sensitive properties of the dataset. The problem is shown to be NP-complete and subsequently two heuristics are proposed. Finally, experimental evaluations of the proposed heuristics is conducted using real check-in dataset.
The remainder of this paper proceeds as follows. In Section 2, the vulnerability and authentication policy models are presented. Section 3 presents the risk-aware sensitive property-driven assignment problem. Section 4 presents the assignment heuristics. In section 5, we provide performance evaluation. Section 6 discusses related work. Finally, Section 10 outlines the conclusion.
2 Cloud Vulnerability and Authorization Policy for Datacenters
In this section, we describe the risk associated with the data leakage that is caused by the assignment of access control roles to virtual resources in cloud datacenters. A statistical model of the access control policy with sensitive properties for cloud datacenters is introduced to control the assignment with the objective to reduce the risk of data leakage.
2.1 Cloud Vulnerability and Data Leakage Risk Model
We take the perspective of Platform as a Service (PaaS) that allows developers to deploy Big Data applications. Examples of such applications can be found in healthcare, e-government, and enterprises [15]. Virtualization technology is used to ensure isolation of applications while allowing efficient utilization of the physical resources provided by a single or multiple Infrastructure as a Service (IaaS) providers, i.e., Amazon Elastic Cloud Computing (EC2). Shared physical resources are provisioned to VMs such that the Quality Of Service (QoS) guarantees are satisfied. The QoS guarantees provided to the cloud customers is often documented in the Service Level Agreement (SLA). VMs are used to wrap the provisioned applications PaaS customers.
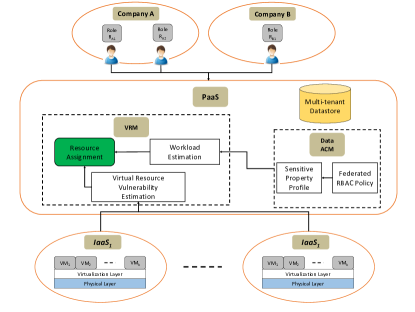
In multitenant datacenters, the confidentiality of shared data is preserved using access control mechanisms, e.g., RBAC policy, that control the operations on data [8]. Under RBAC policy, a user can perform an action on the shared data if the user is assigned a role and the role has the authorization to perform the action. In [16], a distributed access control architecture that assigns virtual resources to cloud customers is proposed. The assignment is performed such that the cost of provisioning for PaaS cloud providers is minimized while satisfying the SLA for each cloud customer. Figure 2 provides a system view of the cloud architecture for the virtual resource management. It consists of the datastore, Virtual Resource Manager (VRM), and Access Control Module (ACM). VRM consists of workload estimation, virtual resource vulnerability estimation, and resource assignment components. In this paper, we adopt the proposed architecture in [16] in order to develop a risk-aware sensitive property-driven virtual resource assignment framework.
Information security risk is defined by ISO 27005 as the following: ”The potential that a given threat will exploit vulnerability of an asset or group of assets and thereby cause harm to the organization”. Accordingly, the risk is qualitatively expressed as the product of the likelihood of the attack and its impact [17]. The likelihood of an attack depends on the vulnerabilities of the system and the attacker threat, while the impact of data leakage depends on the quality or quantity of the leaked data. Formally, the data leakage risk can be formulated as the following:
| (1) |
In particular, the vulnerability is the probability of data leakage between virtual resources. There are many software vulnerabilities that can cause data leakage across tenants, e.g., VM escape, SQL injection, and cross-site scripting [18]. Such vulnerabilities have different levels of criticality which are calculated based on the Common Vulnerability Scoring System (CVSS) scores [19]. The probabilities of finding each of these vulnerabilities are estimated using statistical methods such as Vulnerability Discovery Models (VDMs) [20]. Consequently, the vulnerability probability is weighted based on its criticality and used to find the overall probability of data leakage. We model the vulnerabilities among virtual resources as a vulnerability matrix , where is the data leakage vulnerability between the -th and -th resources. To capture the worst-case scenario for risk assessment, we assume that the threat is equal 1 for all roles. In other words, each cloud customer poses the same threat in accessing other customers’ data objects, and vice versa. The assets are the data stored in the cloud datastore. The value of the assets in Eq. 1 can be the number of leaked data items [10]. In this paper, however, the value of the assets is quantified as the amount of information gained about the sensitive property as a result of the attack. We use information-theoretic measure to quantify such information gain. More discussion is provided in Section 2.5.
2.2 Context-aware Role-Based Access Control
RBAC policy defines permissions on objects based on employee roles in an organization. The policy configuration is composed of a set of Users (), a set of Roles (), a set of Permissions (), a user-to-role assignment relation (), and a role-to-permission assignment relation (). In a cloud datacenter, the RBAC policy defines the permissions to access data objects for roles assumed by the cloud users [21]. A leading practical example of using RBAC in cloud datacenters is Microsoft Azure, which uses RBAC to authorize access to its resources through the Azure Active Directory. In addition, Azure controls its data operations using RBAC for performing create/read/update/delete operations in SQL DB [22]. Another example is Oracle Sales Cloud that uses RBAC to secure the access to its data and functionalities [23]. RBAC policy is modeled as a bi-partite graph as the following:
Definition 2.1.
Given an RBAC policy for a datacenter where is the set of roles and given being the set of data objects, the role-to-permission assignment can be represented as a directed bipartite graph , where s.t. . The edges in represents the existence of role-to-permission assignment in the RBAC policy , where and .
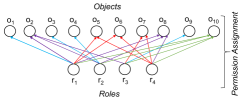
The out-degree of a role vertex represents the cardinality of the role and the in-degree of a data object vertex represents the degree of sharing of that object among roles. In Figure 3a, an RBAC policy with and is represented as bipartite graph model. We can notice that the cardinality of role is -. Also, the degree of sharing of data object is -.
CRBAC is proposed to capture context parameters, such as location and time, in the access control policy [24]. Accordingly, the assignment of permissions to users are based on the context in order to provide a comprehensive approach for security management. For example, CRBAC is used for spatial and temporal access control for mobile devices [25]. Spatial extensions have also been proposed to RBAC. One such extension is GEO-RBAC that defines spatial roles. A spatial role can be assumed within a specified spatial boundary. However, GEO-RBAC specifies one spatial extent for each role, which implies that each spatial location in an organization needs to have its own role. The GST-RBAC [26] is proposed to express the spatial information as spatial constraints which can be attached to any role already existed in an access control policy.
2.3 Sensitive Property Profile (SPP) of RBAC
In previous work, an alternative representation for RBAC, called Spectral Model (SM), is proposed [10]. In SM, data objects that are accessed by different roles is grouped into a set of non-overlapping partitions. Unlike the bipartite model, SM can be used to characterize the sensitivity of a datacenter using a single parameter, i.e., the degree of sharing among roles. An elaborated discussion about datacenter sensitivity will be provided in Section 2.4.1. To model the information disclosure of each set of roles, we modify SM by augmenting the information disclosure of the sensitive property perceived by each set of roles and create the Sensitive Property Profile (SPP). Formally, the SPP is defined as follows:
Definition 2.2.
Given a set of RBAC policy roles and its bipartite graph representation , let be the power set of excluding the null set . The sensitive property profile of the RBAC policy is the vector , indexed by and lexicographically ordered. Formally, let be a set of roles, then is defined as follows:
Where is the cardinality of the set with , and is a set of characteristics of . There are no restrictions on the definition of the roles characteristics of the set of roles. However, it uniquely identifies the set from other sets.
In the following section, we provide detailed discussion about estimating the cardinality of each set in SPP. Then, we provide information-theoretic representations of the characteristics.
2.4 Statistical Model for Cardinality Estimation of Roles
In a datacenter with RBAC policy, specifying the exact cardinality of is a computationally intensive problem. One practical approach is to use a cardinality estimation technique [27]. In this paper, however, we assume that the data objects in a datacenter are accessed following a Zipfian distribution [28]. According to this distribution, the number of objects shared by roles exemplifies a power-law behavior, in which few objects are shared by a large number of roles while most of the objects are shared among a smaller number of roles; hence it can provide a heterogeneous workload for RBAC. The Zipfian distribution is given as follows:
| (2) |
where is the number of objects, is the object rank, and is the sensitivity parameter. If the sensitivity parameter , then the probability that data object is assigned to a single role, i.e., with rank , is double the probability of that data object is assigned to two roles, i.e., with rank . As the value of increases, the number of data objects assigned to single roles becomes larger.
The Zipfian distribution is used to generate heterogeneous RBAC-based workload in two steps as proposed in Algorithm 1. In the first step, data objects are classified into buckets where each bucket represents the number of total data objects assigned to a lattice level. For example, data objects in bucket 1 are exclusively accessed by only one role. On the other hand, data objects in bucket are shared by all roles. The number of data objects in each bucket follow Zipfian distribution. In the second step, we assign data objects of bucket to randomly selected partitions at level of the lattice. Note, the number of partitions at level is .
2.4.1 Modeling Sensitivity of Cloud Datacenter
Based on the statistical property of the cardinality of roles in RBAC policy, we propose the notion of sensitivity to classify cloud datacenters. The classification of cloud datacenters is dependent on the level of sharing of data objects among the roles. In particular, we define the sensitivity of a datacenter as the average degree of sharing among its data objects. In case the degree of sharing on average is low, we term the datacenter to have a high sensitivity. On the contrary, if extensive sharing of data objects among roles is present, we term this datacenter to have a low sensitivity. The medium sensitivity class falls in the middle. It can be noticed that the sharing of data objects and the classification of a datacenter can be modeled using the scalar parameter of the Zipfian density function shown in Equation 2. As shown in Figure 4, for a smaller value of , more data objects are uniformly distributed in the vector of the spectral model of RBAC. In the following example, we illustrate how Zipfian parameter can be used to classify the sensitivity of datacenter.
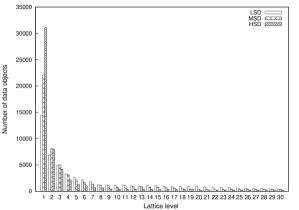
Example 2.1.
For datacenter with data objects, suppose we have three RBAC policies each with roles. Figure 4 shows a histogram of object across the spectral lattice. Depending on the Zipfian distribution, the three classes of datacenters, namely; High Sensitive Datacenter (HSD), Medium Sensitive Datacenter (MSD), and Low Sensitive Datacenter (LSD), can be identified with respect to policies , , and . For example, HSD has a large value of () since the sharing of data objects among roles is very small. On other hand, LSD has a small value of () depicting the case of extensive sharing of data objects among roles of policy . The MSD has a value of which falls in the middle ( ). Note, the number of data objects at level 1 in HSD is double the number of data objects at level 1 in LSD.
2.5 Information-Theoretic Modeling of Sensitive Properties
In this section, we present information-theoretic measures to quantify the information gain of the data leakage. The measures are used to quantify the assets in Eq. 1. The VRM component of Figure 2 uses SPP to assign the RBAC policy roles to virtual resources. In essence, a function that quantifies the disclosure of the global sensitive property is used along with the cardinality to characterize the set of roles. The function is a quantitative measure of the relative difference between the global sensitive property and local sensitive property obtained by accessing data according to the role set . In this paper, we consider two information-theoretic measures to model sensitive properties; Kullback-Leibler divergence () and Mutual Information () [29]. An important measure in information-theory is Entropy, which is the measure of uncertainty in probability distributions. Let X be a random variable with probability distribution . The entropy is defined as the following:
2.5.1 -based Representation of Sensitive Property
Given two discrete pmfs, and , is a non-symmetric measure of the difference between these two pms. Intuitively, measures the amount of information loss when is used to approximate . Formally, between two pmfs as the following:
Using the definition of , we define -based property as the following:
| (3) |
Where is the joint probability distribution defined over data accessed by the set of roles and is the joint probability distribution over the entire dataset.
Example 2.2.
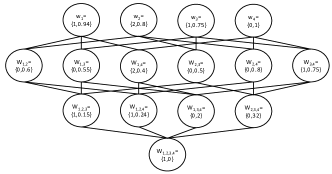
In Figure 3b, the general spectral model of the RBAC policy using -based property is shown. It can be noticed that , i.e., the cardinality of is 2 because and are accessed by both and , while indicates that the probability distribution created using tuples and has a 0.4 KL divergence from the probability distribution created using .
2.5.2 -based Representation of Sensitive Property
is a measure that quantifies the dependency between two or more random variables. Intuitively, it measures the reduction of entropy in one random variable by observing the other. Formally, mutual information is the divergence between the joint pmf of two random variables and the product of their respective pmfs as defined below:
It can be shown that the approaches zero when the two random variables are independent, i.e., . On the other hand, strong dependency between and results in a higher value of .
Using the definition of , we define -based property as the following:
| (4) |
Where is the mutual information between and defined over data accessed by the set of roles , and is the mutual information between and defined over the entire data set.
3 Problem Definition and Formulation
Given the proposed GSM associated with RBAC policy, and the virtual resource vulnerability model related to the cloud [9], the Risk-aware Sensitive Property-driven Assignment Problem (RSPAP) is defined with the objective to minimize the risk (Eq. 1) of assigning virtual resources to access control roles as the following:
Definition 3.1.
(RSPAP). Given a suite of virtual resources, , an RBAC policy and the associated SPP , and the vulnerability matrix , the risk-aware sensitive property-driven assignment problem is to assign access control roles to virtual resources such that the total risk of sensitive property disclosure is minimized. Formally, let be the set of sets in that contains and be the assignment set of roles to VMs, where function denoting the assignment of role to . We formulate the optimization problem as the following:
| (5) |
Where is the disclosure risk between role and set , and denotes the probability of leakage between and .
Theorem 3.1.
RSPAP problem is NP-complete.
Proof.
We construct a decision formulation of RSPAP problem as follow:
For a given constant , is there any assignment such that
First, given and we can check if the SPRAP decision problem satisfies the bound in polynomial time. Accordingly, the decision formulation of SPRAP is NP. Next, we show that decision SPRAP problem is NP-Complete by showing that Travel Salesman problem (TSP) can be reduced to SPRAP. We formulates TSP for a given set with a distance metric where , is there such an ordering of elements of :() such that .
Let be the sensitive property function for RBAC policy with roles where . We define as follows:
Let and where then assume the assignment of role to VM as if the salesman visits city . Therefore, if we find an optimal order of visits in TSP, we can find the optimal assignment of to in RSPAP. ∎
4 Proposed Heuristics for RSPAP
In this section, we propose two heuristics for solving RKAP which can be used by the resource assignment component in VRM in Figure 2. The first heuristic follows a top-down clustering based approach. In each step, the cluster of roles is divided based on the risk associated with the disclosure of the sensitive property. The second heuristic is a neighbor-based heuristic, which uses a pairwise property disclosure measure for role scheduling. This measure is computed based on the inference function . Each role is assigned to the best available virtual resource with respect to the probability of leakage.
4.1 Top-Down Heuristic (TDH)
In this heuristic, a top down clustering approach is used. Initially, all the roles are assumed to be in one cluster. We begin with division of this root cluster and split it into two clusters such that total measure of property disclosure of both clusters is minimum. The resulting clusters are sorted based on their total . TDH splits a cluster with the largest total further by moving roles with high value of from current cluster to the new cluster such that the total of both clusters is minimum. TDH repeats the cluster splitting step until it generates up to clusters that equals the number of VMs. Subsequently, the cluster with the largest total is assigned to the VM with the minimum probability of leakage. After this initial assignment, TDH iterates over all the roles and changes the assignment of a role if it results in reduction of the total risk. The algorithm stops when any futher change in the assignment does not reduce the total risk.
Algorithm 2, formally represents the TDH. In Lines 1-2, the initial cluster list has one cluster which is the set of all roles. In Lines 3-13, TDH iterates the outer loops times and in each iteration the first cluster in is divided into two new clusters and . In the inner loop Lines 7-11, TBH moves the role from the current cluster to the new cluster . The condition in Line 8 guarantees that this move does not increase the total risk. In Lines 12-13, TDH adds the new clusters to and sorts the clusters based on their total . Then, the VMs are sorted based on the intra probability of leakage in Line 14. The initial assignment is generated in Lines 15-17 by iterating over all the sorted VMs and the resulting sorted clusters. TDH in Lines 18-22 iterates over all roles to improve the assignment. The final the assignment is stored in assignment matrix .
Lemma 4.1.
The complexity of TDH is
Proof.
In TDH we need to generate clusters. For each of the cluster, the algorithm iterates over at most roles. For each of the roles the algorithm evaluate function to compute the total disclosure risk of a cluster as illustrated in Line 8 in Algorithm 2. The computation of has the complexity of . Therefore, the complexity of TDH for computing the initial assignment is . To improve the assignment the algorithm iterates times until no further improvement can be achieved. Each iteration requires steps to calculate the total risk. Accordingly the complexity of the improvement step is which results in the overall complexity of TDH which is . ∎
4.2 Neighbor-Based Heuristic (NBH)
The NBH algorithm is shown as Algorithm 3. Prior to the assignment, NBH computes disclosure weights for each pair of roles as shown on Line 2-4 of the Algorithm 3. These weights are based on the sensitive property function discussed in Section 2.5. Subsequently, NBH follows a best fit strategy whereby it initially selects the pair of roles with the maximum weight and assigns them to the pair of VMs that has the least probability of leakage. It then selects the role that has the highest disclosure weight with any of perviously assigned roles. is then assigned to the VM that has the minimum probability of leakage to an already selected VM. This step is repeated until each VM is assigned exactly one role. The remaining roles are assigned to VMs based on the value of intra probability of leakage. Th reason for only considering intra probability is that we assume that the probability of leakage across VMs is always less than probability of leakage within a VM.
The assigned roles are stored in list . The unassigned roles are kept in the list . The list maintains IDs of the unassigned VMs. In Lines 12-18 , each iteration of the loop assigns a role from list with the maximum value in matrix to a VM in . Then the algorithm updates the assignment matrix and the lists , , and . The outer loop in Lines 19-23 iterates over all the remaining unassigned roles to find the current best assignment. To find the best assignment for a given role in , the inner loop (Lines 20-21) iterates over all VMs and identifies the VM that results in the minimum risk for that role. At the end NBH returns the assignment matrix.
Lemma 4.2.
The complexity of NBH is
Proof.
The complexity of computing in Line 22 of the NBH is . This computational cost needs to be repeated times for each role in . Therefore, the total complexity of NBH is .
∎
5 Performance Evaluation
In this section, we present a detailed performance evaluation of the proposed heuristics with various values of (the sensitivity parameter of the Zipfian distribution), the number of virtual resources , and the number of roles .
| x | Location type | x | Location type |
| 1 | Accomodations | 9 | Religious buildings |
| 2 | Governmental | 10 | City buildings |
| 3 | Cemeteries | 11 | Shops |
| 4 | Educational | 12 | Stadiums |
| 5 | Restaurants | 13 | Recreational |
| 6 | Health centers | 14 | Transportation stops |
| 7 | Parks | 15 | Dams and towers |
| 8 | Banks |
| y | Time slot |
| 1 | 6:00 AM to 11:59 AM |
| 2 | 12:00 PM to 4:59 PM |
| 3 | 5:00 PM to 7:59 PM |
| 4 | 8:00 PM to 5:59 AM |

5.1 Check-in Dataset
In this section we present a detailed discussion about the dataset and the sensitive properties used in evaluating the proposed heuristics. The experiments have been conducted using a real life check-in dataset collected from Gowalla social networking website 222https://snap.stanford.edu/data/loc-gowalla.html. The Gowalla dataset has around 6.5 million check-in entries for about 200,000 users around the world over. The data was collected over a period of 20 months. The dataset contains information about time and geo-coordinates of the check-ins. In order to introduce location semantic in the dataset, we have extracted a list of Point-Of-Interests (POI) from OpenStreetMap 333https://www.openstreetmap.org/ and map each check-in entry to the nearest POI based on geo-coordinates. The mapping is conducted as the following. The area of the check-in entry is increased to a circle of around 111 in radius by truncating the values of the latitude and longitude to 3 decimal digits. The candidate POIs are those which have the same values of the first 3 decimal digits. The POI with the smallest value in the 4th decimal digits of latitude and longitude is used. Each entry in the mapped dataset contains the time of check-in, the type of POI, and user ID. For the experiments in this paper, a subset of the mapped dataset that belongs to the US Midwest region is used. For this region of 12 US states, the overall size is about 250,000 entries.
5.1.1 Definition of Sensitive Properties
Two discrete random variables in the dataset is defined; and . Let be a discrete random variable that indicates the type of location of the check-in entry, and a discrete random variable that indicates the time slot. The probability (or ) is the probability of check-in at a location of type x. The probability computed as the following:
Similarly, (or ) is the probability of check-in during time slot y. The probability is computed as the following:
The joint probability (or ) is the probability of check-in at a locations of type x during time slot y. The joint probability is computed as the following:
Note, that there are many ways to define the random variables , , and their joint pmf. The above definition is used in order to study the correlation between the random variables representing the location and time of check-ins.
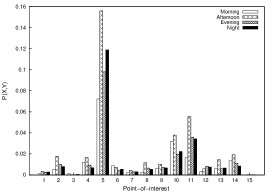
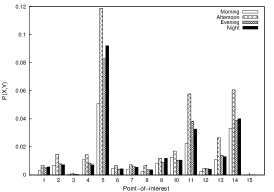
In our experiments, we categorize POIs into 15 categories and time into 4 slots. Tables I and II summarize the discrete values of and . For the dataset associated with the Midwest region, Figure 5a depicts the joint pmf for the random variables and taking values according to Table I and Table II, respectively. To exemplify the effect of RBAC policy on the pmf, suppose there are two roles, and , with dataset and , respectively. The size of is 30400, while the size of is 138276. Note, and can be overlapping, i.e., can share some check-in entries. Figures 5b and 5c depict the pmfs of and , respectively. For example, the probability of check-in in restaurants between 5 PM and 8 PM is 0.079, 0.098, and 0.083, for the entire dataset, , and , respectively.
5.1.2 Monotonicity of the Sensitive Properties
Figure 6 show the relationship between the size and the embedded sensitive property of the check-in dataset. In this experiment, we vary the size of dataset between 10% to 100% with an increase of 10% and choose check-in entries randomly. The sensitive property of the subset is computed. The experiment is repeated 10 times and the average values of divergence and mutual information are reported. We note that the divergence and mutual information are monotonically decreasing as the size of the dataset increasing. Note that this behavior might not hold for other dataset.


5.2 Evaluation Metrics
In this section, we introduce three evaluation metrics to compare the performance of the proposed heuristics. The first two metrics evalaute with the overall disclosure risk exhibited by all roles. The third metric focuses on the disclosure risk incurred per role. The first metric is the disclosure risk, i.e., Equation 5. This metric depends on the sensitive property function used in the cost function. The risk metric associated with the -based sensitive property measures the risk incurred due to the reduction of the divergence between the attacker’s pmf and the global pmf. On the other hand, the risk metric corresponding to the -based sensitive property measures the risk incurred due to the reduction in the difference between the estimated by a role and the global .
The second measure is the quality of risk-reduction that measures the ability of the proposes heuristics to reduce the disclosure risk by assigning roles to virtual resources. In order to compute , we define the property attackability () as the maximum disclosure risk of the sensitive property for a given policy. Formally, is given as the following:
| (6) |
Accordingly, the quality of risk-reduction is the relative difference between and the disclosure risk of the sensitive properties, i.e., -based sensitive property or -based sensitive property. Formally, is given as the following:
| (7) |
Note, .
The third metric is the discriminator index () which evaluates the performance of the heuristics at the role level. In particular, is an indirect indicator of the performance in terms of risk reduction per role. Semantically, not only indicates the quality of reducing the risk at the role level but also implies the disproportionality in terms of risk management among the roles. DI is an extension of the generic discriminator index [30], and is given as the following:
| (8) |
where is given as the following:
and is given in Equation 5.
5.3 Experimental Setup
In this experiment, we simulate up to 6 clusters of virtual resources, i.e., VMs. The size of a each cluster ranges from 1 to 32 VMs. A cluster of VMs can be hosted by one or more physical servers. However, in our experiment, we consider one physical server per virtual cluster. The inter-vulnerabilities across virtual clusters are zeros, thus reflecting physical isolation. The intra-vulnerabilities among VMs within a cluster are randomly generated. All intra-VM vulnerabilities are non-zeros and thus higher than inter-VM vulnerabilities. This is correct because the fact that, in general, physical isolation is more secure than VM isolation. Two sensitive properties functions, i.e., -based and -based, are used for the performance evaluation. Finally, we use the RBAC policy sensitive property profile truncated up to level 3.
5.4 Performance Results for -based Sensitive Property
In this section, we discuss the performance of the proposed assignment heuristics for a -based sensitive property with respect to the aforementioned performance metrics i.e. , , and .
5.4.1 Total Risk ()
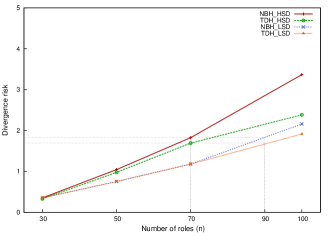
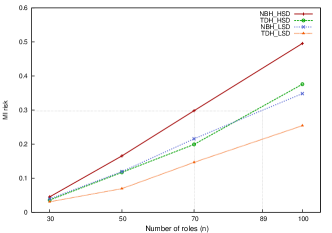
For both proposed heuristics, we observe that increases as we move from LSD to HSD case as shown in Figure 7. In other words, for the same value of divergence risk, the number of roles in required to obtain the risk value is more than the number of roles in as shown with the dotted horizontal lines in Figure 7. The reason can be explained using the monotonicity property shown in Figure 6. In particular, a role in workload gain more information by attacking other roles in compared to an workload. This is because that roles in workload share less data compared to workload and thus the data size increases. In general, we notice that outperforms since assigns role clusters based on aggregated risk in contrast to which assigns each role independently. Figure 7 shows that as we increase the number of roles, the resulting risk increases. This is expected as the total risk is the sum of the risk from all the roles.
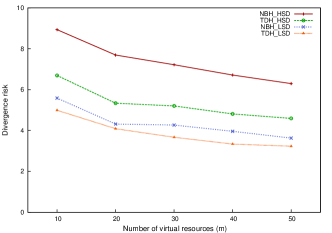
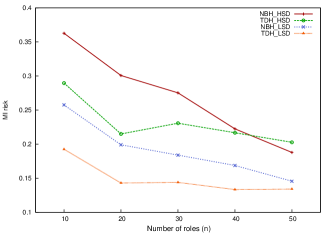
However, decreases as the number of VMs used in the experiment increases as depicted in Figure 8. This behavior is expected as increasing the number of available resources, i.e. VMs, reduces the number of roles assigned to the same VM which reduces the intra VM attack. Also, we can notice for Figure 8 that for the case of the decrease in is more prominent than for the case of . The reason being the parameter has a higher value for due to low sharing of data among the roles. Therefore, increasing the number of VMs is more beneficial for the case of than for the case of .
5.4.2 Quality of Risk-Reduction()
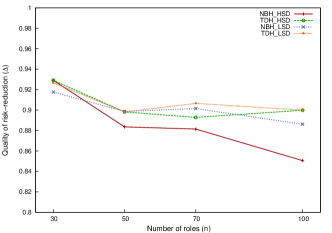
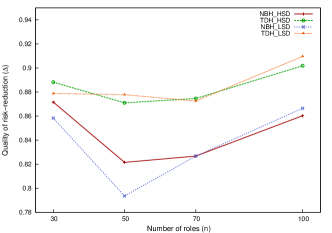
For a given heuristic, decreases with as depicted in Figure 9. The reason being that by increasing the value of , of the RBAC policy increases relatively at a faster rate than the rate at which increases. In addition, as shown in Figure 9, outperforms for both LSD and HSD cases since extensively searches for better assignments to improve . However in the case of HSD since the size of roles in term of data items is smaller as compared to LSD, ”partial sensitive property” possessed by a role is relatively small for . Therefore it is expected that the value of is relatively low for HSD as compared to LSD; a phenomenon clearly observable from Figure 9.
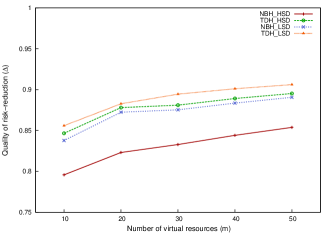
In Figure 10, we observe that for given RBAC policy the increase in the number of VMs improves due to reduction in while the value of parameter for the policy does not change. The behavior of the curves in terms of HSD and LSD in the Figure 10 can be reasoned similar to reasons given for the Figure 9.
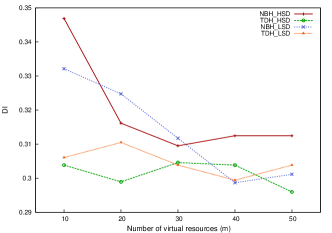
5.4.3 Discrimination Index ()
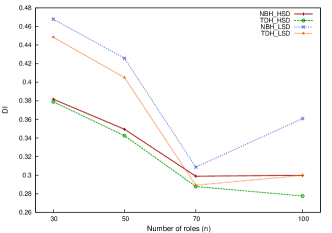
The metric captures the behavior of both heuristics in terms of . Intuitively, a low value of indicates that the is proportional to . On other hand, a high value of indicates that the resulting is disproportional to and, in essence, provides an indication about bad scheduling decisions. Figure 11 depicts the performance of both heuristics for the cases of LSD and HSD as we increase the number of roles. Both heuristics tend to perform well in terms of . The reason being that increasing the number of roles tend to disperse the global sensitive property over large number of rules. As a consequence, the s tend to be close to each other, thus reducing the discrimination effect. In particular, we note that for both heuristics improves (decreases) and eventually stays steady with no further improvement. A noticeable observation is that for , always yields better results than since for small number of roles in , ’s have high values which making it easier to generate good scheduling decision in the initial assignment for the case of NBH as it uses a greedy strategy. In fact, for the case of HSD such ”good decisions” are consistently made by with increasing value of as noticed by the green curve for 30 roles in Figure 11. Similar reasoning can be provided for the behavior of TDH algorithm as shown in Figure 11.
As we increase the number of VMs for both and datacenters, tends to improve its performance as depicted in Figure 12., in contrast to where is not effected by the number of VMs. The reason is that schedules roles using a greedy approach based on the related to the roles. Therefore, increasing the number of VMs alway improves based performance of . In contrast, makes its scheduling decisions using a more extensive search to generate a solution and does not consider during its assignment step.
5.5 Performance Results for Mutual Information
The performance of of and for the sensitive property in terms of , , and parameters is similar to the performance observed of the property. For example TDH consistently outperforms as the number of roles and the number of VMs increase as shown in Figures 13, 14, and 15. However, we observe a higher value of for property (see Figure 16) as compared to value of yields by property. The main reason for this difference is the truncated (up to level 3) sensitive property profile of RBAC policy used for the evaluation of the proposed heuristics.

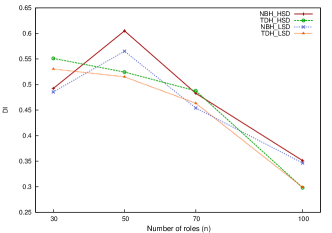
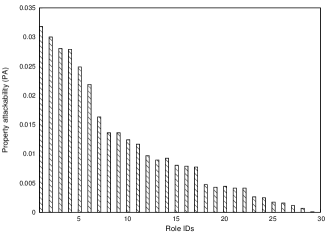
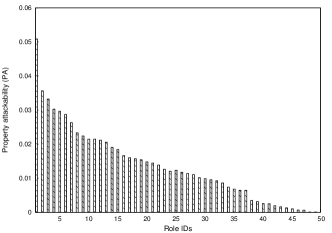
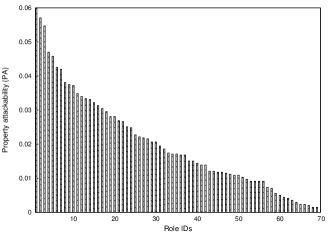
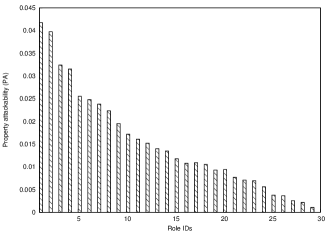
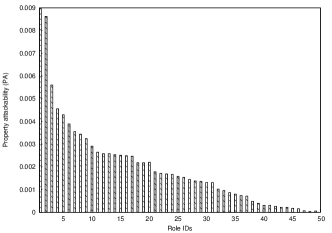
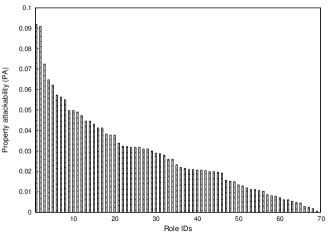
In Figure 17, we note that irrespective of the heuristic, the value of for the case of HSD is higher when as compared to and . To elaborate on this behavior, we show the histograms for all roles in these three cases of RBAC policy (, , and ) for HSD as well as for LSD. Figures 18, and 19 provide these histograms. We sort the roles based on their from large to small. The behavior of curve in Figure 6.17 can be explained within the context of ’s as following. The histogram for HSD for the case of n=50 shows a sharp drop of ’s and a ”piece-wise uniform” clusters of ’s. If two roles belong to the same uniform cluster are assigned to different type of VMs (in terms of vulnerability), it is expected to increase the metric. As noted from Figure 6.19 the uniform clustering phenomenon is more pronounced for the case of ; it is less pronounced for the case of ; and it is negligible for the case . This results in the convex shaped behavior of the graph of the HSD case. Similarly, for the case of LSD, as can be noticed from Figure 6.18, the uniform cluster behavior is more noticeable for smaller values of ( n=30 and n=50) and is negligible for .
6 Related Work
Work related to this paper can be categorized into three categories: 1) access control in cloud datacenter, 2) vulnerability models in cloud datacenter, and 3) security-aware resource assignment in cloud datacenter.
First, several researchers have addressed access control issues for cloud computing. Nurmi et al. [31] provided an authorization system to control the execution of VMs to ensure that only administrators and owners could access them. Berger et al. [7] promoted an authorization model based on both RBAC and security labels to control access to shared data, VMs, and network resources. Calero et al. [8] presented a centralized authorization system that provides a federated path-based access control mechanism. What distinguishes our work is that we address the problems of virtual resource vulnerability in the presence of multitenancy and virtualization.
Second, vulnerability discovery models (VDMs) are used to estimate the probability of software vulnerability. The authors in [32] proposed an attack surface metric that measures the security of software by analyzing its source code and find the potential flows. In [33] the vulnerability discovery is modeled based on the empirical analysis of history of actual vulnerability dataset and followed by predicting the vulnerability discovery. A Static-analysis of vulnerability indicator tool to assess the risk of software built by external deleopers is proposed in [34], while [35] proposes a hybrid (static and dynamic) analysis and machine learning techniques to extract vulnerabilities in web applications. In [36], an empirical methodology to systematically evaluate the performance of VDMs is proposed. The source code quality and complexity are incorporated in the VDM to generate better estimation [37]. Common Vulnerability Scoring System (CVSS) [38] metrics have been extensively used by both industry and academia to score the vulnerabilities of the systems and estimate risks. The US National Vulnerability Database (NVD) provides a catalog of known vulnerabilities with their CVSS scores.
Finally, various security-aware scheduling techniques for cloud computing have been reported. In [39], an algorithm to deploy workflow application over federated cloud is proposed. The proposed algorithm guarantees reliability and security constraints while optimizing the monetary cost. In particular, a workflow application is distributed on two or more cloud platforms in order to benefit from the advantage of each cloud. In order to prevent from unauthorized information disclosure of the deployed workflow over the federated cloud, a multi-level security model is used. In [40], a task-scheduling technique for security sensitive workflows is proposed. The proposed technique addresses the problem of scheduling tasks with data dependencies, i.e., sensitive intermediate data. Authors presented theoretical guidelines for duplicating workload tasks in order to minimize the makespans and monetary costs of executing the workflows in the cloud. In [41], authors presented an approach for optimal provisioning of resources in the cloud using stochastic optimization. The provisioning technique takes into account future pricing, incoming traffic, and cyber attacks. The above work do not consider the data confidentiality of application or the access control policy, which restricts permissions for a given task. A key feature that differentiates our scheduling algorithms from other approaches is that the privilege set for each task is the main parameter in the scheduling decision. The objective of our scheduling algorithm is to minimize the risk of data leakage due to vulnerability of virtual resources in cloud computing environments.
7 Conclusion
In this paper, we have proposed a sensitive property profile model for an RBAC policy. For this propose we have used two properties based on KL-divergence and mutual information extracted from check-in dataset. Based on the vulnerabilities of cloud architecture and the sensitive property profile, we have proposed resource scheduling problem based on the optimization pertaining to risk management. The problem is shown to be NP-complete. Accordingly, we have proposed two heuristics and presented their simulation based performance results for and datacenters.
References
- [1] F. Hu, M. Qiu, J. Li, T. Grant, D. Tylor, S. McCaleb, L. Butler, and R. Hamner, “A review on cloud computing: Design challenges in architecture and security,” Journal of Computing and Information Technology, vol. 19, no. 1, pp. 25–55, 2011.
- [2] D. O’Sullivan, “The rnc files: Inside the largest us voter data leak,” UpGuard, 2017.
- [3] H. Takabi, J. B. Joshi, and G.-J. Ahn, “Security and privacy challenges in cloud computing environments,” Security & Privacy, IEEE, vol. 8, no. 6, pp. 24–31, 2010.
- [4] J. Tang, Y. Cui, Q. Li, K. Ren, J. Liu, and R. Buyya, “Ensuring security and privacy preservation for cloud data services,” ACM Computing Surveys (CSUR), vol. 49, no. 1, p. 13, 2016.
- [5] L. Catuogno, A. Dmitrienko, K. Eriksson, D. Kuhlmann, G. Ramunno, A.-R. Sadeghi, S. Schulz, M. Schunter, M. Winandy, and J. Zhan, “Trusted virtual domains–design, implementation and lessons learned,” in Trusted Systems. Springer, 2010, pp. 156–179.
- [6] U. Steinberg and B. Kauer, “Nova: a microhypervisor-based secure virtualization architecture,” in Proceedings of the 5th European conference on Computer systems. ACM, 2010, pp. 209–222.
- [7] S. Berger, R. Cáceres, K. Goldman, D. Pendarakis, R. Perez, J. R. Rao, E. Rom, R. Sailer, W. Schildhauer, D. Srinivasan et al., “Security for the cloud infrastructure: Trusted virtual data center implementation,” IBM Journal of Research and Development, vol. 53, no. 4, pp. 6–1, 2009.
- [8] J. Alcaraz Calero, N. Edwards, J. Kirschnick, L. Wilcock, and M. Wray, “Toward a multi-tenancy authorization system for cloud services,” Security Privacy, IEEE, vol. 8, no. 6, pp. 48–55, 2010.
- [9] A. Almutairi, A. Ghafoor et al., “Risk-aware virtual resource management for multitenant cloud datacenters,” Cloud Computing, IEEE, vol. 1, no. 3, pp. 34–44, 2014.
- [10] A. Almutairi, M. Sarfraz, and A. Ghafoor, “Risk-aware management of virtual resources in access controlled service-oriented cloud datacenters,” IEEE Transactions on Cloud Computing, 2015.
- [11] E. Cho, S. A. Myers, and J. Leskovec, “Friendship and mobility: user movement in location-based social networks,” in Proceedings of the 17th ACM SIGKDD international conference on Knowledge discovery and data mining. ACM, 2011, pp. 1082–1090.
- [12] V. S. Verykios, A. K. Elmagarmid, E. Bertino, Y. Saygin, and E. Dasseni, “Association rule hiding,” IEEE Transactions on knowledge and data engineering, vol. 16, no. 4, pp. 434–447, 2004.
- [13] H.-M. Lu, D. Zeng, and H. Chen, “Prospective infectious disease outbreak detection using markov switching models,” IEEE Transactions on Knowledge and Data Engineering, vol. 22, no. 4, pp. 565–577, 2010.
- [14] Y. Dong, Y. Yang, J. Tang, Y. Yang, and N. V. Chawla, “Inferring user demographics and social strategies in mobile social networks,” in Proceedings of the 20th ACM SIGKDD international conference on Knowledge discovery and data mining. ACM, 2014, pp. 15–24.
- [15] G.-H. Kim, S. Trimi, and J.-H. Chung, “Big-data applications in the government sector,” Communications of the ACM, vol. 57, no. 3, pp. 78–85, 2014.
- [16] A. Almutairi, M. Sarfraz, S. Basalamah, W. Aref, and A. Ghafoor, “A distributed access control architecture for cloud computing,” Software, IEEE, vol. 29, no. 2, pp. 36–44, 2012.
- [17] K. Djemame, D. Armstrong, J. Guitart, and M. Macias, “A risk assessment framework for cloud computing,” IEEE Transactions on Cloud Computing, vol. 4, no. 3, pp. 265–278, 2016.
- [18] M. Pearce, S. Zeadally, and R. Hunt, “Virtualization: Issues, security threats, and solutions,” ACM Computing Surveys (CSUR), vol. 45, no. 2, p. 17, 2013.
- [19] B. Grobauer, T. Walloschek, and E. Stocker, “Understanding cloud computing vulnerabilities,” Security & Privacy, IEEE, vol. 9, no. 2, pp. 50–57, 2011.
- [20] T. Ristenpart, E. Tromer, H. Shacham, and S. Savage, “Hey, you, get off of my cloud: exploring information leakage in third-party compute clouds,” in Proceedings of the 16th ACM conference on Computer and communications security. ACM, 2009, pp. 199–212.
- [21] D. F. Ferraiolo, R. Sandhu, S. Gavrila, D. R. Kuhn, and R. Chandramouli, “Proposed nist standard for role-based access control,” ACM Transactions on Information and System Security (TISSEC), vol. 4, no. 3, pp. 224–274, 2001.
- [22] J. Hall. (2015) Role-based access control in the microsoft azure portal. [Online]. Available: https://azure.microsoft.com/en-us/documentation/articles/role-based-access-control-configure/
- [23] S. Connaire, J. Weiss, S. Dunn, and S. Kinkead. (2015) Oracle¨ sales cloud securing oracle sales cloud. [Online]. Available: http://docs.oracle.com/cloud/latest/salescs_gs/OSCUS.pdf
- [24] A. Samuel, A. Ghafoor, and E. Bertino, “Context-aware adaptation of access-control policies,” IEEE Internet Computing, vol. 12, no. 1, 2008.
- [25] B. Shebaro, O. Oluwatimi, and E. Bertino, “Context-based access control systems for mobile devices,” Dependable and Secure Computing, IEEE Transactions on, vol. 12, no. 2, pp. 150–163, 2015.
- [26] A. Samuel, M. I. Sarfraz, H. Haseeb, S. M. Basalamah, and A. Ghafoor, “A framework for composition and enforcement of privacy-aware and context-driven authorization mechanism for multimedia big data,” IEEE Trans. Multimedia, vol. 17, no. 9, pp. 1484–1494, 2015.
- [27] H. Zhang, I. F. Ilyas, and K. Salem, “Psalm: Cardinality estimation in the presence of fine-grained access controls,” in Data Engineering, 2009. ICDE’09. IEEE 25th International Conference on. IEEE, 2009, pp. 505–516.
- [28] B. F. Cooper, A. Silberstein, E. Tam, R. Ramakrishnan, and R. Sears, “Benchmarking cloud serving systems with ycsb,” in Proceedings of the 1st ACM symposium on Cloud computing. ACM, 2010, pp. 143–154.
- [29] T. M. Cover and J. A. Thomas, Elements of information theory. John Wiley & Sons, 2012.
- [30] R. Jain, D.-M. Chiu, and W. R. Hawe, A quantitative measure of fairness and discrimination for resource allocation in shared computer system, 1984.
- [31] D. Nurmi, R. Wolski, C. Grzegorczyk, G. Obertelli, S. Soman, L. Youseff, and D. Zagorodnov, “The eucalyptus open-source cloud-computing system,” in Cluster Computing and the Grid, 2009. CCGRID’09. 9th IEEE/ACM International Symposium on. IEEE, 2009, pp. 124–131.
- [32] P. K. Manadhata and J. M. Wing, “An attack surface metric,” Software Engineering, IEEE Transactions on, vol. 37, no. 3, pp. 371–386, 2011.
- [33] O. H. Alhazmi, Y. K. Malaiya, and I. Ray, “Measuring, analyzing and predicting security vulnerabilities in software systems,” Computers & Security, vol. 26, no. 3, pp. 219–228, 2007.
- [34] J. Walden and M. Doyle, “Savi: Static-analysis vulnerability indicator,” IEEE Security & Privacy, vol. 10, no. 3, pp. 32–39, 2012.
- [35] L. K. Shar, L. C. Briand, and H. B. K. Tan, “Web application vulnerability prediction using hybrid program analysis and machine learning,” IEEE Transactions on Dependable and Secure Computing, vol. 12, no. 6, pp. 688–707, 2015.
- [36] F. Massacci and V. H. Nguyen, “An empirical methodology to evaluate vulnerability discovery models,” IEEE Transactions on Software Engineering, vol. 40, no. 12, pp. 1147–1162, 2014.
- [37] S. Rahimi and M. Zargham, “Vulnerability scrying method for software vulnerability discovery prediction without a vulnerability database,” Reliability, IEEE Transactions on, vol. 62, no. 2, pp. 395–407, 2013.
- [38] P. Mell, K. Scarfone, and S. Romanosky, “A complete guide to the common vulnerability scoring system version 2.0,” in Published by FIRST-Forum of Incident Response and Security Teams, 2007, pp. 1–23.
- [39] Z. Wen, J. Cala, P. Watson, and A. Romanovsky, “Cost effective, reliable and secure workflow deployment over federated clouds,” IEEE Transactions on Services Computing, 2016.
- [40] H. Chen, X. Zhu, D. Qiu, L. Liu, and Z. Du, “Scheduling for workflows with security-sensitive intermediate data by selective tasks duplication in clouds,” IEEE Transactions on Parallel and Distributed Systems, 2017.
- [41] J. Chase, D. Niyato, P. Wang, S. Chaisiri, and R. Ko, “A scalable approach to joint cyber insurance and security-as-a-service provisioning in cloud computing,” IEEE Transactions on Dependable and Secure Computing, 2017.