CTC-DRO: Robust Optimization for Reducing Language Disparities
in Speech Recognition
Abstract
Modern deep learning models often achieve high overall performance, but consistently fail on specific subgroups. Group distributionally robust optimization (group DRO) addresses this problem by minimizing the worst-group loss, but it fails when group losses misrepresent performance differences between groups. This is common in domains like speech, where the widely used connectionist temporal classification (CTC) loss scales with input length and varies with linguistic and acoustic properties, leading to spurious differences between group losses. We present CTC-DRO, which addresses the shortcomings of the group DRO objective by smoothing the group weight update to prevent overemphasis on consistently high-loss groups, while using input length-matched batching to mitigate CTC’s scaling issues. We evaluate CTC-DRO on the task of multilingual automatic speech recognition (ASR) across five language sets from the ML-SUPERB 2.0 benchmark. CTC-DRO consistently outperforms group DRO and CTC-based baseline models, reducing the worst-language error by up to and the average error by up to . CTC-DRO can be applied to ASR with minimal computational costs, and offers the potential for reducing group disparities in other domains with similar challenges.
1 Introduction
State-of-the-art deep learning models are often highly accurate on training data populations, while consistently underperforming on specific subpopulations or groups (Hashimoto et al., 2018; Duchi et al., 2023). One practical setting where this issue has very large effects is multilingual automatic speech recognition (ASR), where performance varies substantially between languages (Radford et al., 2023; Pratap et al., 2024; Shi et al., 2024). Such models, which jointly perform language identification (LID) and ASR in many languages, could help improve accessibility and increase digital participation for speakers worldwide (Besacier et al., 2014).
Distributionally robust optimization (DRO), particularly group DRO (Sagawa et al., 2020), has the potential to mitigate language disparities in multilingual ASR. group DRO improves group robustness by dynamically up-weighting high-loss groups during training. However, it requires comparable training losses between groups to perform well (Oren et al., 2019; Sagawa et al., 2020), and this condition is often not met in ASR model training, because of differences in input length and speaker and acoustic characteristics across language-specific datasets. In this paper we focus on a training approach that has been successful in recent multilingual ASR benchmarks: pre-trained self-supervised models fine-tuned with the connectionist temporal classification (CTC; Graves et al., 2006) objective (Rouditchenko et al., 2023; Chen et al., 2024; Pratap et al., 2024). Differences in CTC-based training losses due to length, speaker, and acoustics may lead to varying magnitudes and irreducible components of losses across different groups. As a result, some groups with disproportionately high losses may dominate training with group DRO, causing under-training of the other groups, and ultimately negatively impacting overall downstream performance (Słowik & Bottou, 2022).
To address these issues, we present CTC-DRO, which optimizes a generalization of the group DRO objective, specifically by smoothing the up-weighting of high-loss groups. This new objective prevents overemphasis on groups with consistently and disproportionately high training losses. Also, we use length-matched group losses to mitigate the scaling properties of CTC. We evaluate CTC-DRO using language subsets randomly selected from the ML-SUPERB 2.0 (Shi et al., 2024) benchmark. In this setting, CTC-DRO models outperform both group DRO and CTC-based baseline models across five language sets. Specifically, CTC-DRO models reduce the error rate of the worst-performing language in all of the five sets, with improvements of up to , while also improving the average performance across all languages by up to . Our code and newly trained models will be made publicly available.
2 Background
2.1 Group DRO
Given a family of models , loss function and training data drawn from empirical distribution , the standard training procedure for label prediction involves minimizing the expected loss over the training data:
| (1) |
In contrast, group DRO aims to minimize the worst-case expected loss over a set of pre-defined groups or sub-distributions in the training data:
| (2) |
Following Sagawa et al. (2020), this objective can be rewritten as:
| (3) |
where is the -dimensional probability simplex, and is a weight for group . Sagawa et al. (2020) propose an online algorithm to optimize this objective, treating the problem as a minimax game and interleaving gradient ascent updates on with gradient descent updates on for training data mini-batches (Algorithm 1).
2.2 CTC
The CTC objective (Graves et al., 2006) defines a method to learn a mapping between an input sequence and an output sequence without requiring a known alignment between them, but assuming and a monotonic alignment. CTC uses a blank output token to handle that do not map to any output symbol. Consider , which is the set of all sequences of length that are composed of tokens from , and . Each sequence is a potential alignment between and . CTC defines a collapsing function that merges consecutive, identical symbols and removes in an alignment . The set of alignments that collapse to using this function forms the set of valid alignments . For example, a possible alignment for could be: . The conditional probability for any alignment is computed as:
| (4) |
where and is the model’s predicted probability for symbol at time . The predicted probability of the output sequence , , is then computed by marginalizing over the probabilities of all valid alignments :
| (5) |
The CTC loss function for is then defined as:
| (6) |
2.3 Limitations of Group DRO Applied to CTC
The CTC loss, as defined in equation 6, scales with the length of the input sequence and the length of the output sequence . This scaling behavior occurs because is a marginalization over all valid alignments . Each alignment is a sequence of length , which collapses to an output sequence of length . As increases relative to , the number of valid alignments increases as well (Graves et al., 2006). As each alignment’s probability is the product of per-element probabilities, its value typically decreases as increases. Therefore, their sum remains relatively low, as the per-alignment probabilities typically decrease faster than the number of valid alignments increases. In practice, this often results in a higher CTC loss for longer sequences.
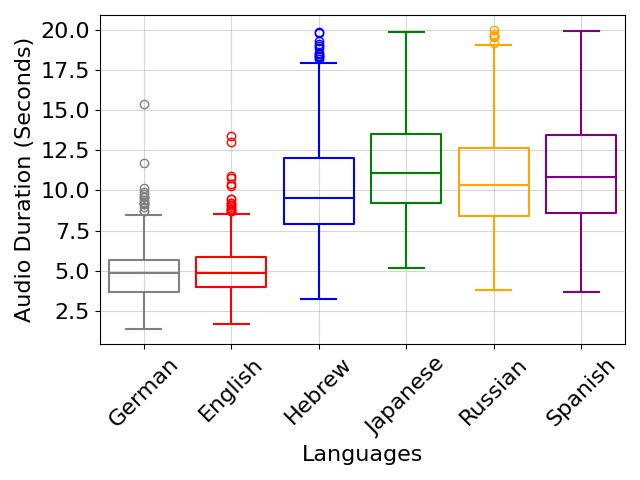
Therefore, differences in the distribution of or between groups can result in CTC losses that are not directly comparable. For example, a long audio sample (large ) may have fewer errors overall, but a higher loss than a short audio sample (small ) if their transcription lengths are similar. In Figure 1, we illustrate the need to address this challenge, showing that there are large differences in the distribution of audio sample lengths across various groups (in this case, languages) included in our experimental setup, which we further detail in Section 4. In this example, Spanish has a high proportion of long utterances, resulting in higher CTC losses. We find that the group DRO algorithm assigns a larger weight to this group, even though it is among the best groups in terms of downstream performance in our experiments, as shown in Section 5.
However, normalizing the impact of length differences on the CTC loss alone would be insufficient to address the problem of incomparable CTC losses across languages. The CTC loss also varies due to differences in linguistic and acoustic properties across the pre-defined groups. This may cause variance in the irreducible component of the training loss (Malinin & Gales, 2018).
In line with observations made in past work (Oren et al., 2019; Słowik & Bottou, 2022), we show that this inherent incomparability of losses across groups poses a critical challenge for group DRO. From Algorithm 1, we compute the gradient ascent update to , given group losses , as:
| (7) |
This is equivalent to the Hedge algorithm (Slivkins, 2019) update for the following maximization objective:
| (8) |
Now consider a situation where one of the groups consistently has the highest training losses among all groups during training, presumably due to long audio samples or lengthy transcriptions, as well as the highest irreducible loss. This will result in its weight consistently receiving the largest increases during training, as:
| (9) |
As a result, will grow disproportionally large over the course of training, eventually drawing all the weight away from the other groups. This can result in other groups being under-trained, which will cause a substantial decrease in their downstream performance (see Section 5).
This result highlights the problems caused by the fundamental mismatch between the computed loss and the ideal loss for use in group DRO. The ideal loss would measure only the excess loss beyond each group’s irreducible component and be length-normalized. However, in our setting neither the irreducible component of the training loss nor a direct normalization of the CTC loss is easy to estimate. Existing solutions, such as calibrating group losses or approximating disparities between groups with simpler models (Oren et al., 2019; Słowik & Bottou, 2022), would either require a substantial increase in computational cost or a proxy for group difficulty, for which there is no reliable model for speech to our knowledge. Therefore, CTC remains inherently incompatible with group DRO.
3 CTC-DRO
To address the identified challenges, we propose a new training algorithm: CTC-DRO (Algorithm 2). This algorithm computes length-matched losses across groups to mitigate the scaling properties of CTC, and uses a generalization of the group DRO objective that introduces a new smoothed maximization objective for the group weights to prevent overemphasis on groups with consistently high training losses. Like group DRO, CTC-DRO has minimal computational costs, only keeping track of a single scalar weight for every group in the training data.
3.1 Length-Matched Group Losses
To address incomparable CTC losses across groups due to different distributions of audio lengths, we ensure that the CTC loss for each group is computed using roughly equal total audio durations. Specifically, we create a new batch sampler that selects batches of audio samples and corresponding transcripts , all from a single, randomly-selected group , while ensuring that their total audio duration is as close to a fixed value (set as a hyperparameter) as possible.111Group utterances are iteratively added to a batch until the total duration meets or slightly exceeds the set target duration. However, batches with a larger number of shorter audio samples tend to have a lower CTC loss per audio sample than batches with few, longer, audio samples. Therefore, we sum the utterance-level CTC losses in a batch (see line 10 in Algorithm 2) and update the group weights using this sum instead of the mean loss used in the group DRO algorithm. During training, these summed losses are tracked for each group, and a group weight update is performed only after at least one batch has been processed for every group. If a group is sampled multiple times before the update, the corresponding summed losses are averaged. This approach effectively increases the batch size for computing the group weight update.
Also, we multiply the losses by the total number of groups (line 21 in Algorithm 2) before performing gradient descent on the model parameters. This ensures that the training losses with CTC-DRO are comparable to a model trained without CTC-DRO, removing the need to tune shared hyperparameters, such as the learning rate, separately for both training algorithms.
3.2 Smoothed Maximization Objective
We propose a new method for updating the group weights, which addresses group DRO’s tendency to assign a disproportionately large weight to groups with consistently high training losses. This approach also helps mitigate the scaling properties of CTC related to transcription length, which our initial experiments showed cannot be adequately resolved by normalizing for transcript length.
We propose a generalization of the group DRO maximization objective (Equation 8), containing a new smoothing hyperparameter :
| (10) |
Following the Hedge algorithm (Slivkins, 2019) for this objective, the new update rule is (line 14–19 in Algorithm 2):
| (11) |
As , the update becomes increasingly more sensitive to the current group weight relative to the group loss. This causes groups with higher weights to receive smaller updates, resulting in a more uniform distribution of the group weights. In contrast, as increases, updates depend more on the group loss compared to the group weight, increasing the group weights more strongly for groups with higher losses. In fact, when , the update rule reduces to:
| (12) |
recovering the group DRO update and confirming that the new objective is indeed a generalization.
This update rule has several desirable properties. First, the updates to are smoother, because they are inversely proportional to the current , while still being proportional to the loss . This discourages any single group from having a disproportionately large weight relative to its group loss, leading to a more balanced distribution of the group weights. Second, the update rule adjusts for differences in group weights when the CTC losses are similar. Specifically, if two groups with different have similar CTC losses, the group with the lower receives a larger update. This helps prevent under-training of lower-weighted groups by reducing the gap between the group weights over time.
Along with these desirable properties, we demonstrate that our new objective does not change the fundamental behavior of the group DRO objective, assigning higher weights to groups with higher losses. Expanding the conditions for the probability simplex and taking the Lagrangian of equation 10, we obtain:
| (13) |
where and are Lagrangian multipliers and for all . To find the optimal , we calculate the partial derivative of with respect to and set it to 0:
| (14) |
This equation then rearranges to:
| (15) |
Thus, the optimal weight for a group is directly proportional to its loss, after subtracting and enforcing non-negativity.
4 Experiments
We fine-tune the existing, self-supervised multilingual XLS-R and MMS models (Babu et al., 2022; Pratap et al., 2024) on the task of multilingual ASR (formulated as a joint task of ASR and LID) using data from the ML-SUPERB 2.0 benchmark (more on the data in 4.1). Following the setup of ML-SUPERB 2.0, we add two Transformer layers and a softmax layer on top of the pre-trained models to predict a language token followed by character sequences using CTC. We do not use a separate LID head or loss, and update all model parameters. The models we choose have shown the best performance on ML-SUPERB 2.0 (Shi et al., 2024), outperforming other models like Whisper (Radford et al., 2023). The two pre-trained models share the same architecture and training objective (Baevski et al., 2020), but their training data differs: XLS-R is pre-trained on roughly 436K hours of speech in 128 languages, while MMS is pre-trained on 491K hours of speech in 1406 languages.
We train the models using three approaches. First, our baseline models use the joint ASR and LID training setup adopted in ML-SUPERB 2.0, as described above. Second, we fine-tune models using our proposed CTC-DRO algorithm. Third, we train models using the group DRO algorithm for comparison. When training both CTC-DRO and group DRO models, the groups correspond to the languages in our training datasets (see Section 4.1).
We mostly follow the hyperparameters used by Babu et al. (2022), Pratap et al. (2024), and in ML-SUPERB 2.0, but train for 40 epochs, retaining the model checkpoint with the lowest loss on the development data, accumulate gradients across 16 batches, and tune the learning rate of the baseline models on our development data. We also use this learning rate to train models with CTC-DRO and group DRO. Lastly, for the CTC-DRO and group DRO models, we tune the DRO-specific hyperparameters on the development set as well, specifically and .
4.1 Dataset
We use the ML-SUPERB 2.0 dataset for our experiments. This dataset belongs to an established benchmark where a number of multilingual ASR models have already been compared. It has broad coverage of 141 languages sourced from 15 corpora, and contains more natural speech compared to smaller, translation focused corpora, such as FLEURS (Conneau et al., 2023). For each language-corpus pair, there is at least one hour of training data available, as well as 10 minutes each for development and test data. While the amount of training data for many of the languages is limited to one hour, 62 languages occur in more than one corpus, increasing their training data up to nine hours.
For our main experiments, we use a balanced data setup by randomly selecting five sets from ML-SUPERB 2.0 that consist of six language-corpus pairs (Table 1, dataset statistics in Appendix A). We thus have one hour of training data, and 10 minutes of development and test data available for each language-corpus pair in each set. The selection of language-corpus pairs is based on the character error rates (CERs) of the best-performing model configuration from ML-SUPERB 2.0. Specifically, for each set, we randomly select two language-corpus pairs from the bottom 10 percentile of CERs, two language-corpus pairs from the top 10 percentile of CERs, and two language-corpus pairs with CERs between the 10th and 90th percentiles.
For the first two language sets, we also investigate the effect of using additional training data (unbalanced setup), as most languages in these sets have more than one hour of training data available. We list these sets and the corpora included in Appendix A.
| Set # | Languages (ISO code, Corpus) |
|---|---|
| 1 | Czech (ces, CV), Mandarin (cmn, Fleurs) |
| Min Nan (nan, CV), Polish (pol, MSD) | |
| Romanian (ron, Fleurs), Spanish (spa, VF) | |
| 2 | Cantonese (yue, Fleurs), Croatian (hrv, Fleurs) |
| English (eng, LAD), Italian (ita, Fleurs) | |
| Persian (fas, CV), Slovak (slk, Fleurs) | |
| 3 | Khmer (khm, Fleurs), Korean (kor, Fleurs) |
| Northern Kurdish (kmr, CV), Nynorsk (nno, CV) | |
| Southern Ndebele (nbl, NCHLT), Tatar (tat, CV) | |
| 4 | Sindhi (snd, Fleurs), Slovenian (slv, CV) |
| Southern Sotho (sot, GOP), Spanish (spa, MSD) | |
| Urdu (urd, Fleurs), Western Mari (mrj, CV) | |
| 5 | English (eng, VF), German (deu, VF) |
| Hebrew (heb, Fleurs), Japanese (jpn, Fleurs) | |
| Russian (rus, Fleurs), Spanish (spa, Fleurs) |
4.2 Evaluation
We compare the performance of CTC-DRO models to the baseline and group DRO models. The models are evaluated in terms of the standard metrics of CER and LID accuracy on the test sets from the five language sets. The CER can be computed by comparing the system generated and reference transcripts using the formula:
| (16) |
where is the number of insertions, the number of substitutions, and the number of deletions in a minimum edit distance alignment between the reference and system output, and is the number of characters in the reference transcript. We report the CER of the worst-performing language, as well as the average CER across languages. For the CTC-DRO and group DRO models, we report the performance of the model checkpoint with the largest CER improvement on the worst-performing language relative to the baseline on the development set.
5 Results
| Set | Model | Type | Max CER | Avg CER | LID |
|---|---|---|---|---|---|
| # | (ISO) () | () | () | ||
| 1 | MMS | Baseline | 59.7 (nan) | 24.1 | 96.6 |
| group DRO | 86.0 (nan) | 31.9 | 62.8 | ||
| CTC-DRO | 56.2 (nan) | 21.9 | 97.6 | ||
| XLS-R | Baseline | 187.9 (cmn) | 58.5 | 77.8 | |
| group DRO | 86.6 (cmn) | 40.3 | 86.8 | ||
| CTC-DRO | 64.0 (nan) | 30.6 | 87.8 | ||
| 2 | MMS | Baseline | 45.2 (yue) | 15.5 | 98.4 |
| group DRO | 56.9 (yue) | 21.9 | 97.3 | ||
| CTC-DRO | 43.5 (yue) | 14.8 | 98.2 | ||
| XLS-R | Baseline | 64.8 (yue) | 17.4 | 96.6 | |
| group DRO | 60.0 (yue) | 22.2 | 88.6 | ||
| CTC-DRO | 43.7 (yue) | 15.4 | 96.4 | ||
| 3 | MMS | Baseline | 36.6 (kor) | 16.8 | 99.2 |
| group DRO | 33.4 (kor) | 20.9 | 98.8 | ||
| CTC-DRO | 32.8 (khm) | 16.0 | 99.2 | ||
| XLS-R | Baseline | 34.0 (khm) | 16.4 | 97.9 | |
| group DRO | 36.9 (khm) | 24.1 | 96.5 | ||
| CTC-DRO | 32.4 (kor) | 16.6 | 96.5 | ||
| 4 | MMS | Baseline | 28.4 (urd) | 15.2 | 89.9 |
| group DRO | 30.5 (urd) | 15.6 | 92.1 | ||
| CTC-DRO | 26.3 (urd) | 14.6 | 94.7 | ||
| XLS-R | Baseline | 29.7 (urd) | 14.6 | 88.4 | |
| group DRO | 26.3 (slv) | 18.8 | 83.5 | ||
| CTC-DRO | 24.2 (urd) | 13.7 | 88.9 | ||
| 5 | MMS | Baseline | 98.2 (jpn) | 28.6 | 98.4 |
| group DRO | 61.1 (jpn) | 29.9 | 67.0 | ||
| CTC-DRO | 53.0 (jpn) | 21.9 | 98.9 | ||
| XLS-R | Baseline | 120.9 (jpn) | 32.5 | 89.0 | |
| group DRO | 98.1 (jpn) | 38.1 | 57.7 | ||
| CTC-DRO | 77.1 (jpn) | 26.0 | 91.0 |
We present the results of our experiments using balanced and additional training data in Table 2 and Table 3, respectively (more detailed results in Appendix B). In line with previous work (e.g., Pratap et al., 2024 and Shi et al., 2024), we find substantial performance differences between languages for our baseline models trained without group DRO or CTC-DRO, as shown by the large difference between the CER of the worst-performing language and the average CER across languages (for more details see Appendix B). This finding applies to each of the evaluated sets, regardless of whether the training data for each of the languages is balanced or unbalanced.
For each language set, CTC-DRO models achieve a lower CER for the worst-performing language compared to the baseline and group DRO models. The largest improvement is obtained on set 1 using XLS-R in the balanced data setting, showing a relative CER reduction of compared to the baseline model. Note that CTC-DRO also results in the best average CER in 13 out of 14 settings (seven sets with two models each) compared to both the baseline and group DRO models, leading to relative CER reductions up to . The only exception is for XLS-R in balanced set 3, where the average CER is slightly worse with CTC-DRO (16.6%) than the baseline (16.4%). In terms of LID accuracy, CTC-DRO models improve over the baseline models in 10 out of 14 settings, with a maximum improvement of 10 points for XLS-R in balanced set 1. In the remaining settings, the LID accuracy already exceeds 90%, leaving little room for further improvement with CTC-DRO.
In contrast, group DRO worsens the CER of the worst-performing language in seven out of 14 settings compared to the baseline model, with the highest relative CER increase of on set 2 using MMS trained on all available training data. Also, group DRO increases the average CER compared to the baseline in 13 out of 14 settings. This finding shows the ineffectiveness of the original group DRO formulation in this challenging setting, and the substantial added robustness of the modifications in CTC-DRO.
In four settings, the worst-performing language changes between the baseline and CTC-DRO models. For example, in set 3 with MMS trained on balanced data, it shifts from Korean to Khmer. As shown in Table 7, the CTC-DRO model reduces the CER for Korean from 36.6 to 29.6, while slightly increasing the CER for Khmer from 32.1 to 32.8. Overall, CTC-DRO consistently improves the performance of the worst-performing language, occasionally at a small cost to the performance of other languages, while still achieving a lower CER on average (see Appendix B).
| Set | Model | Type | Max CER | Avg CER | LID |
|---|---|---|---|---|---|
| # | (ISO) () | () | () | ||
| 1 | MMS | Baseline | 67.5 (nan) | 25.6 | 98.1 |
| group DRO | 97.2 (nan) | 38.6 | 83.9 | ||
| CTC-DRO | 62.8 (nan) | 22.8 | 98.5 | ||
| XLS-R | Baseline | 92.1 (cmn) | 35.6 | 96.4 | |
| group DRO | 88.4 (nan) | 37.9 | 72.3 | ||
| CTC-DRO | 67.5 (nan) | 26.9 | 97.1 | ||
| 2 | MMS | Baseline | 66.9 (yue) | 19.5 | 99.0 |
| group DRO | 105.8 (yue) | 40.2 | 81.0 | ||
| CTC-DRO | 48.1 (yue) | 16.4 | 99.1 | ||
| XLS-R | Baseline | 97.2 (yue) | 28.0 | 98.2 | |
| group DRO | 100.6 (yue) | 44.3 | 80.8 | ||
| CTC-DRO | 51.4 (yue) | 18.8 | 98.6 |
6 Analysis
Next, we present an ablation study to measure the contributions of the length-matched group losses and smoothed maximization objective introduced in CTC-DRO (Section 6.1). To this end, we train CTC-DRO models with each of these components removed on balanced training data from set 5, which showed the largest reduction in CER for the worst-performing language (Table 2). We also describe and compare how the group weights of CTC-DRO and group DRO models change throughout training (Section 6.2). For brevity, we focus on the XLS-R models trained on the same set, showing that CTC-DRO results in more stable training.


6.1 Ablation Study
We find that removing either component from CTC-DRO leads to a substantial decrease in performance (see Table 4, detailed results in Appendix B). Specifically, the CER of the worst-performing language increases by up to and the average CER by up to compared to a model trained using the complete CTC-DRO algorithm. The ablation study also shows that the smoothed maximization objective has the strongest effect on reducing both the CER of the worst-performing language and the average CER.
| Model | Type | Max CER | Avg CER | LID |
|---|---|---|---|---|
| (ISO) () | () | () | ||
| MMS | Baseline | 98.2 (jpn) | 28.6 | 98.4 |
| CTC-DRO | 53.0 (jpn) | 21.9 | 98.9 | |
| - Dur | 84.6 (jpn) | 29.5 | 66.1 | |
| - Smooth | 102.1 (jpn) | 97.9 | 13.2 | |
| XLS-R | Baseline | 120.9 (jpn) | 32.5 | 89.0 |
| CTC-DRO | 77.1 (jpn) | 26.0 | 91.0 | |
| - Dur | 115.2 (nan) | 50.6 | 51.5 | |
| - Smooth | 194.2 (nan) | 61.4 | 43.2 |
6.2 Comparison of Group Weights
To analyze the behavior of group DRO and CTC-DRO models during training, we plot the group weights for all languages in set 5 throughout training (Figure 2). We find that the group weights of the group DRO model fluctuate substantially during training, reaching values close to 0 or 1 at various stages of training. For extended periods of training with group DRO, the group weights are heavily concentrated on a single language, causing the weights for all other languages to reach values close to 0.
In contrast, the group weights of the CTC-DRO model are distributed more evenly across all languages throughout training. The group weights for each language also fluctuate substantially less during training compared to group DRO. The only languages with group weights dropping below 0.1 at any point are German and English, both of which have low CERs on the development set (results not shown). Importantly, the weight of Japanese (worst-performing) consistently remains among the top two highest group weights.
7 Related Work
Robustness to distribution shifts
Prior work categorizes distribution shifts as domain generalization (Quinonero-Candela et al., 2008; Santurkar et al., 2021; Hendrycks et al., 2021), where train and test data domains have no overlap, or subpopulation shifts (Dixon et al., 2018; Oren et al., 2019; Sagawa et al., 2020), where train and test data come from the same domains, but do not necessarily appear in the same proportions (Koh et al., 2021). Our experimental setup is an example of a subpopulation shift, as all test languages are included in the training data for the models.
Methods for robust generalization are commonly categorized into three groups. Domain invariance methods aim to learn feature representations that are consistent across domains (groups) by encouraging similar feature distributions across domains (Tzeng et al., 2014; Long et al., 2015; Ganin et al., 2016; Sun & Saenko, 2016). Other approaches use invariant prediction methods (Meinshausen & Bühlmann, 2015; Peters et al., 2016; Arjovsky et al., 2019; Rothenhäusler et al., 2021) from causal inference literature. In contrast, DRO explicitly minimizes the worst-case loss over an uncertainty set, which is typically defined as a divergence ball around the training distribution (Namkoong & Duchi, 2016; Esfahani & Kuhn, 2018; Bertsimas et al., 2018; Duchi & Namkoong, 2019; Oren et al., 2019; Sagawa et al., 2020). Our work builds upon group DRO (Sagawa et al., 2020), since it has outperformed other approaches in settings with subpopulation shifts (Koh et al., 2021).
Robust ASR
Prior work on robustness in ASR primarily focuses on quantifying or addressing biases related to accent, age, dialect, gender, and race (Tatman, 2017; Koenecke et al., 2020; Ngueajio & Washington, 2022; Markl, 2022; Martin & Wright, 2022; Feng et al., 2024; Harris et al., 2024). Methods to mitigate these biases include data balancing (Dheram et al., 2022) and fairness-promoting training methods (Sarı et al., 2021; Zhang et al., 2022; Veliche & Fung, 2023). These methods are not appropriate for reducing ASR language disparities, as they either require large amounts of training data, which may not be available for most languages, or improve performance for certain groups at a substantial cost to others. Gao et al. (2022) explored DRO for training language-independent speech recognition models, and reported negative results. To the best of our knowledge, our work is the first to propose a robust optimization method that successfully reduces cross-lingual performance disparities in ASR.
8 Conclusion
CTC-DRO, our robust optimization approach motivated by multilingual ASR, addresses group DRO’s inability to handle group losses that do not accurately reflect performance differences between groups. When applied to data from a multilingual ASR and LID benchmark, CTC-DRO outperformed baseline CTC-based and group DRO models, reducing the worst-language CER across all sets and improving average CER and LID accuracy in almost all cases. Our analysis showed that this result can be attributed to the smoothed maximization objective and length-matched batching that balance and stabilize the group weights.
While performance disparities are reduced in our approach, they are not eliminated. The improvements may be sufficient to make ASR useful for more languages than before, but additional work is needed before ASR is truly practical for many more languages. Such work could include automatically learning data groupings, removing the need for pre-defined groups that may be unknown or incomplete, as well as applying CTC-DRO to pre-training.
Also, we believe the principles underlying CTC-DRO have broader applicability. Other tasks that use variable-length sequences as input data and therefore face similar challenges, such as language modeling and video transcription, could potentially benefit from our algorithm, enabling more inclusive processing of other data modalities as well.
Impact Statement
Our CTC-DRO approach reduces performance differences between languages in modern multilingual ASR models with minimal computational costs, ensuring it can be readily adopted. Our work therefore has the potential to positively impact speakers of many languages worldwide, including digitally underrepresented languages and varieties, by improving their access to information and services. However, several challenges remain. The performance of multilingual ASR needs to further improve before it can be deployed in real-world settings for many languages. In addition, improved ASR for underrepresented languages and varieties calls for careful, community-driven evaluation to ensure modern technology is aligned with local interests. In this process, it is important to evaluate CTC-DRO’s impact in varied real-world settings to ensure our algorithm benefits all language communities. For example, many practical settings may include types of linguistic and acoustic variation that we have not encountered in our data, and in some settings CER may not be the most useful performance measure (e.g., it may not correlate well with the usefulness of the transcripts for the target use cases).
References
- Ardila et al. (2020) Ardila, R., Branson, M., Davis, K., Kohler, M., Meyer, J., Henretty, M., Morais, R., Saunders, L., Tyers, F., and Weber, G. Common Voice: A Massively-Multilingual Speech Corpus. In Proceedings of the Language Resources and Evaluation Conference, 2020.
- Arjovsky et al. (2019) Arjovsky, M., Bottou, L., Gulrajani, I., and Lopez-Paz, D. Invariant risk minimization. arXiv preprint arXiv:1907.02893, 2019.
- Babu et al. (2022) Babu, A., Wang, C., Tjandra, A., Lakhotia, K., Xu, Q., Goyal, N., Singh, K., von Platen, P., Saraf, Y., Pino, J., Baevski, A., Conneau, A., and Auli, M. XLS-R: Self-supervised Cross-lingual Speech Representation Learning at Scale. In Proceedings of Interspeech, 2022.
- Baevski et al. (2020) Baevski, A., Zhou, H., Mohamed, A., and Auli, M. wav2vec 2.0: a framework for self-supervised learning of speech representations. In Proceedings of Advances in Neural Information Processing Systems, 2020.
- Barnard et al. (2014) Barnard, E., Davel, M. H., van Heerden, C., de Wet, F., and Badenhorst, J. The NCHLT speech corpus of the South African languages. In Proceedings of the Workshop on Spoken Language Technologies for Under-Resourced Languages, 2014.
- Baumann et al. (2019) Baumann, T., Köhn, A., and Hennig, F. The Spoken Wikipedia Corpus collection: Harvesting, alignment and an application to hyperlistening. Language Resources and Evaluation, 53(2):303–329, 2019.
- Bertsimas et al. (2018) Bertsimas, D., Gupta, V., and Kallus, N. Data-driven robust optimization. Mathematical Programming, 167:235–292, 2018.
- Besacier et al. (2014) Besacier, L., Barnard, E., Karpov, A., and Schultz, T. Automatic speech recognition for under-resourced languages: A survey. Speech communication, 56:85–100, 2014.
- Braude et al. (2019) Braude, D. A., Aylett, M. P., Laoide-Kemp, C., Ashby, S., Scott, K. M., Raghallaigh, B. O., Braudo, A., Brouwer, A., and Stan, A. All Together Now: The Living Audio Dataset. In Proceedings of Interspeech, 2019.
- Chen et al. (2024) Chen, W., Zhang, W., Peng, Y., Li, X., Tian, J., Shi, J., Chang, X., Maiti, S., Livescu, K., and Watanabe, S. Towards Robust Speech Representation Learning for Thousands of Languages. In Proceedings of the Conference on Empirical Methods in Natural Language Processing, 2024.
- Conneau et al. (2023) Conneau, A., Ma, M., Khanuja, S., Zhang, Y., Axelrod, V., Dalmia, S., Riesa, J., Rivera, C., and Bapna, A. FLEURS: FEW-Shot Learning Evaluation of Universal Representations of Speech. In IEEE Spoken Language Technology Workshop, 2023.
- Dheram et al. (2022) Dheram, P., Ramakrishnan, M., Raju, A., Chen, I.-F., King, B., Powell, K., Saboowala, M., Shetty, K., and Stolcke, A. Toward fairness in speech recognition: Discovery and mitigation of performance disparities. In Proceedings of Interspeech, 2022.
- Dixon et al. (2018) Dixon, L., Li, J., Sorensen, J., Thain, N., and Vasserman, L. Measuring and mitigating unintended bias in text classification. In Proceedings of the AAAI/ACM Conference on AI, Ethics, and Society, 2018.
- Duchi & Namkoong (2019) Duchi, J. and Namkoong, H. Variance-based Regularization with Convex Objectives. Journal of Machine Learning Research, 20(68):1–55, 2019.
- Duchi et al. (2023) Duchi, J., Hashimoto, T., and Namkoong, H. Distributionally robust losses for latent covariate mixtures. Operations Research, 71(2):649–664, 2023.
- Esfahani & Kuhn (2018) Esfahani, P. M. and Kuhn, D. Data-driven distributionally robust optimization using the Wasserstein metric: Performance guarantees and tractable reformulations. Mathematical Programming, 171(1):115–166, 2018.
- Feng et al. (2024) Feng, S., Halpern, B. M., Kudina, O., and Scharenborg, O. Towards inclusive automatic speech recognition. Computer Speech & Language, 84:101567, 2024.
- Ganin et al. (2016) Ganin, Y., Ustinova, E., Ajakan, H., Germain, P., Larochelle, H., Laviolette, F., March, M., and Lempitsky, V. Domain-adversarial training of neural networks. Journal of machine learning research, 17(59):1–35, 2016.
- Gao et al. (2022) Gao, H., Ni, J., Zhang, Y., Qian, K., Chang, S., and Hasegawa-Johnson, M. Domain Generalization for Language-Independent Automatic Speech Recognition. Frontiers in Artificial Intelligence, 5:806274, 2022.
- Graves et al. (2006) Graves, A., Fernández, S., Gomez, F., and Schmidhuber, J. Connectionist temporal classification: labelling unsegmented sequence data with recurrent neural networks. In Proceedings of the International Conference on Machine learning, 2006.
- Harris et al. (2024) Harris, C., Mgbahurike, C., Kumar, N., and Yang, D. Modeling gender and dialect bias in automatic speech recognition. In Al-Onaizan, Y., Bansal, M., and Chen, Y.-N. (eds.), Findings of the Association for Computational Linguistics: EMNLP, 2024.
- Hashimoto et al. (2018) Hashimoto, T., Srivastava, M., Namkoong, H., and Liang, P. Fairness Without Demographics in Repeated Loss Minimization. In Proceedings of the International Conference on Machine Learning, 2018.
- He et al. (2020) He, F., Chu, S.-H. C., Kjartansson, O., Rivera, C., Katanova, A., Gutkin, A., Demirsahin, I., Johny, C., Jansche, M., Sarin, S., and Pipatsrisawat, K. Open-source multi-speaker speech corpora for building Gujarati, Kannada, Malayalam, Marathi, Tamil and Telugu speech synthesis systems. In Proceedings of the Language Resources and Evaluation Conference, 2020.
- Hendrycks et al. (2021) Hendrycks, D., Basart, S., Mu, N., Kadavath, S., Wang, F., Dorundo, E., Desai, R., Zhu, T., Parajuli, S., Guo, M., Song, D., Steinhardt, J., and Gilmer, J. The Many Faces of Robustness: A Critical Analysis of Out-of-Distribution Generalization. In Proceedings of the IEEE/CVF International Conference on Computer Vision, 2021.
- Kjartansson et al. (2020) Kjartansson, O., Gutkin, A., Butryna, A., Demirsahin, I., and Rivera, C. Open-source high quality speech datasets for Basque, Catalan and Galician. In Proceedings of the Joint Workshop on Spoken Language Technologies for Under-resourced languages and Collaboration and Computing for Under-Resourced Languages, 2020.
- Koenecke et al. (2020) Koenecke, A., Nam, A., Lake, E., Nudell, J., Quartey, M., Mengesha, Z., Toups, C., Rickford, J. R., Jurafsky, D., and Goel, S. Racial disparities in automated speech recognition. Proceedings of the National Academy of Sciences, 117(14):7684–7689, 2020.
- Koh et al. (2021) Koh, P. W., Sagawa, S., Marklund, H., Xie, S. M., Zhang, M., Balsubramani, A., Hu, W., Yasunaga, M., Phillips, R. L., Gao, I., Lee, T., David, E., Stavness, I., Guo, W., Earnshaw, B., Haque, I., Beery, S. M., Leskovec, J., Kundaje, A., Pierson, E., Levine, S., Finn, C., and Liang, P. WILDS: A Benchmark of in-the-Wild Distribution Shifts. In Proceedings of the International Conference on Machine Learning, 2021.
- Long et al. (2015) Long, M., Cao, Y., Wang, J., and Jordan, M. Learning Transferable Features with Deep Adaptation Networks. In Proceedings of the International Conference on Machine Learning, 2015.
- MacLean (2018) MacLean, K. Voxforge, 2018.
- Malinin & Gales (2018) Malinin, A. and Gales, M. Predictive uncertainty estimation via prior networks. In Proceedings of Advances in Neural Information Processing Systems, 2018.
- Markl (2022) Markl, N. Language variation and algorithmic bias: understanding algorithmic bias in British English automatic speech recognition. In Proceedings of the ACM Conference on Fairness, Accountability, and Transparency, 2022.
- Martin & Wright (2022) Martin, J. L. and Wright, K. E. Bias in Automatic Speech Recognition: The Case of African American Language. Applied Linguistics, 44(4):613–630, 2022.
- Meinshausen & Bühlmann (2015) Meinshausen, N. and Bühlmann, P. Maximin effects in inhomogeneous large-scale data. The Annals of Statistics, 43(4):1801–1830, 2015.
- Namkoong & Duchi (2016) Namkoong, H. and Duchi, J. C. Stochastic gradient methods for distributionally robust optimization with f-divergences. In Proceedings of Advances in Neural Information Processing Systems, 2016.
- Ngueajio & Washington (2022) Ngueajio, M. K. and Washington, G. Hey ASR System! Why Aren’t You More Inclusive? In HCI International 2022 – Late Breaking Papers: Interacting with eXtended Reality and Artificial Intelligence, 2022.
- Oren et al. (2019) Oren, Y., Sagawa, S., Hashimoto, T. B., and Liang, P. Distributionally robust language modeling. In Proceedings of the Conference on Empirical Methods in Natural Language Processing and the International Joint Conference on Natural Language Processing, 2019.
- Peters et al. (2016) Peters, J., Bühlmann, P., and Meinshausen, N. Causal Inference by using Invariant Prediction: Identification and Confidence Intervals. Journal of the Royal Statistical Society Series B: Statistical Methodology, 78(5):947–1012, 2016.
- Pratap et al. (2020) Pratap, V., Xu, Q., Sriram, A., Synnaeve, G., and Collobert, R. MLS: A Large-Scale Multilingual Dataset for Speech Research. In Proceeding of Interspeech, 2020.
- Pratap et al. (2024) Pratap, V., Tjandra, A., Shi, B., Tomasello, P., Babu, A., Kundu, S., Elkahky, A., Ni, Z., Vyas, A., Fazel-Zarandi, M., Baevski, A., Adi, Y., Zhang, X., Hsu, W.-N., Conneau, A., and Auli, M. Scaling Speech Technology to 1,000+ Languages. Journal of Machine Learning Research, 25(97):1–52, 2024.
- Quinonero-Candela et al. (2008) Quinonero-Candela, J., Sugiyama, M., Schwaighofer, A., and Lawrence, N. D. Dataset Shift in Machine Learning. MIT Press, 2008.
- Radford et al. (2023) Radford, A., Kim, J. W., Xu, T., Brockman, G., Mcleavey, C., and Sutskever, I. Robust Speech Recognition via Large-Scale Weak Supervision. In Proceedings of the International Conference on Machine Learning, 2023.
- Rothenhäusler et al. (2021) Rothenhäusler, D., Meinshausen, N., Bühlmann, P., and Peters, J. Anchor regression: Heterogeneous data meet causality. Journal of the Royal Statistical Society Series B: Statistical Methodology, 83(2):215–246, 2021.
- Rouditchenko et al. (2023) Rouditchenko, A., Khurana, S., Thomas, S., Feris, R., Karlinsky, L., Kuehne, H., Harwath, D., Kingsbury, B., and Glass, J. Comparison of Multilingual Self-Supervised and Weakly-Supervised Speech Pre-Training for Adaptation to Unseen Languages. In Proceedings of Interspeech, 2023.
- Sagawa et al. (2020) Sagawa, S., Koh, P. W., Hashimoto, T. B., and Liang, P. Distributionally Robust Neural Networks for Group Shifts: On the Importance of Regularization for Worst-Case Generalization. In Proceedings of the International Conference on Learning Representations, 2020.
- Santurkar et al. (2021) Santurkar, S., Tsipras, D., and Madry, A. Breeds: Benchmarks for subpopulation shift. In Proceedings of the International Conference on Learning Representations, 2021.
- Sarı et al. (2021) Sarı, L., Hasegawa-Johnson, M., and Yoo, C. D. Counterfactually fair automatic speech recognition. In IEEE/ACM Transactions on Audio, Speech, and Language Processing, 2021.
- Shi et al. (2024) Shi, J., Wang, S.-H., Chen, W., Bartelds, M., Kumar, V. B., Tian, J., Chang, X., Jurafsky, D., Livescu, K., yi Lee, H., and Watanabe, S. ML-SUPERB 2.0: Benchmarking Multilingual Speech Models Across Modeling Constraints, Languages, and Datasets. arXiv preprint arXiv:2406.08641, 2024.
- Slivkins (2019) Slivkins, A. Introduction to multi-armed bandits. Foundations and Trends in Machine Learning, 12(1-2):1–286, 2019.
- Słowik & Bottou (2022) Słowik, A. and Bottou, L. On distributionally robust optimization and data rebalancing. In Proceedings of the International Conference on Artificial Intelligence and Statistics, 2022.
- Sodimana et al. (2018) Sodimana, K., De Silva, P., Sarin, S., Kjartansson, O., Jansche, M., Pipatsrisawat, K., and Ha, L. A Step-by-Step Process for Building TTS Voices Using Open Source Data and Frameworks for Bangla, Javanese, Khmer, Nepali, Sinhala, and Sundanese. In Proceedings of the Workshop on Spoken Language Technologies for Under-Resourced Languages, 2018.
- Solak (2019) Solak, I. M-AILABS Speech Dataset, 2019.
- Sun & Saenko (2016) Sun, B. and Saenko, K. Deep CORAL: Correlation Alignment for Deep Domain Adaptation. In Computer Vision – ECCV 2016 Workshops, 2016.
- Tatman (2017) Tatman, R. Gender and dialect bias in YouTube’s automatic captions. In Proceedings of the ACL Workshop on Ethics in Natural Language Processing, 2017.
- Tzeng et al. (2014) Tzeng, E., Hoffman, J., Zhang, N., Saenko, K., and Darrell, T. Deep domain confusion: Maximizing for domain invariance. arXiv preprint arXiv:1412.3474, 2014.
- Veliche & Fung (2023) Veliche, I.-E. and Fung, P. Improving fairness and robustness in end-to-end speech recognition through unsupervised clustering. In IEEE International Conference on Acoustics, Speech and Signal Processing, 2023.
- Wang et al. (2021) Wang, C., Riviere, M., Lee, A., Wu, A., Talnikar, C., Haziza, D., Williamson, M., Pino, J., and Dupoux, E. VoxPopuli: A large-scale multilingual speech corpus for representation learning, semi-supervised learning and interpretation. In Proceedings of the Annual Meeting of the Association for Computational Linguistics and the International Joint Conference on Natural Language Processing, 2021.
- Zhang et al. (2022) Zhang, Y., Zhang, Y., Halpern, B. M., Patel, T., and Scharenborg, O. Mitigating bias against non-native accents. In Proceedings of Interspeech, 2022.
Appendix A Datasets
Table 5 shows the first two language sets, listing all available corpora for each language in ML SUPERB 2.0. In Table 6, we show the number of samples, along with the average duration and transcript length for each language in each language set in the balanced data setting.
| Set # | Language | ISO code | Corpus |
|---|---|---|---|
| 1 | Czech | ces | CV, Fleurs, VP |
| Mandarin | cmn | CV, Fleurs | |
| Min Nan | nan | CV | |
| Polish | pol | CV, Fleurs, MSD, MLL, VP | |
| Romanian | ron | CV, Fleurs, VP | |
| Spanish | spa | CV, Fleurs, MSD, MLS, VF, VP | |
| 2 | Cantonese | yue | CV, Fleurs |
| Croatian | hrv | Fleurs, VP | |
| Italian | ita | CV, Fleurs, LAD, MSD, MLS, NCHLT, SWC, VF, VP | |
| English | eng | CV, Fleurs, MSD, MLS, VF, VP | |
| Persian | fas | CV, Fleurs | |
| Slovak | slk | CV, Fleurs, VP |
| Set # | ISO | Number of | Duration | Transcript |
|---|---|---|---|---|
| Data Points | Length | |||
| 1 | ces | 908 | ||
| cmn | 322 | |||
| nan | 1406 | |||
| pol | 482 | |||
| ron | 274 | |||
| spa | 445 | |||
| 2 | eng | 647 | ||
| fas | 693 | |||
| hrv | 291 | |||
| ita | 326 | |||
| slk | 330 | |||
| yue | 243 | 2 | ||
| 3 | khm | 206 | ||
| kmr | 723 | |||
| kor | 269 | |||
| nbl | 744 | |||
| nno | 709 | |||
| tat | 835 | |||
| 4 | mrj | 707 | ||
| slv | 918 | |||
| snd | 263 | |||
| sot | 655 | |||
| spa | 550 | |||
| urd | 299 | |||
| 5 | deu | 745 | ||
| eng | 712 | |||
| heb | 345 | |||
| jpn | 290 | |||
| rus | 318 | |||
| spa | 311 |
Appendix B Results
For each language set, we present the language-specific results of our experiments using balanced training data in Table 7. Table 8 shows the language-specific results for the first two sets based on experiments using all available training data in ML-SUPERB 2.0.
| Set # | Model | Type | ces | cmn | nan | pol | ron | spa | Avg CER | LID |
|---|---|---|---|---|---|---|---|---|---|---|
| () | () | () | () | () | () | () | () | |||
| 1 | MMS | Baseline | 8.4 | 56.7 | 59.7 | 3.7 | 14.3 | 1.8 | 24.1 | 96.6 |
| group DRO | 24.5 | 48.1 | 86.0 | 5.4 | 18.1 | 9.1 | 31.9 | 62.8 | ||
| CTC-DRO | 10.4 | 45.1 | 56.2 | 3.6 | 14.1 | 1.9 | 21.9 | 97.6 | ||
| XLS-R | Baseline | 26.6 | 187.9 | 84.1 | 11.2 | 30.2 | 11.2 | 58.5 | 77.8 | |
| group DRO | 27.4 | 86.6 | 82.7 | 11.6 | 25.5 | 7.8 | 40.3 | 86.8 | ||
| CTC-DRO | 18.4 | 59.7 | 64.0 | 7.9 | 26.6 | 7.2 | 30.6 | 87.8 | ||
| Model | Type | eng | fas | hrv | ita | slk | yue | Avg CER | LID | |
| () | () | () | () | () | () | () | () | |||
| 2 | MMS | Baseline | 0.2 | 22.0 | 10.6 | 4.6 | 10.6 | 45.2 | 15.5 | 98.4 |
| group DRO | 10.8 | 29.9 | 12.4 | 8.9 | 12.4 | 56.9 | 21.9 | 97.3 | ||
| CTC-DRO | 0.8 | 22.7 | 9.0 | 6.7 | 5.8 | 43.5 | 14.8 | 98.2 | ||
| XLS-R | Baseline | 0.4 | 19.0 | 6.8 | 4.7 | 8.9 | 64.8 | 17.4 | 96.6 | |
| group DRO | 11.9 | 31.4 | 12.3 | 5.7 | 11.7 | 60.0 | 22.2 | 88.6 | ||
| CTC-DRO | 0.8 | 21.8 | 11.9 | 5.8 | 8.3 | 43.7 | 15.4 | 96.4 | ||
| Model | Type | khm | kmr | kor | nbl | nno | tat | Avg CER | LID | |
| () | () | () | () | () | () | () | () | |||
| 3 | MMS | Baseline | 32.1 | 11.6 | 36.6 | 8.1 | 2.4 | 9.9 | 16.8 | 99.2 |
| group DRO | 30.7 | 18.9 | 33.4 | 18.5 | 10.0 | 13.5 | 20.9 | 98.8 | ||
| CTC-DRO | 32.8 | 11.8 | 29.6 | 8.5 | 2.9 | 10.2 | 16.0 | 99.2 | ||
| XLS-R | Baseline | 34.0 | 11.4 | 32.6 | 8.0 | 2.2 | 10.4 | 16.4 | 97.9 | |
| group DRO | 36.9 | 21.4 | 35.3 | 24.2 | 10.5 | 16.6 | 24.1 | 96.5 | ||
| CTC-DRO | 31.4 | 11.9 | 32.4 | 8.4 | 3.0 | 12.6 | 16.6 | 96.5 | ||
| Model | Type | mrj | slv | snd | sot | spa | urd | Avg CER | LID | |
| () | () | () | () | () | () | () | () | |||
| 4 | MMS | Baseline | 10.3 | 12.7 | 20.4 | 14.9 | 4.5 | 28.4 | 15.2 | 89.9 |
| group DRO | 9.4 | 13.7 | 19.9 | 16.1 | 4.3 | 30.5 | 15.6 | 92.1 | ||
| CTC-DRO | 9.6 | 12.8 | 19.5 | 14.6 | 4.7 | 26.3 | 14.6 | 94.7 | ||
| XLS-R | Baseline | 14.0 | 4.8 | 23.3 | 11.6 | 4.2 | 29.7 | 14.6 | 88.4 | |
| group DRO | 15.7 | 26.3 | 19.4 | 23.5 | 3.9 | 23.9 | 18.8 | 83.5 | ||
| CTC-DRO | 12.0 | 6.7 | 21.0 | 13.8 | 4.8 | 24.2 | 13.7 | 88.9 | ||
| Model | Type | deu | eng | heb | jpn | rus | spa | Avg CER | LID | |
| () | () | () | () | () | () | () | () | |||
| 5 | MMS | Baseline | 6.9 | 11.8 | 33.7 | 98.2 | 12.7 | 7.9 | 28.6 | 98.4 |
| group DRO | 28.7 | 27.1 | 35.1 | 61.1 | 17.7 | 9.5 | 29.9 | 67.0 | ||
| CTC-DRO | 10.0 | 14.1 | 31.9 | 53.0 | 13.9 | 8.7 | 21.9 | 98.9 | ||
| XLS-R | Baseline | 5.2 | 11.4 | 38.0 | 120.9 | 11.8 | 7.9 | 32.5 | 89.0 | |
| group DRO | 29.2 | 27.4 | 44.7 | 98.1 | 17.7 | 11.2 | 38.1 | 57.7 | ||
| CTC-DRO | 6.1 | 11.2 | 41.5 | 77.1 | 11.1 | 8.9 | 26.0 | 91.0 |
| Set # | Model | Type | ces | cmn | nan | pol | ron | spa | Avg CER | LID |
|---|---|---|---|---|---|---|---|---|---|---|
| () | () | () | () | () | () | () | () | |||
| 1 | MMS | Baseline | 9.1 | 58.9 | 67.5 | 6.0 | 7.1 | 5.0 | 25.6 | 98.1 |
| group DRO | 14.2 | 92.9 | 97.2 | 7.6 | 13.9 | 5.8 | 38.6 | 83.9 | ||
| CTC-DRO | 8.7 | 45.9 | 62.8 | 6.2 | 7.5 | 5.3 | 22.8 | 98.5 | ||
| XLS-R | Baseline | 13.0 | 92.1 | 78.3 | 9.8 | 12.0 | 8.5 | 35.6 | 96.4 | |
| group DRO | 19.3 | 84.7 | 88.4 | 6.4 | 23.4 | 5.0 | 37.9 | 72.3 | ||
| CTC-DRO | 12.9 | 52.5 | 67.5 | 9.0 | 11.9 | 7.8 | 26.9 | 97.1 | ||
| Model | Type | eng | fas | hrv | ita | slk | yue | Avg CER | LID | |
| () | () | () | () | () | () | () | () | |||
| 2 | MMS | Baseline | 9.6 | 16.9 | 8.5 | 6.8 | 8.0 | 66.9 | 19.5 | 99.0 |
| group DRO | 10.0 | 72.6 | 25.5 | 8.8 | 18.4 | 105.8 | 40.2 | 81.0 | ||
| CTC-DRO | 9.7 | 18.1 | 8.3 | 6.6 | 7.3 | 48.1 | 16.4 | 99.1 | ||
| XLS-R | Baseline | 11.9 | 32.3 | 9.6 | 8.1 | 9.2 | 97.2 | 28.0 | 98.2 | |
| group DRO | 8.8 | 87.6 | 32.2 | 7.8 | 29.0 | 100.6 | 44.3 | 80.8 | ||
| CTC-DRO | 11.6 | 23.2 | 9.3 | 8.2 | 8.9 | 51.4 | 18.8 | 98.6 |
Appendix C Ablation Study
We present the language-specific results of our ablation study in Table 9.
| Model | Type | deu | eng | heb | jpn | rus | spa | Avg CER | LID |
|---|---|---|---|---|---|---|---|---|---|
| () | () | () | () | () | () | () | () | ||
| MMS | Baseline | 6.9 | 11.8 | 33.7 | 98.2 | 12.7 | 7.9 | 28.6 | 98.4 |
| CTC-DRO | 10.0 | 14.1 | 31.9 | 53.0 | 13.9 | 8.7 | 21.9 | 98.9 | |
| - Dur | 19.4 | 21.2 | 30.9 | 84.6 | 12.9 | 8.3 | 29.5 | 66.1 | |
| - Smooth | 95.6 | 96.0 | 98.8 | 102.1 | 97.4 | 97.3 | 97.9 | 13.2 | |
| XLS-R | Baseline | 5.2 | 11.4 | 38.0 | 120.9 | 11.8 | 7.9 | 32.5 | 89.0 |
| CTC-DRO | 6.1 | 11.2 | 41.5 | 77.1 | 11.1 | 8.9 | 26.0 | 91.0 | |
| - Dur | 35.6 | 36.5 | 72.9 | 115.2 | 27.4 | 15.9 | 50.6 | 51.5 | |
| - Smooth | 18.5 | 24.5 | 69.9 | 194.2 | 41.2 | 19.9 | 61.4 | 43.2 |