Large molecular and dust reservoir of a gravitationally-lensed submillimeter galaxy behind the Lupus-I molecular cloud
Abstract
We report the Australian Telescope Compact Array and Nobeyama 45 m telescope detection of a remarkably bright ( mJy) submillimeter galaxy MM J154506.4344318 in emission lines at 48.5 and 97.0 GHz, respectively. We also identify part of an emission line at GHz using the Atacama Large Millimeter/submillimeter Array (ALMA). Together with photometric redshift estimates and the ratio between the line and infrared luminosities, we conclude that the emission lines are most likely to be the –1, 4–3, and 9–8 transitions of 12CO at redshift . ALMA 1.3 mm continuum imaging reveals an arc and a spot separated by an angular distance of , indicative of a strongly-lensed dusty star-forming galaxy with respective molecular and dust masses of and after corrected for gravitational magnification. The inferred dust-to-gas mass ratio is found to be high () among coeval dusty star-forming galaxies, implying the presence of a massive, chemically-enriched reservoir of cool interstellar medium at or 1.6 Gyr after the Big Bang.
1 Introduction
Pioneering (sub)millimeter extragalactic surveys by bolometer cameras on single dish telescopes routinely discovered submillimeter galaxies (SMGs, Blain et al., 2002; Casey et al., 2014), dusty star-forming galaxies with , providing a laboratory to understand extreme star formation, which cannot be seen in the local Universe. Armed with next generation (sub)millimeter cameras, square-degree scale surveys using far-infrared (FIR) to mm single-dish telescopes (e.g., Herschel: Eales et al. 2010, ASTE: Scott et al. 2012, APEX: Weiß et al. 2009, JCMT: Geach et al. 2017; Garratt et al. 2023, SPT: Vieira et al. 2010) yielded a number of extremely-bright ( mJy) SMGs, via early discovery and investigation of this extremely-bright population of SMGs (e.g., Swinbank et al., 2010; Ikarashi et al., 2011; Omont et al., 2011).
Thanks to their apparent high luminosity by the aid of gravitational magnification, the brightest SMGs offer a unique opportunity to investigate their nature at the most intense peak (typical star formation rates of yr-1) of star formation (e.g., Vieira et al., 2013; Spilker et al., 2014, 2015; Zhang et al., 2018; Litke et al., 2019; Rybak et al., 2020; Gururajan et al., 2022). However, the brightest SMGs are even brighter and rarer than existing (sub)millimeter-bright sources, such as Herschel-ATLAS/SDP (Negrello et al., 2010). It is indeed hard to spectroscopically-identify such brightest SMGs due to their optical faintness; only a couple of brightest SMGs are expected within 10 deg2 (e.g., Takekoshi et al., 2013).
MM J154506.4344318 (hereafter, MM J1545) was initially identified through the 4-deg2 Lupus-I molecular cloud survey carried out using the AzTEC 1.1 mm camera (Wilson et al., 2008) attached to the ASTE 10 m telescope (Ezawa et al., 2004, 2008), as a mJy point-like object at the edge of the Lupus-I molecular cloud. Indeed, the close proximity of this object to the molecular cloud misled us to classify it as an extremely-dense starless core shortly (– yr) before protostar formation, which is only proposed theoretically (Larson, 1969; Tomida et al., 2010).
Subsequent follow-up observations that we made using the Submillimeter Array (SMA), Very Large Array (VLA), ASTE, Nobeyama 45 m, Nobeyama Millimeter Array, Subaru/MOIRCS, UKIRT/WFCAM, along with archival Spitzer (MIPS and IRAC) and Herschel (SPIRE) data, however, suggest a gravitationally-lensed distant SMG at –5 (Tamura et al., 2015). In particular, 6 cm and near-infrared (NIR) emission cannot be explained by any latest models of a starless core (e.g., Tomida et al., 2010, 2013). But a lensed SMG located far beyond the Lupus-I cloud by chance (Tamura et al., 2015) accounts for the multi-wavelength properties and brightness at (sub)millimeter wavelengths if a low- foreground galaxy seen in the NIR -band (J1545B) gravitationally magnifies it.
If this is the case, MM J1545 is the brightest of SMGs found in the AzTEC/ASTE 1.1-mm deep extragalactic survey (e.g., Kohno et al., 2008; Scott et al., 2012) and places an interesting constraint on the physical properties of SMGs at the brightest-end of 1.1-mm extragalactic source counts. The shallow slope of the counts at mJy is also in favor of the presence of gravitational magnification (Takekoshi et al., 2013; Tamura et al., 2015).111If a certain, small fraction of galaxies at the brightest end of the number counts are gravitationally magnified, the brightest end extends toward higher flux densities, making the slope of the counts shallower at the highest flux densities.
In this paper, we report the detection of MM J1545 in several emission lines, which are most likely to be rotational transition lines of carbon monoxide (CO), using the Australian Telescope Compact Array (ATCA), the Nobeyama 45 m telescope, and the Atacama Large Millimeter/submillimeter Array (ALMA). We also present results of resolution 1.3-mm continuum imaging with ALMA, suggesting the existence of gravitational magnification.
The rest of the paper is organized as follows. In section 2 we describe observations carried out using the ATCA and Nobeyama 45 m telescopes. Section 3 describes the results. In section 4 we discuss the results and summarize the paper.
Throughout this paper we use a concordance cosmology with the matter and dark energy densities , , and a Hubble parameter km s-1 Mpc-1.
2 Observations
2.1 ATCA Observations and Data Reduction
The ATCA observations covering 37–50 GHz were made on 2013 October 10–12 and 2014 April 4–6 (program ID: C2910). The array configurations employed in 2013 and 2014 were H214 and H168, respectively, while we do not use the longest baselines including the CA06 antenna because of their poor atmospheric phase stability. The resulting baseline length ranges 82–247 m and 61–192 m for the H214 and H168 configurations, respectively. The receivers were tuned to mostly cover the Q band of ATCA, which required 5 tuning setups covering 33.4–37.1, 36.9–40.6, 40.4–44.0, 43.6–47.2, and 46.8–50.4 GHz. The lowest frequency setup, however, was flagged becase of poor weather conditions. The Compact Array Broadband Backend (CABB) correlator was configured with the 1 MHz resolution mode for all of the receiver setups. The instrumental delay was checked and fixed using the bright radio source 3C 279 before starting the observing tracks. 3C 279 was also used for bandpass calibration. We observed J1451375 ( Jy, 10.7 deg away from the target) every 10 min for complex gain calibration. Mars was observed once a night for absolute flux calibration. The absolute flux accuracy is estimated to be .
Calibration and imaging were processed using the Miriad software (Sault et al., 1995). The data with poor phase stability were flagged before imaging. The resulting integration time per tuning was –90 min on average. The calibrated data were imaged using a natural weighting, and then the dirty image was beam-deconvolved down to a level using Miriad tasks invert and clean, respectively. This yields a synthesized beam size of (PA = ) at 48.6 GHz. The resulting r.m.s. noise levels for a spectral cube with a 200 km s-1 resolution and a continuum image integrated over 13 GHz are 0.7–1.1 mJy beam-1 (depending on observed frequencies) and 0.036 mJy beam-1, respectively.
2.2 Nobeyama 45 m Observations and Data Reduction
In order to observe an upper state transition of the emission line detected with ATCA, we carried out the 45 m observations during two periods, 2015 February 25 to March 4 (ID: CG141007) and 2016 February 26 to March 8 (program ID: CG151009). Because of the low declination of the source (), the elevation angle at Nobeyama ranges –20 deg. We used the two-beam dual-polarization TZ receiver (Nakajima et al., 2013) together with the SAM45 digital spectrometer equipped with four spectral windows, each of which has a 2048 MHz bandwidth and 4096 spectral channels (Iono et al., 2012).The receiver and spectrometer were tuned such that the lower sideband (LSB) were centered at two slightly different frequencies, 96.8 and 97.0 GHz, in order to distinguish a broad spectral line in radio frequency (RF) from potential baseline wiggles of the intermediate frequency (IF) bandpass. The beam size (half-power beam width) is . The native velocity resolution of the spectrometer is 1.5 km s-1 per channel, whereas adjacent 64 channels were binned to achieve 100 km s-1 resolution. In total, four spectral windows were configured to cover four IFs of two beams and two polarizations.
During observations, we position-switched the two beams of TZ with a period of 20 s (visiting on and off positions for 5 s each, plus antenna slew time), so that one of the beams is always on source. Intensity calibration was made 2–3 times per hour by using the standard single-temperature chopper-wheel method. Note that the atmosphere is reasonably approximated by a plane parallel slab even for such low elevation angles. The pointing was checked every 1 hr and pointing accuracy during the runs was typically r.m.s. under moderate wind speeds m s-1. The focusing correction was made at the secondary mirror based on a model describing homologous deformation of the primary mirror, while no additional focusing correction was made, which potentially limited the accuracy of our aperture efficiency estimate. The standard calibration source M17SW was observed several times at similar elevation angles for aperture efficiency () measurements. By comparing the observed peak temperature of CS (2–1) ( K) with a past measurement of its main beam temperature ( K), the main beam efficiency was estimated to be . If assuming a typical conversion of ,222Assuming a Gaussian approximation for the beam solid angle and an aperture illumination with dB edge taper (Baars, 2007). , which corresponds to a gain of Jy K-1. According to the 45 m status report in the 2015–2016 season,333https://www.nro.nao.ac.jp/~nro45mrt/html/prop/eff/eff2015.html this is 80% of the TZ aperture efficiency measured at 98 GHz at an elevation angle of , which is consistent with but slightly lower than the past estimates, which is likely due to low elevation angles of our observations.
Prior to the data reduction, we selected the data with good pointing accuracy under good wind speeds ( m s-1) and fair system noise temperatures ( K), leaving the data taken on 2016 February 26–28 and March 1, 3, and 4. Flagging, spectral-baselining, and coadding of the calibrated spectra were done using the ATNF Spectral Analysis Package (asap) shipped with casa (version 5.0.0, CASA Team et al., 2022). We loaded the observed data (in the format of NewStar Ikeda et al. 2001) into casa as the asap Scantable format. We then flagged the data with the r.m.s. noise levels being higher than those expected from the nominal system noise temperature, where spectral baseline fluctuations likely dominate the noise levels of the instantaneous spectra. The resulting on-source time is 5.46 hr. The offset and slope of each 5 s spectrum is subtracted by fitting a linear function to the spectral baseline. The central km s-1 where the line is expected and the km s-1 band edges were masked when the linear fitting is performed. The baseline-subtracted spectra are coadded with weighting of to obtain the final spectrum. The resulting r.m.s. noise level with a 100 km s-1 resolution is 1.8 mJy.
| Line | CO (2–1) | CO (4–3) |
|---|---|---|
| Frequency (GHz)† | ||
| † | ||
| FWHM (km s-1)† | ||
| (Jy km s-1)‡ | ||
| ( K km s-1 pc2)♭ | ||
| ()♭♯ |
† Value and error are derived from a single-component Gaussian fit.
‡ Value and error are derived from a spectral integration over a range of from the observed-frame frequency of CO, i.e., , where and are obtained from the average redshift () and the average FWHM (590 km s-1) between the two observations.
♭ Values are not corrected for lensing magnification.
♯ A CO (1–0) to conversion factor (Dunne et al., 2022) is assumed.
and are the CO(2–1)-to-CO(1–0) and CO(4–3)-to-CO(1–0) brightness temperature ratios, respectively. and (Harrington et al., 2021) are assumed throughout the paper.
2.3 ALMA Imaging
We used high-angular resolution ALMA imaging data in order to search for another spectral line and to confirm the presence of strong lensing. As part of the Soul of Lupus with ALMA (SOLA, Saito et al., 2015) project, the 1 mm continuum data were taken on 2016 April 1 (ID: 2015.1.00512.S; PI. Itziar de Gregorio-Monsalvo) using the Band 6 receivers in the C36–2 to –3 configurations (Santamaría-Miranda et al., 2021). The receivers were tuned at GHz (1.3 mm). The correlators with the frequency-division mode were configured so that one of the basebands covered GHz for a local CO (2–1) line whereas the rest were assigned to cover GHz. The sky condition was reasonable with a precipitable water vapor (PWV) of 1.6 mm. The complex gain was calibrated using a nearby radio-loud quasar J15343526. The bandpass calibration was performed on J15172422, which was also used as a secondary flux calibrator ( Jy on 2016 March 27). The resulting on-source time was 211 s.
The data were calibrated in a standard manner using casa (version 4.5.3). The calibrated data were then imaged using the casa task clean with natural weighting to make a spectral cube, resulting in a synthesized beam of (PA = ) and r.m.s. noise level of 0.94 mJy beam-1 at a spectral resolution of 15.625 MHz. For continuum imaging, we employ the super-uniform weighting to achieve a high spatial resolution, which yields a synthesized beam of (PA = ) and the point source sensitivity of 0.14 mJy beam-1. The absolute flux accuracy is estimated to be 10%.
We also retrieved public pipeline-processed band 3 and 7 images (ID: 2019.1.00245.S and 2018.1.00126.S) from the ALMA data archive for a subsequent spectral energy distribution (SED) analysis (§ 4.2). The beam sizes of the band 3 and 7 data are and , respectively. The noise levels are and mJy beam-1, respectively. The absolute flux accuracy is estimated to be 10%.
3 Results
3.1 CO Detections and Redshift Identification
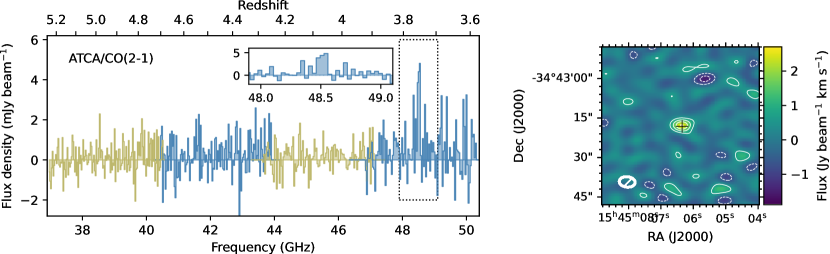
Across the ATCA 37–50 GHz spectrum and the integrated intensity map in Figure 1, we detect a emission line at 48.5 GHz at a position of , which is in agreement with the previous SMA position, () (Tamura et al., 2015). The offset between the ATCA and SMA positions is consistent with a statistical error (), strongly suggesting that the emission feature is the counterpart to MM J1545. The velocity width and continuum-subtracted flux of MM J1545 are respectively km s-1 and Jy km s-1 as listed in Table 1, which are typical among 12CO emission lines found in lensed SMGs. As reported by Tamura et al. (2015), we also detect the continuum emission at mJy. The 40.4 and 46.9 GHz flux densities are and mJy, respectively, yielding the 7 mm spectral index of , where is defined as . As we will see in Section 4.2, we find that the obtained slope is shallower than what is expected for a single component dust emission and that the flux density exceeds the prediction from the best-fitting modified blackbody, which suggests additional contribution from a even lower component and/or free-free emission.
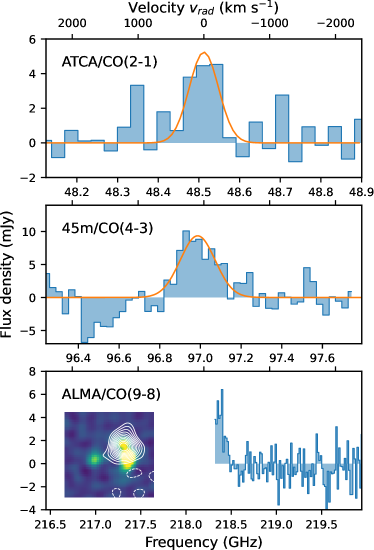
Figure 2 shows the resulting ATCA, 45 m, and ALMA spectra. The 45 m spectrum shows a broad emission line at 97.0 GHz and at a velocity resolution of 100 km s-1, with a velocity-integrated flux of Jy km s-1. The velocity width is km s-1, which is in good agreement with that of the ATCA (Table 1). The frequency is almost exactly twice that of the ATCA emission line, which supports that they are emission lines of two rotational transitions of CO, where the upper state quantum numbers are related as .
Furthermore, we found a enhancement at the edge (218.3 GHz) of one of the ALMA spectral windows. The enhancement is so bright that the most likely interpretation is the blue part of another CO transition. A slight spatial-offset between the integrated intensity and 1.3 mm continuum images (see the inset of the ALMA spectrum in Figure 2) is probably because the blue part of the line is associated with the northern component of the western arc, which we will see in section 3.2. If this is the case, the only solution that explains ATCA, 45 m, and ALMA detections is the CO (2–1), (4–3), and (9–8) transitions at the redshift of .
This is consistent with previous photometric redshift estimates derived from mid-IR-to-radio photometry and SED templates of dusty star-forming galaxies (Arp 220, SMM J21350201, and average SMG, Silva et al., 1998; Michałowski et al., 2010; Swinbank et al., 2010); , and , respectively (Tamura et al., 2015, all error bars represent the 68% confidence intervals). We find only a single line over the 13 GHz bandwidth of ATCA, which also places a redshift upper limit of if the line is 12CO. If the transitions are (–0 and 2–1) or (–2 and 6–5), the redshift would be or 6.128, respectively, which are unlikely because they are well outside the photometric redshift estimates from the SED fits and cannot explain the ALMA spectrum.
In order to further assess the attribution of the lines, we use the -to- correlation (e.g., Iono et al., 2009) to predict a CO intensity at 48.5 GHz from the FIR luminosity of MM J1545 by following the prescription presented by Tamura et al. (2014). If we assume the redshift of , the inferred FIR luminosity is estimated to be –14 as presented in section 4.2. This yields a CO (3–2) luminosity of K km s-1 pc2, which is almost similar to the CO (2–1) luminosity if assuming a typical luminosity ratio of found in dusty star-forming galaxies (e.g., Harrington et al., 2021). The predicted flux is then –2 Jy km s-1, which is consistent with that observed at 48.5 GHz with the ATCA. This also rules out other possible lines such as 13CO, HCN, HCO+ since the non-12CO lines should be an order of magnitude fainter. Thus, we conclude that the emission lines at 48.5, 97.0, and 218.2 GHz are attributed to three 12CO rotational transitions of –1, 4–3, and 9–8, respectively.
3.2 ALMA Imaging and Gravitational Lens Model
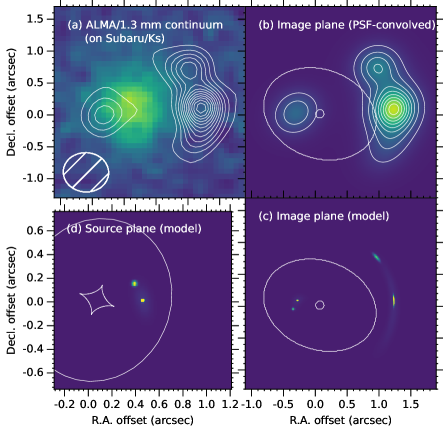
As shown in Figure 3a, the resulting ALMA continuum image reveals an arc to the west with an unresolved spot to the east, strongly suggesting the presence of strong lensing. The image shows at least two brightness peaks embedded in the western arc, suggesting two star-forming clumps embedded in this galaxy. We use the gravitational lens code, Glafic (Oguri, 2010), to simply model the galaxy–galaxy lensing system. As a mass model, we assume a cored singular-isothermal ellipsoid situated at . The photo- of the lensing galaxy J1545B (Tamura et al. 2015; see the background -band image in Figure 3a) is not constrained very well, while the separation of is reproduced for if the velocity dispersion of J1545B follows the NIR version of the Faber-Jackson relation (La Barbera et al., 2010), as discussed in Tamura et al. (2015). We first use only the positions of the two peaks to roughly constrain the mass model. We then perform a fit to the observed brightness distribution to put more stringent constraints on the mass model and intrinsic source brightness on the source plane. Three 2-dimensional Gaussians are used for realization of the source plane brightness; two compact axisymmetric Gaussians and an extended Gaussian to represent two brightness peaks and an extended diffuse component, respectively. Before applying the fits we smooth the modeled image plane with the clean beam of (PA = ). We do not consider a model fit in the visibility domain for simplicity. We do not take an external shear into account because the degree of freedom is small. A noise level of mJy beam-1 is used for calculation.
The results are shown in Figure 3b, 3c, and 3d for the image and source planes. The centroid of J1545B on the -band image (Figure 3a) is in good agreement with the predicted position of the mass model. The velocity dispersion of the lens (200 km s-1) is consistent with that estimated from the -band version of the Faber–Jackson relation (La Barbera et al., 2010). The image plane reproduces the western arc with two clumps and the eastern spot although the extended emission at low brightness levels is not reproduced very well. On the source plane we find an interesting spatial structure that shows two bright spots embedded in an extended disk while high-resolution imaging is necessary to confirm the detailed internal structure of MM J1545. The inferred magnification factor is although this may have a large uncertainty depending on the extent of source plane brightness.
4 Discussions
4.1 Validity of the Magnification Factor
The ALMA image clearly reveals multiple images split by the strong gravitational lensing effect while the angular resolution is still insufficient for full characterization of the lensing system, which limits the accuracy of the magnification factor. Instead, an excess of an observed CO luminosity from the correlation between (unlensed) CO (1–0) luminosity and velocity dispersion places an independent constraint on a magnification factor (Harris et al., 2012). This empirical luminosity–line width relation is similar to the Tully–Fisher relation (Tully & Fisher, 1977) relating the luminosity and rotation velocity of spiral galaxies and has been characterized for CO emission of the SMG population (Bothwell et al., 2013; Harris et al., 2012) as
| (1) |
where is (unlensed) luminosities of CO (1–0) in units of and is the FWHM line width in units of . The – correlation of unlensed SMGs is known to be scattered because of unknown inclination angles of the SMGs, but this is still useful to roughly constrain the magnification factors of lensed SMGs.
As we will see in the next section, the molecular masses derived from CO (2–1) and (4–3) with their conversion factors, and , typically found among SMGs (e.g., Harrington et al., 2021; Hagimoto et al., 2023) are almost the same, suggesting that the inferred CO spectral line energy distribution of MM J1545 is similar to those found in SMGs. Thus, it is reasonable to assume derived from CO (2–1) for the CO (1–0) luminosity. Eq. 1 predicts the CO (1–0) luminosity of , which requires magnification to reach the apparent CO (1–0) luminosity. Despite the dex scatter in the – correlation, this is in reasonable agreement with the magnification factor we derived in section 3.2. Hereafter we assume the magnification factor to be .
4.2 Intrinsic Properties
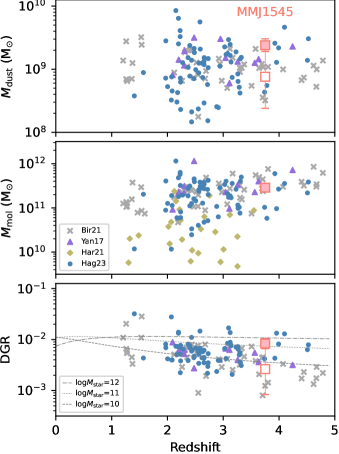
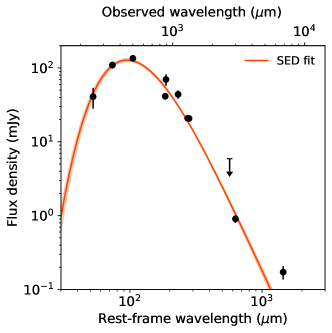
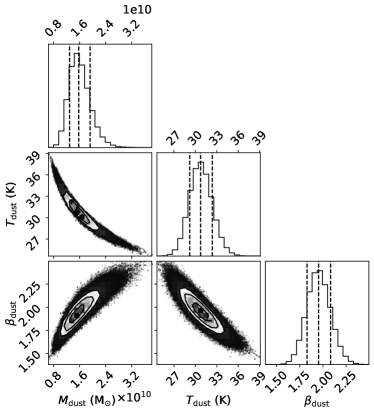
Figure 4 shows the rest-frame FIR-to-mm SED of MM J1545. In addition to photometry from the literature (Tamura et al., 2015), archival ALMA band 3 and 7 data are used. The aperture sizes we used for ALMA photometry are (band 3) and (band 6 and 7). The modified blackbody fits yield the dust temperature K, the emissivity index , and the apparent IR luminosity of if we take into account the heating from the cosmic microwave background ( K at ) following the expression by da Cunha et al. (2013). The emissivity index is higher than that previously obtained (, Tamura et al., 2015) because the new ALMA 3 mm photometry makes the Rayleigh–Jeans slope steeper. Although the origin of the flux excess at 7 mm is unknown, there could be an additional component such as a lower component, which can be confirmed by ALMA band 1 observations.
If we take the magnification factor of , the delensed IR luminosity () and corresponding star-formation rate ( yr-1 using the Kennicutt & Evans (2012) conversion with the Kroupa et al. (1993) IMF) are similar to those of unlensed SMGs which are in the bright-end ( mJy) of their number counts (e.g., Geach et al., 2017; Hatsukade et al., 2018; Simpson et al., 2020; Fujimoto et al., 2023).
Remarkably, the dust temperature found in MM J1545 is relatively low among the SMGs with a similar unlensed (e.g., Reuter et al., 2020), indicating a massive dust mass. If we approximate the dust mass absorption coefficient () as , with ( as (10.41 cm2 g-1, 1900 GHz) from Draine (2003), the lensed and delensed dust masses are inferred to be and , respectively. As shown in the top panel of Figure 5, the intrinsic dust mass of MM J1545 is large even compared with those of the largest dust reservoirs at , such as lensed SMGs from the SPT (Yang et al., 2017) and Herschel surveys (Hagimoto et al., 2023) as well as unlensed SMGs (Birkin et al., 2021) from AS2COSMOS (Simpson et al., 2020), AS2UDS (Stach et al., 2019), and ALESS (Hodge et al., 2013). This could, however, have a systematic uncertainty depending on choice of the dust mass absorption coefficient. The value often employed at 850 m (i.e., GHz) ranges from 0.04 cm2 g-1 (Draine & Lee, 1984) to 0.3 cm2 g-1 (Mathis & Whiffen, 1989) with an intermediate value 0.11 cm2 g-1 (Hildebrand, 1983), which gives –8 cm2 g-1 with an intermediate value cm2 g-1 at GHz if assuming . In this case the dust mass may be reduced by dex, yielding an intrinsic dust mass of , where the error includes the systematic uncertainty arising from the choice of .
Also, the intrinsic molecular mass is estimated to be large. The apparent molecular masses estimated from CO (2–1) and (4–3) are and if we assume CO(2–1)-to-CO(1–0) and CO(4–3)-to-CO(1–0) brightness temperature ratios found in Planck-selected SMGs ( and , respectively; Harrington et al. 2021) and a CO (1–0) to conversion factor (Dunne et al., 2022), respectively (Table 1). This indicates an intrinsic molecular mass of although it could decrease by dex depending on the choice of . This is comparable to the molecular masses found in the SMG population at , as shown in the middle panel of Figure 5.
Along with the intrinsic SFR, the molecular gas depletion time-scale is estimated to be Gyr. This appears to be greater than those found in the SPT sources at (Reuter et al., 2020) whereas more similar to coeval () main-sequence galaxies (Saintonge et al., 2013). This trend is consistent with that found in the Schmidt–Kennicutt relation of dusty star-forming galaxies (Hagimoto et al., 2023), where 71 Herschel-selected bright SMGs were compared with the SPT and main-sequence galaxies. This implies that star formation in MM J1545 is not very bursty, which is consistent with the fact that the dust temperature is relatively low.
The intrinsic dust and molecular masses ( and ) give the inferred dust-to-gas mass ratio (DGR) of . This value is even higher than that of the Milky Way and is among the highest end of the DGR distribution found in bright SPT and Herschel sources (Yang et al. 2017; Hagimoto et al. 2023, see also Péroux & Howk 2020), as shown in the bottom panel of Figure 5. The inferred sum of gas and solid-phase metallicity would be at least or following the relation of Péroux & Howk (2020) and is likely to be or if the dust-to-metal mass ratio is as high as (Péroux & Howk, 2020). The high DGR or metallicity at is indicative of the presence of an underlying massive stellar component of MM J1545, which is not seen in the current optical and NIR images. The curves in the bottom panel of Figure 5 show the DGRs expected for the stellar components with the stellar mass of , 11, and 12. This suggests that MM J1545 should have a stellar component with at least and perhaps . We note that the DGR may be smaller by dex if the smaller value is allowed for dust mass as we saw before. If we take , then the DGR is estimated to be , which is comparable to the typical values found in lensed and unlensed SMGs or DSFGs at but still indicates the highly-enriched ISM compared to coeval galaxies in general.
5 Conclusions
We report detections of two emission lines at 48.5 and 97.0 GHz in a mJy SMG, MM J154506.4344318 (MM J1545), using the ATCA and the Nobeyama 45 m telescope. We also find the blueshifted part of an emission line at GHz using archival ALMA data. Together with the photometric redshift estimates and the ratio between the line and IR luminosities, we conclude that they are most likely to be the (2–1), (4–3), and (9–8) rotational transitions of 12CO at redshift . The ALMA continuum imaging confirms MM J1545 to be a gravitationally-lensed SMG with a magnification factor of , suggesting the presence of an intrinsically massive, chemically-enriched reservoir of cool ISM at or 1.6 Gyr after the Big Bang.
If assuming a nominal magnification of for MM J1545, the intrinsic dust and molecular masses are still high even after correcting for magnification ( and ), which is indicative of a high DGR (). Such a starburst galaxy with a chemically-enriched reservoir of cool ISM at is rare even compared with existing samples and will provide a unique opportunity to investigate spatially-resolved properties of ISM and star-formation in the early universe. This work, however, only adds one additional source to existing samples and thus does not provide stringent constraints on the general properties of the extremely-bright population of dusty star-forming galaxies due to a small sample size. Expanding the extremely-bright samples at will address the earlier chemical enrichment more thoroughly. Future (sub-)mm facilities for wide-field imaging (e.g., TolTEC, Wilson et al., 2020) and wideband spectroscopy (e.g., DESHIMA 2.0, FINER, Taniguchi et al., 2022; Rybak et al., 2022; Tamura et al., 2024) will allow us to investigate this further. Also, stellar and nebular properties in the rest-frame optical are also necessary for comprehensive understanding. Higher-resolution ALMA and James Webb Space Telescope imaging will play an important role in fully characterizing the physical properties of MM J1545.
6 Acknowledgement
We acknowledge the referee for fruitful comments. We thank Takuma Izumi for fruitful suggestions on the ATCA observations and Yuki Yamaguchi and Ryo Ando for their support on the Nobeyama 45 m observations. This work is supported by KAKENHI (No. 15H02073, 19K03937, 20001003, 22H04939, 22KJ1598, 23K20035) and NAOJ ALMA Scientific Research grant No. 2018-09B and NAOJ-ALMA-321. IdG acknowledges support from grant PID2020-114461GB-I00, funded by MCIN/AEI/10.13039/501100011033. The Australia Telescope Compact Array is part of the Australia Telescope National Facility, which is funded by the Commonwealth of Australia for operation as a National Facility managed by CSIRO. The 45 m radio telescope is operated by Nobeyama Radio Observatory, a branch of National Astronomical Observatory of Japan. This paper makes use of the following ALMA data: ADS/JAO.ALMA# 2015.1.00512.S, 2018.1.00126.S, and 2019.1.00245.S. ALMA is a partnership of ESO (representing its member states), NSF (USA) and NINS (Japan), together with NRC (Canada), NSC and ASIAA (Taiwan), and KASI (Republic of Korea), in cooperation with the Republic of Chile. The Joint ALMA Observatory is operated by ESO, AUI/NRAO and NAOJ. Data analysis was in part carried out on the Multi-wavelength Data Analysis System operated by the Astronomy Data Center (ADC), National Astronomical Observatory of Japan.
References
- Astropy Collaboration et al. (2013) Astropy Collaboration, Robitaille, T. P., Tollerud, E. J., et al. 2013, A&A, 558, A33, doi: 10.1051/0004-6361/201322068
- Astropy Collaboration et al. (2018) Astropy Collaboration, Price-Whelan, A. M., Sipőcz, B. M., et al. 2018, AJ, 156, 123, doi: 10.3847/1538-3881/aabc4f
- Astropy Collaboration et al. (2022) Astropy Collaboration, Price-Whelan, A. M., Lim, P. L., et al. 2022, ApJ, 935, 167, doi: 10.3847/1538-4357/ac7c74
- Baars (2007) Baars, J. W. M. 2007, The Paraboloidal Reflector Antenna in Radio Astronomy and Communication, Vol. 348, doi: 10.1007/978-0-387-69734-5
- Birkin et al. (2021) Birkin, J. E., Weiss, A., Wardlow, J. L., et al. 2021, MNRAS, 501, 3926, doi: 10.1093/mnras/staa3862
- Blain et al. (2002) Blain, A. W., Smail, I., Ivison, R. J., Kneib, J. P., & Frayer, D. T. 2002, Phys. Rep., 369, 111, doi: 10.1016/S0370-1573(02)00134-5
- Bothwell et al. (2013) Bothwell, M. S., Smail, I., Chapman, S. C., et al. 2013, MNRAS, 429, 3047, doi: 10.1093/mnras/sts562
- CASA Team et al. (2022) CASA Team, Bean, B., Bhatnagar, S., et al. 2022, PASP, 134, 114501, doi: 10.1088/1538-3873/ac9642
- Casey et al. (2014) Casey, C. M., Narayanan, D., & Cooray, A. 2014, Phys. Rep., 541, 45, doi: 10.1016/j.physrep.2014.02.009
- da Cunha et al. (2013) da Cunha, E., Groves, B., Walter, F., et al. 2013, ApJ, 766, 13, doi: 10.1088/0004-637X/766/1/13
- Draine (2003) Draine, B. T. 2003, ApJ, 598, 1017, doi: 10.1086/379118
- Draine & Lee (1984) Draine, B. T., & Lee, H. M. 1984, ApJ, 285, 89, doi: 10.1086/162480
- Dunne et al. (2022) Dunne, L., Maddox, S. J., Papadopoulos, P. P., Ivison, R. J., & Gomez, H. L. 2022, MNRAS, 517, 962, doi: 10.1093/mnras/stac2098
- Eales et al. (2010) Eales, S., Dunne, L., Clements, D., et al. 2010, PASP, 122, 499, doi: 10.1086/653086
- Ezawa et al. (2004) Ezawa, H., Kawabe, R., Kohno, K., & Yamamoto, S. 2004, in Society of Photo-Optical Instrumentation Engineers (SPIE) Conference Series, Vol. 5489, Ground-based Telescopes, ed. J. Oschmann, Jacobus M., 763–772, doi: 10.1117/12.551391
- Ezawa et al. (2008) Ezawa, H., Kohno, K., Kawabe, R., et al. 2008, in Society of Photo-Optical Instrumentation Engineers (SPIE) Conference Series, Vol. 7012, Ground-based and Airborne Telescopes II, ed. L. M. Stepp & R. Gilmozzi, 701208, doi: 10.1117/12.789652
- Fujimoto et al. (2023) Fujimoto, S., Kohno, K., Ouchi, M., et al. 2023, ALMA Lensing Cluster Survey: Deep 1.2 Mm Number Counts and Infrared Luminosity Functions at $z\simeq1-8$, arXiv. http://ascl.net/2303.01658
- Garratt et al. (2023) Garratt, T. K., Geach, J. E., Tamura, Y., et al. 2023, MNRAS, 520, 3669, doi: 10.1093/mnras/stad307
- Geach et al. (2017) Geach, J. E., Dunlop, J. S., Halpern, M., et al. 2017, MNRAS, 465, 1789, doi: 10.1093/mnras/stw2721
- Genzel et al. (2015) Genzel, R., Tacconi, L. J., Lutz, D., et al. 2015, ApJ, 800, 20, doi: 10.1088/0004-637X/800/1/20
- Gururajan et al. (2022) Gururajan, G., Béthermin, M., Theulé, P., et al. 2022, A&A, 663, A22, doi: 10.1051/0004-6361/202142172
- Hagimoto et al. (2023) Hagimoto, M., Bakx, T. J. L. C., Serjeant, S., et al. 2023, MNRAS, 521, 5508, doi: 10.1093/mnras/stad784
- Harrington et al. (2021) Harrington, K. C., Weiss, A., Yun, M. S., et al. 2021, ApJ, 908, 95, doi: 10.3847/1538-4357/abcc01
- Harris et al. (2012) Harris, A. I., Baker, A. J., Frayer, D. T., et al. 2012, ApJ, 752, 152, doi: 10.1088/0004-637X/752/2/152
- Harris et al. (2020) Harris, C. R., Millman, K. J., van der Walt, S. J., et al. 2020, Nature, 585, 357, doi: 10.1038/s41586-020-2649-2
- Hatsukade et al. (2018) Hatsukade, B., Kohno, K., Yamaguchi, Y., et al. 2018, Publications of the Astronomical Society of Japan, 70, 105, doi: 10.1093/pasj/psy104
- Hildebrand (1983) Hildebrand, R. H. 1983, QJRAS, 24, 267
- Hodge et al. (2013) Hodge, J. A., Karim, A., Smail, I., et al. 2013, ApJ, 768, 91, doi: 10.1088/0004-637X/768/1/91
- Hoyer & Hamman (2016) Hoyer, S., & Hamman, J. 2016, Journal of Open Research Software, 5, doi: 10.5334/jors.148
- Hunter (2007) Hunter, J. D. 2007, Computing in Science & Engineering, 9, 90, doi: 10.1109/MCSE.2007.55
- Ikarashi et al. (2011) Ikarashi, S., Kohno, K., Aguirre, J. E., et al. 2011, MNRAS, 415, 3081, doi: 10.1111/j.1365-2966.2011.18918.x
- Ikeda et al. (2001) Ikeda, M., Nishiyama, K., Ohishi, M., & Tatematsu, K. 2001, in Astronomical Society of the Pacific Conference Series, Vol. 238, Astronomical Data Analysis Software and Systems X, ed. J. Harnden, F. R., F. A. Primini, & H. E. Payne, 522
- Iono et al. (2009) Iono, D., Wilson, C. D., Yun, M. S., et al. 2009, ApJ, 695, 1537, doi: 10.1088/0004-637X/695/2/1537
- Iono et al. (2012) Iono, D., Hatsukade, B., Kohno, K., et al. 2012, PASJ, 64, L2, doi: 10.1093/pasj/64.4.L2
- Kennicutt & Evans (2012) Kennicutt, R. C., & Evans, N. J. 2012, ARA&A, 50, 531, doi: 10.1146/annurev-astro-081811-125610
- Kohno et al. (2008) Kohno, K., Tamura, Y., Hatsukade, B., et al. 2008, in Astronomical Society of the Pacific Conference Series, Vol. 399, Panoramic Views of Galaxy Formation and Evolution, ed. T. Kodama, T. Yamada, & K. Aoki, 264
- Kroupa et al. (1993) Kroupa, P., Tout, C. A., & Gilmore, G. 1993, MNRAS, 262, 545, doi: 10.1093/mnras/262.3.545
- La Barbera et al. (2010) La Barbera, F., de Carvalho, R. R., de La Rosa, I. G., & Lopes, P. A. A. 2010, MNRAS, 408, 1335, doi: 10.1111/j.1365-2966.2010.17091.x
- Larson (1969) Larson, R. B. 1969, MNRAS, 145, 271, doi: 10.1093/mnras/145.3.271
- Litke et al. (2019) Litke, K. C., Marrone, D. P., Spilker, J. S., et al. 2019, ApJ, 870, 80, doi: 10.3847/1538-4357/aaf057
- Mathis & Whiffen (1989) Mathis, J. S., & Whiffen, G. 1989, ApJ, 341, 808, doi: 10.1086/167538
- McKinney (2010) McKinney, W. 2010, in Proceedings of the 9th Python in Science Conference, Vol. 445, Austin, TX, 51–56
- Michałowski et al. (2010) Michałowski, M., Hjorth, J., & Watson, D. 2010, A&A, 514, A67, doi: 10.1051/0004-6361/200913634
- Nakajima et al. (2013) Nakajima, T., Kimura, K., Nishimura, A., et al. 2013, PASP, 125, 252, doi: 10.1086/670124
- Negrello et al. (2010) Negrello, M., Hopwood, R., De Zotti, G., et al. 2010, Science, 330, 800, doi: 10.1126/science.1193420
- Newville et al. (2023) Newville, M., Otten, R., Nelson, A., et al. 2023, lmfit/lmfit-py: 1.2.2, 1.2.2, Zenodo, doi: 10.5281/zenodo.8145703
- Oguri (2010) Oguri, M. 2010, PASJ, 62, 1017, doi: 10.1093/pasj/62.4.1017
- Omont et al. (2011) Omont, A., Neri, R., Cox, P., et al. 2011, A&A, 530, L3, doi: 10.1051/0004-6361/201116921
- pandas development team (2020) pandas development team, T. 2020, pandas-dev/pandas: Pandas, latest, Zenodo, doi: 10.5281/zenodo.3509134
- Péroux & Howk (2020) Péroux, C., & Howk, J. C. 2020, ARA&A, 58, 363, doi: 10.1146/annurev-astro-021820-120014
- Reuter et al. (2020) Reuter, C., Vieira, J. D., Spilker, J. S., et al. 2020, ApJ, 902, 78, doi: 10.3847/1538-4357/abb599
- Rybak et al. (2020) Rybak, M., Hodge, J. A., Vegetti, S., et al. 2020, MNRAS, 494, 5542, doi: 10.1093/mnras/staa879
- Rybak et al. (2022) Rybak, M., Bakx, T., Baselmans, J., et al. 2022, Journal of Low Temperature Physics, 209, 766, doi: 10.1007/s10909-022-02730-y
- Saintonge et al. (2013) Saintonge, A., Lutz, D., Genzel, R., et al. 2013, ApJ, 778, 2, doi: 10.1088/0004-637X/778/1/2
- Saito et al. (2015) Saito, M., de Gregorio, I., & Team SOLA. 2015, in Astronomical Society of the Pacific Conference Series, Vol. 499, Revolution in Astronomy with ALMA: The Third Year, ed. D. Iono, K. Tatematsu, A. Wootten, & L. Testi, 215
- Santamaría-Miranda et al. (2021) Santamaría-Miranda, A., de Gregorio-Monsalvo, I., Plunkett, A. L., et al. 2021, A&A, 646, A10, doi: 10.1051/0004-6361/202039419
- Sault et al. (1995) Sault, R. J., Teuben, P. J., & Wright, M. C. H. 1995, in Astronomical Society of the Pacific Conference Series, Vol. 77, Astronomical Data Analysis Software and Systems IV, ed. R. A. Shaw, H. E. Payne, & J. J. E. Hayes, 433, doi: 10.48550/arXiv.astro-ph/0612759
- Scott et al. (2012) Scott, K. S., Wilson, G. W., Aretxaga, I., et al. 2012, MNRAS, 423, 575, doi: 10.1111/j.1365-2966.2012.20905.x
- Silva et al. (1998) Silva, L., Granato, G. L., Bressan, A., & Danese, L. 1998, ApJ, 509, 103, doi: 10.1086/306476
- Simpson et al. (2020) Simpson, J. M., Smail, I., Dudzevičiūtė, U., et al. 2020, Monthly Notices of the Royal Astronomical Society, 495, 3409, doi: 10.1093/mnras/staa1345
- Spilker et al. (2014) Spilker, J. S., Marrone, D. P., Aguirre, J. E., et al. 2014, ApJ, 785, 149, doi: 10.1088/0004-637X/785/2/149
- Spilker et al. (2015) Spilker, J. S., Aravena, M., Marrone, D. P., et al. 2015, ApJ, 811, 124, doi: 10.1088/0004-637X/811/2/124
- Stach et al. (2019) Stach, S. M., Dudzevičiūtė, U., Smail, I., et al. 2019, MNRAS, 487, 4648, doi: 10.1093/mnras/stz1536
- Swinbank et al. (2010) Swinbank, A. M., Smail, I., Longmore, S., et al. 2010, Nature, 464, 733, doi: 10.1038/nature08880
- Tacconi et al. (2018) Tacconi, L. J., Genzel, R., Saintonge, A., et al. 2018, ApJ, 853, 179, doi: 10.3847/1538-4357/aaa4b4
- Takekoshi et al. (2013) Takekoshi, T., Tamura, Y., Minamidani, T., et al. 2013, ApJ, 774, L30, doi: 10.1088/2041-8205/774/2/L30
- Tamura et al. (2014) Tamura, Y., Saito, T., Tsuru, T. G., et al. 2014, ApJ, 781, L39, doi: 10.1088/2041-8205/781/2/L39
- Tamura et al. (2015) Tamura, Y., Kawabe, R., Shimajiri, Y., et al. 2015, ApJ, 808, 121, doi: 10.1088/0004-637X/808/2/121
- Tamura et al. (2024) Tamura, Y., Sakai, T., Kawabe, R., et al. 2024, in Society of Photo-Optical Instrumentation Engineers (SPIE) Conference Series, Vol. 13102, Millimeter, Submillimeter, and Far-Infrared Detectors and Instrumentation for Astronomy XII, ed. J. Zmuidzinas & J.-R. Gao, 131020G, doi: 10.1117/12.3017788
- Taniguchi et al. (2022) Taniguchi, A., Bakx, T. J. L. C., Baselmans, J. J. A., et al. 2022, Journal of Low Temperature Physics, 209, 278, doi: 10.1007/s10909-022-02888-5
- Tomida et al. (2010) Tomida, K., Machida, M. N., Saigo, K., Tomisaka, K., & Matsumoto, T. 2010, ApJ, 725, L239, doi: 10.1088/2041-8205/725/2/L239
- Tomida et al. (2013) Tomida, K., Tomisaka, K., Matsumoto, T., et al. 2013, ApJ, 763, 6, doi: 10.1088/0004-637X/763/1/6
- Tully & Fisher (1977) Tully, R. B., & Fisher, J. R. 1977, A&A, 54, 661
- Vieira et al. (2010) Vieira, J. D., Crawford, T. M., Switzer, E. R., et al. 2010, ApJ, 719, 763, doi: 10.1088/0004-637X/719/1/763
- Vieira et al. (2013) Vieira, J. D., Marrone, D. P., Chapman, S. C., et al. 2013, Nature, 495, 344, doi: 10.1038/nature12001
- Weiß et al. (2009) Weiß, A., Kovács, A., Coppin, K., et al. 2009, ApJ, 707, 1201, doi: 10.1088/0004-637X/707/2/1201
- Wilson et al. (2008) Wilson, G. W., Austermann, J. E., Perera, T. A., et al. 2008, MNRAS, 386, 807, doi: 10.1111/j.1365-2966.2008.12980.x
- Wilson et al. (2020) Wilson, G. W., Abi-Saad, S., Ade, P., et al. 2020, in Society of Photo-Optical Instrumentation Engineers (SPIE) Conference Series, Vol. 11453, Millimeter, Submillimeter, and Far-Infrared Detectors and Instrumentation for Astronomy X, ed. J. Zmuidzinas & J.-R. Gao, 1145302, doi: 10.1117/12.2562331
- Yang et al. (2017) Yang, C., Omont, A., Beelen, A., et al. 2017, A&A, 608, A144, doi: 10.1051/0004-6361/201731391
- Zhang et al. (2018) Zhang, Z.-Y., Romano, D., Ivison, R. J., Papadopoulos, P. P., & Matteucci, F. 2018, Nature, 558, 260, doi: 10.1038/s41586-018-0196-x