Abstract
Fire Influence on Regional to Global Environments and Air Quality (FIREX-AQ) was a field campaign aimed at better understanding the impact of wildfires and agricultural fires on air quality and climate. The FIREX-AQ campaign took place in August 2019 and involved two aircraft and multiple coordinated satellite observations. This study applied and evaluated a self-supervised machine learning (ML) method for the active fire and smoke plume identification and tracking in the satellite and sub-orbital remote sensing datasets collected during the campaign. Our unique methodology combines remote sensing observations with different spatial and spectral resolutions. The demonstrated approach successfully differentiates fire pixels and smoke plumes from background imagery, enabling the generation of a per-instrument smoke and fire mask product, as well as smoke and fire masks created from the fusion of selected data from independent instruments. This ML approach has a potential to enhance operational wildfire monitoring systems and improve decision-making in air quality management through fast smoke plume identification and tracking and could improve climate impact studies through fusion data from independent instruments.
keywords:
FIREX-AQ; fire and smoke detection; Big data applications; clustering; computer vision; image segmentation; self-supervised deep learning; multi-modal data fusion1 \issuenum1 \articlenumber0 \datereceived \dateaccepted \datepublished \hreflinkhttps://doi.org/ \TitleDevelopment and Application of Self-Supervised Machine Learning for Smoke Plume and Active Fire Identification from the FIREX-AQ Datasets \TitleCitationDevelopment and Application of Self-Supervised Machine Learning for Smoke Plume and Active Fire Identification from the FIREX-AQ Datasets \AuthorNicholas LaHaye 1,2\orcidA, Anistasija Easley, Kyongsik Yun 1\orcidB, Huikyo Lee1\orcidC, Erik Linstead3,4\orcidI, Michael J. Garay 1\orcidD, and Olga V. Kalashnikova1\orcidH \AuthorNamesNicholas LaHaye, Anistasija Easley, Kyongsik Yun, Huikyo Lee, Erik Linstead, Michael J. Garay, and Olga V. Kalashnikova \AuthorCitationLaHaye N.; Easley A.; Yun K.; Lee, H.; Linstead, E.; Garay, M. J.; Kalashnikova, O. \corresCorrespondence: nlahaye@sig-gis.com
1 Introduction
An important and common application of machine learning (ML) is to identify and leverage latent patterns in data or imagery. A typical approach is to use supervised learning, which requires a set of truth labels that the ML method attempts to generalize to the problem of mapping from an input dataset to the output through a set of features, . The challenge with supervised learning, and even the recently popularized semi-supervised learning, is acquiring a sufficiently large and unambiguous set of labels, which often requires many hours of manual labor on the part of domain experts. Alternatively, self-supervised learning takes a similar input dataset and finds relationships among the features resulting in context-free groupings in the output . Because no labels are provided for the input, there are no labels provided in the output. To utilize the results, the labels or missing context must be assigned after the fact by experts, but this has proven to be a much less labor-intensive endeavor, all while keeping subject matter experts in the loop.
In previous work, we demonstrated that feeding 2-dimensional images of instrument radiances, or Level 1 (L1) data, into Deep Belief Networks (DBNs) coupled with an unsupervised clustering method results in images automatically segmented into relevant geophysical objects LaHaye et al. (2019). We further demonstrated that the same results can be achieved using a simplified architecture across select areas of the globe and for various kinds of land surface and atmospheric segmentation tasks LaHaye et al. (2021).
In our recent work LaHaye et al. (2024), we have generalized our ML framework into an open-source software system called Segmentation, Instance Tracking, and data Fusion Using multi-SEnsor imagery (SIT-FUSE). This framework allows for various types of encoders, including regular and convolutional DBNs, Transformers, and Convolutional Neural Networks (CNNs), and we have moved from traditional unsupervised clustering to a deep-learning-based clustering approach.
This approach, as a whole, has several unique benefits. First, it is not restricted to a particular remote sensing instrument with specific spatial or spectral resolution. Second, it has the potential to identify and “track” geophysical objects across datasets acquired from multiple instruments. Third, it allows for the joining of data from different instruments, "fusing" the information within the self-supervised encoder. Finally, it can be applied to many different scenes and problem sets, most notably in no- and low-label environments, not just ones for which labeled training sets exist, which is required for strictly supervised ML techniques.
Here we apply our self-supervised ML approach to the problem of automatically detecting and tracking wildfires and smoke plumes, through sequences of L1 (imagery) data acquired by multiple remote sensing instruments during the joint National Aeronautics and Space Administration/National Oceanic and Atmospheric Administration (NASA/NOAA) Fire Influence on Regional to Global Environments and Air Quality (FIREX-AQ) field campaign that took place in the western United States in the summer of 2019 Warneke et al. (2023). The high-altitude NASA ER-2 carried seven remote sensing instruments that provided high-spatial resolution observations of fires and smoke plumes in conjunction with NASA DC-8 aircraft and multiple satellite overpasses over same fire events. The FIREX-AQ datasets of collocated satellite and multiple airborne imagery at different spatial resolution are excellent as a testbad for SIT-FUSE method of fire/smoke identification and tracking.
Wildfires and the smoke plumes induced by wildfires substantially contribute to the carbon cycle and can have a long-lasting impact on air quality and Earth’s climate system. In addition, human-driven climate change is associated with more frequent and severe wildfires Williams et al. (2019). Despite the importance and immediacy of the problem, most research and decision-support tools to study wildfires and plumes use observations from a single instrument whose spatial coverage and (spatial, spectral, and temporal) resolutions vary from very fine to very coarse scales, neither of which, on their own, is fully capable of providing the much-needed information for a comprehensive understanding of wildfires and wildfire smoke Stavros et al. (2019). As such, the current study aims to bine datasets with different spatial resolutions from multiple instruments to create a patchwork of datasets that fill the temporal gaps present in current single-instrument fire detection datasets. Here, the first step is testing a general framework for segmenting the datasets from multiple instruments and identifying wildfires and smoke plumes.
The detection and tracking of objects, like wildfires and smoke plumes, within a single instrument data has long required developing instrument-specific retrieval algorithms. Such development is labor-intensive and requires domain-specific parameters and instrument-specific calibration metrics, alongside the manual effort to track retrieved objects across multiple scenes Barmpoutis et al. (2020). The recent development of retrieval algorithms is actively underway in the field of supervised deep learning (DL), and various methods (e.g., Convolutional Neural Networks (CNN)s) have been applied. Some of these DL methodologies work well, in terms of precision and accuracy Barmpoutis et al. (2020), but are still limited by the requirement that the spatial resolutions between training datasets and output products be the same. These methods also require pre-existing label sets, unlike recent supervised approaches like Fully Convolutional Networks (FCNs), Mask R-CNNs, and Transformers Long et al. (2015); He et al. (2017); Xie et al. (2021), which require large label sets to archive accurate results.
In our previous work, we demonstrated that an encoder trained in a self-supervised manner, namely a Deep Belief Network (DBN), trained with L1 (instrument radiance) images, can segment images based on geophysical objects within the scene, in conjunction with unsupervised clustering LaHaye et al. (2019). The unique benefit of this method is that its application is not limited to a single spatial or spectral resolution, and the method has the potential to detect and track objects from images with different resolutions from multiple instruments. With this method, instead of requiring a per-instrument finely hand-labeled label set, we can apply a coarser manual context assignment after segmentation on a smaller set of training scenes, allowing for this technique to be easily applied in cases of no labels or limited labels. We have also quantitatively validated that the same could be done using a simpler architecture for a set of atmospheric and land surface classification tasks using varying spectral, spatial, temporal, and multi-angle remote sensing data as input LaHaye et al. (2021). Since this work, we have transitioned from unsupervised clustering to self-supervised deep clustering, which we will discuss further in the methods section. This completely self-supervised approach can leverage training data from many different scenes, not just ones that are accounted for by previous label sets for training, as is the case with strictly supervised techniques. Ongoing research applies this self-supervised machine learning methodology to track detected smoke plumes across spatiotemporal domains. However, this study focuses on identifying wildfire and smoke plumes within a single-instrument dataset and using a fusion of datasets from multiple instruments.
2 \switchcolumn
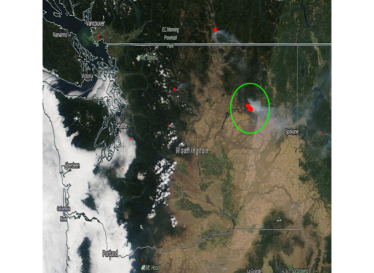
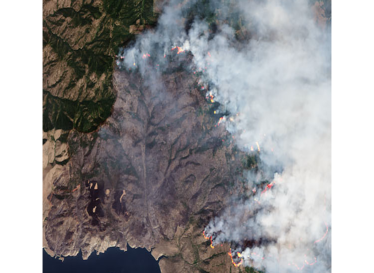
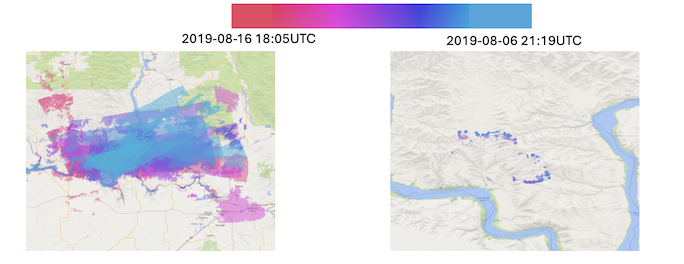
We used remote sensing datasets from airborne and satellite instruments collected during the Fire Influence on Regional to Global Environments Experiment - Air Quality 2019 (FIREX-AQ 2019; https://csl.noaa.gov/projects/firex-aq/) campaign. Specifically, we investigated the wildfires and smoke plumes originating from the Williams Flat Fire over the three days from August 6th through August 8th, 2020. Figure 1 shows a map of the active fire (red area within the green circle), taken from NASA’s WorldView Snapshots web tool and a close-up reference image of Williams the fire taken from the Landsat-8 Operational Land Imager (OLI). Where available, we also tested on scenes over the Sheridan Fire, from August 15 through August 23. The FIREX-AQ campaign involved two aircraft: the DC-8 aircraft with a primary payload of in-situ instruments supplemented by several remote sensors, and NASA’s high-altitude ER-2 aircraft with a package of seven remote sensing instruments. The ER-2 aircraft coordinated on a few occasions with the DC-8 aircraft and had multiple collocations with satellite sensors flying directly along the satellite track. Therefore, several observations of the same active fires and smoke plumes were made by multiple instruments at various spatial resolutions. Table 1 and Table 2 summarize the datasets from airborne and satellite instruments used in this study.
| Platform | Instruments | Science Products | Spatial Resolution |
| NASA ER-2 | Airborne Multiangle SpectroPolarimetric Imager (AirMSPI) Diner et al. (2013) | Spectro-polarimetric intensities (10 m spatial resolution, 8 wavelengths in 355-935 nm spectral range, 3 polarimetric bands) | 10m |
| NASA ER-2 | Enhanced MODIS Airborne Simulator (eMAS) Guerin et al. (2011) | Spectral intensities in 38 bands in 445nm - 967nm and 1.616m-14.062m spectral ranges | 50m |
| NASA DC-8 | MODIS/ASTER Airborne Simulator (MASTER) Hook et al. (2001) | Spectral intensities in 50 bands in 0.44-12.6m spectral range | 10-30m |
| NASA DC-8 | Airborne Visible / Infrared Imaging Spectrometer - Classic (AVIRIS-C) Green et al. (1998) | Spectral intensities in 224 bands in 400-2500 nm spectral range | 10-30m |
| Platform | Instruments | Science Products | Spatial Resolution |
| Terra | Multi-angle Imaging SpectroRadiometer (MISR) Diner (1999) | Spectral intensities in 446nm, 558nm, 672nm, and 867nm | 1.1km and 275m, all resampled to 1.1km |
| Terra and Aqua | MODerate resolution Imaging SpectroRadiometer (MODIS) King et al. (1992) | Spectral intensities in 38 bands in 445nm-967nm and 1.616m-14.062m spectral range | 1km when used alone and resampled to 1.1km when used with MISR |
| Suomi NPP and NOAA-20 | Visible Infrared Imaging Suite (VIIRS) of Commerce (2017) | Spectral intensities in 5 bands in 0.44-12.6m spectral range | 375m |
| GOES-17 | Advanced Baseline Imager (ABI) DOC et al. (2019) | Spectral intensities in 50 bands in 0.47-13.3m spectral range | 1km and 2km, all resampled to 2km |
| PlanetScope | Dove Imagers PBC (2018–) | Spectral intensities in 4 bands in 455-860 nm spectral range | 1-3m native resolution, all resampled to 10m per the NASA Technical Report \hreflinkhttps://ntrs.nasa.gov/citations/20240001694Planet Imagery Geometric Assessment |
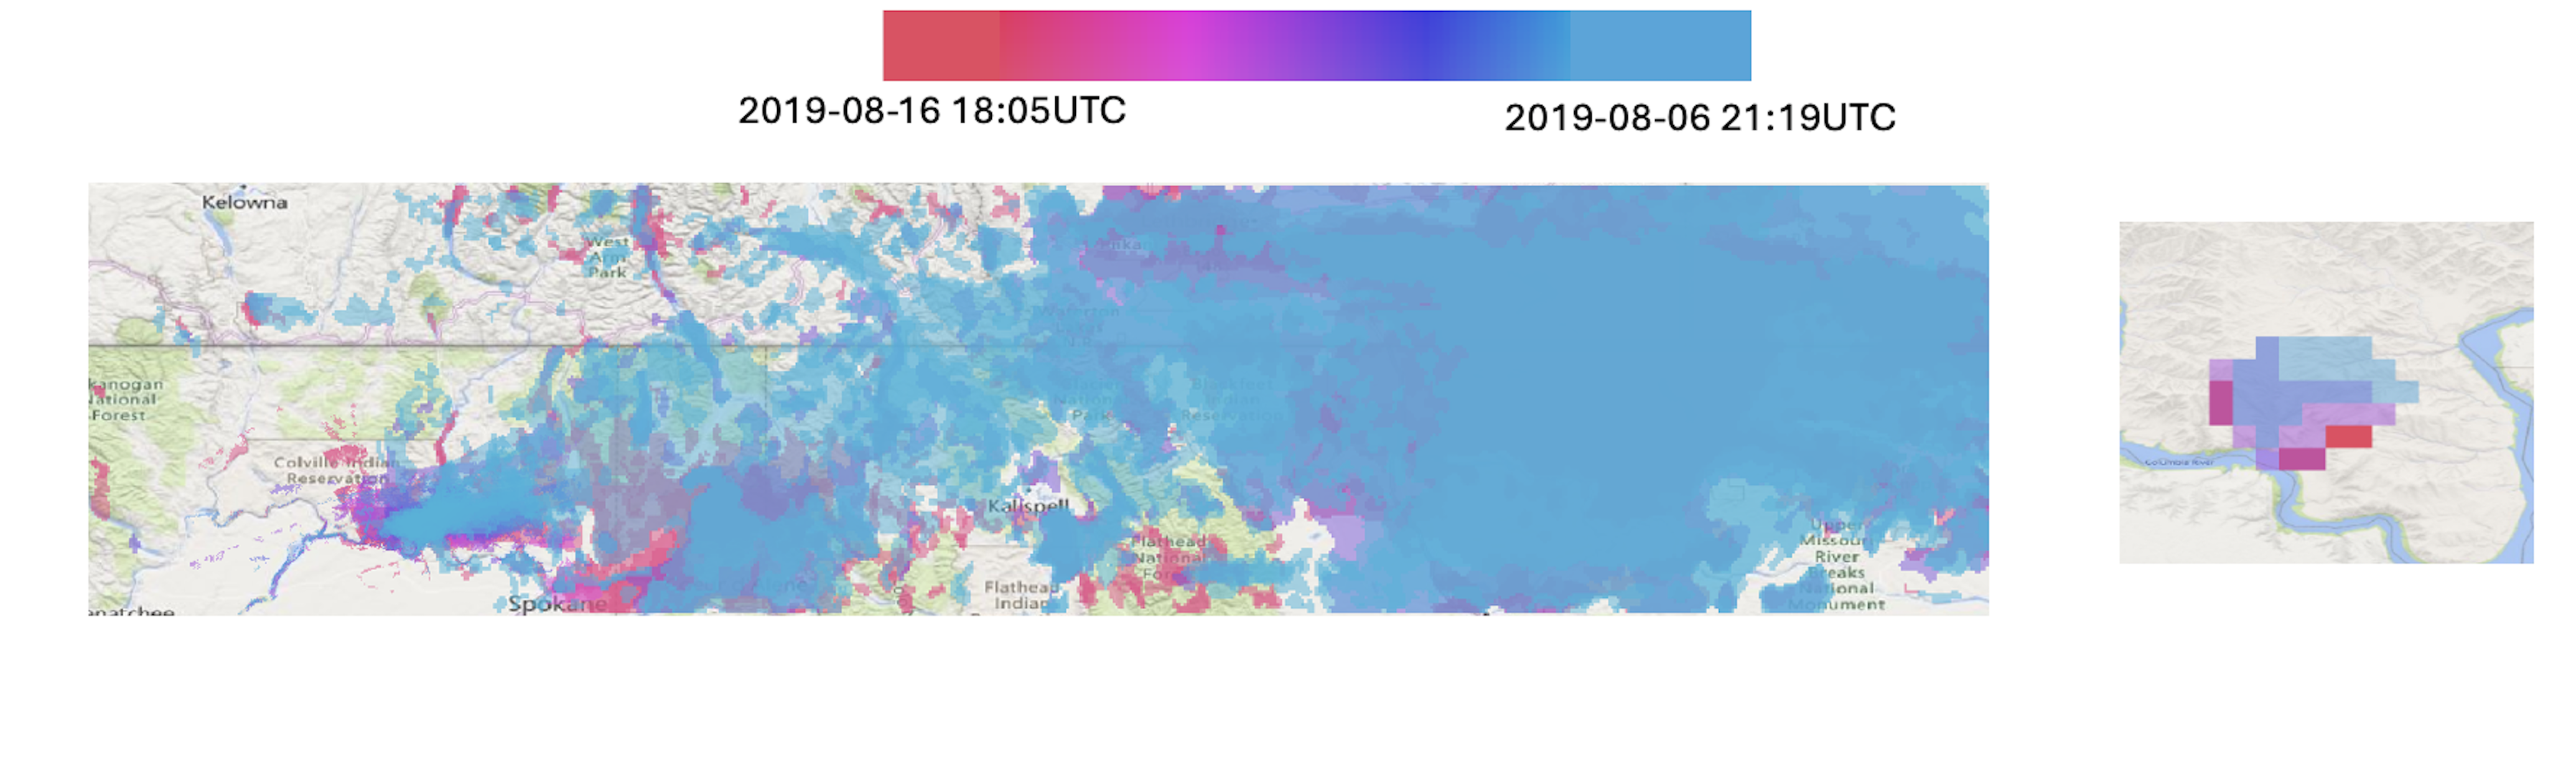
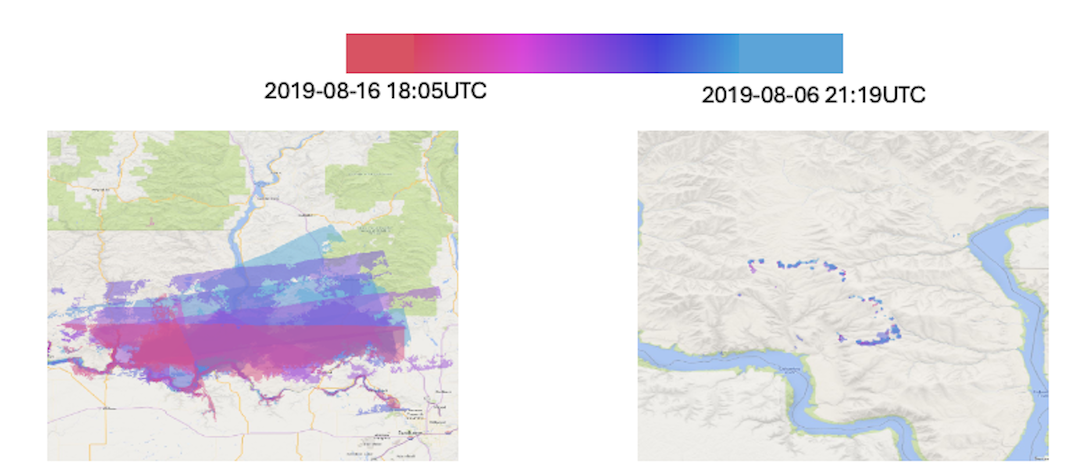
This approach not only allows us to leverage single- and multi-instrument datasets to create a denser static patchwork of fire and smoke detections with increased spatial, spectral, and temporal resolution (as depicted in Figures 2 3 4), but it also gives us a uniform embedding-based representation of the data via the encoder outputs and final output of clusters. The final cluster output can be used in conjunction with spatial distributions of the output labels to facilitate fire and smoke plume instance tracking across multi-sensor scenes over varying spatiotemporal domains. Figures 2 3 4 demonstrate the various tiers and scales of representative capabilities over the Williams Flats fire on August 06, 2019, when incorporating observations GOES at the coarse spatial but fine temporal resolution end of the scale, and the airborne instruments mentioned in Table 1 over the Williams Flats and Sheridan fires at the fine spatial but coarse temporal end of the scale, along with the polar orbiters in-between these two extremes.
2 \switchcolumn
2 Related Works
Work on the general problem of self-supervised image segmentation appears to have had success in separating the foreground from the background Kanezaki (2018); Chen et al. (2019), or have only used single bands of input from one type of instrumentation, which is effective for their applications, but does not cover the breadth required here Aganj et al. (2018). Other works have aimed to perform tasks, such as outlining buildings and roadways Soares et al. (2020), which is not the goal here. A similar study, which used just autoencoders and a form of clustering, an overall architecture that is close to a subset of ours, attained an accuracy of 83% on Landsat imagery alone Zhang et al. (2019). This uses a similar kind of model to our studies, but uses a single instrument. With large variations in spatial and spectral resolutions, our technique attains higher accuracy (and balanced accuracy, in some cases) across many different instrument sets, including fused data. Even with more recent breakthroughs in semi-supervised semantic segmentation, like the Segment Anything Model (SAM), a problem-dependent amount of labels is required, and SAM is largely unproven in complex domains like remote sensing Kirillov et al. (2023). The identification of the necessary size of label sets, generation of per-pixel label sets, and testing of the feasibility of new techniques in more complex domains are all problem-specific and time-consuming tasks that can be skipped, given our solution - as seen in the successful but extremely limited cases discusses in Thangavel et al. (2023); Spiller et al. (2023); Boroujeni et al. (2024); goo . Lastly, there are new physics-based retrieval techniques, which seem promising, but need continued rigorous analysis to generalize across different regions and instrument types Sun et al. (2023). In the future, it may be useful to combine the physical parameterizations and ML-based retrievals via ML loss functions that are ’physics-aware’. The lack of need for large new label sets mitigates the costly, labor-intensive work of manually segmenting each pixel within a dataset used for ground truth, a process which is itself error-prone, and other previously mentioned supervised learning-related precursors model training. Also, leveraging pre-existing operational products to use as labels for supervised learning tasks will inherently cause them to either lack training set diversity or suffer from the issues mentioned above. On the other hand, our approach is well suited to handle large amounts of data, because our unsupervised and self-supervised models can perform label-free image segmentation. The fact that the human-in-the-loop steps of context application and validation occur after the images have been segmented allows for human oversight while mitigating the need for the extremely labor-intensive act of pixel-by-pixel manual segmentation for tens of thousands of images.
3 Materials and Methods
3.1 Methods
3.2 Data Preprocessing
For single instrument cases, data was re-projected to the WGS84 Latitude/Longitude projection. For multi-sensor cases, data is collocated, re-projected to the WGS84 Latitude/Longitude projection, resampled to the lowest common spatial resolution, and stacked channel-wise. The actual fusion occurs as a part of the representation learning done inside the encoder.
Samples were generated by taking pixels and their direct neighbors (center pixel + 8 neighbors), in all channels, and creating a flat vector. These samples were then standardized by removing the per-channel mean and scaling to per-channel unit variance. The per-channel mean and standard deviations are computed over the full sample set from the scenes used for training.
For training, the scenes used are subsets. To ensure the subset of samples from the training scenes contained a representative variety of terrain and phenomena, k-means clustering was applied to the data with a set of 50 classes. This stratification technique was chosen as it has proven to be an effective, albeit naive, way to ensure variation within training samples MacQueen (1967); Lin et al. (2021); Burke et al. (2023). Three million samples are randomly sampled based on the stratification generated by the full number of samples from the training scenes labeled with the 50 k-means classes. All pixels that are set to fill values, or out of specified valid ranges are discarded before any pre-processing. Regarding the spectral bands used, all spectral bands were used except bands that were extremely noisy or known to be non-functional for the FIREX-AQ campaign time frame. The same pixels used to train the encoders are also used to train the deep clustering heads, and the full training scenes are used to assign context.
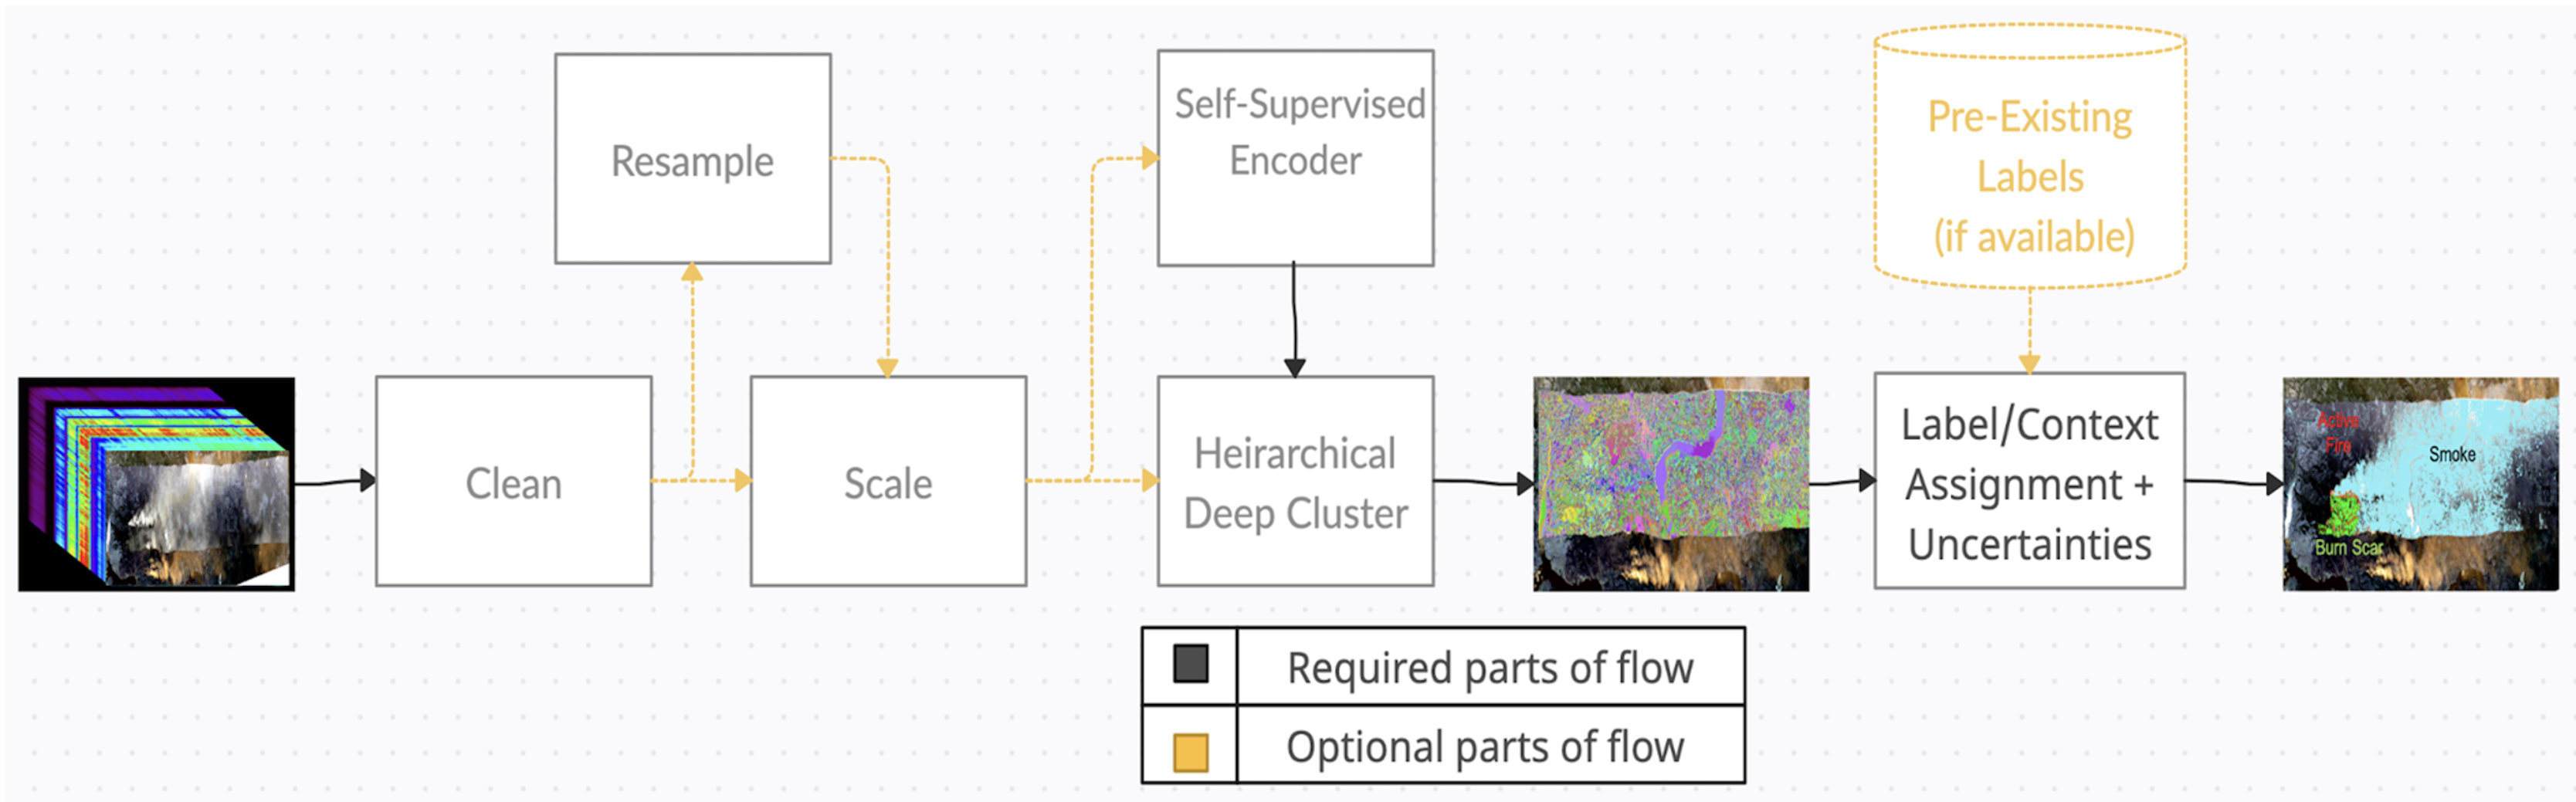
SIT-FUSE can take larger tiles for Convolutional DBNs, CNN-based, and Transformer-based architectures (as mentioned below). However, the pixel neighborhood has proven to provide enough spatial context with regular DBNs, as used in this work. Figure 5 depicts the overall flow of SIT-FUSE.
3.2.1 Self-Supervised Representation Learning
SIT-FUSE is developed to be a generic framework allowing various kinds of encoders and foundation models that leverage self-supervised representation learning, including Deep Belief Networks (DBNs) trained using contrastive divergence, Convolutional Neural Networks (CNNs) with residual connections trained via Bootstrap Your Own Latent (BYOL), and Transformers trained using Image-Joint Embedding Predictive Architecture (I-JEPA) or Masked AutoEncoders (MAEs), as well as pre-trained Transformers for Earth Science, like \hreflinkhttps://madewithclay.org/Clay Grill et al. (2020); Assran et al. (2023); Liao et al. (2022); He et al. (2022). For all of these experiments, we used DBNs with 2-3 layers. DBNs were selected here because previous work and experiments done in this work demonstrated that they produce reasonable results and the parameter space is much smaller than the other models mentioned above. We have done extensive validation on the use of DBNs from both the perspective of structural understanding and downstream task performance, as well as resource consumption assessment, for the large set of single-instrument and fusion datasets LaHaye et al. (2021). In short, 2-3 layer DBNs provide a relatively compact model ( 2 million parameters vs 100 million - 10 billion parameters) with representational capabilities that meet our needs, and have demonstrated out-sized representational capabilities in other experiments relative to much larger models Liao et al. (2022). We are currently evaluating encoder complexity in relation to segmentation performance and geographic coverage, to optimally operationalize this approach for operational global production, which will be discussed further in later manuscripts.
As in our previous work LaHaye et al. (2021, 2019, 2024), the DBN architectures used leverage feature expansion, outputting embeddings of a pixel neighborhood in a larger feature space than the one with which the samples were input. Similar to the idea behind input kernelization, architecture-based feature expansion allows the models to learn nonlinear latent patterns that would be compact and complex in lower dimensions in simpler but higher-dimension forms. This method, although not the most common use case for DBNs or encoders in general, has been demonstrated effectively in other studies as well as in our previous work de Boves Harrington (2018); Sobczak and Kapela (2019); Harrington (2020); LaHaye et al. (2019, 2021). In previous works, we held architecture parameters static for all tests to demonstrate efficacy. Here, we varied the number of layers and hidden/output parameters for each encoder used, based on input data spectral resolution.
2 \switchcolumn
3.2.2 Deep Clustering
To extract segmentation maps from the per-pixel embeddings, we use deep clustering, specifically Information Invariant Clustering.
Previous experiments used BIRCH and other forms of traditional agglomerative clustering. We have transitioned to DL-based clustering because the training time, inference time, memory requirements, and model re-usability are all much improved when using neural network layers via PyTorch when compared to using traditional clustering via sci-kit-learn. These layers are trained using the invariant information clustering (IIC) loss function. IIC aims to assign labels that maximize mutual information between an input sample x and a perturbed version of x, x’ Ji et al. (2019) . For our use, perturbations are additions of Gaussian noise to the outputs of RBM-based architectures.
2 \switchcolumn
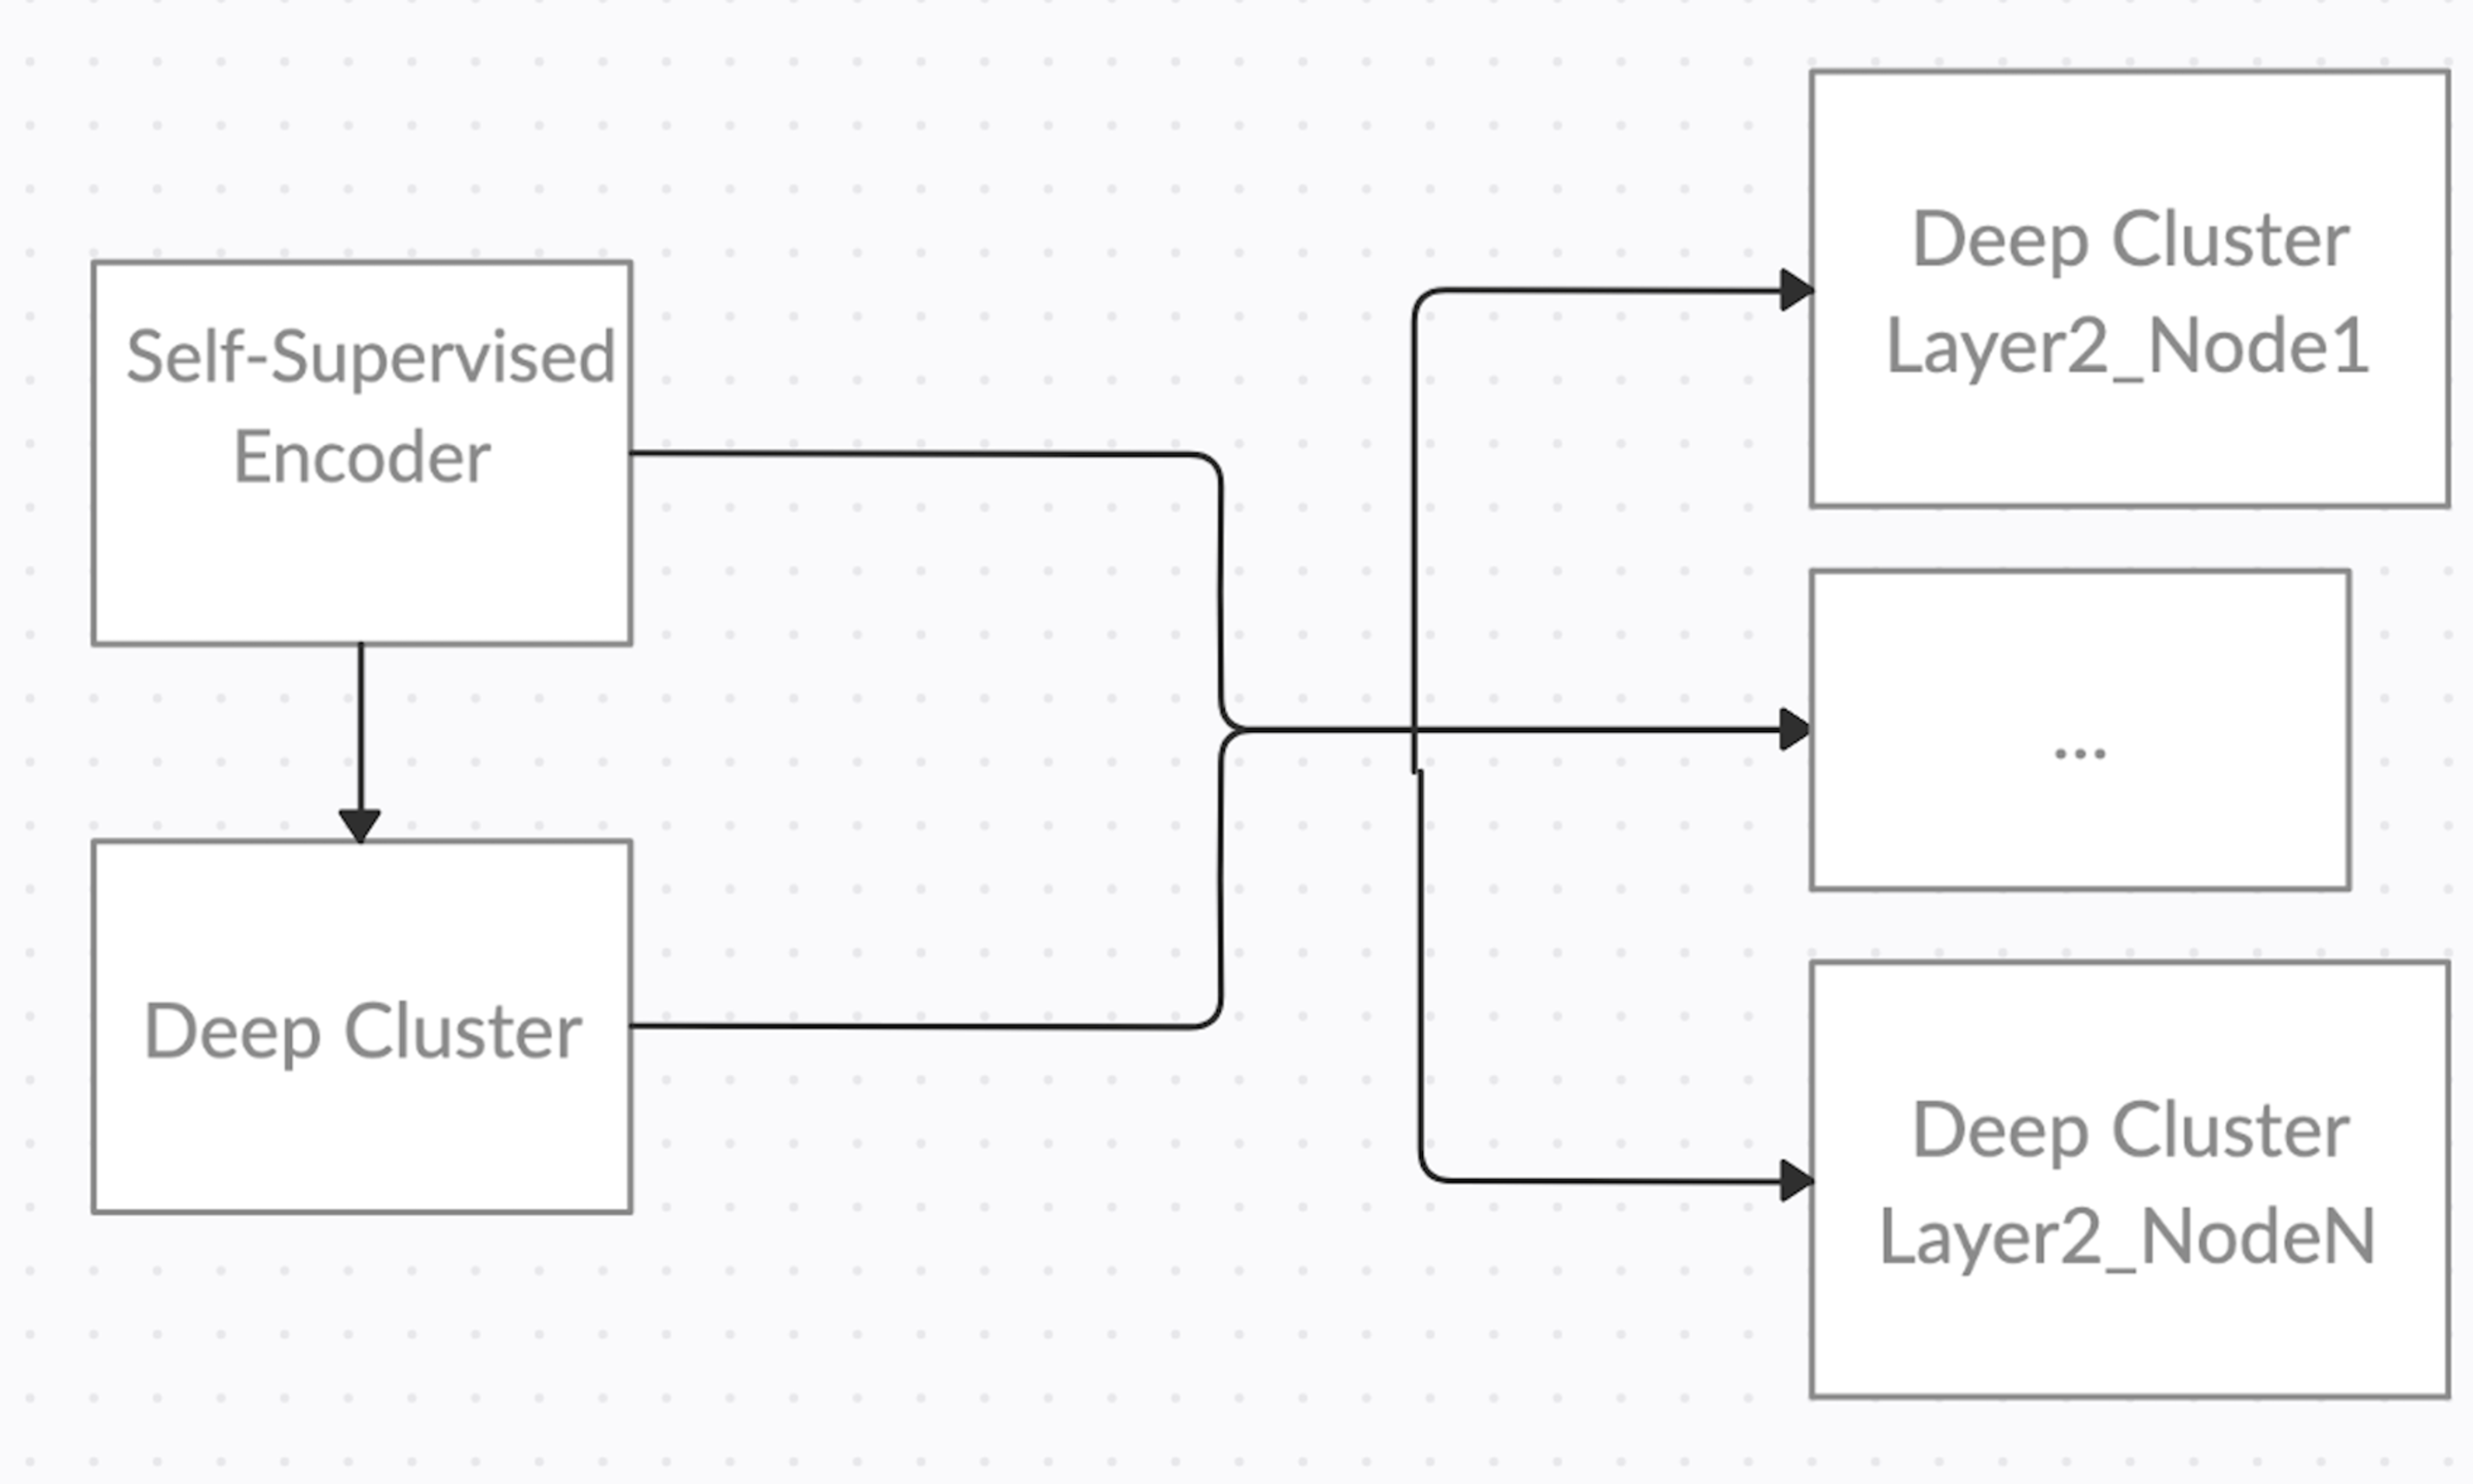
To mimic the hierarchical nature of agglomerative clustering output, we have set up hierarchical deep clustering layers. Here, the output heads are set up in a tree structure where each sub-tree is only trained on label samples classified as belonging to their parent label sets. Each layer receives only the output of the encoder, but as the tree is built from the top down, each neural network in a child node position on the tree only sees samples assigned labels associated with its parent and ancestor node(s). In this way, we can create scene segmentation at varying levels of specificity and explore the connections between each level. To our knowledge, this is the first study/ software system that leverages IIC layers, or even deep clustering layers, in this fashion. For each of the pipelines, the root IIC head allows for 800 possible classes and each child IIC head allows for 100 subclasses. Currently, the level of hierarchy is specified by the user and there is no automated node splitting, but this could be implemented in the future. For our purposes, only two levels of hierarchy are used. We believe that this not only allows us to attain the specificity required for our segmentation tasks but that the hierarchical labeling can be leveraged as a co-pilot for data exploration and discovery. Figure 6 shows a two-level tree for performing deep clustering.
3.2.3 Hand Labeling
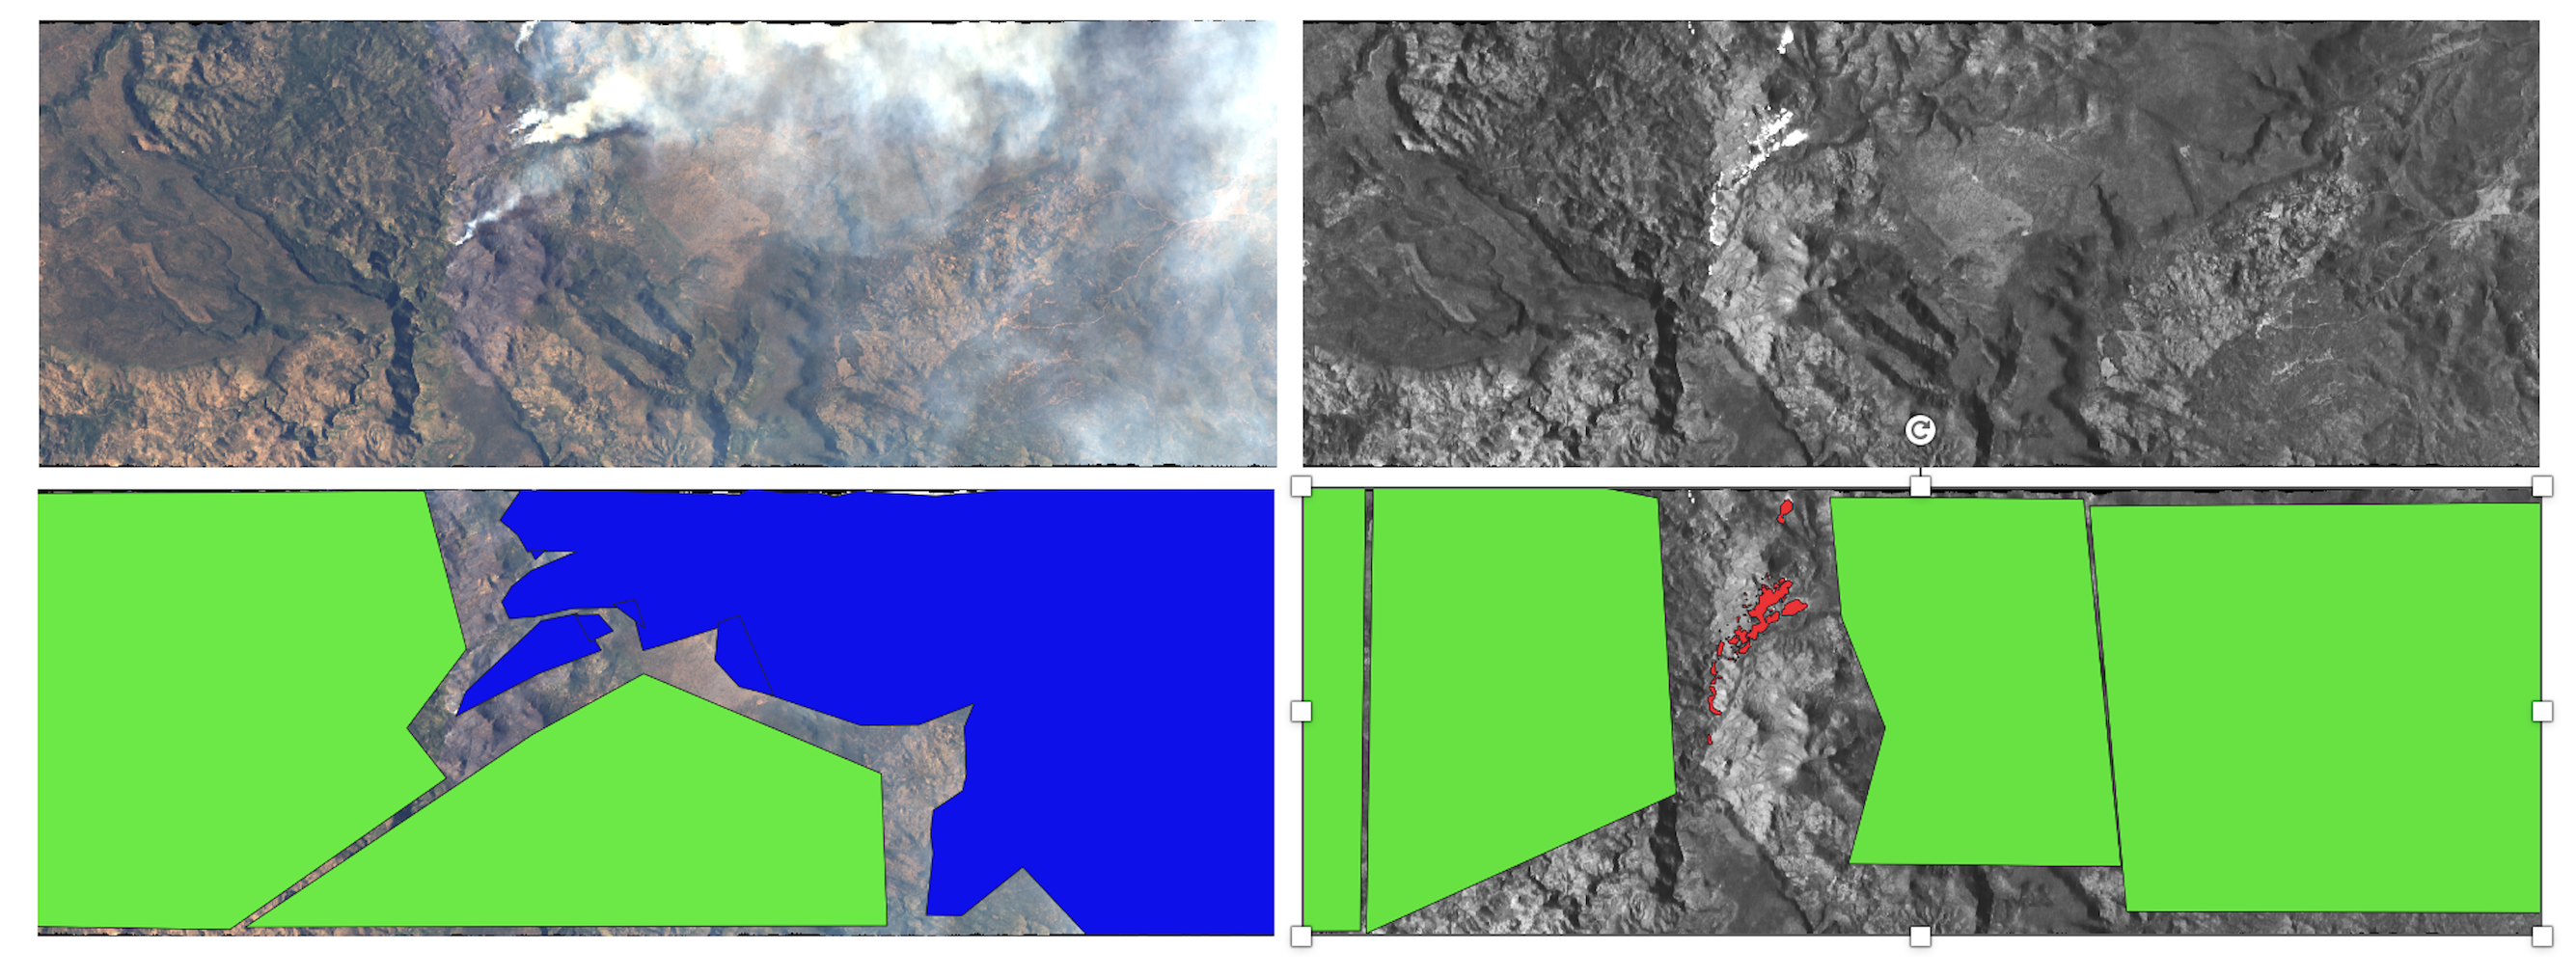
For both context assignment and validation, subject matter experts labeled areas of high-certainty smoke, fire, and associated backgrounds. All areas that labelers were uncertain about, remained without labels. This labeling process was done by generating polygons over the remote sensing imagery. An example is provided below in Figure 7. Because scenes can have overlapping classes (i.e. fire and smoke are contained in the same pixel), but also have areas distinct to a single class, a separate background class label set was generated for fire and smoke. Figure 7 illustrates the labeling process over a single AVIRIS-C scene.
2 \switchcolumn
Unlike labeling for supervised learning, this approach does not require all training samples to be labeled, which is relevant for problems with high uncertainty in boundary cases, like the segmentation of fire fronts and smoke plumes. The labeling of only the high certainty class areas allows us to capture and compare against segmentation structure, and provide ample samples for context assignment. Although this labeling minimizes the pre-analysis labor required from subject matter experts, it still keeps experts in the loop (a crucial piece for science-related ML tasks). Relative to the number of scenes labeled here, supervised and semi-supervised tasks require 100x more labeled samples or more. Also, because they are learning the mapping between the labels and the input datasets directly, they require much more complete label sets (i.e. uncertain areas must be labeled background or foreground, potentially leading to systematic over-segmentation or under-segmentation).
3.2.4 Context Assignment
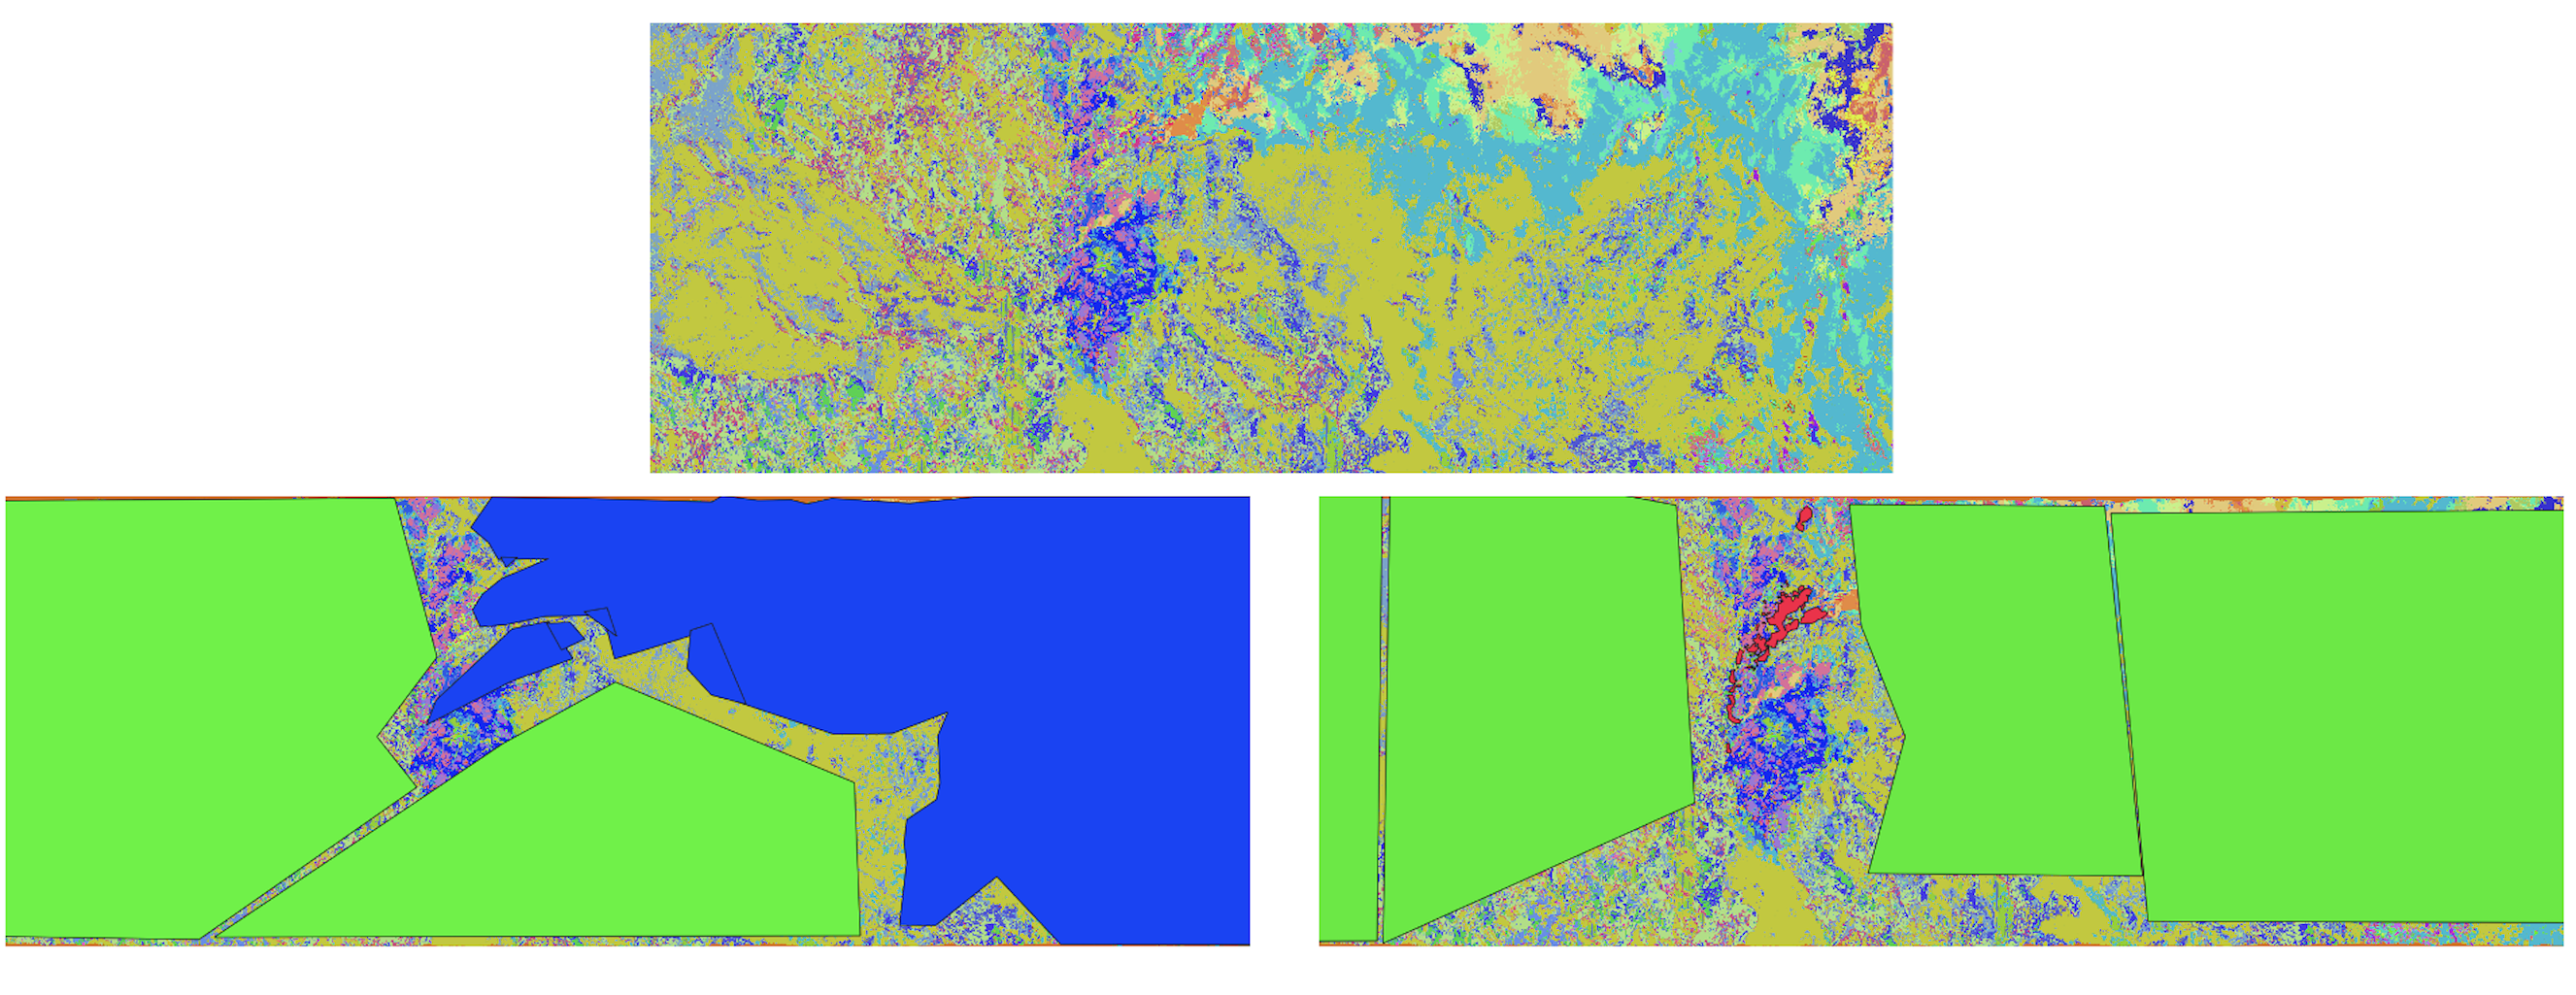
To assign context to the context-free segmentation maps generated via SIT-FUSE, we used zonal histogramming. For this, we overlayed the labels for a specific scene on the segmentation map generated for the same scene and generated counts of overlapping occurrences of the segmentation map classes and the high-certainty smoke, fire, and background labels. These were gathered over multiple scenes, and then each class in the segmentation maps was assigned to the labels it best matched. This assignment was done separately for each class of interest and its associated background class to ensure multi-class representation, like pixels containing both smoke and fire. Figure 8 provides an example of labels overlayed on a segmentation map.
2 \switchcolumn
3.2.5 Contouring and Filtering
As the pixels within the detection are components of larger, often connected, geophysical objects, SIT-FUSE allows for building objects from separate detection pixels. To do this, we leverage the contouring capabilities within the openCV python / C++ software package Suzuki and be (1985); Bradski (2000). Once generated, these contours are filled and we are left with multiple separate objects, instead of many more distinct pixels. We can also filter out small and large objects, where appropriate, and while not used here, leveraging dilations and erosions on the contoured objects is also possible. To mimic the automated process of an operationalized version and ensure fair comparisons and validation, all processing is performed uniformly across all scenes in an input set.
3.2.6 Validation
There is no direct ground truth here - meaning comparisons are done against pre-existing detections as well as hand labels generated over only the high certainty areas of smoke plumes and fire fronts - and we know there are other areas of these objects that are not included in the labels. Therefore, recall, precision, and their collective summary via F1-scoring are too harsh of evaluators here. We evaluated some previously published versions of precision and recall that apply fuzzy logic, but ultimately landed on the structural similarity index (SSIM) to evaluate performance across the various dataset pairsWang et al. (2004); Wang and Bovik (2009). This is a fairly common problem within the remote sensing domain and one we aim to help solve with the collective incorporation of self-supervised learning, subject matter expert domain knowledge, and large amounts of data Woodhouse (2021); Yang et al. (2019).
3.3 Materials and Tools
The software was developed with Python 3.9.13. SIT-FUSE has open-source functionality at its core LaHaye et al. (2025). To achieve the required goals of the software and leverage pre-existing and well-validated open-source software, geospatial, big data, and ML toolkits are the backbone of SIT-FUSE. For optimized handling and computation on large datasets across CPUs and GPUs, numpy, scipy, dask, xarray, Zarr, numba, and cupy are used Harris et al. (2020); Virtanen et al. (2020); Dask Development Team (2016); Hoyer and Hamman (2017); zar (2025); Lam et al. (2015); Okuta et al. (2017) . For CPU- and GPU-based ML model training, deployment, evaluation, and auto-differentiation, sci-kit-learn, PyTorch, and torchvision are used Paszke et al. (2019); Pedregosa et al. (2011). Because RBMs are not included within the PyTorch library, Learnergy, an open-source library that contains various PyTorch-backed RBM-based architectures is used as well Roder et al. (2020). On the geospatial side of the problems being solved, pyresample, GDAL, OSR, healpy, polar2grid, and GeoPandas are leveraged pyr (2024); Rouault et al. (2025); Zonca et al. (2019); pol (2025); Jordahl et al. (2020). Lastly, for non-machine-learning computer vision techniques, OpenCV is used Itseez (2015). The combination of these commonly used and well-tested software systems allows us to employ state-of-the-art approaches and architectures with minimal development and maintenance efforts, most of which are only minimally visible to the end user. SIT-FUSE is also publicly available and maintained on the public version of GitHub. For labeling, context assignment, and visualization / qualitative assessments, QGIS, an open-source Geographic Information System (GIS) was used QGIS Development Team .
The hardware utilized was an NVIDIA GeForce Titan V100 GPU with 32 GB memory, as well as the NCCS Prism GPU Cluster(https://www.nccs.nasa.gov/systems/ADAPT/Prism).
4 Results
4.1 Fire Detection
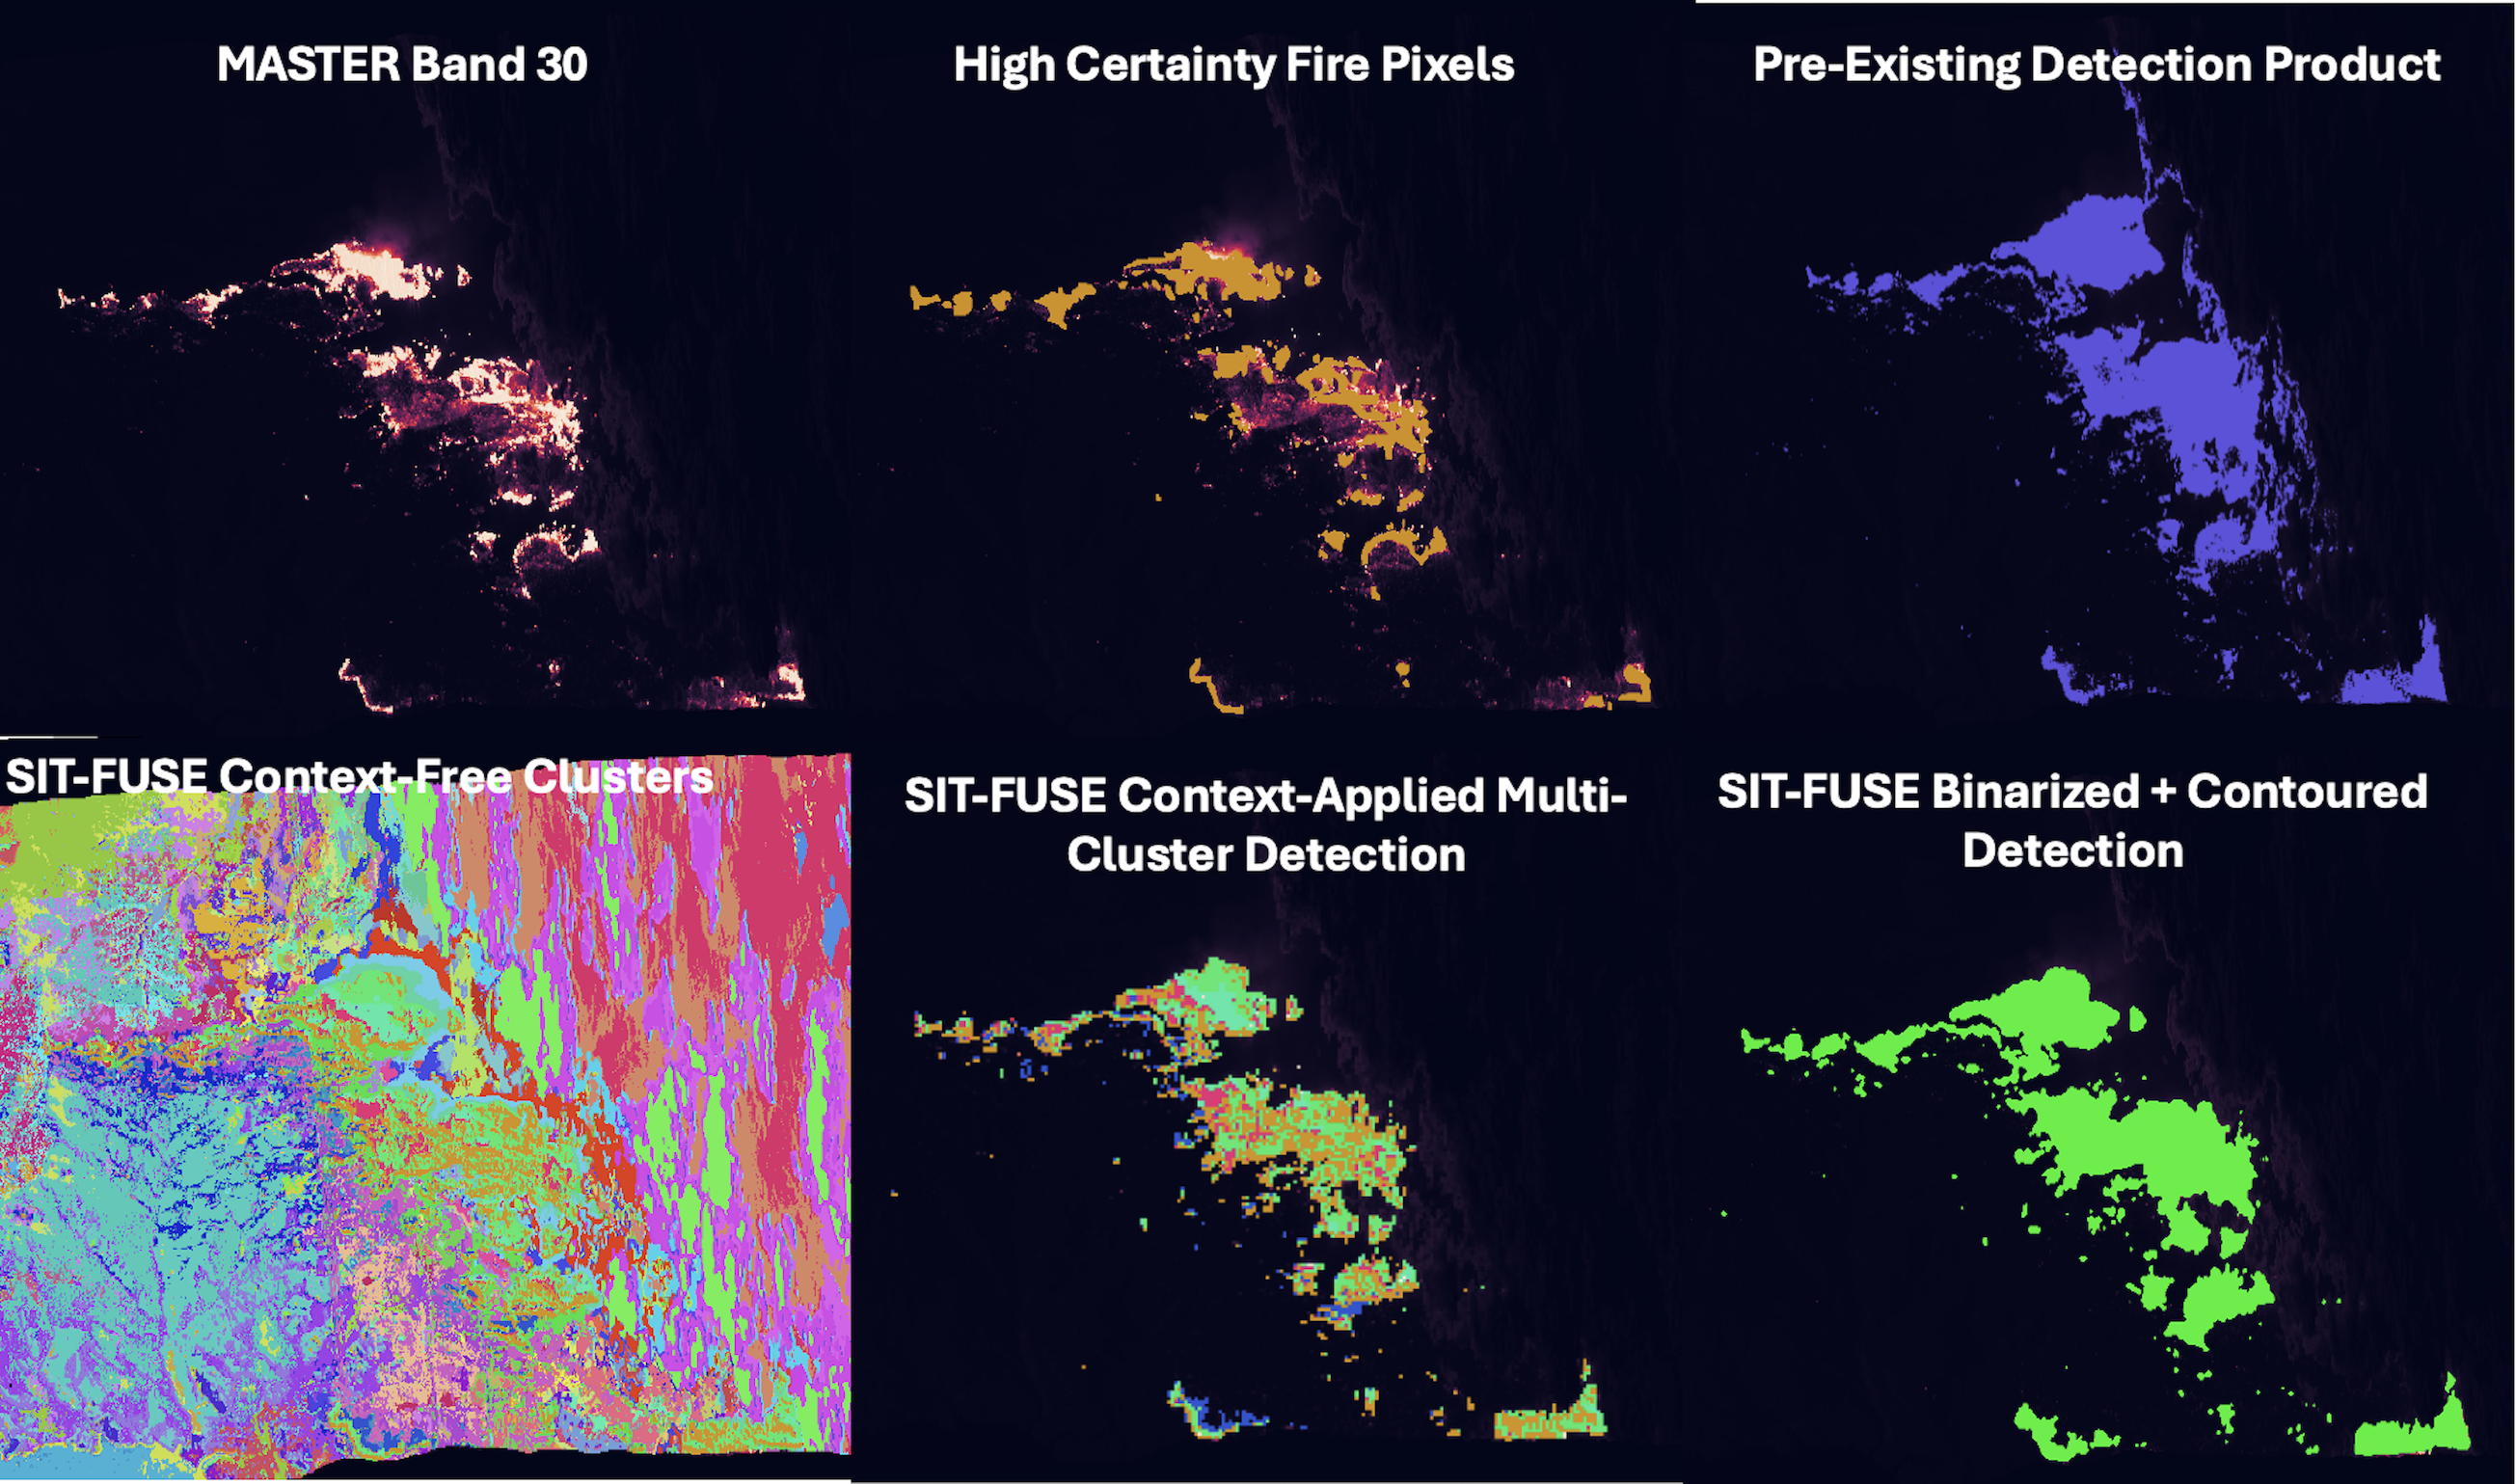
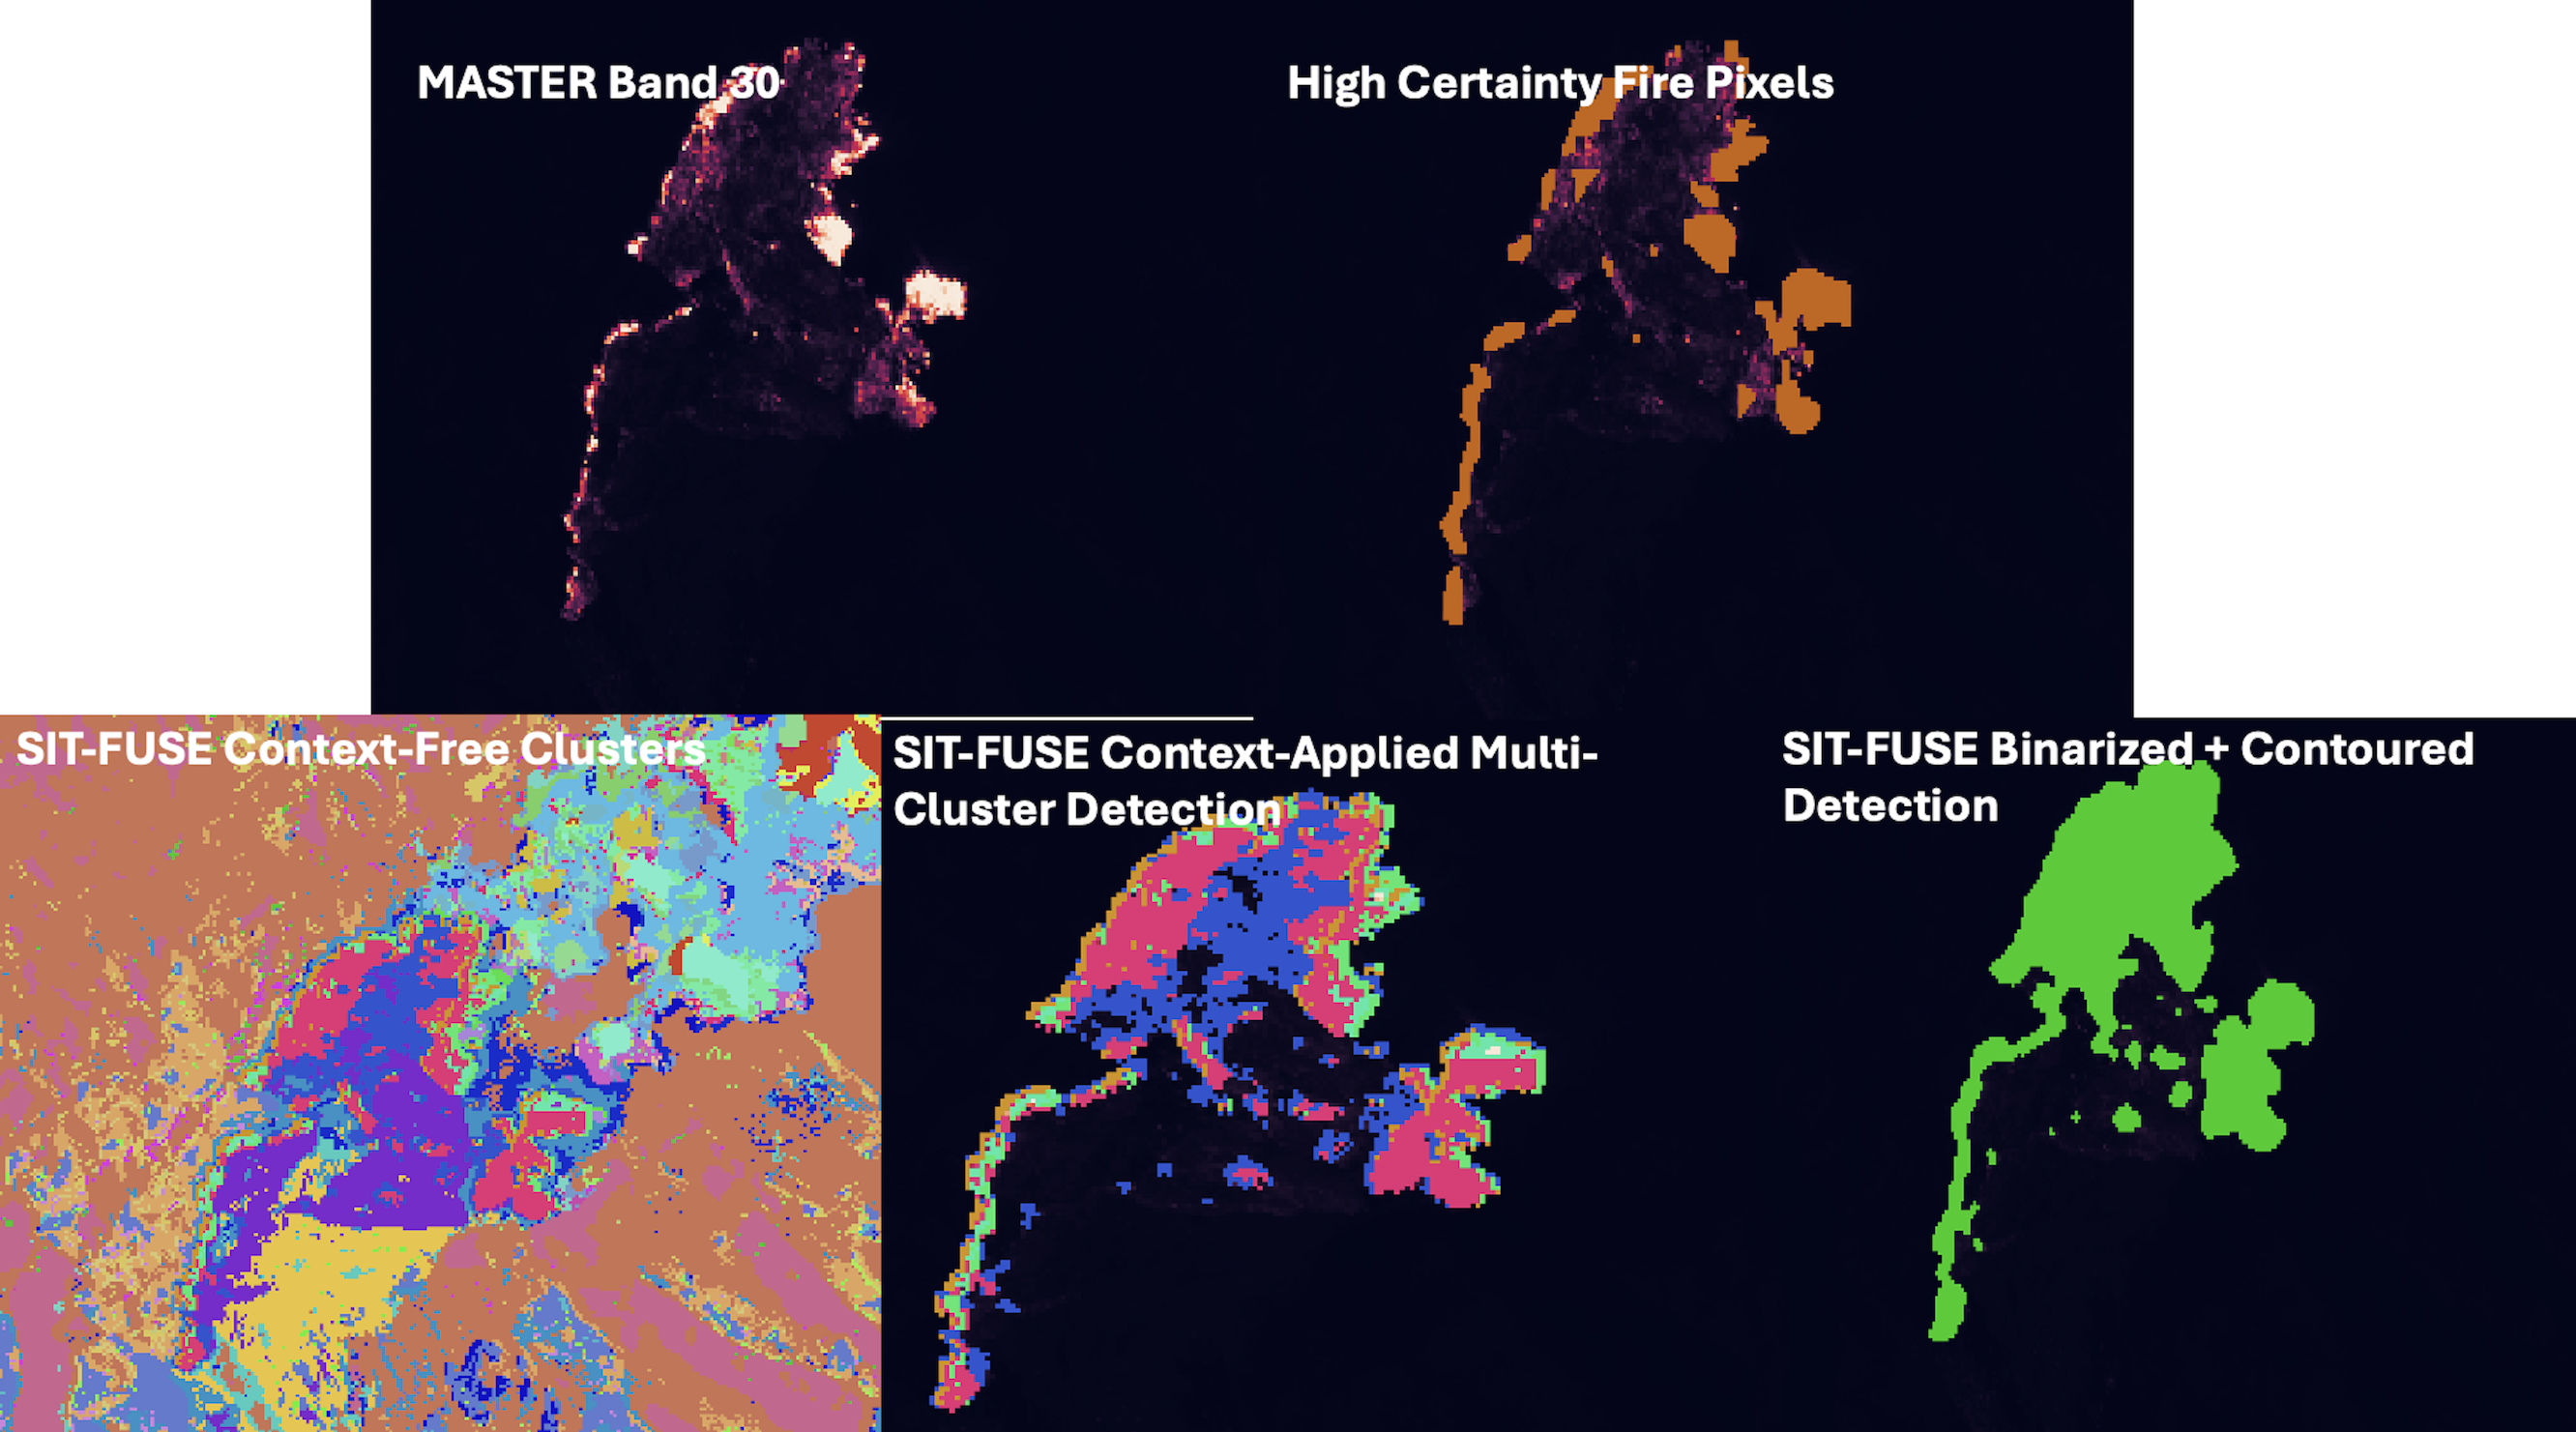
Table 3 summarizes the performance of our SIT-FUSE-based segmentation approach, compared against the hand-labeled high certainty wildfire front areas, for wildfire fronts across all scenes in the test set, for each instrument tested. Table 4 presents the same, but only for fires and geographic areas not seen during training. In all cases, our approach performs well. When visually compared, our approach tends to over-segment relative to the high-certainty fire pixels. However, the vast majority of the over-segmentation is over areas burning at lower heat, which are therefore less visibly associated with the fire front. This effect can be seen for the Williams Flats fire in Figure 9 and for the Sheridan Fire in Figure 10.
| Dataset | Total Pixel Count | SSIM |
|---|---|---|
| MASTER | 12438023 | 0.73 |
| eMAS | 162644645 | 0.87 |
| AVIRIS-C | 177233951 | 0.89 |
| GOES-17 | 1016785 | 0.82 |
| VIIRS | 4759386 | 0.88 |
| MODIS | 3262896 | 0.88 |
| Dataset | Total Pixel Count | SSIM |
|---|---|---|
| MASTER | 1708746 | 0.89 |
| eMAS | 133762591 | 0.88 |
| AVIRIS-C | 21073834 | 0.93 |
| GOES-17 | 2541975 | 0.84 |
| VIIRS | 1189846 | 0.88 |
| MODIS | 815724 | 0.88 |
2 \switchcolumn
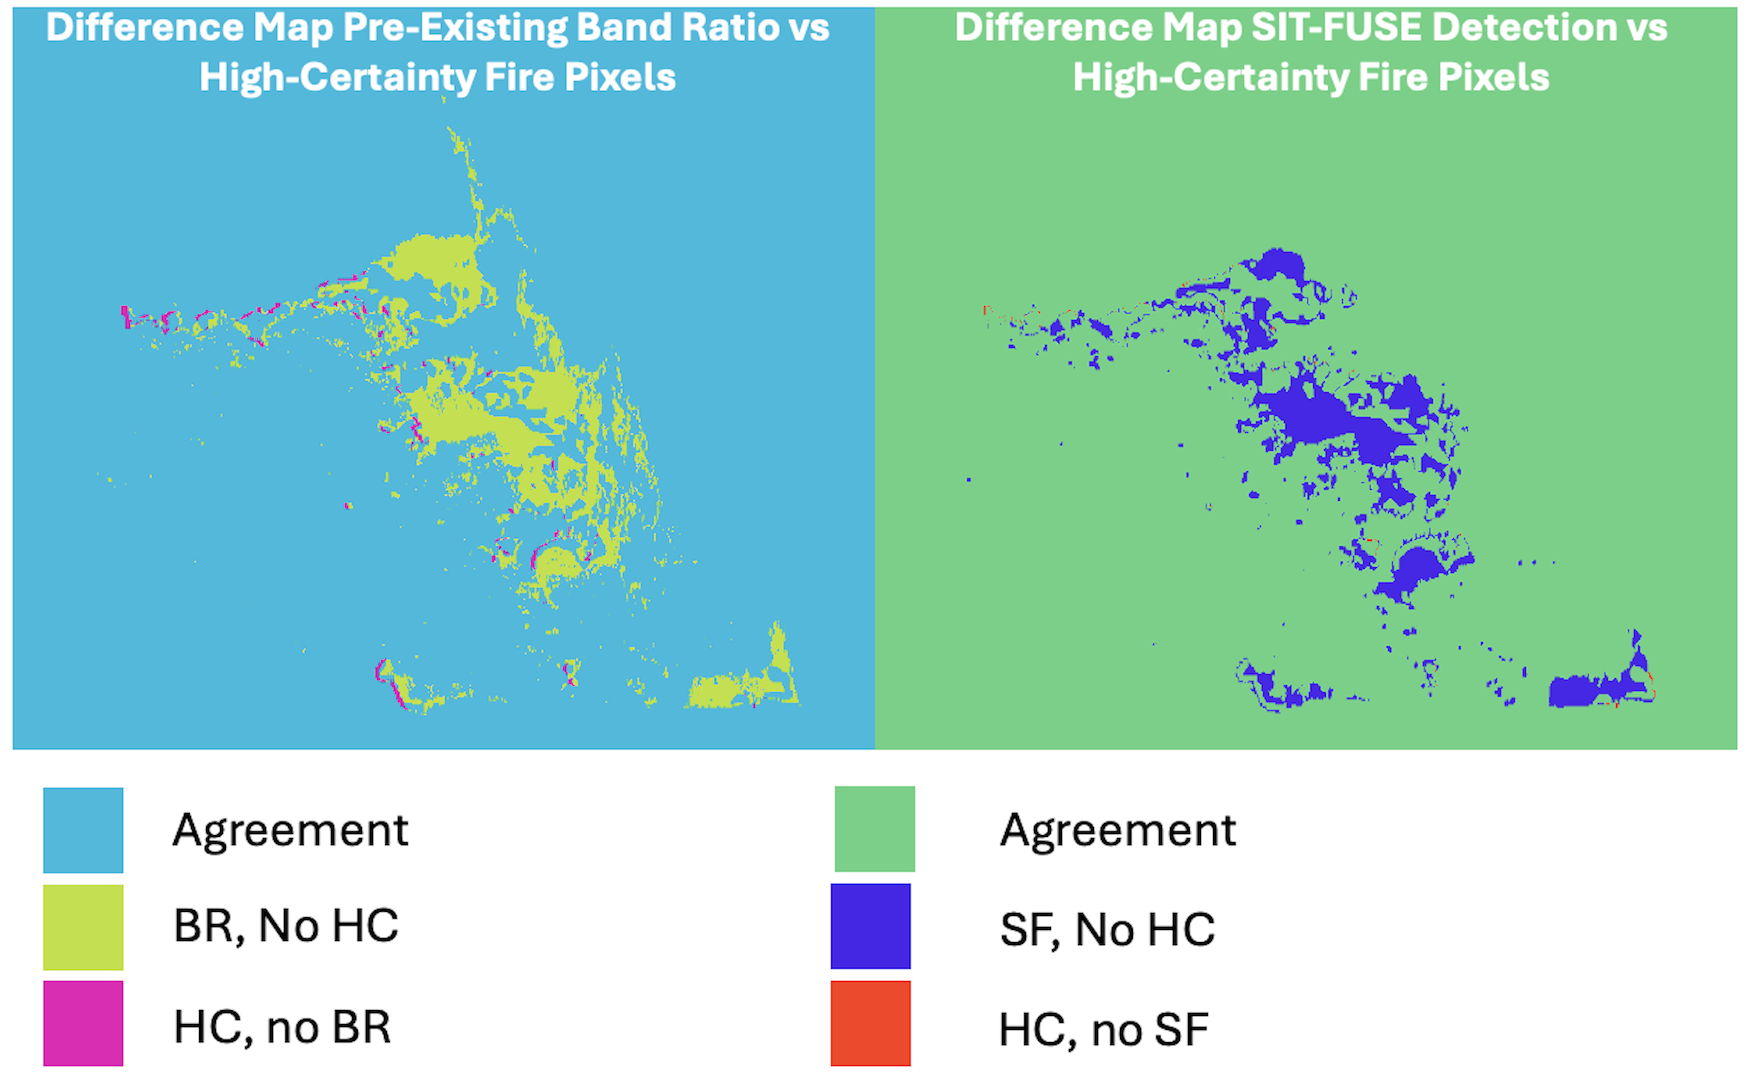
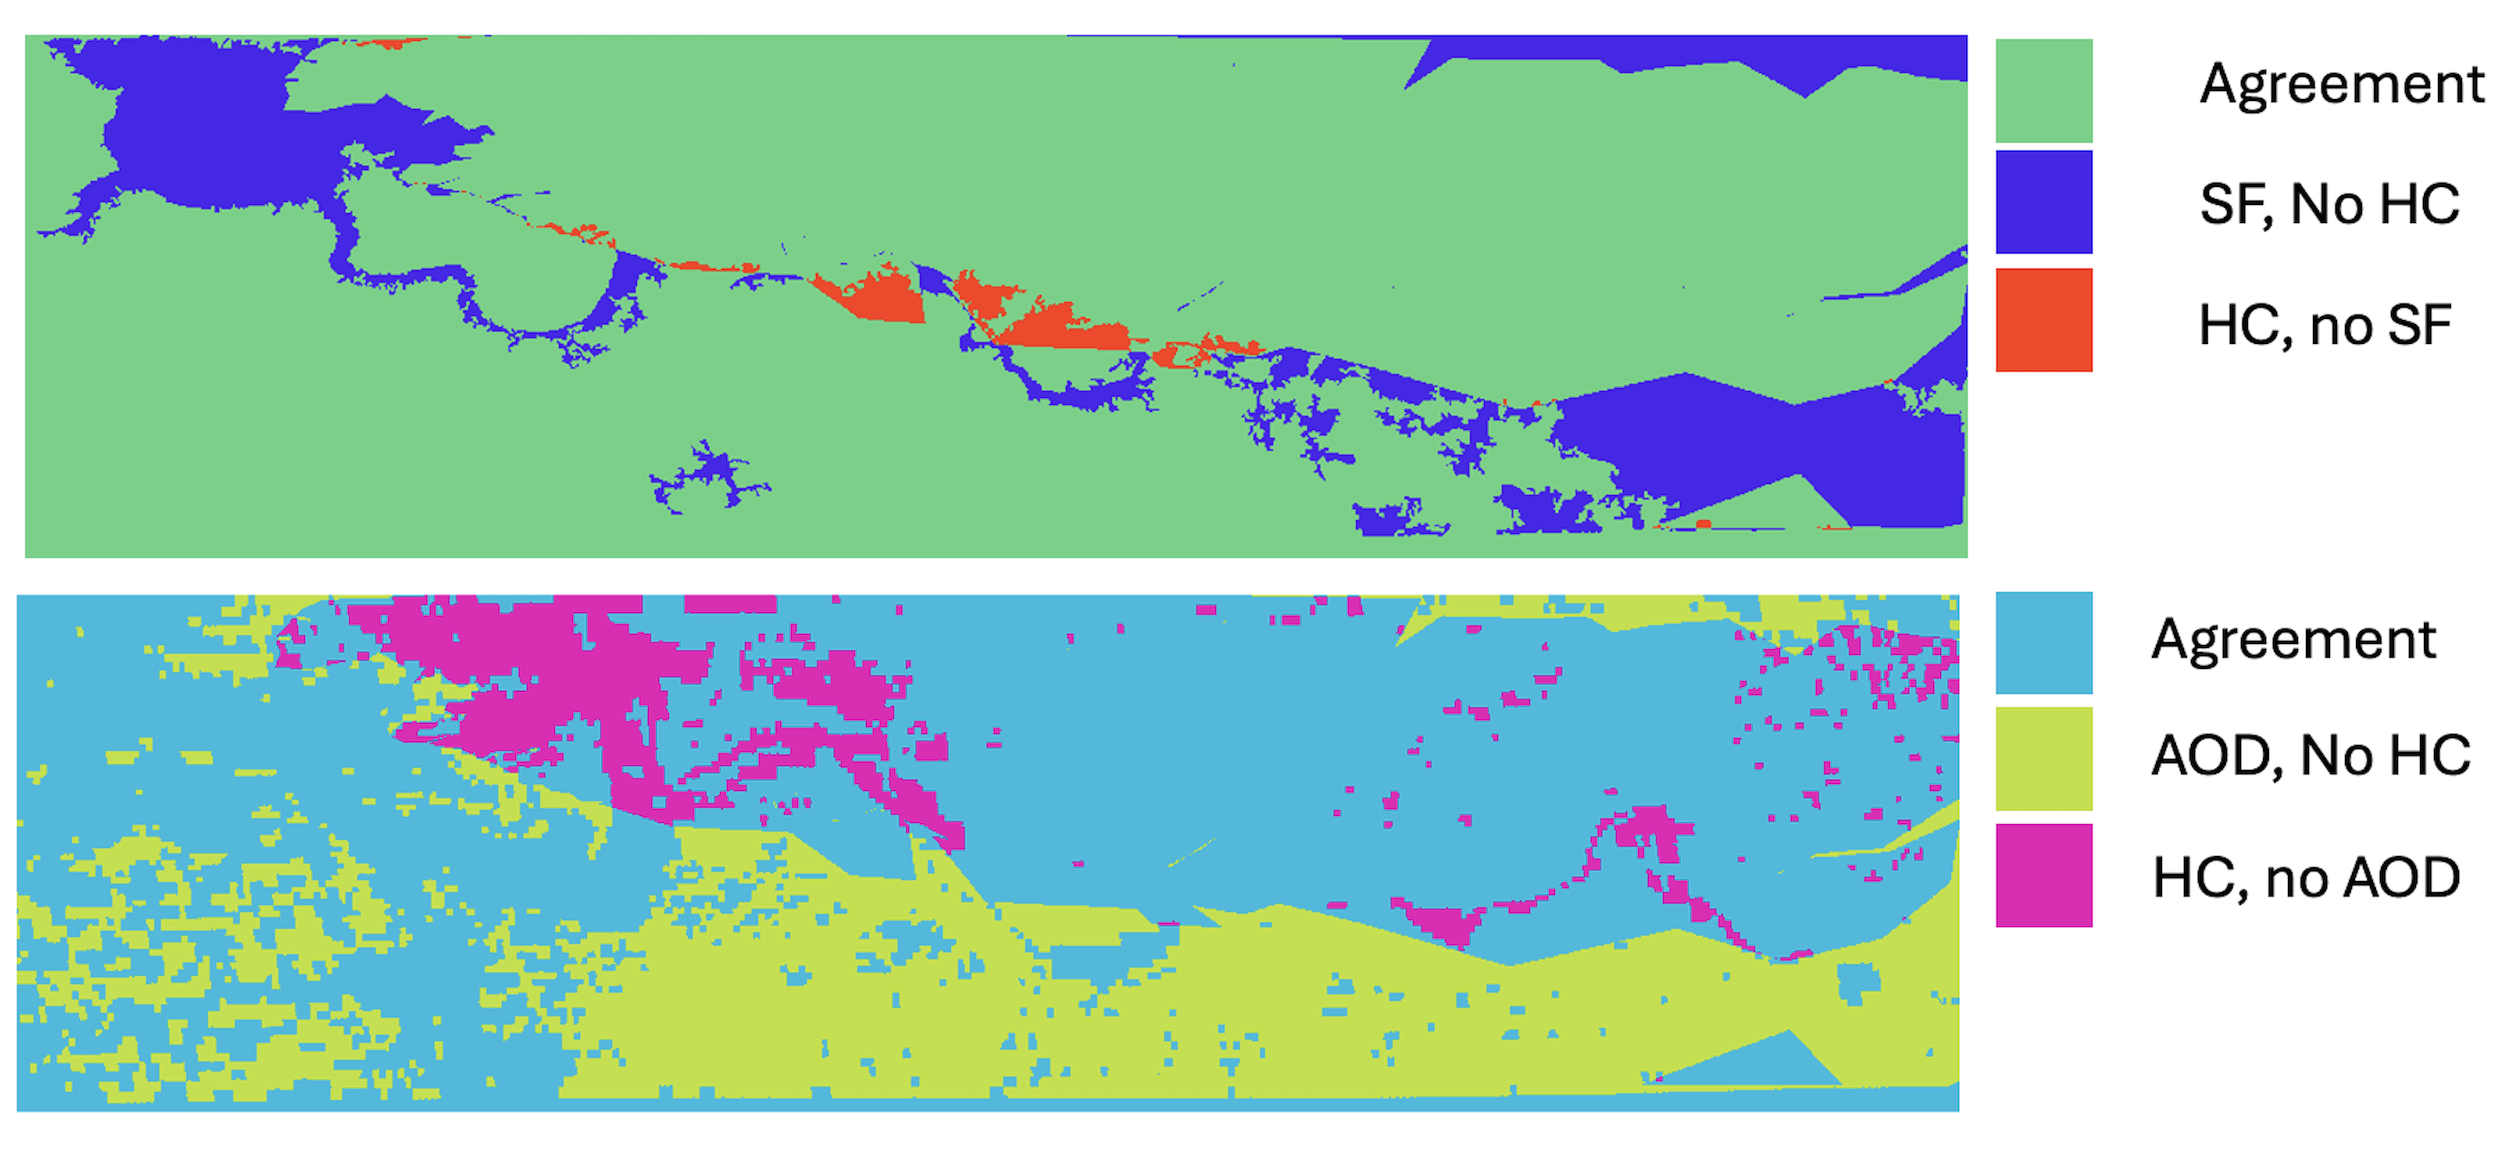
Table 5 summarizes the same type of comparisons, this time against SIT-FUSE-based detections, and results from an experimental instrument-specific band-ratio-based detection methodology are compared against the high-certainty fire pixel label set for MASTER. For this comparison, we used all scenes in the test set that also had an associated band-ratio-based detection to compare against. The segmentation quality is quite comparable, with both techniques getting the same SSIM score, however, the difference maps in Figure 11 show a test-set wide trend of hot smoke also being picked up as part of the fire front in the band-ratio-based detection.
| Dataset | Total Pixel Count | SSIM |
|---|---|---|
| MASTER SIT-FUSE | 20389114 | 0.8 |
| MASTER Pre-Existing | 20389114 | 0.8 |
| GOES SIT-FUSE | 1016785 | 0.82 |
| GOES Pre-Existing | 1016785 | 0.72 |
| VIIRS SIT-FUSE | 4759386 | 0.71 |
| VIIRS Pre-Existing | 4759386 | 0.59 |
4.2 Smoke Detection
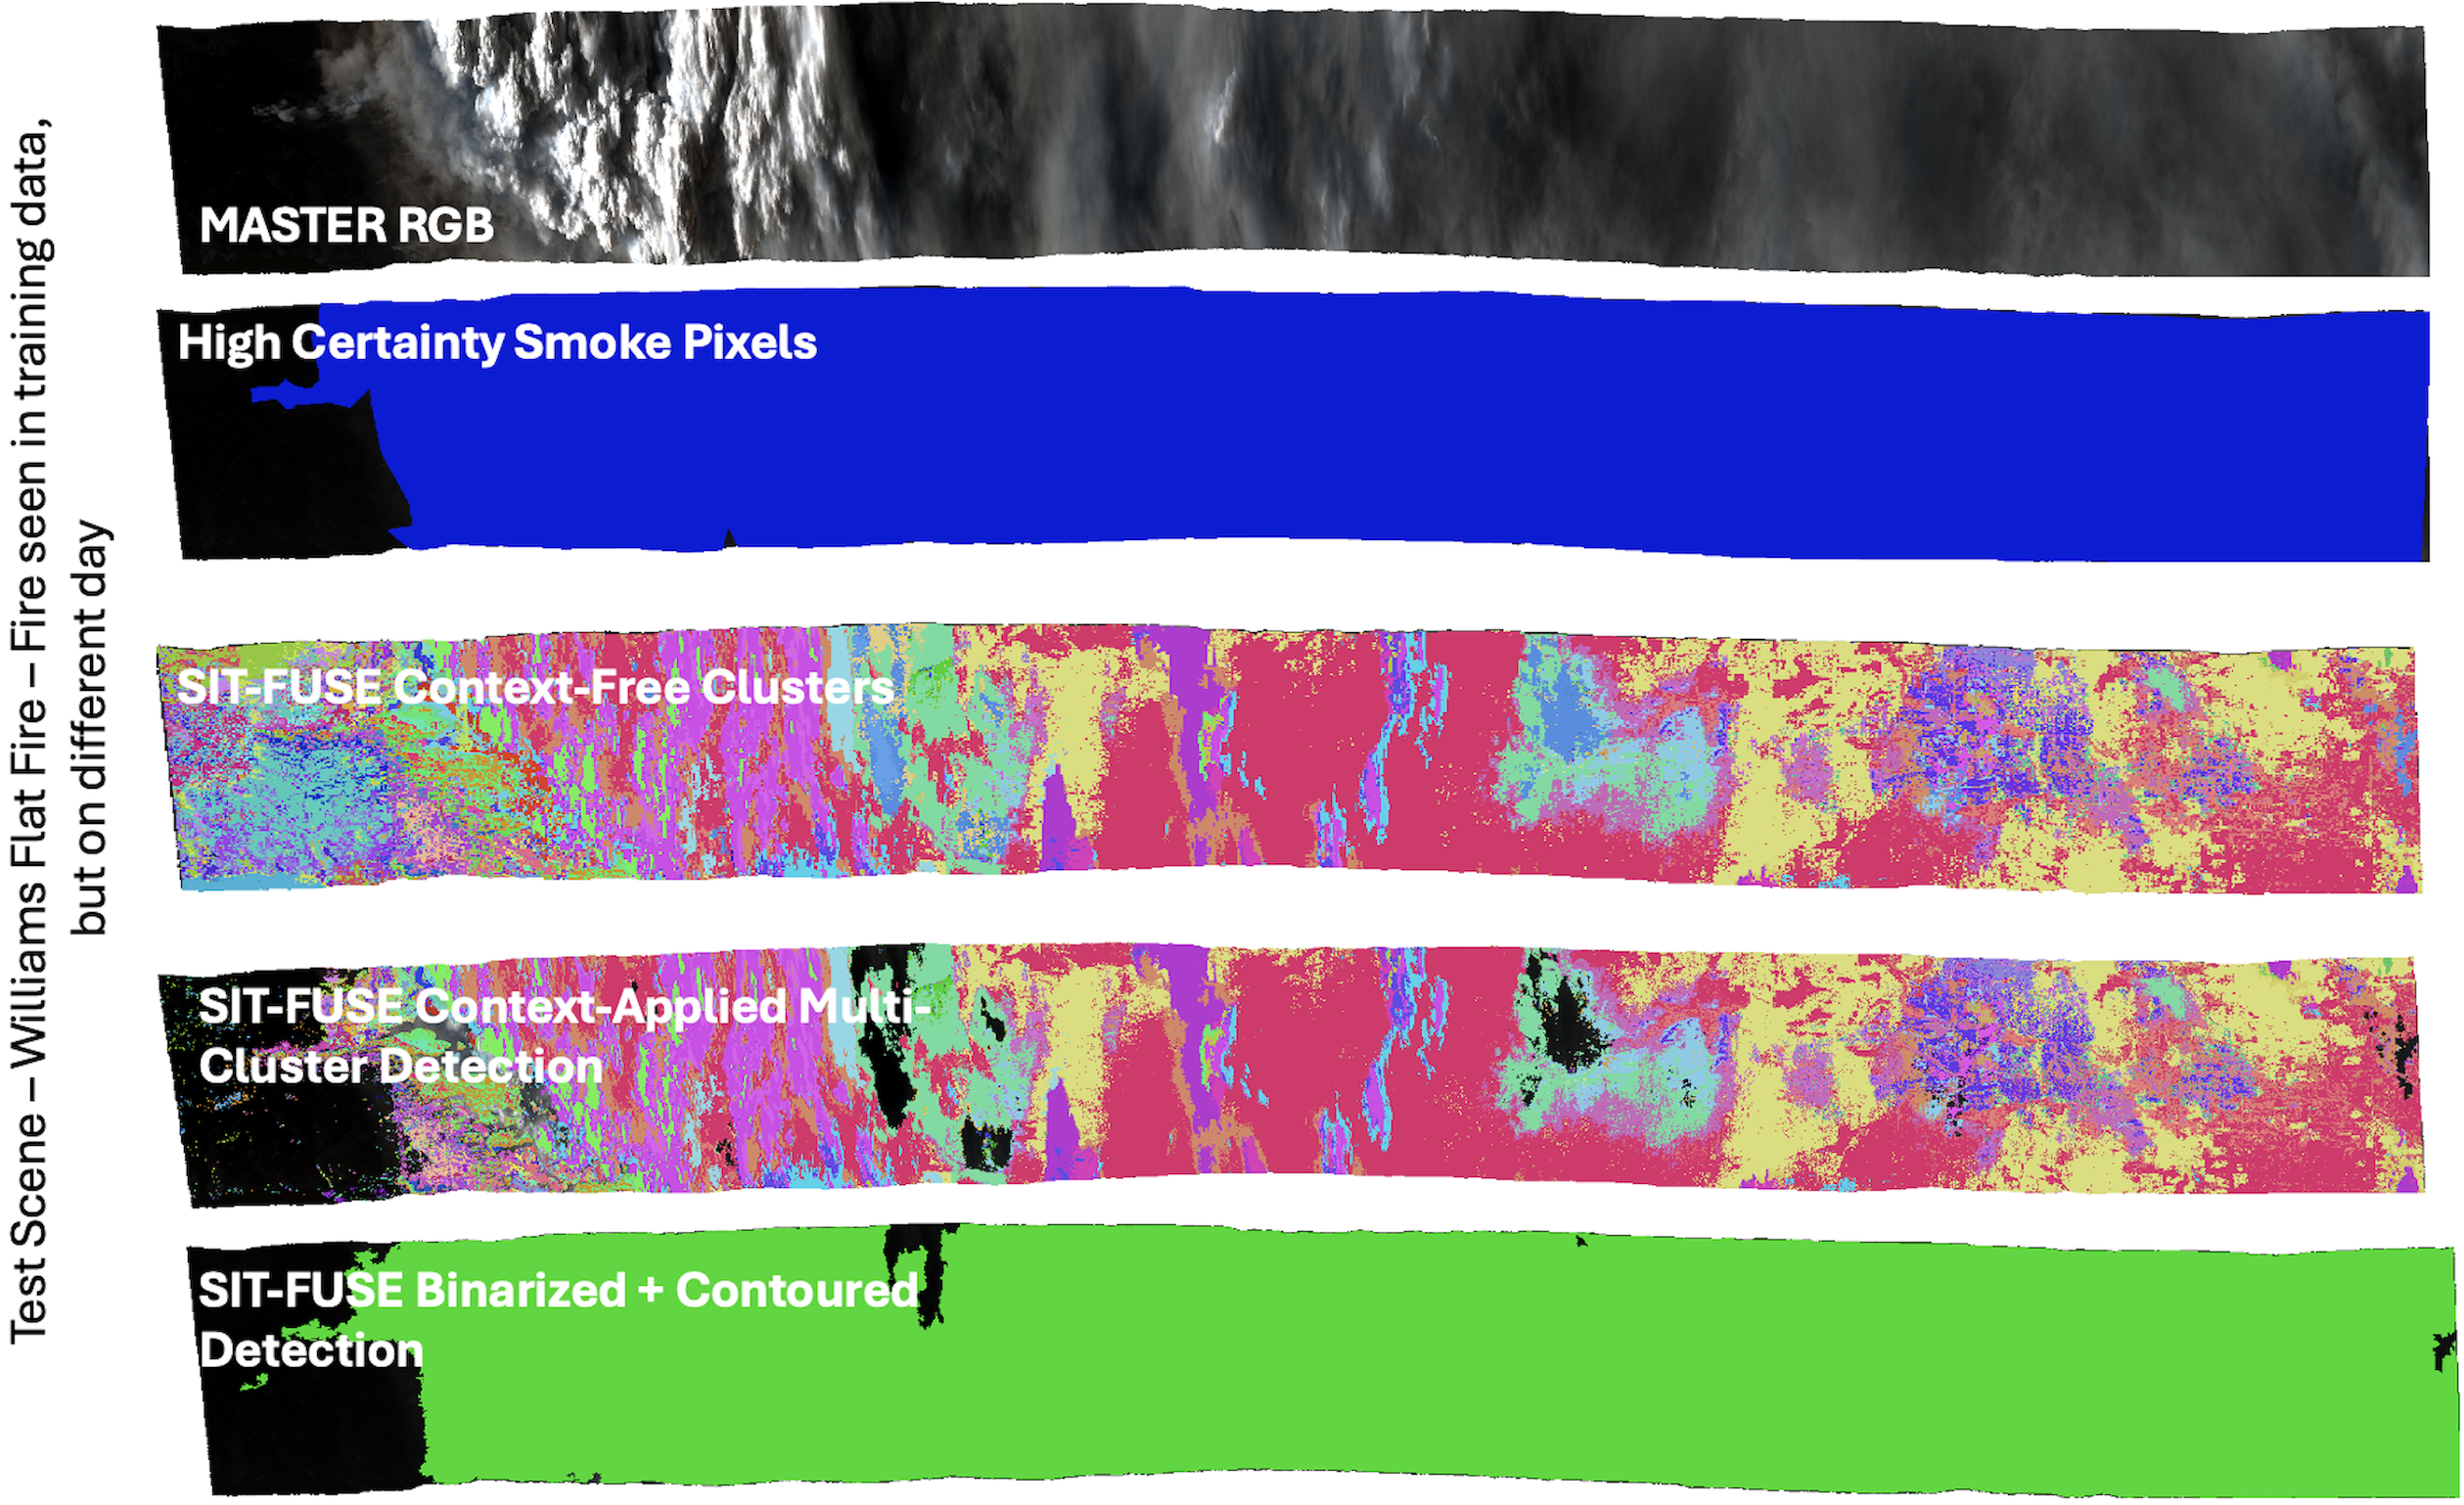
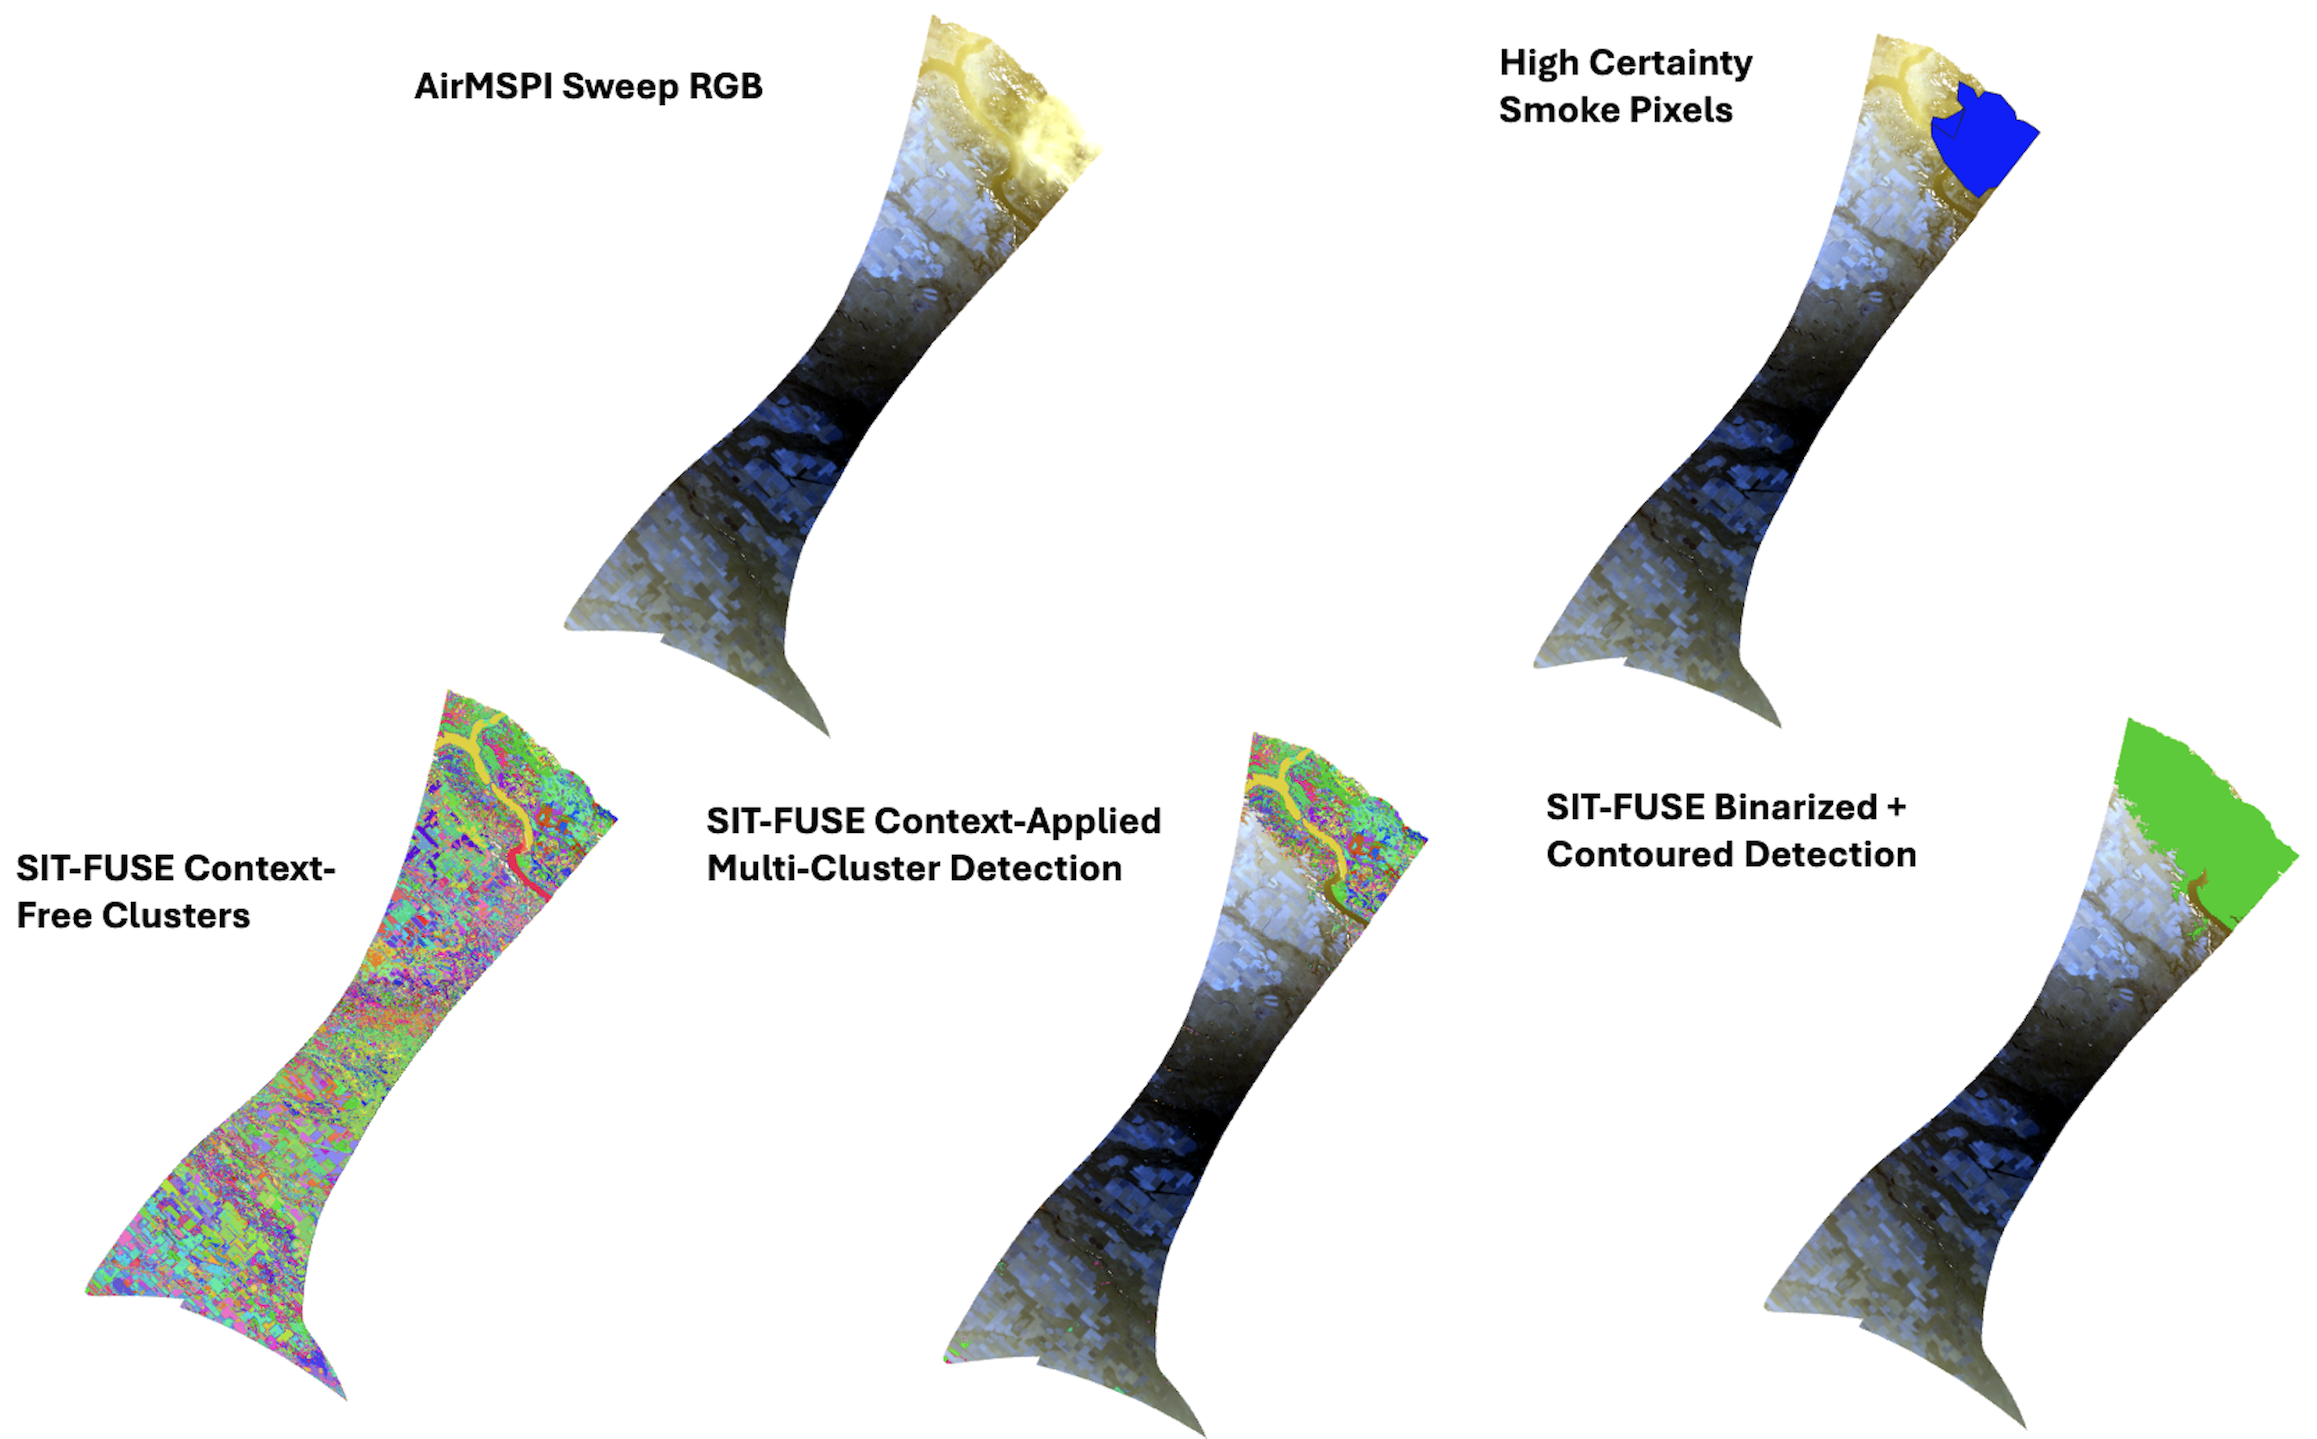
Table 6 summarizes the performance of our SIT-FUSE-based segmentation approach, compared against the hand-labeled high certainty smoke plume pixels, for plumes across all scenes in the test set, for each instrument tested. Table 7 presents the same specifically for smoke plumes in geographic areas not seen during training. In all cases, our approach performs well. When visually compared to the hand-labeled data, our approach tends to over-segment relative to the high-certainty smoke plume areas but performs well across the majority of the plume regions tested. The borders of the smoke plumes appear to provide uncertainty for both labelers and the SIT-FUSE-based automated detection. In some cases, these areas were not fully covered by our detections, whereas in other cases, the detections identified smoky areas in the scene that were not covered by the labels. Shadows also appear to confuse small numbers of cases. Figure 12 provides an example detection produced for a MASTER scene capturing the Williams Flats Fire, while Figure 13 shows the same example for an AirMSPI scene capturing the same fire.
| Dataset | Total Pixel Count | SSIM |
|---|---|---|
| MASTER | 12438023 | 0.71 |
| eMAS | 162644645 | 0.63 |
| AVIRIS-C | 173334623 | 0.67 |
| AirMSPI Sweep | 132238386 | 0.63 |
| PlanetScope Dove | 1353594326 | 0.68 |
| GOES-17 | 1016785 | 0.62 |
| VIIRS | 4759386 | 0.66 |
| Dataset | Total Pixel Count | SSIM |
|---|---|---|
| MASTER | 1708746 | 0.75 |
| eMAS | 133762591 | 0.66 |
| AVIRIS-C | 21073834 | 0.77 |
| AirMSPI Sweep | 63505132 | 0.65 |
| PlanetScope Dove | N/A | N/A |
| GOES-17 | 2541975 | 0.65 |
| VIIRS | 1189846 | 0.68 |
Table 8 summarizes the same set of comparisons, this time evaluating SIT-FUSE-based detections against results from operational dark-target-based detection methodologies. Both approaches are compared against the high-certainty fire pixel label set for eMAS, GOES, and VIIRS. For these comparisons, we used the aerosol optical depth value from the dark target product of each of the instruments and applied a minimum threshold value of 0.2.
| Dataset | Total Pixel Count | SSIM |
|---|---|---|
| eMAS SIT-FUSE | 162644645 | 0.63 |
| eMAS Pre-Existing | 162644645 | 0.37 |
| GOES SIT-FUSE | 1016785 | 0.73 |
| GOES Pre-Existing | 1016785 | 0.56 |
| VIIRS SIT-FUSE | 4759386 | 0.66 |
| VIIRS Pre-Existing | 4759386 | 0.54 |
2 \switchcolumn
4.3 Multi-Sensor Fusion
In previous work, we have demonstrated the utility of fusing multi-angle data from MISR with that of MODIS, both instruments onboard the same satellite platform, Terra. This included segmenting the William’s Flats fire and Smoke plume in our evaluation. Figure 15 depicts segmentation, as well as fire and smoke segmentation over the Williams Flats fire, using MISR and MODIS data as input. However, combining MISR and MODIS data is limited by the restricted number of overpasses for a single platform and the narrower area of swath intersection, which reduces the number of cases available for evaluation compared to those in the single-instrument analyses described earlier. For polar-orbiting instruments, multiple platforms often provide an increased number of scenes for detection and evaluation. As we expand the spatiotemporal areas studied, we will add these fusion cases and quantify their benefits in a manner consistent with the previous evaluations.
2 \switchcolumn
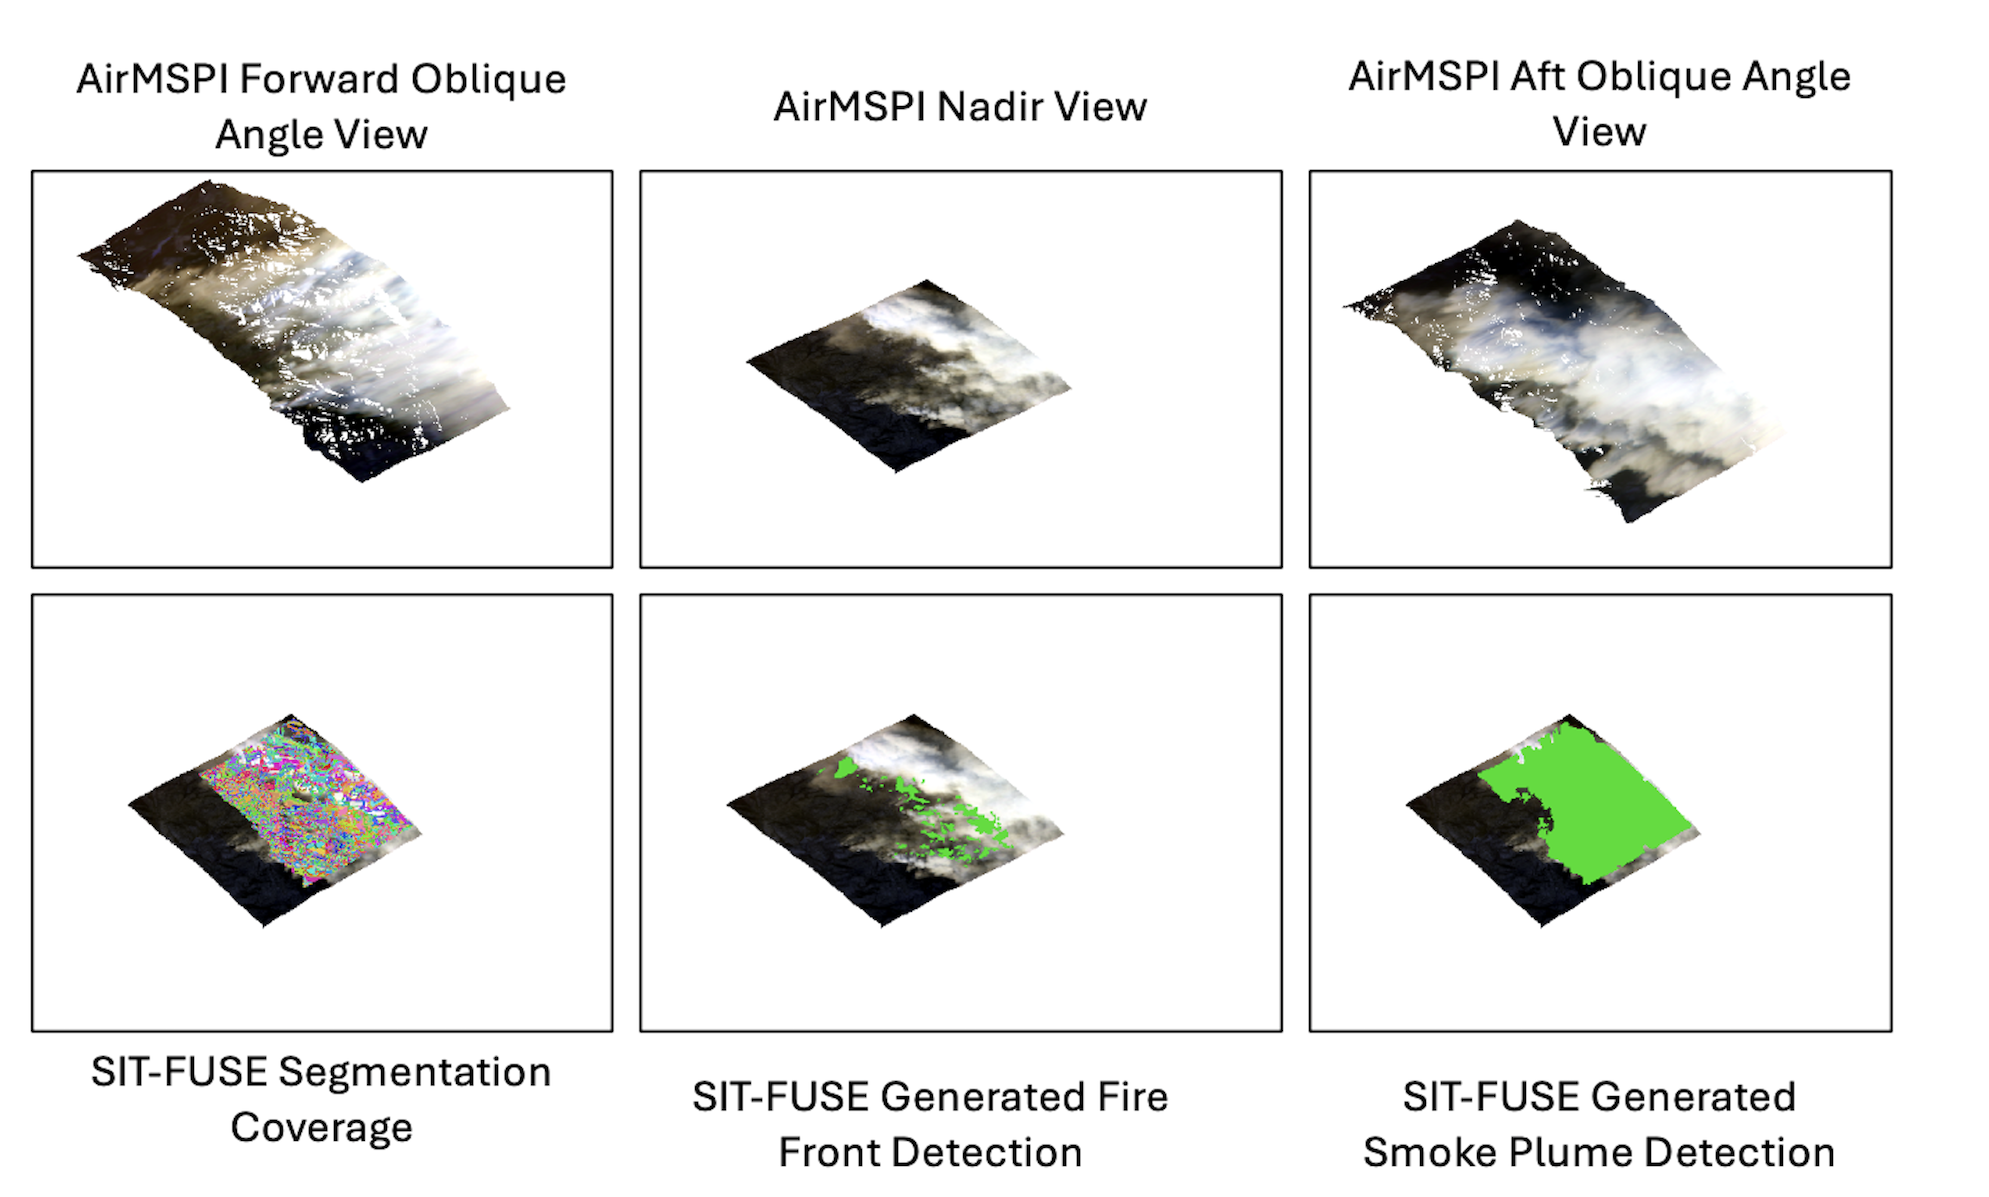
Given our previous success with the fusion of polar-orbiting instrument data, we explored fusing airborne instrumentation data, both within the same platform and across platforms. For the instruments on the same platform, we examined AirMSPI and eMAS, both onboard the ER-2 aircraft, as an airborne equivalent of MISR and MODIS. As a first step, we tested AirMSPI’s multi-angle data taken in step-and-stare mode collectively as a simple fusion test case. Unfortunately, the coverage of the data is very small and the number of scenes is relatively low. While there is spatial overlap between data captured at different viewing angles, data quality issues restrict its utility. There are areas marked as "bad/occluded data" that increased in frequency with more oblique angles. We tried to mitigate this by limiting the number of angles used, but it did not significantly improve, even after excluding data from four angles. Although we were able to generate smoke and fire detection examples, the number of scenes and pixels was insufficient for both model training and separate evaluation. Figure 16 depicts an example scene from AirMSPI data, including the two most oblique angles and the nadir angle, as well as the minimal segmentation coverage we can get for SIT-FUSE when combining the multi-angle data, and the associated fire and smoke masks.
For the AirMSPI + eMAS case, we also attempted to combine the sweep mode data with eMAS data. However, the overlap between the datasets was minimal. Future campaigns may take into account the need to fuse data in this manner and attempt to collect a greater number of spatiotemporally collocated scenes with multiple instruments. Again, as we expand our case studies and datasets over larger areas and campaigns, we are confident that we can quantitatively assess the benefits of data fusion between AirMSPI and eMAS for wildfire and smoke detection.
2 \switchcolumn
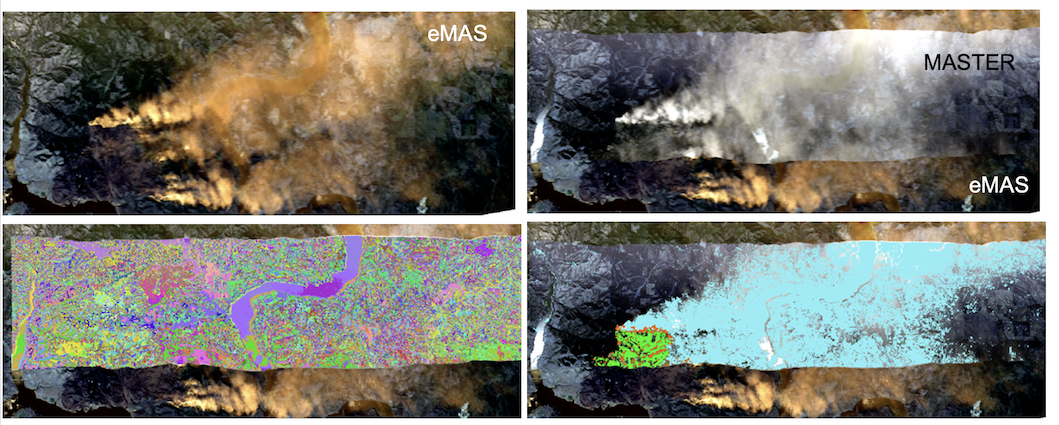
For the case of cross-platform fusion, we looked at fusing eMAS and MASTER. Again the number of scenes is limited, and only over the Williams Flats fire area, but the initial examples demonstrate potential for this capability, and again future campaign planning and use of additional pre-existing campaign datasets will allow us to further validate these fusion cases. Figure 17 depicts an example of one of the fusion scenes.
2 \switchcolumn
4.4 Commercial Remote Sensing Products
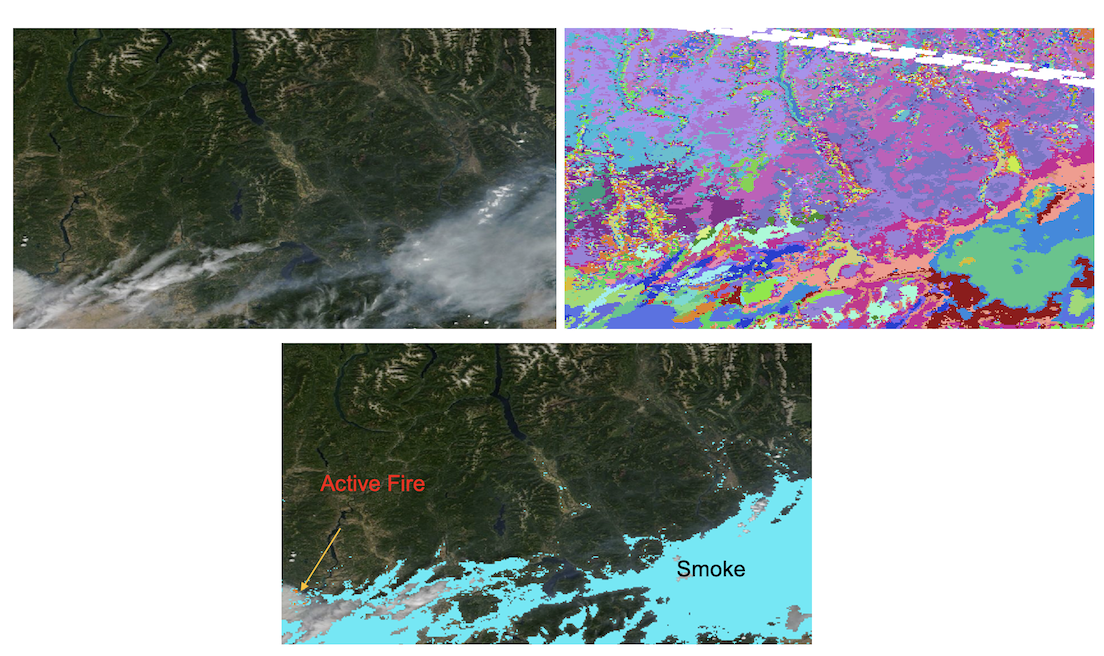
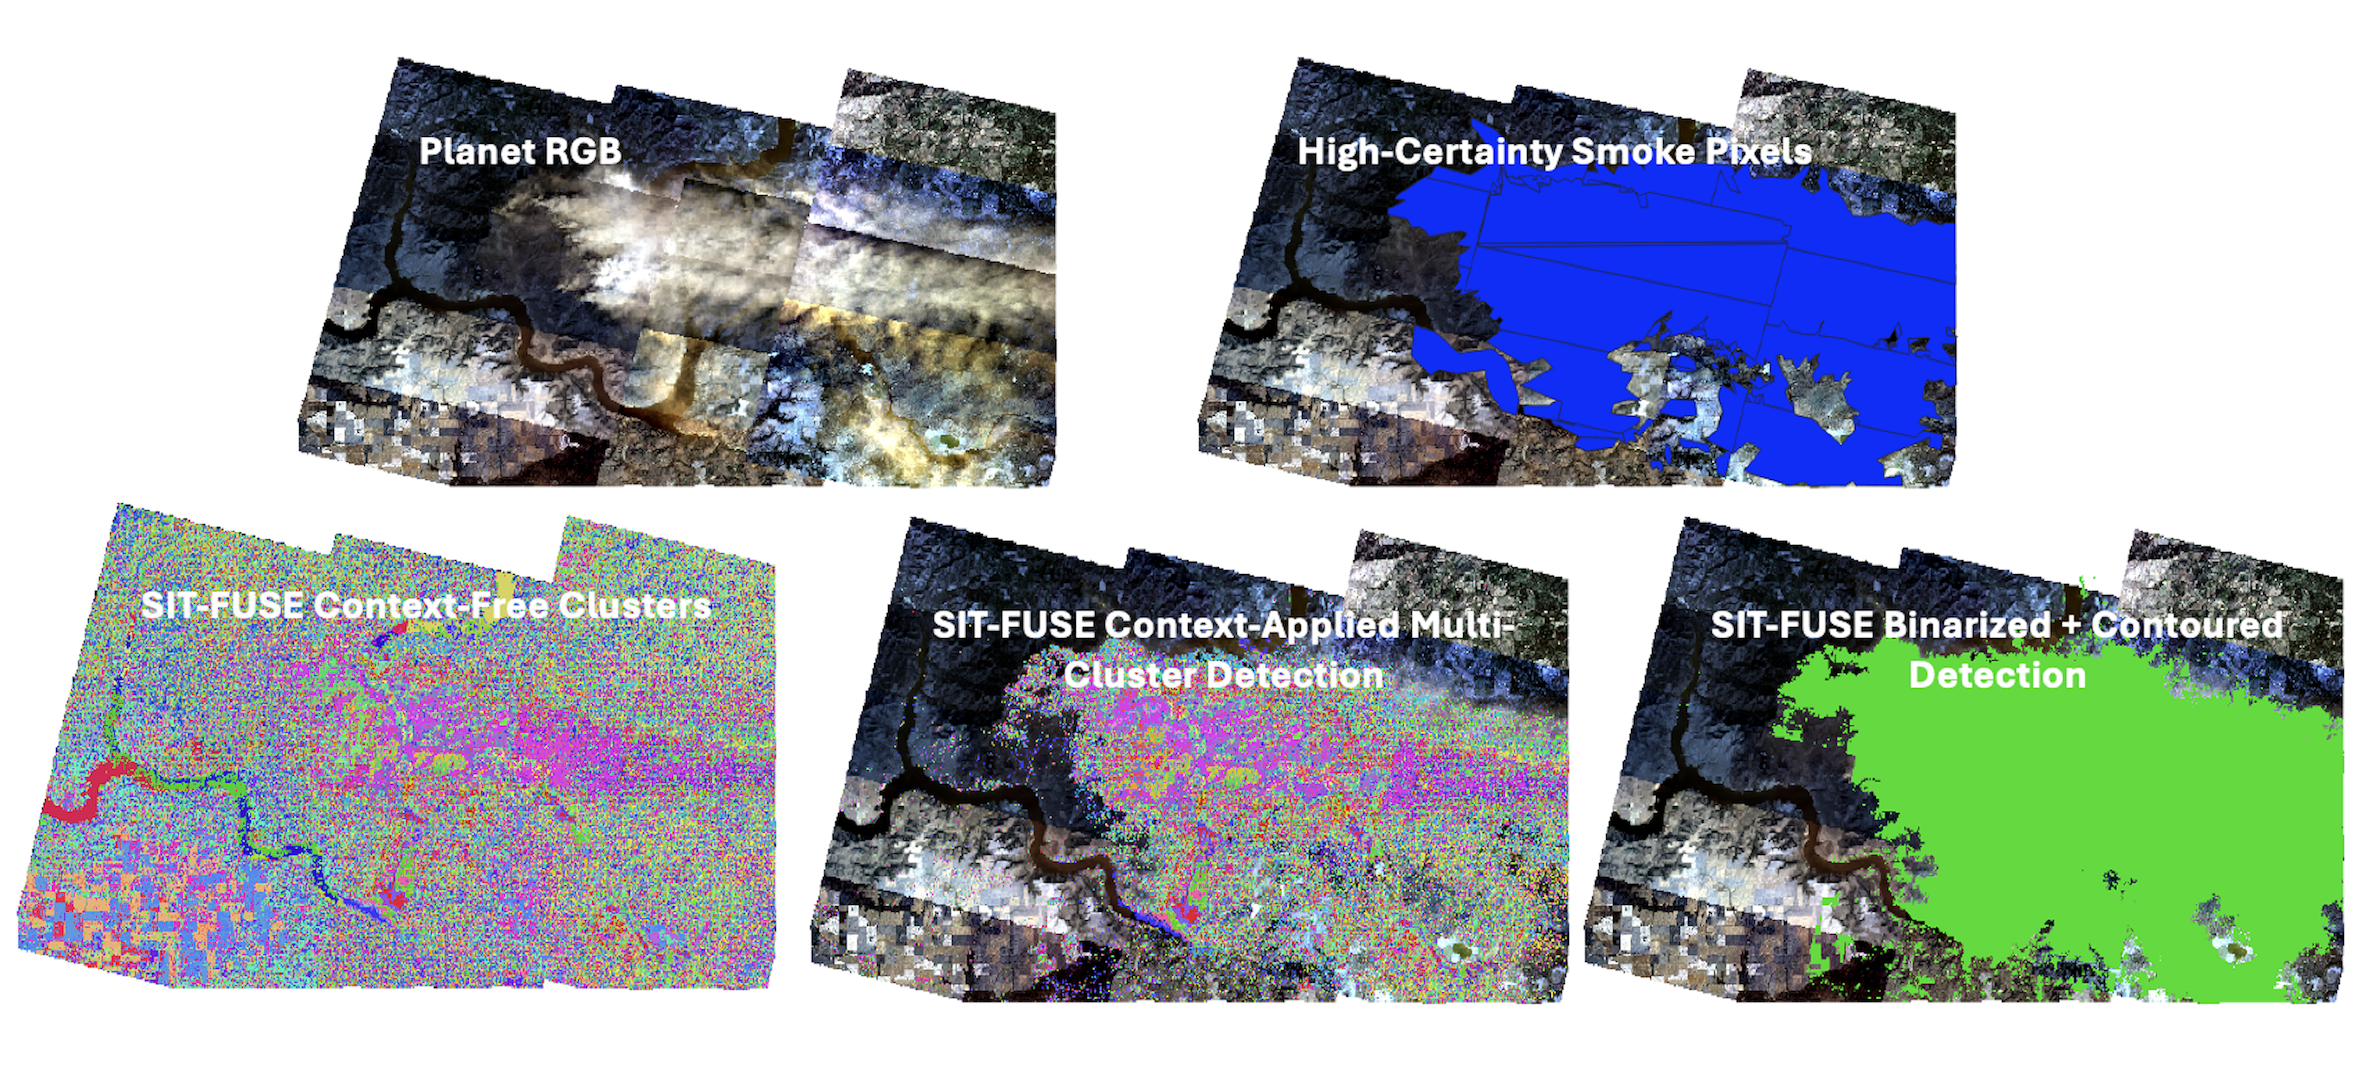
As a part of this effort, we evaluated the utility of PlanetScope data for wildfire and smoke detection and monitoring. We found that the older PlanetScope SuperDove imagers available during the FIREX-AQ 2019 campaign were not suited for identifying fire fronts across the entire test set. However, they were effective at detecting smoke within the scenes evaluated. Figure 18 depicts smoke detection within a mosaic of SuperDove scenes over the Williams Flats fire on August 08, 2019, and Table 6 contains quantitative evaluation results. The improved temporal resolution of smoke detections at high spatial resolution will be helpful both for air quality research and automated smoke tracking. Also, as Planet’s instrument offerings continue to diversify, with new SuperDove instruments having a higher spectral resolution, hyperspectral instrumentation being launched, and other companies continuing to launch various other Earth-orbiting instrumentation, it is critical that we look at the tradeoffs between paying for data from commercial entities and the scientific value added by such data. In this study, we analyzed 83 additional scenes over the Williams Flats area over four days. Per the NASA / Planet CSDSA agreement, we are not able to release the input SuperDove data, alongside all of the other data we are releasing. However, we will release the generated output and all other associated data.
2 \switchcolumn
2 \switchcolumn
5 Discussion and Current/Future Work
Overall, SIT-FUSE effectively identifies and segments wildland fire fronts and smoke plumes, and performs better against high-certainty smoke and fire label sets, when compared against other operational and experimental approaches, as seen in Tables 5 and 8. As expected, the higher the resolution of the instrument, the more detailed segmentation can occur. However, the different resolutions are valuable not only as standalone datasets but also for tracking these objects across multiple datasets. While further large-scale validation is needed, our tests demonstrate the capability to increase the temporal resolution of firefront products. We do this by increasing the number of instruments available for fire and smoke segmentation and developing brand-new firefront and smoke plume products for many of the instruments tested. This indicates significant potential for both product generation and utilization of this technique for segmentation and instance tracking. This not only also allows for dynamic instance tracking across scenes with the same input set, but we believe by harnessing style transfer capabilities, we can also look into instance tracking across multi-sensor scenes from disparate input datasets. We hope to transition this technology into a piece of future operational campaign support or product generation systems.
In terms of feature interpretability and selection, methods such as SHAP analysis and other explainability methods can be applied to better understand feature importance and refine the input to focus on spectral bands most effective for identifying smoke and/or fire. Given the current performance and the success with datasets where there was no pre-existing operational fire or smoke detection methodology, solutions like SIT-FUSE can be integrated into new or existing instrumentation data processing pipelines. By doing so, this approach could replace or augment instrument-specific retrieval algorithms, which may be extremely costly to develop. SIT-FUSE’s segmentation capabilities offer additional benefits: the decrease in data volume processed for downstream fire or smoke-specific retrievals. By isolating the detected objects, only relevant pixels need to be processed through a downstream retrieval, thereby optimizing the pipeline.
We have built a framework within SIT-FUSE that is adaptable to various kinds of encoders and we aim to be able to leverage this to analyze representative capabilities of different model types, complexities, and training paradigms. With the continued influx of new architectures and large Earth Observation Foundation Models, it is important to understand these models provide quality representations (or poor ones) under different conditions, problem sets, and input datasets Marsocci et al. (2024). Analyses of downstream task performance is a crucial piece, but not the entire solution. More robust ways to evaluate representative capabilities are emerging in around large language models (LLMs), and much of this can be ported to computer vision, and specifically deep learning for Earth Observations Duderstadt et al. (2023). With the flexible framework of SIT-FUSE we are working towards providing initial pathways towards tackling some of these open problems.
Lastly, we are working to leverage SIT-FUSE to make an impact within the area of analysis and scientific understanding - in this case correlated to wildfires and smoke plumes. There a built-in co-discovery facilitation mechanism, by way of the heirarchichal context-free segmentation products. By using the model-derived separations of various areas, novelty and "interesting" samples can more easily be grouped and investigated. This can be even further coupled with more detailed analyses of the embedding spaces relative to the context-free segmentations LaHaye et al. (2024). To enhance exploration even further models trained for co-exploration of data using open-ended algorithms can be leveraged to more quickly sift through the volumes of data and highlight interesting, new, and anomoulous samples Zhang et al. (2023); Lu et al. (2024).
Conceptualization, Nicholas LaHaye, Kyongsik Yun, Michael Garay, and Erik Linstead; Data curation, Nicholas LaHaye, Anastasija Easley, Huikyo Lee, Michael Garay and Olga Kalashnikova; Formal analysis, Nicholas LaHaye and Anastasija Easley; Funding acquisition, Nicholas LaHaye, Kyongsik Yun, Huikyo Lee, Michael Garay, and Olga Kalashnikova; Investigation, Nicholas LaHaye, Kyongsik Yun, Michael Garay, Olga Kalashnikova and Erik Linstead; Methodology, Nicholas LaHaye, Kyongsik Yun, Huikyo Lee, and Erik Linstead; Project administration, Nicholas LaHaye, Software, Nicholas LaHaye, Kyongsik Yun, Huikyo Lee, and Erik Linstead; Supervision, Nicholas LaHaye, Michael Garay, Olga Kalashnikova and Erik Linstead; Validation, Nicholas LaHaye, Kyongsik Yun, Huikyo Lee, Michael Garay, Olga Kalashnikova and Erik Linstead; Visualization, Nicholas LaHaye, Kyongsik Yun, Huikyo Lee, and Erik Linstead; Writing – original draft, Nicholas LaHaye; Writing – review & editing, Nicholas LaHaye, Kyongsik Yun, Huikyo Lee, Michael Garay, Olga Kalashnikova and Erik Linstead.
This research was funded by the NASA ROSES Commercial Smallsat Data Scientific Analysis program (NNH22ZDA001N-CSDSA) as well as the Jet Propulsion Laboratory’s Data Science Working Group. Computing resources were leveraged at both the NASA Center for Climate Simulation (NCCS) and the Machine Learning and Affiliated Technologies (MLAT) Lab in the Fowler School of Engineering at Chapman University.
The data has been published and is freely available on Zenodo LaHaye et al. (2025). The model weights and associated configuration files are also publicly available on HuggingFace Nick LaHaye (2025). Lastly, the code has been tagged at the time of this paper submission and is publicly availabel on GitHub LaHaye et al. (2025). The Planet radiance data cannot be released publicly due to the terms of the NASA Commercial Smallsat Data Acquisition agreement, but all products generated and models trained have been shared, and all other input data is freely available in the afforementioned Zenodo data store.
Acknowledgements.
The authors would like to thank NASA, JPL, NCCS, MLAT Lab., The Spatial Informatics Group, LLC., and the Schmid College of Science and Technology, Chapman University, for supporting this research. The authors would also like to thank Phil Dennison, from the Geography Department, at the University of Utah, as well as NASA for providing the data, without which this research would not have been possible. Finally, the authors would like to thank the anonymous reviewers for taking the time to read this paper and provide valuable feedback. \conflictsofinterestThe funders had no role in the design of the study; in the collection, analyses, or interpretation of data; in the writing of the manuscript, or in the decision to publish the results. \reftitleReferencesReferences
- LaHaye et al. (2019) LaHaye, N.; Ott, J.; Garay, M.J.; El-Askary, H.M.; Linstead, E. Multi-Modal Object Tracking and Image Fusion With Unsupervised Deep Learning. IEEE Journal of Selected Topics in Applied Earth Observations and Remote Sensing 2019, 12, 3056–3066. doi:\changeurlcolorblack10.1109/JSTARS.2019.2920234.
- LaHaye et al. (2021) LaHaye, N.; Garay, M.J.; Bue, B.D.; El-Askary, H.; Linstead, E. A Quantitative Validation of Multi-Modal Image Fusion and Segmentation for Object Detection and Tracking. Remote Sensing 2021, 13. doi:\changeurlcolorblack10.3390/rs13122364.
- LaHaye et al. (2024) LaHaye, N.; Lee, H.; Easley, A.; Garay, M.J.; Yun, K.; Goodman, A.; Kalashnikova, O.V. A Comparison of Model Complexity, Representative Capabilities, and Performance for Self-Supervised Multi-Sensor Wildifre and SMoke Segmentation and Tracking. Proceedings AGU Fall Meeting 2024. American Geophysical Union, 2024.
- Warneke et al. (2023) Warneke, C.; Schwarz, J.P.; Dibb, J.; Kalashnikova, O.; Frost, G.; Al-Saad, J.; Brown, S.S.; Brewer, W.A.; Soja, A.; Seidel, F.C.; Washenfelder, R.A.; Wiggins, E.B.; Moore, R.H.; Anderson, B.E.; Jordan, C.; Yacovitch, T.I.; Herndon, S.C.; Liu, S.; Kuwayama, T.; Jaffe, D.; Johnston, N.; Selimovic, V.; Yokelson, R.; Giles, D.M.; Holben, B.N.; Goloub, P.; Popovici, I.; Trainer, M.; Kumar, A.; Pierce, R.B.; Fahey, D.; Roberts, J.; Gargulinski, E.M.; Peterson, D.A.; Ye, X.; Thapa, L.H.; Saide, P.E.; Fite, C.H.; Holmes, C.D.; Wang, S.; Coggon, M.M.; Decker, Z.C.J.; Stockwell, C.E.; Xu, L.; Gkatzelis, G.; Aikin, K.; Lefer, B.; Kaspari, J.; Griffin, D.; Zeng, L.; Weber, R.; Hastings, M.; Chai, J.; Wolfe, G.M.; Hanisco, T.F.; Liao, J.; Campuzano Jost, P.; Guo, H.; Jimenez, J.L.; Crawford, J.; Team, T.F.A.S. Fire Influence on Regional to Global Environments and Air Quality (FIREX-AQ). Journal of Geophysical Research: Atmospheres 2023, 128, e2022JD037758, [https://agupubs.onlinelibrary.wiley.com/doi/pdf/10.1029/2022JD037758]. e2022JD037758 2022JD037758, doi:\changeurlcolorblackhttps://doi.org/10.1029/2022JD037758.
- Williams et al. (2019) Williams, A.P.; Abatzoglou, J.T.; Gershunov, A.; Guzman-Morales, J.; Bishop, D.A.; Balch, J.K.; Lettenmaier, D.P. Observed Impacts of Anthropogenic Climate Change on Wildfire in California. Earth’s Future 2019, 7, 892–910. doi:\changeurlcolorblackhttps://doi.org/10.1029/2019EF001210.
- Stavros et al. (2019) Stavros, N.; Agha, A.; Alkalai, L.; Sirota, A.; Quadrelli, M.; Ebadi, K.; Yun, K. Smoke Sky: Exploring New Frontiers of Unmanned Aerial Systems for Wildland Fire Science and Applications 2019. doi:\changeurlcolorblack2014/50443.
- Barmpoutis et al. (2020) Barmpoutis, P.; Papaioannou, P.; Dimitropoulos, K.; Grammalidis, N. A Review on Early Forest Fire Detection Systems Using Optical Remote Sensing. Sensors 2020, 20. doi:\changeurlcolorblack10.3390/s20226442.
- Long et al. (2015) Long, J.; Shelhamer, E.; Darrell, T. Fully convolutional networks for semantic segmentation. 2015 IEEE Conference on Computer Vision and Pattern Recognition (CVPR), 2015, pp. 3431–3440. doi:\changeurlcolorblack10.1109/CVPR.2015.7298965.
- He et al. (2017) He, K.; Gkioxari, G.; Dollár, P.; Girshick, R. Mask R-CNN. 2017 IEEE International Conference on Computer Vision (ICCV), 2017, pp. 2980–2988. doi:\changeurlcolorblack10.1109/ICCV.2017.322.
- Xie et al. (2021) Xie, E.; Wang, W.; Yu, Z.; Anandkumar, A.; Alvarez, J.M.; Luo, P. SegFormer: Simple and Efficient Design for Semantic Segmentation with Transformers. arXiv preprint arXiv:2105.15203 2021.
- King et al. (1992) King, M.D.; Kaufman, Y.J.; Menzel, W.P.; Tanre, D. Remote Sensing of Cloud, Aerosol, and Water Vapor Properties from the Moderate Resolution Imaging Spectrometer (MODIS). IEEE Transactions on Geoscience and Remote Sensing 1992, 30, 2–27.
- (12) GIBS, N. Worldview Snapshots — wvs.earthdata.nasa.gov. https://wvs.earthdata.nasa.gov. [Accessed 24-12-2024].
- Knight and Kvaran (2014) Knight, E.; Kvaran, G. Landsat-8 Operational Land Imager Design, Characterization and Performance. Remote Sensing 2014, 6, 10286–10305. doi:\changeurlcolorblack10.3390/rs61110286.
- Diner et al. (2013) Diner, D.J.; Xu, F.; Garay, M.J.; Martonchik, J.V.; Rheingans, B.E.; Geier, S.; Davis, A.; Hancock, B.R.; Jovanovic, V.M.; Bull, M.A.; Capraro, K.; Chipman, R.A.; McClain, S.C. The Airborne Multiangle SpectroPolarimetric Imager (AirMSPI): a new tool for aerosol and cloud remote sensing. Atmos. Meas. Tech. 2013, 6, 2007–2025. doi:\changeurlcolorblackhttps://doi.org/10.5194/amt-6-2007-2013.
- Guerin et al. (2011) Guerin, D.C.; Fisher, J.; Graham, E.R. The enhanced MODIS airborne simulator hyperspectral imager. Algorithms and Technologies for Multispectral, Hyperspectral, and Ultraspectral Imagery XVII; Shen, S.S.; Lewis, P.E., Eds. International Society for Optics and Photonics, SPIE, 2011, Vol. 8048, pp. 214 – 224. doi:\changeurlcolorblack10.1117/12.887283.
- Hook et al. (2001) Hook, S.J.; Myers, J.J.; Thome, K.J.; Fitzgerald, M.; Kahle, A.B. The MODIS/ASTER airborne simulator (MASTER) — a new instrument for earth science studies. Remote Sensing of Environment 2001, 76, 93–102. doi:\changeurlcolorblackhttps://doi.org/10.1016/S0034-4257(00)00195-4.
- Green et al. (1998) Green, R.O.; Eastwood, M.L.; Sarture, C.M.; Chrien, T.G.; Aronsson, M.; Chippendale, B.J.; Faust, J.A.; Pavri, B.E.; Chovit, C.J.; Solis, M.; Olah, M.R.; Williams, O. Imaging Spectroscopy and the Airborne Visible/Infrared Imaging Spectrometer (AVIRIS). Remote Sensing of Environment 1998, 65, 227–248. doi:\changeurlcolorblack10.1016/s0034-4257(98)00064-9.
- Diner (1999) Diner, D. MISR Experiment Overview 1999.
- of Commerce (2017) of Commerce, U.D. Visible Infrared Imaging Radiometer Suite (VIIRS) Sensor Data Record (SDR) User’s Guide 2017.
- DOC et al. (2019) DOC.; NOAA.; NESDIS.; NASA. GOES-R Series Product Definition and Users’ Guide 2019.
- PBC (2018–) PBC, P.L. Planet Application Program Interface: In Space for Life on Earth, 2018–.
- Kanezaki (2018) Kanezaki, A. Unsupervised Image Segmentation by Backpropagation. 2018 IEEE International Conference on Acoustics, Speech and Signal Processing (ICASSP), 2018, pp. 1543–1547. doi:\changeurlcolorblack10.1109/ICASSP.2018.8462533.
- Chen et al. (2019) Chen, M.; Artières, T.; Denoyer, L. Unsupervised Object Segmentation by Redrawing, 2019, [arXiv:1905.13539].
- Aganj et al. (2018) Aganj, I.; Harisinghani, M.G.; Weissleder, R.; Fischl, B. Unsupervised Medical Image Segmentation Based on the Local Center of Mass. Scientific Reports 2018, 8. doi:\changeurlcolorblack10.1038/s41598-018-31333-5.
- Soares et al. (2020) Soares, A.R.; Körting, T.S.; Fonseca, L.M.G.; Neves, A.K. An Unsupervised Segmentation Method For Remote Sensing Imagery Based On Conditional Random Fields. 2020 IEEE Latin American GRSS & ISPRS Remote Sensing Conference (LAGIRS), 2020, pp. 1–5. doi:\changeurlcolorblack10.1109/LAGIRS48042.2020.9165623.
- Zhang et al. (2019) Zhang, R.; Yu, L.; Tian, S.; Lv, Y. Unsupervised remote sensing image segmentation based on a dual autoencoder. Journal of Applied Remote Sensing 2019, 13, 038501 – 038501.
- Kirillov et al. (2023) Kirillov, A.; Mintun, E.; Ravi, N.; Mao, H.; Rolland, C.; Gustafson, L.; Xiao, T.; Whitehead, S.; Berg, A.C.; Lo, W.Y.; Dollár, P.; Girshick, R. Segment Anything, 2023, [arXiv:2304.02643].
- Thangavel et al. (2023) Thangavel, K.; Spiller, D.; Sabatini, R.; Amici, S.; Sasidharan, S.T.; Fayek, H.; Marzocca, P. Autonomous Satellite Wildfire Detection Using Hyperspectral Imagery and Neural Networks: A Case Study on Australian Wildfire. Remote Sensing 2023, 15, 720. doi:\changeurlcolorblack10.3390/rs15030720.
- Spiller et al. (2023) Spiller, D.; Carbone, A.; Amici, S.; Thangavel, K.; Sabatini, R.; Laneve, G. Wildfire Detection Using Convolutional Neural Networks and PRISMA Hyperspectral Imagery: A Spatial-Spectral Analysis. Remote Sensing 2023, 15, 4855. doi:\changeurlcolorblack10.3390/rs15194855.
- Boroujeni et al. (2024) Boroujeni, S.P.H.; Razi, A.; Khoshdel, S.; Afghah, F.; Coen, J.L.; O’Neill, L.; Fule, P.; Watts, A.; Kokolakis, N.M.T.; Vamvoudakis, K.G. A comprehensive survey of research towards AI-enabled unmanned aerial systems in pre-, active-, and post-wildfire management. Information Fusion 2024, 108, 102369. doi:\changeurlcolorblack10.1016/j.inffus.2024.102369.
- (31) Real-time tracking of wildfire boundaries using satellite imagery — research.google. https://research.google/blog/real-time-tracking-of-wildfire-boundaries-using-satellite-imagery/. [Accessed 24-12-2024].
- Sun et al. (2023) Sun, Y.; Jiang, L.; Pan, J.; Sheng, S.; Hao, L. A satellite imagery smoke detection framework based on the Mahalanobis distance for early fire identification and positioning. International Journal of Applied Earth Observation and Geoinformation 2023, 118, 103257. doi:\changeurlcolorblack10.1016/j.jag.2023.103257.
- MacQueen (1967) MacQueen, J.B. Some Methods for Classification and Analysis of MultiVariate Observations. Proc. of the fifth Berkeley Symposium on Mathematical Statistics and Probability; Cam, L.M.L.; Neyman, J., Eds. University of California Press, 1967, Vol. 1, pp. 281–297.
- Lin et al. (2021) Lin, B.; Yu, Z.; Huang, F.; Guo, L. Pool-Based Sequential Active Learning For Regression Based on Incremental Cluster Center Selection. IEEE, 2021, pp. 176–182.
- Burke et al. (2023) Burke, A.; Carroll, M.; Spradlin, C. Finding the Trees in a (Random) Forest: How Do We Get a Representative Sample in a Training Dataset for a Global Land Cover Classification? AGU Fall Meeting Abstracts, 2023, Vol. 2023, pp. IN51C–0429.
- Grill et al. (2020) Grill, J.B.; Strub, F.; Altché, F.; Tallec, C.; Richemond, P.H.; Buchatskaya, E.; Doersch, C.; Pires, B.A.; Guo, Z.D.; Azar, M.G.; Piot, B.; Kavukcuoglu, K.; Munos, R.; Valko, M. Bootstrap your own latent: A new approach to self-supervised Learning, 2020. cite arxiv:2006.07733.
- Assran et al. (2023) Assran, M.; Duval, Q.; Misra, I.; Bojanowski, P.; Vincent, P.; Rabbat, M.G.; LeCun, Y.; Ballas, N. Self-Supervised Learning from Images with a Joint-Embedding Predictive Architecture. CoRR 2023, abs/2301.08243.
- Liao et al. (2022) Liao, R.; Kornblith, S.; Ren, M.; Fleet, D.J.; Hinton, G. Gaussian-Bernoulli RBMs Without Tears, 2022, [arXiv:cs.LG/2210.10318].
- He et al. (2022) He, K.; Chen, X.; Xie, S.; Li, Y.; Dollár, P.; Girshick, R.B. Masked Autoencoders Are Scalable Vision Learners. IEEE, 2022, pp. 15979–15988.
- de Boves Harrington (2018) de Boves Harrington, P. Feature expansion by a continuous restricted Boltzmann machine for near-infrared spectrometric calibration. Analytica Chimica Acta 2018, 1010, 20–28. doi:\changeurlcolorblackhttps://doi.org/10.1016/j.aca.2018.01.026.
- Sobczak and Kapela (2019) Sobczak, S.; Kapela, R. Restricted Boltzmann Machine as Image Pre-processing Method for Deep Neural Classifier. 2019 First International Conference on Societal Automation (SA), 2019, pp. 1–5. doi:\changeurlcolorblack10.1109/SA47457.2019.8938039.
- Harrington (2020) Harrington, P.B. Enhanced zippy restricted Boltzmann machine for feature expansion and improved classification of analytical data. Journal of Chemometrics 2020, 34, e3228, [https://analyticalsciencejournals.onlinelibrary.wiley.com/doi/pdf/10.1002/cem.3228]. e3228 CEM-18-0201.R1, doi:\changeurlcolorblackhttps://doi.org/10.1002/cem.3228.
- Ji et al. (2019) Ji, X.; Vedaldi, A.; Henriques, J.F. Invariant Information Clustering for Unsupervised Image Classification and Segmentation. IEEE, 2019, pp. 9864–9873.
- Suzuki and be (1985) Suzuki, S.; be, K. Topological structural analysis of digitized binary images by border following. Computer Vision, Graphics, and Image Processing 1985, 30, 32–46. doi:\changeurlcolorblackhttps://doi.org/10.1016/0734-189X(85)90016-7.
- Bradski (2000) Bradski, G. The OpenCV Library. Dr. Dobb’s Journal of Software Tools 2000.
- Wang et al. (2004) Wang, Z.; Bovik, A.; Sheikh, H.; Simoncelli, E. Image quality assessment: from error visibility to structural similarity. Image Processing, IEEE Transactions on 2004, 13, 600 –612. doi:\changeurlcolorblack10.1109/TIP.2003.819861.
- Wang and Bovik (2009) Wang, Z.; Bovik, A.C. Mean squared error: Love it or leave it? A new look at Signal Fidelity Measures. IEEE Signal Processing Magazine 2009, 26, 98–117. doi:\changeurlcolorblack10.1109/MSP.2008.930649.
- Woodhouse (2021) Woodhouse, I.H. On ‘ground’ truth and why we should abandon the term. Journal of Applied Remote Sensing 2021, 15, 041501. doi:\changeurlcolorblack10.1117/1.JRS.15.041501.
- Yang et al. (2019) Yang, F.; Du, M.; Hu, X. Evaluating Explanation Without Ground Truth in Interpretable Machine Learning, 2019, [arXiv:cs.LG/1907.06831].
- LaHaye et al. (2025) LaHaye, N.; Easley, A.; Leet, N. SIT_FUSE, 2025. doi:\changeurlcolorblack10.5281/ZENODO.14736221.
- Harris et al. (2020) Harris, C.R.; Millman, K.J.; van der Walt, S.J.; Gommers, R.; Virtanen, P.; Cournapeau, D.; Wieser, E.; Taylor, J.; Berg, S.; Smith, N.J.; Kern, R.; Picus, M.; Hoyer, S.; van Kerkwijk, M.H.; Brett, M.; Haldane, A.; del Río, J.F.; Wiebe, M.; Peterson, P.; Gérard-Marchant, P.; Sheppard, K.; Reddy, T.; Weckesser, W.; Abbasi, H.; Gohlke, C.; Oliphant, T.E. Array programming with NumPy. Nature 2020, 585, 357–362. doi:\changeurlcolorblack10.1038/s41586-020-2649-2.
- Virtanen et al. (2020) Virtanen, P.; Gommers, R.; Oliphant, T.E.; Haberland, M.; Reddy, T.; Cournapeau, D.; Burovski, E.; Peterson, P.; Weckesser, W.; Bright, J.; van der Walt, S.J.; Brett, M.; Wilson, J.; Millman, K.J.; Mayorov, N.; Nelson, A.R.J.; Jones, E.; Kern, R.; Larson, E.; Carey, C.J.; Polat, İ.; Feng, Y.; Moore, E.W.; VanderPlas, J.; Laxalde, D.; Perktold, J.; Cimrman, R.; Henriksen, I.; Quintero, E.A.; Harris, C.R.; Archibald, A.M.; Ribeiro, A.H.; Pedregosa, F.; van Mulbregt, P.; SciPy 1.0 Contributors. SciPy 1.0: Fundamental Algorithms for Scientific Computing in Python. Nature Methods 2020, 17, 261–272. doi:\changeurlcolorblack10.1038/s41592-019-0686-2.
- Dask Development Team (2016) Dask Development Team. Dask, 2016.
- Hoyer and Hamman (2017) Hoyer, S.; Hamman, J. xarray: N-D labeled arrays and datasets in Python. Journal of Open Research Software 2017, 5. doi:\changeurlcolorblack10.5334/jors.148.
- zar (2025) zarr-developers/zarr-python: v3.0.1, 2025. doi:\changeurlcolorblack10.5281/ZENODO.3773449.
- Lam et al. (2015) Lam, S.K.; Pitrou, A.; Seibert, S. Numba: a LLVM-based Python JIT compiler. Proceedings of the Second Workshop on the LLVM Compiler Infrastructure in HPC; Association for Computing Machinery: New York, NY, USA, 2015; LLVM ’15. doi:\changeurlcolorblack10.1145/2833157.2833162.
- Okuta et al. (2017) Okuta, R.; Unno, Y.; Nishino, D.; Hido, S.; Loomis, C. CuPy: A NumPy-Compatible Library for NVIDIA GPU Calculations. Proceedings of Workshop on Machine Learning Systems (LearningSys) in The Thirty-first Annual Conference on Neural Information Processing Systems (NIPS), 2017.
- Paszke et al. (2019) Paszke, A.; Gross, S.; Massa, F.; Lerer, A.; Bradbury, J.; Chanan, G.; Killeen, T.; Lin, Z.; Gimelshein, N.; Antiga, L.; Desmaison, A.; Kopf, A.; Yang, E.; DeVito, Z.; Raison, M.; Tejani, A.; Chilamkurthy, S.; Steiner, B.; Fang, L.; Bai, J.; Chintala, S. PyTorch: An Imperative Style, High-Performance Deep Learning Library. In Advances in Neural Information Processing Systems 32; Wallach, H.; Larochelle, H.; Beygelzimer, A.; d'Alché-Buc, F.; Fox, E.; Garnett, R., Eds.; Curran Associates, Inc., 2019; pp. 8024–8035.
- Pedregosa et al. (2011) Pedregosa, F.; Varoquaux, G.; Gramfort, A.; Michel, V.; Thirion, B.; Grisel, O.; Blondel, M.; Prettenhofer, P.; Weiss, R.; Dubourg, V.; Vanderplas, J.; Passos, A.; Cournapeau, D.; Brucher, M.; Perrot, M.; Duchesnay, E. Scikit-learn: Machine Learning in Python. Journal of Machine Learning Research 2011, 12, 2825–2830.
- Roder et al. (2020) Roder, M.; de Rosa, G.H.; Papa, J.P. Learnergy: Energy-based Machine Learners, 2020, [arXiv:cs.LG/2003.07443].
- pyr (2024) pytroll/pyresample: Version 1.31.0 (2024/10/25), 2024. doi:\changeurlcolorblack10.5281/ZENODO.3372769.
- Rouault et al. (2025) Rouault, E.; Warmerdam, F.; Schwehr, K.; Kiselev, A.; Butler, H.; Łoskot, M.; Szekeres, T.; Tourigny, E.; Landa, M.; Miara, I.; Elliston, B.; Chaitanya, K.; Plesea, L.; Morissette, D.; Jolma, A.; Dawson, N.; Baston, D.; de Stigter, C.; Miura, H. GDAL, 2025. doi:\changeurlcolorblack10.5281/ZENODO.5884351.
- Zonca et al. (2019) Zonca, A.; Singer, L.; Lenz, D.; Reinecke, M.; Rosset, C.; Hivon, E.; Gorski, K. healpy: equal area pixelization and spherical harmonics transforms for data on the sphere in Python. Journal of Open Source Software 2019, 4, 1298. doi:\changeurlcolorblack10.21105/joss.01298.
- pol (2025) ssec/polar2grid: Python Package Version 3.2.0, 2025. doi:\changeurlcolorblack10.5281/ZENODO.4450340.
- Jordahl et al. (2020) Jordahl, K.; den Bossche, J.V.; Fleischmann, M.; Wasserman, J.; McBride, J.; Gerard, J.; Tratner, J.; Perry, M.; Badaracco, A.G.; Farmer, C.; Hjelle, G.A.; Snow, A.D.; Cochran, M.; Gillies, S.; Culbertson, L.; Bartos, M.; Eubank, N.; maxalbert.; Bilogur, A.; Rey, S.; Ren, C.; Arribas-Bel, D.; Wasser, L.; Wolf, L.J.; Journois, M.; Wilson, J.; Greenhall, A.; Holdgraf, C.; Filipe.; Leblanc, F. geopandas/geopandas: v0.8.1, 2020. doi:\changeurlcolorblack10.5281/zenodo.3946761.
- Itseez (2015) Itseez. Open Source Computer Vision Library. https://github.com/itseez/opencv, 2015.
- (67) QGIS Development Team. QGIS Geographic Information System. QGIS Association.
- Marsocci et al. (2024) Marsocci, V.; Jia, Y.; Bellier, G.L.; Kerekes, D.; Zeng, L.; Hafner, S.; Gerard, S.; Brune, E.; Yadav, R.; Shibli, A.; Fang, H.; Ban, Y.; Vergauwen, M.; Audebert, N.; Nascetti, A. PANGAEA: A Global and Inclusive Benchmark for Geospatial Foundation Models, 2024, [arXiv:2412.04204].
- Duderstadt et al. (2023) Duderstadt, B.; Helm, H.S.; Priebe, C.E. Comparing Foundation Models using Data Kernels, 2023, [arXiv:2305.05126].
- Zhang et al. (2023) Zhang, J.; Lehman, J.; Stanley, K.; Clune, J. OMNI: Open-endedness via Models of human Notions of Interestingness, 2023, [arXiv:2306.01711].
- Lu et al. (2024) Lu, C.; Lu, C.; Lange, R.T.; Foerster, J.; Clune, J.; Ha, D. The AI Scientist: Towards Fully Automated Open-Ended Scientific Discovery, 2024.
- LaHaye et al. (2025) LaHaye, N.; Easley, A.; Lee, H.; Yun, K.; Linstead, E.; Garay, M.; Kalashnikova, O. Multi-Platform / Multi-Sensor Fire and Smoke Segmentation from the FIREX-AQ 2019 Campaign, 2025. doi:\changeurlcolorblack10.5281/ZENODO.14731718.
- Nick LaHaye (2025) Nick LaHaye. FIREX_AQ_2019_Fire_Smoke (Revision e2f8a55), 2025. doi:\changeurlcolorblack10.57967/hf/4245.