Fast Wide-field Light Sheet Electro-optic FLIM
††journal: opticajournal††articletype: Research ArticleWe demonstrate volumetric fluorescence lifetime microscopy (FLIM) using the electro-optic FLIM technique. Images acquired in a selective plane illumination microscope are gated using a Pockels cell driven at 80 MHz, enabling light sheet FLIM acquisition with up to 800 m field of view. Volume acquisitions are demonstrated on fluorescent bead mixtures and in live Arabidopsis thaliana root samples using both genetically encoded fluorescent proteins and endogenous autofluorescence.
1 Introduction
Fluorescence lifetime microscopy (FLIM) enables acquisition of quantitative, label-free, and chemically specific contrast in a variety of biological imaging contexts [1, 2]. Physical and chemical factors that modify the environment of a fluorescent probe molecule modulate the available nonradiative decay pathways and change its fluorescence lifetime. FLIM techniques are devoted to resolving these changes, and they have traditionally found uses in a variety of two-dimensional applications including imaging fluorescent biosensors, molecular probes, and autofluorescent indicators of cellular metabolism. Lifetime imaging is particularly promising in live imaging studies of plants where strong autofluorescence is present — for example from lignin and chlorophyll — and where it is important to effectively differentiate diverse endogenous species and fluorescent probe signatures [3, 4].
While FLIM is a powerful modality, it has remained challenging to combine with three-dimensional imaging methods due to the limited throughput of time-correlated single photon counting (TC-SPC) detectors and the large number of points which must be sampled. Despite this difficulty, recent works have identified the promise of combining FLIM with light sheet microscopy (LS-FLIM) due to light sheet’s ability to provide volumetric imaging with low phototoxicity. Light sheet fluorescence microscopy has also found powerful application visualizing dynamic processes such as germination of plant seedlings across spatial scales [5]. The detectors used in previous LS-FLIM microscopes still involve fundamental trade-offs in either photon throughput or pixel noise performance. These include microchannel plates with cross-wire [6] or spatially-resolved anodes [7], modulated complementary metal-oxide semiconductor (CMOS) cameras [8], gated optical intensifiers [9, 10, 11, 12], and single-photon avalanche detector (SPAD) arrays [13, 14]. Challenges have included long acquisition times of ten seconds or even minutes per slice [6] and imaging noise that requires a reference intensity image to be acquired on a standard scientific camera [13]. Recently developed SPAD arrays operating in a gated mode rather than TC-SPC have allowed for scanned light sheet acquisition with one second exposures per plane but still face significant detection efficiency and throughput limitations compared to scientific camera sensors, requiring correction for photon pile-up and efforts to avoid detector saturation [15].
Here we adapted the recently developed electro-optic FLIM (EO-FLIM) technique [16, 17, 18] to enable an alternative approach to light sheet FLIM which is compatible with high photon throughput and dynamic range while maintaining the favorable pixel noise and image quality of scientific cameras for imaging weakly fluorescent samples. Our system is tuned to 80 MHz to enable compatibility with common ultrafast laser sources.
2 Methods
The EO-FLIM technique uses a Pockels cell to implement nanosecond optical gating across a wide-field image that is synchronous with pulses from the excitation laser. We have combined the Pockels cell and image splitting optics necessary to implement EO-FLIM with a commercial selective plane illumination [19] light sheet microscope (LaVision Ultramicroscope II). The sample is excited with an 80 MHz picosecond supercontinuum pulsed laser source and fluorescence is captured using a large field of view stereomicroscope (Olympus MVX10) with a high numerical aperture (NA) objective (MVPLAPO 2 XC; 2x magnification and 0.5 NA). During volumetric data collection, a piezoelectric stage displaces the sample in the direction orthogonal to the light sheet. This system is capable of performing light sheet microscopy across fields of view up to 800 m with high collection efficiency.
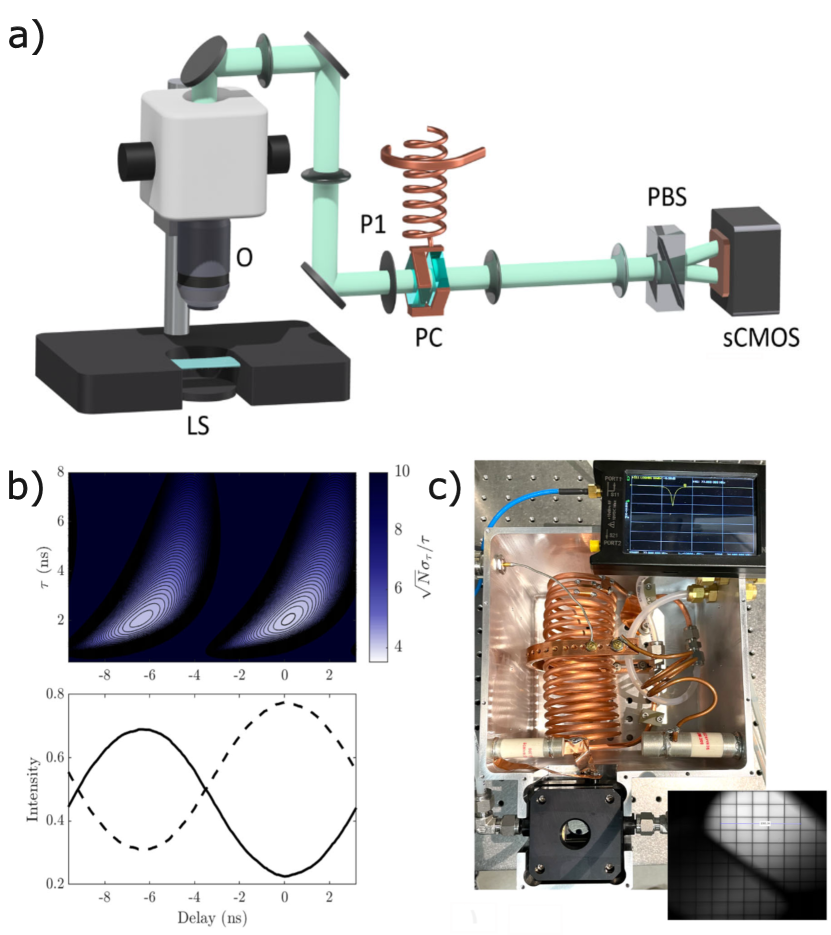
In our implementation, shown schematically in Fig. 1a, fluorescence from the sample is polarized with a linear polarizer (P1), modulated with the Pockels cell (PC), and separated into gated (G) and ungated (U) images on scientific CMOS camera using a Wollaston prism as a polarizing beam splitter (PBS). The Wollaston prism provides in-line image splitting with a single optical component and may be used provided that it is located near an image plane. The Pockels cell is incorporated into a resonant transformer and driven at 80 MHz with a controllable phase offset relative to the laser source. Further details about the experimental setup are given in Supplement 1. An instrument response function (IRF), Fig. 1b, is measured by sweeping the controllable phase delay between excitation source and Pockels cell using quenched fluorescein dye solution. We achieve a modulation depth of 50% across the wide-field image. To then determine lifetimes from single frames, the phase offset between laser and the Pockels cell drive is set to the optimal value for lifetime estimation at the peak of the IRF modulation waveform, as shown in Fig. 1b. Lifetime is measured by converting a single-frame measurement of image intensity ratio (G/U, the ratio of the pixel intensities in the two polarization channels) to a single-exponential fluorescence lifetime estimate using a lookup table[16]. This method is applied to every image pixel in parallel. The lower modulation depth achieved in this system compared to other EO-FLIM implementations [17, 18] is not a fundamental limitation but a result of the Pockels cell crystal dimensions used (pair of crystals with 17 mm square aperture and 5 mm thickness) which make it difficult to achieve Vπ at 80 MHz. This Pockels cell also generates a spatially-dependent IRF (see Supplement) so all lifetime calculations used a spatially dependent lookup table to account for variations in the gating.
3 Results
Fig. 2 demonstrates volumetric lifetime imaging of a two component mixture of fluorescent beads. We utilized commercially available PMMA beads stained with organic dyes from PolyAn GmbH having specified lifetimes of 2.7 ns and 5.5 ns and 6.5 m diameter [20]. The beads were suspended in low-melting point agarose (Invitrogen No. 16520050). The lifetime was averaged over the entire spatial extent of the bead, and the IRF was calculated locally. The volume in Fig. 2a, consisting of 2.7 ns beads, was acquired in 250 frames of 200 millisecond exposure each. The light sheet thickness in our system was measured to be 4 m. The point-spread-function of these fluorescent beads is shown in Fig. 2c. In Fig. 2b we show the ability of our system to separate two lifetimes by imaging a mixture of 2.7 ns and 5.5 ns beads. The average bead diameter in Fig. 2c was measured to be 9.6 px = 6.9 m, consistent with the specified bead diameter of 6.5 m. The 5.5 ns beads are 2.5x more intense than the 2.7 ns beads [20].

To demonstrate application of LS-EO-FLIM, we imaged Arabidopsis thaliana roots with exposure times of 200-500 ms per slice in Fig. 3. Faster acquisitions are also possible depending on sample brightness, and we are ultimately only limited by the speed of the Z-axis sample scanning stage. Total image acquisition times range from 70 s to 100 s for a full volume scan consisting of 100 acquired planes. The most significant limitation is about half a second per image to accommodate the stepping of the sample stage. LS-EO-FLIM is orders of magnitude faster than most existing LS-FLIM studies.
The Arabidopsis seedlings were grown in 0.5 x Murashige-Skoog (MS) medium with low-melting-point agarose (germination and sample mounting details provided in Supplement). Here we imaged wild type Col-0, multi-FP (Arabidopsis Biological Resource Center [ABRC] stock CS16303), and ER-CFP (ABRC stock CS16250) plants at various stages of growth. The multi-FP construct utilizes the protein-fluorescent protein pairs CoxIV-YFP, Cam53BD-GFP, RecA-RFP, and Gal4-CFP to indicate the mitochondria, plasma membranes, plastids, and nuclei respectively. The dominant signal in our multi-FP plant images is from plasma membrane localized green fluorescent protein (GFP) due to the large labeled volume in the root, our chosen ex/em bands, and limited laser power in the blue spectrum [21]. The ER-CFP construct consists of a cyan fluorescent protein (CFP) protein flanked by the signal peptide of AtWAK2 at the N-terminus to direct it to the secretory pathway, and an HDEL sequence at the C-terminus to retain it in the endoplasmic reticulum (ER) [22]. After image stacks were acquired with dozens or hundreds of frames 1-5 microns apart in Z, the gated and ungated output images are reduced to a lifetime image with an intensity mask applied to maintain structural information. Finally, the image is 3D rendered using the Napari [23] visualization package.
Volumetric data are represented here as maximum intensity projections, with rotating 3D views linked as supplementary media. Structures including main root tips, lateral roots, root hairs, root cells, and vascular bundles were visualized.
Several interesting features were revealed in fluorescence lifetime. We observed, Fig. 3a, a longer lifetime associated with the vascular bundle of the root. We noted across many samples an intensity-dependent effect on fluorescence lifetime where the side of the root illuminated more intensely by the light sheet (before it scatters in the root tissue) displayed a shorter lifetime. This effect may be more obvious in high-throughput lifetime imaging with EO-FLIM due to the ability to use higher excitation powers without saturating the detector. In Fig. 3d lifetime provides differentiation between endogenous autofluorescence and genetically-encoded cyan fluorescent protein targeted to endoplasmic reticulum, which showed longer lifetime aggregates within the root tissue. This is consistent with the longer expected lifetime of cyan fluorescent protein compared to lignin autofluorescence [24, 25, 26].
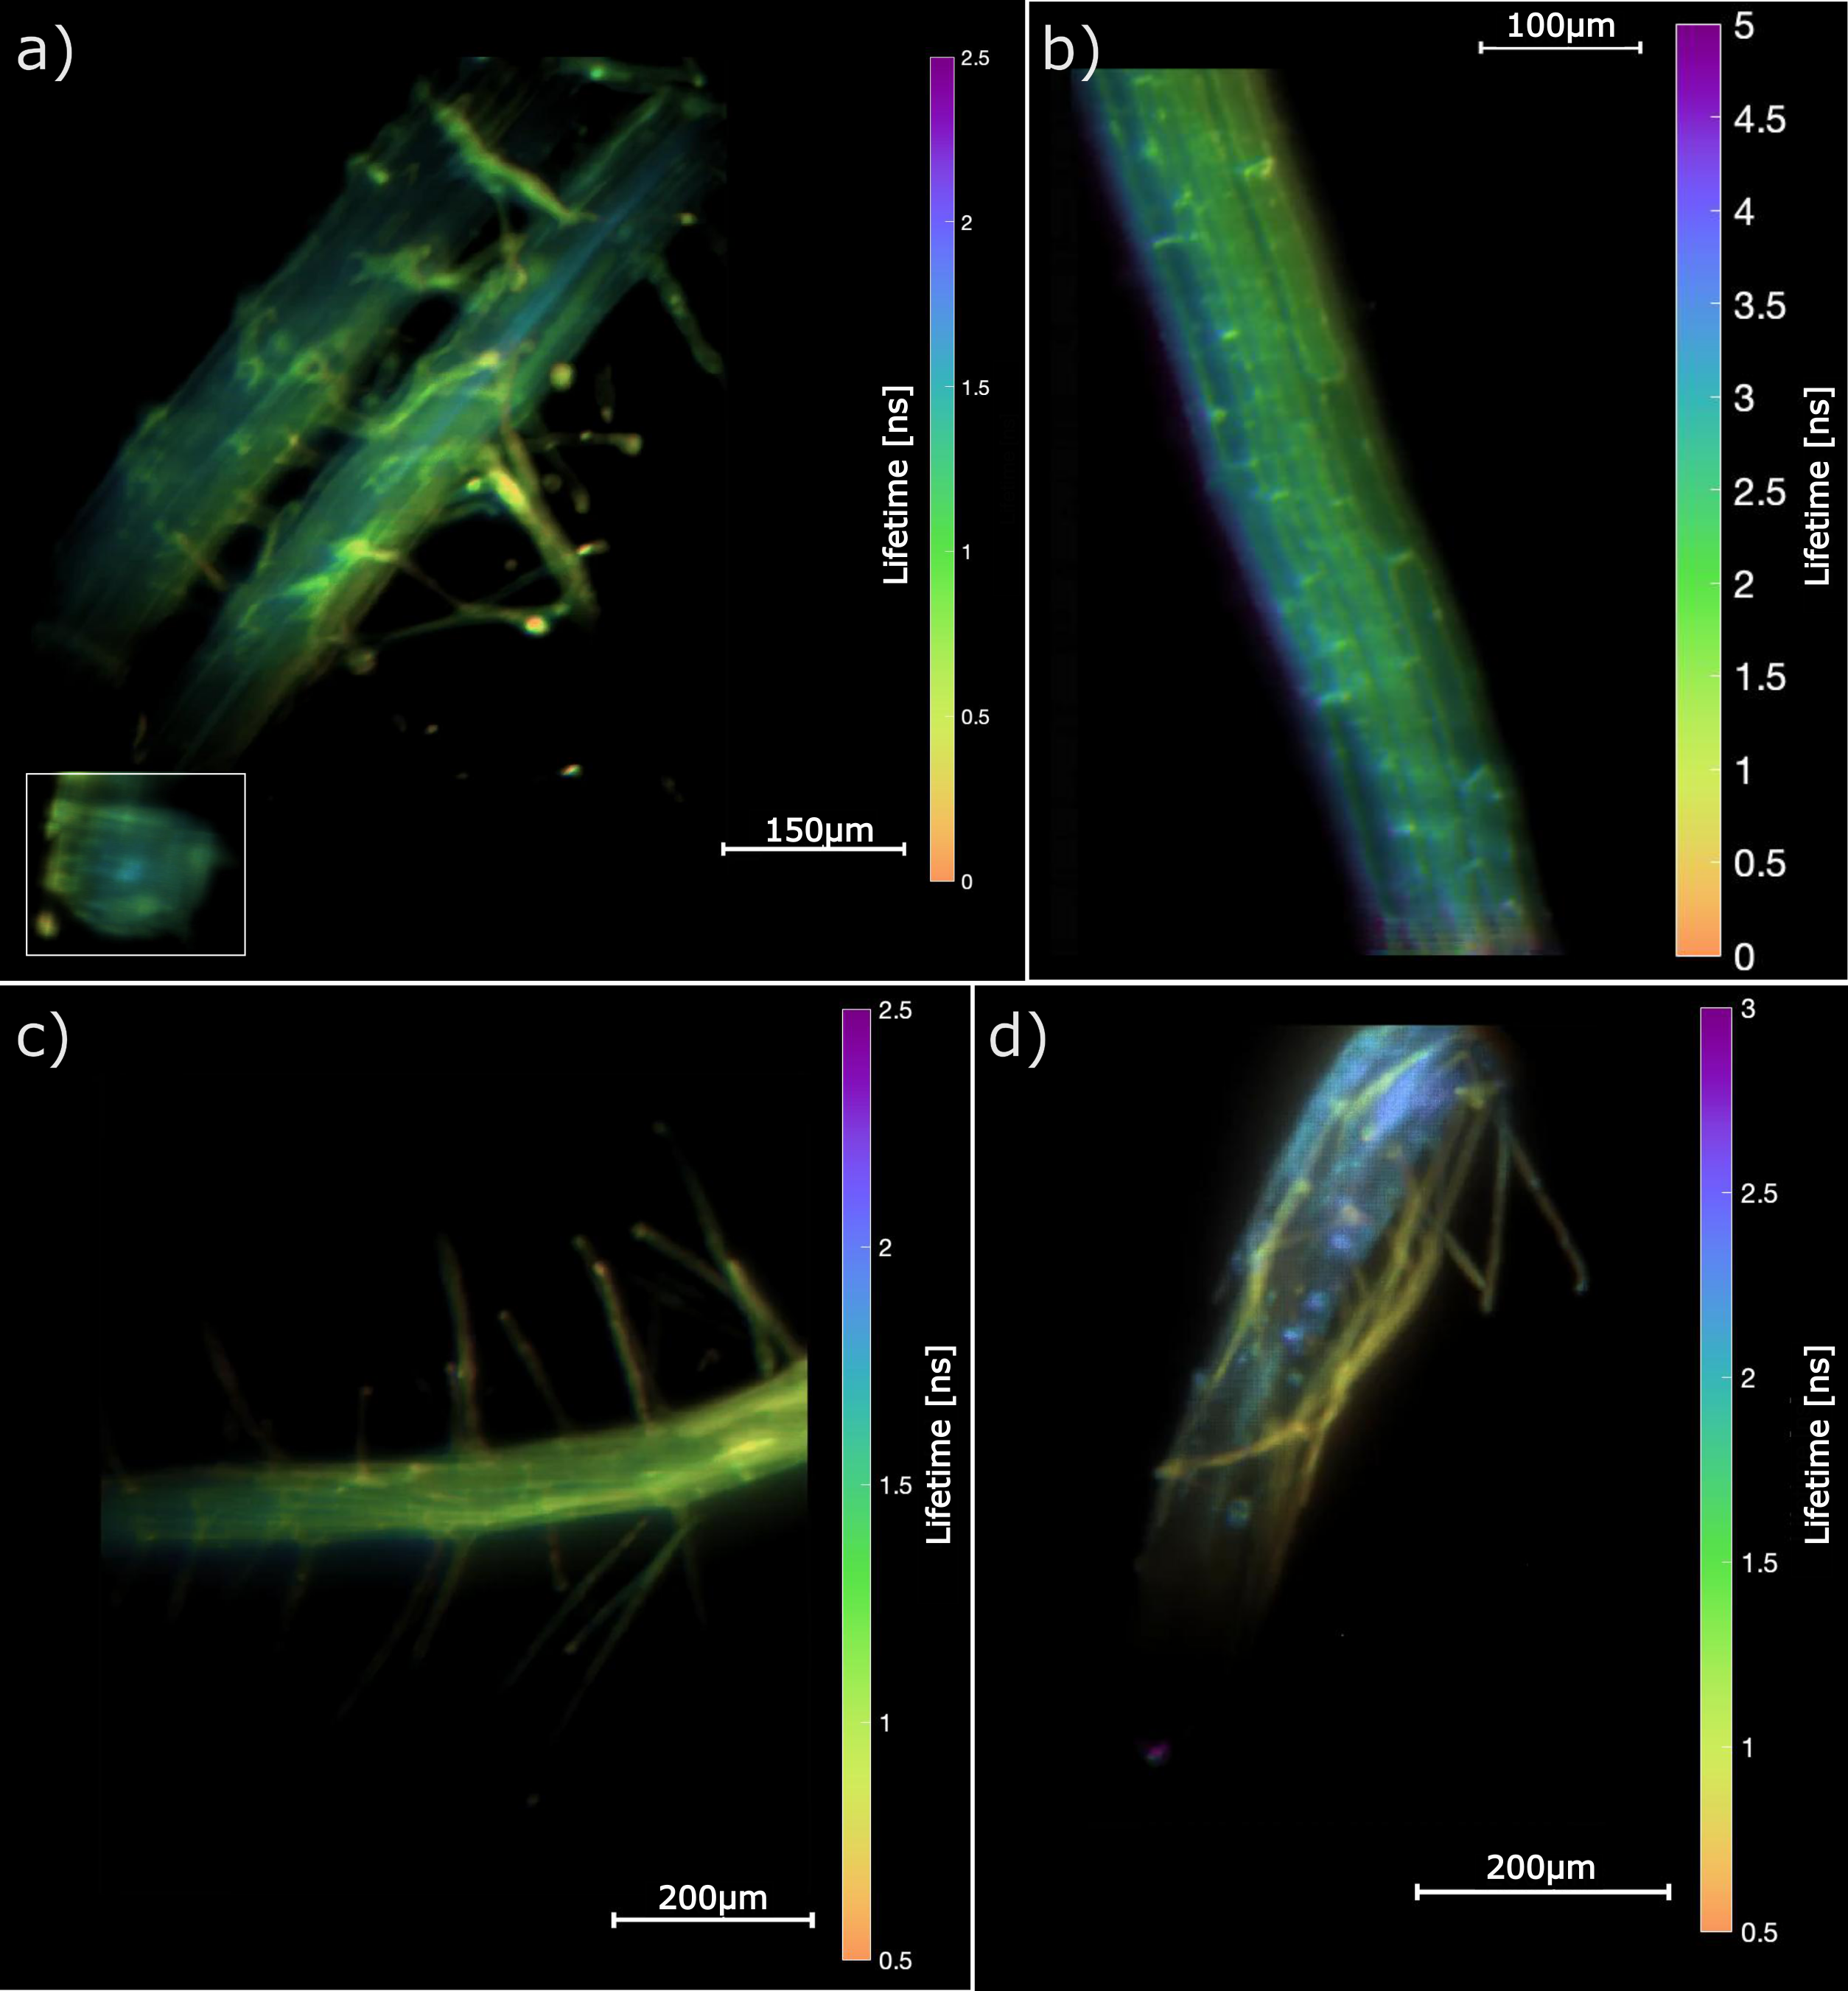
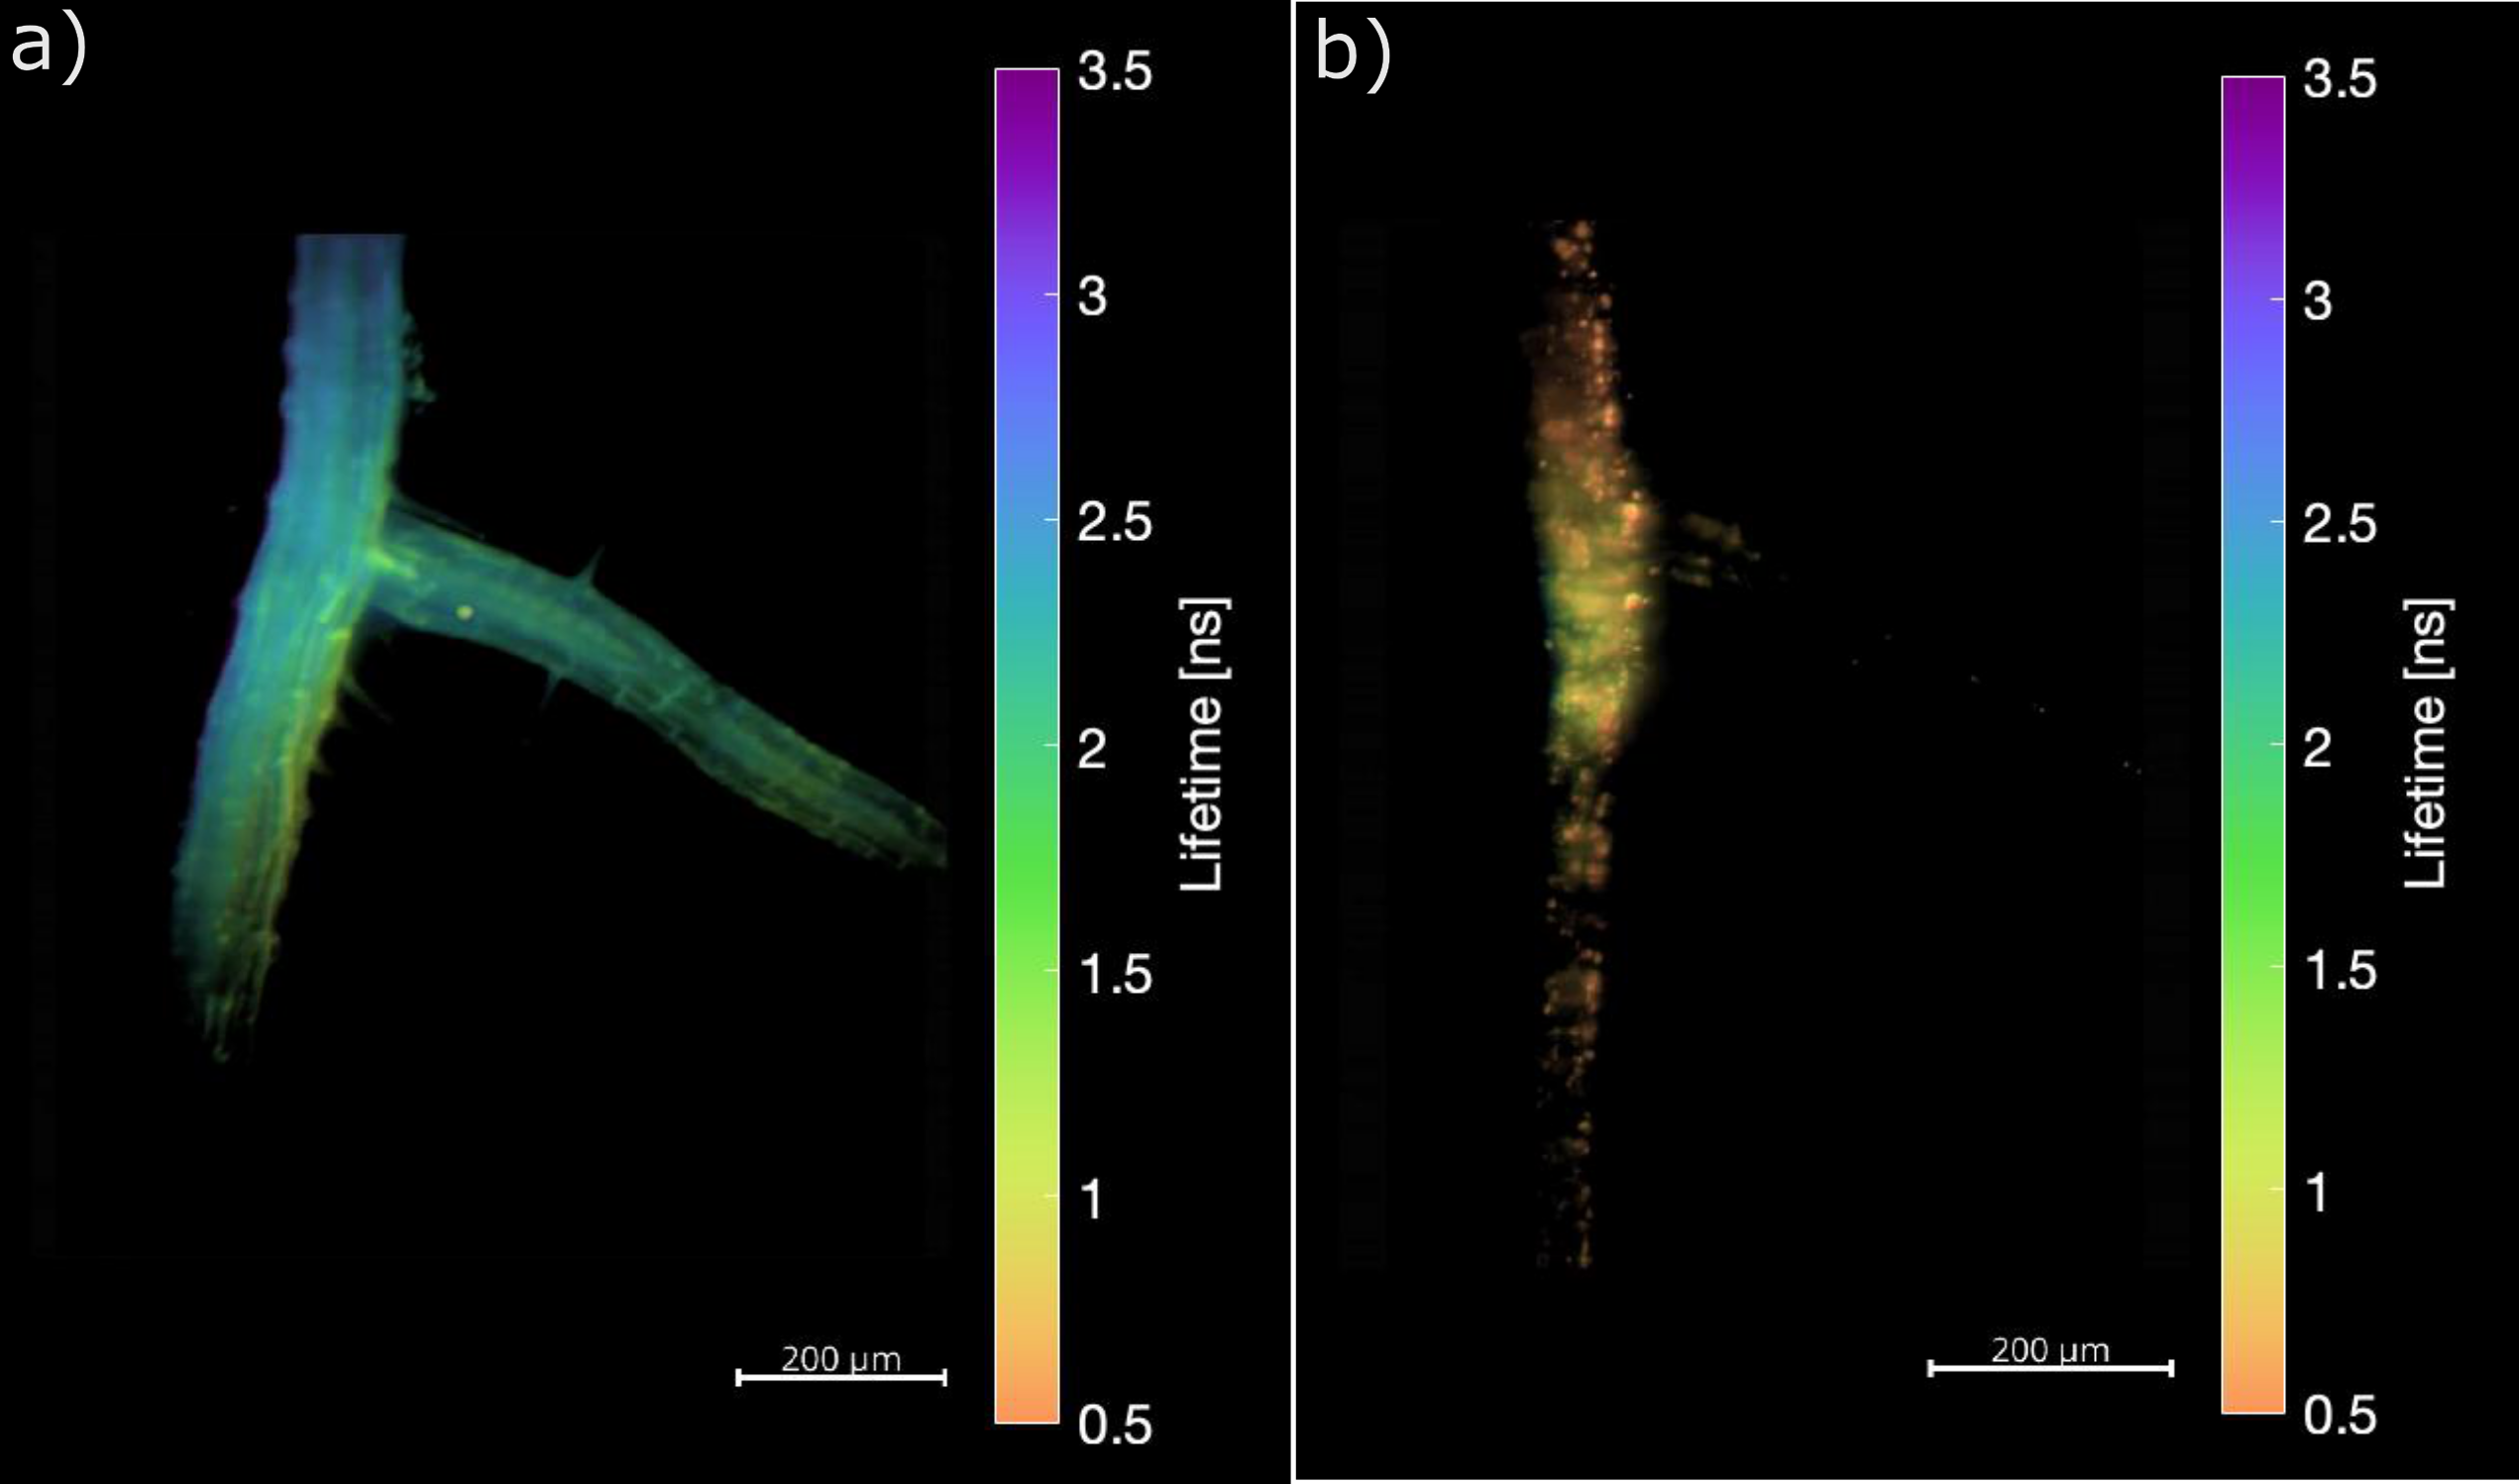
We also perform light sheet FLIM directly using endogenous autofluorescence when exciting the sample with blue light (450-490 nm excitation band). Green channel emission dominantly shows the cell walls with strong structural agreement to GFP-labelled roots, such as in Fig. 3a. This signal likely results in part from lignin in the cell walls [4, 3]. Autofluorescence in a red emission channel shows a concentration of more point-like emitters in the center of the root. Fig. 4b reveals internal point-like structures with shorter lifetimes that are particularly sensitive to the incident light intensity and fast to photobleach.
4 Discussion
The combination of FLIM with volumetric capture promises to enable applications of label-free microscopy to 3D environments and tissues. For plant imaging this will provide an improved view of root dynamics and interactions between roots and microbes in the rhizosphere. More broadly, FLIM readout may be applied to record a variety of fluorescent probes in 3D environments which will enable applications in neuroscience, clinical imaging, and histology.
The demonstrated light sheet FLIM capability allows for time-resolved volumetric imaging, where plant volumes can be taken repeatedly at intervals of a few minutes to reveal their dynamics, either internally or in concert with other organisms such as bacteria or fungi. The light sheet modality is optimal for reducing phototoxicity and future improvements will allow long term imaging of plant growth under controlled and natural conditions. The expected low phototoxicity of LS-FLIM is also well suited to two-photon illumination methods that will enable deeper imaging in scattering root tissue.
In summary, we developed an LS-FLIM microscope capable of rendering lifetimes at every pixel of three-dimensional plant volumes in minutes using both endogenous autofluorescence and genetically-encoded probes. This achievement is an extension of recent advances in EO-FLIM that enable wide-field lifetime imaging using resonantly driven Pockels cells to encode nanosecond lifetimes in the ratio of two image intensities. Our system achieves large field-of-view gating on a standard scientific camera, allowing high photon throughput, large dynamic range, and low pixel noise for megapixel FLIM acquisition. Our approach is also compatible with standard 80 MHz mode-locked lasers, making it widely compatible with standard microscopy systems that are in use throughout biological research.
Funding We acknowledge funding from the US Department of Energy, Office of Science, Office of Biological and Environmental Research, under award DE-SC0021976. A.J.B. acknowledges support from the NSF Graduate Research Fellowship under grant 1656518 and the Stanford Graduate Fellowship. M.B.M. acknowledges support from NSF IOS grant 1555957.
Acknowledgment We thank Franz Pfanner for assistance with microscope development. We acknowledge Kate Knight for discussions on Arabidopsis constructs.
Disclosures
A.J.B. and M.A.K. are inventors on PCT/US2019/062640, US17/153438, and US17/898093.
Data Availability Statement Data underlying the results presented in this paper are not publicly available at this time but may be obtained from the authors upon reasonable request.
Supplemental document See Supplement 1 for supporting content.
References
- [1] M. Y. Berezin and S. Achilefu, “Fluorescence lifetime measurements and biological imaging,” \JournalTitleChemical Reviews 110, 2641–2684 (2010).
- [2] R. Datta, T. M. Heaster, J. T. Sharick, et al., “Fluorescence lifetime imaging microscopy: fundamentals and advances in instrumentation, analysis, and applications,” \JournalTitleJournal of Biomedical Optics 25, 1 (2020).
- [3] L. Donaldson, “Autofluorescence in Plants,” \JournalTitleMolecules 25, 2393 (2020).
- [4] S. Escamez, C. Terryn, M. L. Gandla, et al., “Fluorescence lifetime imaging as an in situ and label-free readout for the chemical composition of lignin,” \JournalTitleACS Sustainable Chemistry & Engineering 9, 17381–17392 (2021).
- [5] M. Ovečka, D. Von Wangenheim, P. Tomančák, et al., “Multiscale imaging of plant development by light-sheet fluorescence microscopy,” \JournalTitleNature Plants 4, 639–650 (2018).
- [6] L. M. Hirvonen, J. Nedbal, N. Almutairi, et al., “Lightsheet fluorescence lifetime imaging microscopy with wide-field time-correlated single photon counting,” \JournalTitleJournal of Biophotonics 13, e201960099 (2020).
- [7] P. M. Birch, L. Moore, X. Li, et al., “A wide field fluorescence lifetime imaging system using a light sheet microscope,” \JournalTitleProc. SPIE 9887, 98871O (2016).
- [8] C. A. Mitchell, S. P. Poland, J. Seyforth, et al., “Functional in vivo imaging using fluorescence lifetime light-sheet microscopy,” \JournalTitleOptics Letters 42, 1269 (2017).
- [9] R. Li, A. Liu, T. Wu, et al., “Digital scanned laser light-sheet fluorescence lifetime microscopy with wide-field time-gated imaging,” \JournalTitleJournal of Microscopy 279, 69–76 (2020).
- [10] T. Funane, S. S. Hou, K. M. Zoltowska, et al., “Selective plane illumination microscopy (SPIM) with time-domain fluorescence lifetime imaging microscopy (FLIM) for volumetric measurement of cleared mouse brain samples,” \JournalTitleReview of Scientific Instruments 89, 053705 (2018).
- [11] P. Weber, S. Schickinger, M. Wagner, et al., “Monitoring of apoptosis in 3D cell cultures by FRET and light sheet fluorescence microscopy,” \JournalTitleInternational Journal of Molecular Sciences 16, 5375–5385 (2015).
- [12] K. Greger, M. J. Neetz, E. G. Reynaud, and E. H. Stelzer, “Three-dimensional fluorescence lifetime imaging with a single plane illumination microscope provides an improved signal to noise ratio,” \JournalTitleOptics Express 19, 20743 (2011).
- [13] K. Samimi, D. E. Desa, W. Lin, et al., “Light-sheet autofluorescence lifetime imaging with a single-photon avalanche diode array,” \JournalTitleJournal of Biomedical Optics 28 (2023).
- [14] K. J. Nutt, D. Olesker, E. McGhee, et al., “High-efficiency digitally scanned light-sheet fluorescence lifetime microscopy (DSLM-FLIM),” \JournalTitlebioRxiv:2023.06.02.543377 (2023).
- [15] V. Dunsing-Eichenauer, J. Hummert, C. Chardès, et al., “Fast volumetric fluorescence lifetime imaging of multicellular systems using single-objective light-sheet microscopy,” \JournalTitlebioRxiv:2024.03.24.586451 (2024).
- [16] A. J. Bowman, B. B. Klopfer, T. Juffmann, and M. A. Kasevich, “Electro-optic imaging enables efficient wide-field fluorescence lifetime microscopy,” \JournalTitleNature Communications 10, 4561 (2019).
- [17] A. J. Bowman and M. A. Kasevich, “Resonant electro-optic imaging for microscopy at nanosecond resolution,” \JournalTitleACS Nano 15, 16043–16054 (2021).
- [18] A. J. Bowman, C. Huang, M. J. Schnitzer, and M. A. Kasevich, “Wide-field fluorescence lifetime imaging of neuron spiking and subthreshold activity in vivo,” \JournalTitleScience 380, 1270–1275 (2023).
- [19] J. Huisken, J. Swoger, F. Del Bene, et al., “Optical sectioning deep inside live embryos by selective plane illumination microscopy,” \JournalTitleScience 305, 1007–1009 (2004).
- [20] D. Kage, K. Hoffmann, M. Wittkamp, et al., “Luminescence lifetime encoding in time-domain flow cytometry,” \JournalTitleScientific reports 8, 16715 (2018).
- [21] N. Kato, D. Reynolds, M. L. Brown, et al., “Multidimensional fluorescence microscopy of multiple organelles in arabidopsis seedlings,” \JournalTitlePlant Methods 4, 9 (2008).
- [22] B. K. Nelson, X. Cai, and A. Nebenführ, “A multicolored set of in vivo organelle markers for co-localization studies in Arabidopsis and other plants,” \JournalTitleThe Plant Journal 51, 1126–1136 (2007).
- [23] C.-L. Chiu, N. Clack, and the napari community, “napari: a Python multi-dimensional image viewer platform for the research community,” \JournalTitleMicroscopy and Microanalysis 28, 1576–1577 (2022).
- [24] R. Grailhe, F. Merola, J. Ridard, et al., “Monitoring protein interactions in the living cell through the fluorescence decays of the Cyan Fluorescent Protein,” \JournalTitleChemPhysChem 7, 1442–1454 (2006).
- [25] J. W. Borst, M. Willemse, R. Slijkhuis, et al., “ATP changes the fluorescence lifetime of Cyan Fluorescent Protein via an interaction with his148,” \JournalTitlePLoS ONE 5, e13862 (2010).
- [26] L. Donaldson and K. Radotic, “Fluorescence lifetime imaging of lignin autofluorescence in normal and compression wood,” \JournalTitleJournal of Microscopy 251, 178–187 (2013).