Original Article \paperfieldJournal Section \corraddressAlyssa Taylor-LaPole, Computational Applied Mathematics and Operations Research, Rice University, Houston, TX, 77251, USA \corremailal207@rice.edu \fundinginfoNSF, Grant/Award Numbers: DGE-2137100, DMS-2051010
A One Dimensional (1D) Computational Fluid Dynamics Study of Fontan-Associated Liver Disease (FALD)
Abstract
Fontan-Associated Liver Disease (FALD) is a disorder arising from hemodynamic changes and venous congestion in the liver. This disease is prominent in patients with hypoplastic left heart syndrome (HLHS). Although HLHS patients typically survive into adulthood, they have reduced cardiac output due to their univentricular physiology (i.e., a Fontan circuit). As a result, they have insufficient blood delivery to the liver. In comparison, patients with double outlet right ventricle (DORV), also having a univentricular circuit, have lower incidence of FALD. In this study, we use a patient-specific, one-dimensional computational fluid dynamics (1D-CFD) model to predict hemodynamics in the liver of an HLHS patient and compare predictions with an age- and size-matched DORV control patient. Additionally, we simulate FALD conditions in the HLHS patient to predict hemodynamic changes across various stages of disease progression. Our results show that the HLHS patient has a higher portal venous pressure compared to the DORV patient. This difference is exacerbated as FALD conditions progress. The wall shear stress (WSS) is also higher than normal for the HLHS patient, suggesting vascular remodeling. WSS decreases slightly under FALD conditions, consistent with the development of portal hypertension. Perfusion analysis gives insight into regions of liver tissue at risk for fibrosis development, showing increasing pressures and reduced flow throughout the liver tissue fed by the portal vein under FALD conditions. Our results provide insight into the specific hemodynamic changes in Fontan circulation that can cause FALD.
keywords:
Computational fluid dynamics, Fontan, FALD, HLHS, Perfusion, Wall shear stress1 Introduction
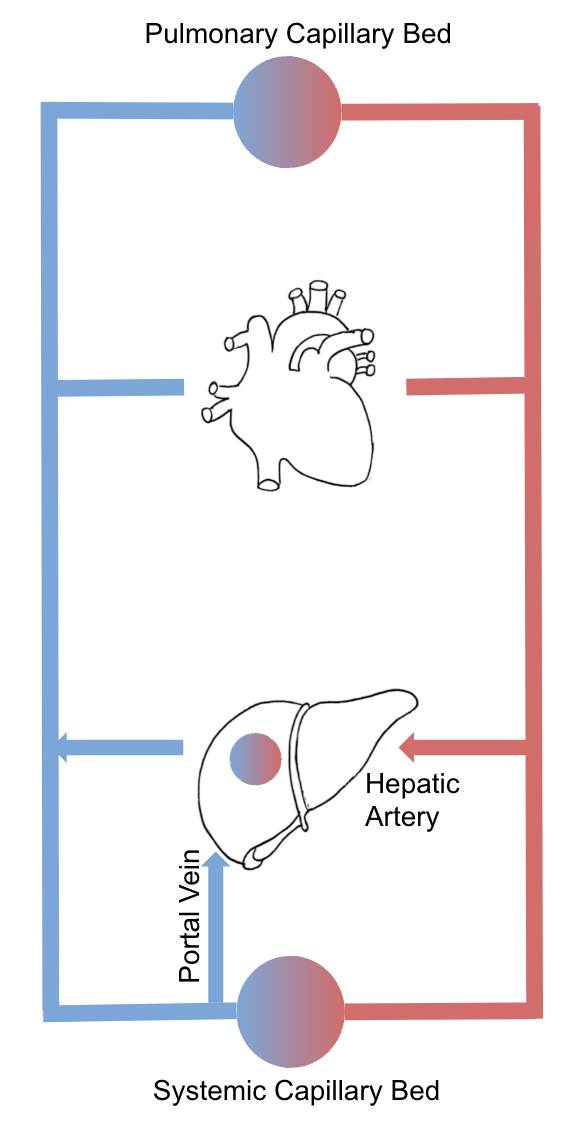
The Fontan procedure is a life-saving surgery for single ventricle patients. Single ventricle disease is a category of rare congenital heart defects that affect about 5 in 100,000 babies [1, 2]. The most common type is hypoplastic left heart syndrome (HLHS). HLHS patients are born with an underdeveloped left ventricle and aorta, leaving them with no way to pump oxygenated blood sufficiently to the body [3]. Patients undergo a series of surgeries from their first weeks of life to age three, resulting in a fully functioning univentricular circulatory system [4]. This system is called the Fontan circuit. For these patients, the single functioning right ventricle supports the pulmonary and systemic circulations; the ventricle actively pumps blood into the systemic circulation, while the pulmonary circulation is driven by a passive pressure gradient from the systemic veins to the lungs [5]. This leads to an elevation in central venous pressure (CVP) [6]. Approximately of patients with Fontan circuits survive until early adulthood, but these patients will suffer long-term complications.
A common complication is the development of Fontan-associated liver disease (FALD) [7, 8, 9, 10]. Almost Fontan patients will develop FALD to some degree, which could lead to portal hypertension, hepatocellular carcinoma, and eventual liver failure [11]. Due to these complications, patients require liver and/or heart transplants around the age of 20 [12, 13].
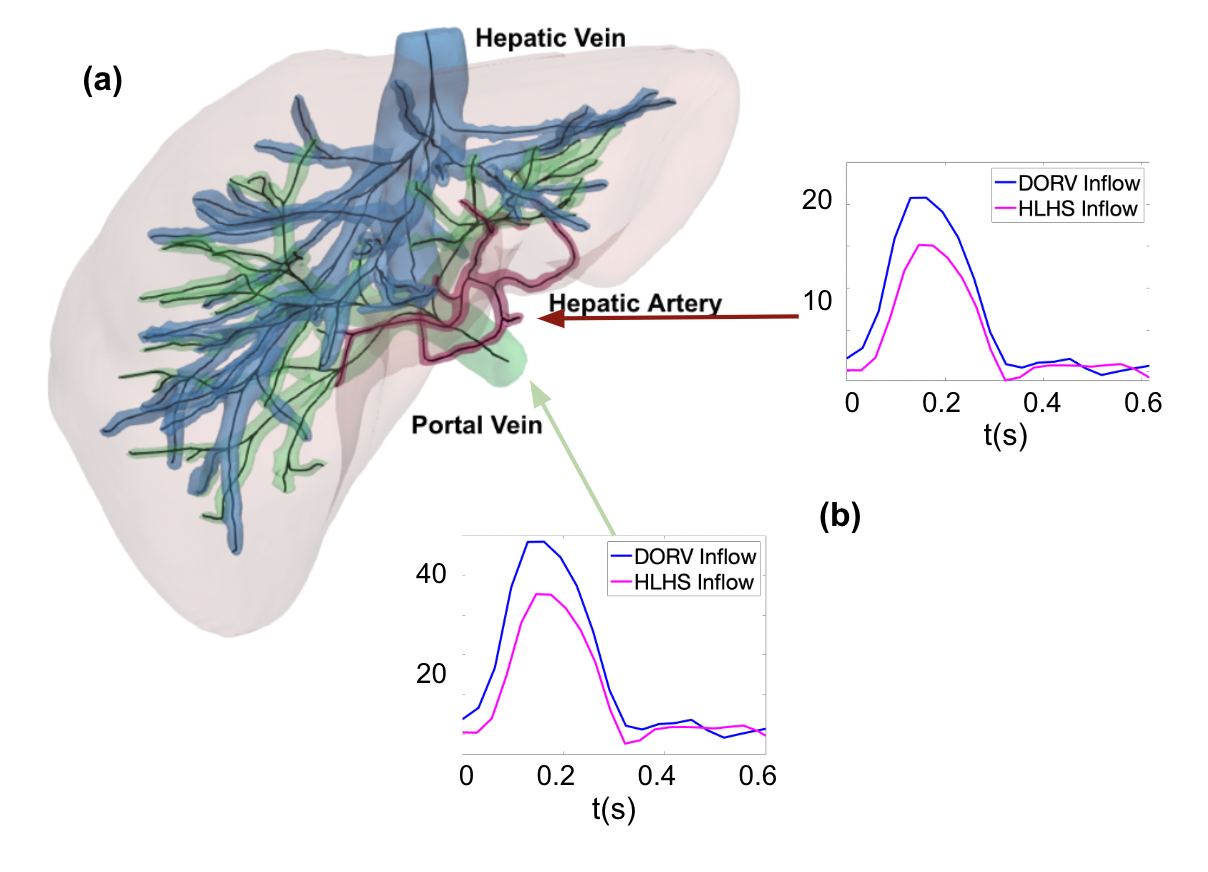
Blood enters the liver through two conduits and leaves through a singular outlet, making it a complex system to model. The hepatic artery, branching from the abdominal aorta, transports of blood into the liver [14, 15, 16]. The portal vein and hepatic artery systems have a significant pressure difference. The hepatic artery has a mean pressure of mmHg, and the portal vein has a mean pressure of mmHg [17]. Studies show that increased pressures of the portal vein or hepatic artery lead to liver damage such as cirrhosis, fibrosis, nonalcoholic fatty liver disease, and portal hypertension [18, 19]. Understanding the flow and pressure within the liver vasculature due to a Fontan circulation is vital to understanding the pathology of FALD and predicting its development.
FALD results from an increase in venous pressure in the portal vein caused by an increased central venous pressure (CVP) typical for this group of patients. Despite increased portal vein pressure, the pressure gradient is reduced, thereby reducing blood flow in the liver. The result is chronic systemic venous congestion and reduced cardiac output [20, 21, 22, 23].
FALD progresses through several stages before reaching a final, irreversible stage, where the main complications and breakdown of the circulatory system occur [24]. The initial stages of FALD are characterized by liver congestion and sinusoidal dilation. For most patients, this begins at birth and continues after Fontan surgery [25, 26, 27]. Although many patients remain without symptoms, eventually experience painful hepatomegaly or hepatojugular reflux due to reduced cardiac output [4]. The second stage of FALD involves perisinusoidal fibrosis, regenerative nodules, and hepatocellular necrosis, which occurs 5-10 years after surgery [4]. In most patients, the final stage involves advanced fibrosis with portal vein hypertension, leading to inadequate filtration of the blood within the liver [28, 4]. As FALD progresses, these complications lead to increased stiffening of the vasculature [29].
Currently, the underlying pathology and physiology of FALD are not fully understood. Most FALD studies are based on animal models or clinical data from patient cohorts with other chronic liver diseases [30]. Few studies focus on the pathology of FALD. A review by Cieplucha et al. [31] suggests that patients with HLHS develop FALD due to two factors: 1) permanent reduction in cardiac output and altered hemodynamics due to Fontan reconstruction, and 2) reduced oxygen delivery resulting from the aortic reconstruction. Several clinical studies suggest that passive flow in the Fontan circulation to the pulmonary system is analogous to a cardiovascular system with obstruction in the hepatic venous outflow [30, 32]. In a report by [29], elastographies of Fontan patients revealed that the longer a patient lives with a Fontan circuit, the stiffer their liver vasculature will be. However, it is unknown whether the increase in stiffness is due to increased congestion (i.e., elevated pressures in the liver) or the development of fibrosis.
Computational studies of the Fontan circulation are limited. Most computational studies use three-dimensional computational fluid dynamics (3D-CFD) to investigate velocity patterns and power dissipation [33, 34]. While this technique allows the assessment of complex velocity patterns, it is time-consuming and unrealistic for large-body network models. Moreover, most of these studies focus on the Fontan reconstruction rather than the effects of a Fontan circuit on downstream organs.
An alternative is one-dimensional fluid dynamics (1D-CFD) models. These models efficiently forecast wave propagation within extensive networks and can encompass fluid-solid interactions. For example, the study by [35] uses a 1D arterial and venous network with zero-dimensional heart and organ bed models to study variations in Fontan circulations, contrasting Fontan circuits with fenestration versus hepatic vein exclusion. This study indicates enhanced gut flow but did not consider the potential influence of vortices in bifurcations and reconstructed vessel segments. A recent study by Taylor-LaPole et al. [36] uses a patient-specific 1D-CFD network to predict the effect of aortic reconstruction in an HLHS patient compared to a double outlet right ventricle (DORV) control patient. This study finds that the HLHS patient has hypertensive pressures in the brain and reduced flow to the gut. These studies present promising large vessel networks of the Fontan circulation, but explore neither organ-specific networks nor the potential development of FALD.
Computational studies focusing specifically on liver disease in the Fontan circuit are scarce. The study by Trusty et al. [37] uses computational fluid dynamics simulations to quantify the total cavo-pulmonary connection and cross analyze to data from quantified liver biopsies. Although this helps determine effects within the constructed Fontan conduit downstream of the liver, it does not provide detailed information about the liver vasculature itself. The study by Ishizaki et al. [38] develops a vortex flow map to predict blood movement within the right atrium during the cardiac cycle. The study suggests that reduced vortex flow in the right atrium during the late phase of the Fontan operation is correlated with the development of FALD but does not include liver circulation in the model itself.
To our knowledge, no previous computational studies have analyzed the effect of aortic reconstruction on FALD hemodynamics while incorporating a detailed network of liver vasculature. To investigate the effects of a reconstructed aorta on the development of FALD, we compare an HLHS patient to a control single-ventricle patient with double outlet right ventricle disease (DORV). DORV is another congenital heart defect in which the pulmonary artery and aorta connect to the right ventricle. Patients also receive surgeries construct a Fontan circuit, but no surgical reconstruction of the aorta is performed [39]. To investigate the progression of FALD in a Fontan circuit, we impose increased vascular stiffness and resistance on the patient with HLHS, mimicking the effects of increased CVP. We compare liver perfusion between the patient with HLHS without FALD, the control patient with DORV, and the patients with HLHS and varying degrees of FALD. This is done using a 1D-CFD model predicting pressure, flow, and wall shear stress (WSS) in patients with HLHS and DORV. Our detailed liver network model allows us to investigate pressure changes and blood perfusion within the liver, providing new insight into hemodynamics in the liver of a Fontan circuit, including both arterial and portal vein circulations.
2 Methods
This study uses hemodynamic data from a previous study [36] along with computed tomography (CT) images of the liver to construct an arterial network of both the portal and hepatic vasculature. The liver image is from a representative adult male obtained from an open-access repository. Therefore, vascular dimensions were allometrically scaled as done in [36] to match the specific patients in this study. A 1D CFD model is solved within these networks to predict pressure and flow. The solution is mapped to the liver tissue providing insight into tissue perfusion and distributions of pressure. FALD is simulated in patients with aortic reconstruction by increasing downstream resistance, thus inducing increased CVP.
2.1 Data and Image analysis
A CT image of the liver region of an adult male volunteer with tumors in the pancreas is used to construct a 3D representation of the vasculature [40]. We assume that the liver vasculature is normal and is not affected by the tumor. The image can be found in the publicly available 3D-IRCADb-01 database (see https://www.ircad.fr/research/data-sets/liver-segmentation-3d-ircadb-01/). From this image, we extract vascular networks distal to the hepatic artery and the portal vein.
Segmentations of the hepatic artery and portal vein networks are generated using the open-source software 3D Slicer developed by Kitware, Inc. (see http://www.slicer.org) [41, 42]. Using built-in tools from 3D Slicer, including painting, thresholding, cutting, and islanding, a 3D rendering of the arterial and portal vein networks is obtained. The image intensities for the hepatic artery and portal vein segmentations are set to 28.05-255.00 Hounsfeld units. These segmentations are exported as STL files from 3D Slicer and imported to Paraview [43], where they are converted to a VTK polygonal data file for further processing. The liver volume is also segmented. The volume is segmented in the same fashion as the vasculature, with image intensity set to 64.00-255.00 Hounsfeld units. The resulting segmentation is exported as an STL file and opened in Paraview, where it is converted to a volumetric mesh and saved as a csv file storing the coordinates of the tissue.
We utilize the Vascular Modeling Toolkit (VMTK) to generate centerlines in 3D renderings of the hepatic artery and portal vein network [44]. This software places maximum inscribed spheres at each coordinate of the vessels and approximates the medial axis with a Voronoi diagram [44, 45]. Centerlines are determined as the minimal paths along the inverse of the spheres’ radii [44]. Inlet and outlet boundaries are manually set, and VMTK works recursively from the terminal to the proximal vessel(s), generating centerlines.
Labeled Directed Graph We use in-house algorithms in MATLAB to extract network information from VMTK and construct a labeled directed tree with edges defining vessels, nodes, and junctions. Each vessel has labels that denote its radius and length [46, 47]. VMTK defines the points of centerlines as , , and coordinates along each vessel. The locations at which two central lines interact are junctions. They are adjusted to appear in the ostium’s center using the junction correction algorithm by Bartolo & Taylor-LaPole et al. [48]. The vessel and its labels are integrated into a directed tree, defining a connectivity matrix that connects the vessel to its parent and daughters. Optimal vessel dimensions, i.e., radii and length, are determined using an in-house algorithm utilizing statistical changepoints [48].
Hemodynamics Data Approximately 25% of cardiac output enters the liver [14, 16]. The inflow to the liver is determined by scaling the measured cardiac output [36] to this amount. The DORV patient has a total hepatic inflow of 1.05 L/min and the HLHS patient has an inflow of 1.27 L/min. Of these, 70% enters through the portal vein and 30% through the hepatic artery. Figure 1 shows the scaled inflow waveforms, and Table 1 lists the flows for each patient.
| HLHS | DORV | |
|---|---|---|
| Total cardiac output | 5.08 | 4.06 |
| Portal vein inflow | 0.89 | 0.74 |
| Hepatic artery inflow | 0.39 | 0.31 |
2.2 One Dimensional Fluid Dynamics Model
Similarly to [46, 36, 49, 48], we predict pressure (mmHg), blood flow (mL/s), and area deformation (cm2) in each vessel within the portal vein and hepatic artery vasculatures using a 1D fluid dynamics model. The model is derived from the Navier-Stokes equations, which assume that blood flow is axisymmetric and Newtonian. We also assume that blood is incompressible, viscous, and homogeneous with constant density , and that each vessel can be represented by a cylinder with an impermeable wall. Under these assumptions, mass conservation and momentum balance are governed by
| (1) | ||||
| (2) |
where is the axial position within the vessel, (cm) is the radius, (g/cm/s) is the viscosity, and (cm2/s) is the kinematic viscosity.
We impose a flat velocity profile with a linearly decreasing boundary layer with thickness (cm) [50, 51, 52, 49], where (s) is the length of the cardiac cycle.
| (3) |
In this equation, denotes the axial velocity and is the axial velocity at the center of the vessel. This system of equations is closed via a pressure-area relationship modeled as a linear elastic membrane
| (4) |
where (g/cm/s²) is Young’s modulus, (cm) is the vessel wall thickness, (mmHg) is the reference pressure, (cm) is the inlet radius, and (cm²) is the cross-sectional area when the pressure equals its reference value [53]. We assume that the vessels become stiffer as they get smaller (equation (4), where (g/cm/s2), (1/cm), and (g/cm/s2) are constants obtained from literature values [47, 54, 36].
The system is hyperbolic, so boundary conditions are required at the inlet and outlet of each vessel. At the inlet of the portal vein and hepatic artery, we assign a waveform as described above. At the junctions, we impose mass conservation and pressure continuity by
| (5) | ||||
| (6) |
where is a parent vessel and and are daughter vessels. Similarly to previous studies [46, 36, 49, 48], we solve the model using the two-step Lax-Wendroff finite difference scheme using.
At the outlet of the terminal vessels, we use a structured tree boundary condition prescribing flow to the small vessels in the vascular bed [55, 49, 36, 56]. Equations in the structured tree are obtained semianalytically by solving a linearized wave equation ignoring inertial forces, which is appropriate since viscous forces are dominant in small vessels.
The resulting wave equations stated in the frequency domain, described in detail in [49], are given by
| (7) |
where denotes the wave propagation velocity [49]. The function is a function of and , the zeroth- and first-order Bessel functions, and is the vessel compliance. Solving the equation for flow and pressure , we get
| (8) | ||||
| (9) |
In this equation and are integration constants [36, 47, 49, 48].
Similar to large vessels, we enforce pressure continuity and flow conservation at junctions as
| (10) |
where , and are the impedance values of the parent and daughter vessels. At the end of the structured tree, we assume that the terminal impedance at the end of the structured tree is zero. The equations in this tree are solved recursively for each vessel, predicting the impedance at the beginning of the vessel as a function of the impedance at the root of the vessel. The impedance at the root of the structured tree is transformed to the time domain by convolution. Following Riemann invariants, the root impedance forms the outflow boundary condition for large vessels.
2.3 Wall Shear Stress Approximation
Wall shear stress (WSS), the stress the fluid exerts on the vessel wall, is denoted by (g/cm/s²). With results from flow and area predictions, we approximate the WSS for selected vessels in the portal vein and hepatic artery vasculatures (vessel numbers 0, 54, 58, 69 in the portal vein vasculature and 0, 13 in the hepatic artery vasculature) using the Stokes boundary layer given in Equation 3 with
| (11) |
| (12) |
where is blood viscosity, and is the boundary layer thickness [36, 48].
| Parameter | Healthy HLHS | Early FALD | Late FALD | DORV | ||||
|---|---|---|---|---|---|---|---|---|
| PV | HA | PV | HA | PV | HA | PV | HA | |
| (g/cm/s2) | 2e+6 | 2e+6 | 2e+6 | 2e+6 | 2e+6 | 2e+6 | 2e+6 | 2e+6 |
| (g/cm/s2) | -25 | -35 | -25 | -35 | -25 | -35 | -25 | -35 |
| (g/cm/s2) | 3e+5 | 3.04e+5 | 3.6e+5 | 3.6e+5 | 4.2e+5 | 4.3e+5 | 3e+5 | 3e+5 |
| (g/cm/s2) | -25 | -35 | -25 | -35 | -25 | -35 | -25 | -35 |
| (g/cm/s2) | 0.40 | 0.33 | 0.34 | 0.40 | 0.33 | 0.34 | 0.34 | 0.29 |
| (g/cm/s2) | 3e+5 | 3.04e+5 | 3.6e+5 | 3.6e+5 | 4.2e+5 | 4.3e+5 | 3e+5 | 3e+5 |
| (mmHg) | 7.7 | 75 | 7.7 | 75 | 7.7 | 75 | 7.7 | 75 |
| (g/cm/s2) | 0.615 | 0.615 | 0.615 | 0.615 | 0.615 | 0.615 | 0.658 | 0.658 |
| (cm) | 0.01 | 0.01 | 0.005 | 0.005 | 0.005 | 0.005 | 0.01 | 0.01 |
| Parameter | Value |
|---|---|
| (g/cm3) | 1.057 |
| (g/cm/s) | 0.032 |
| 0.90 | |
| 0.60 | |
| 50 |
2.4 Perfusion
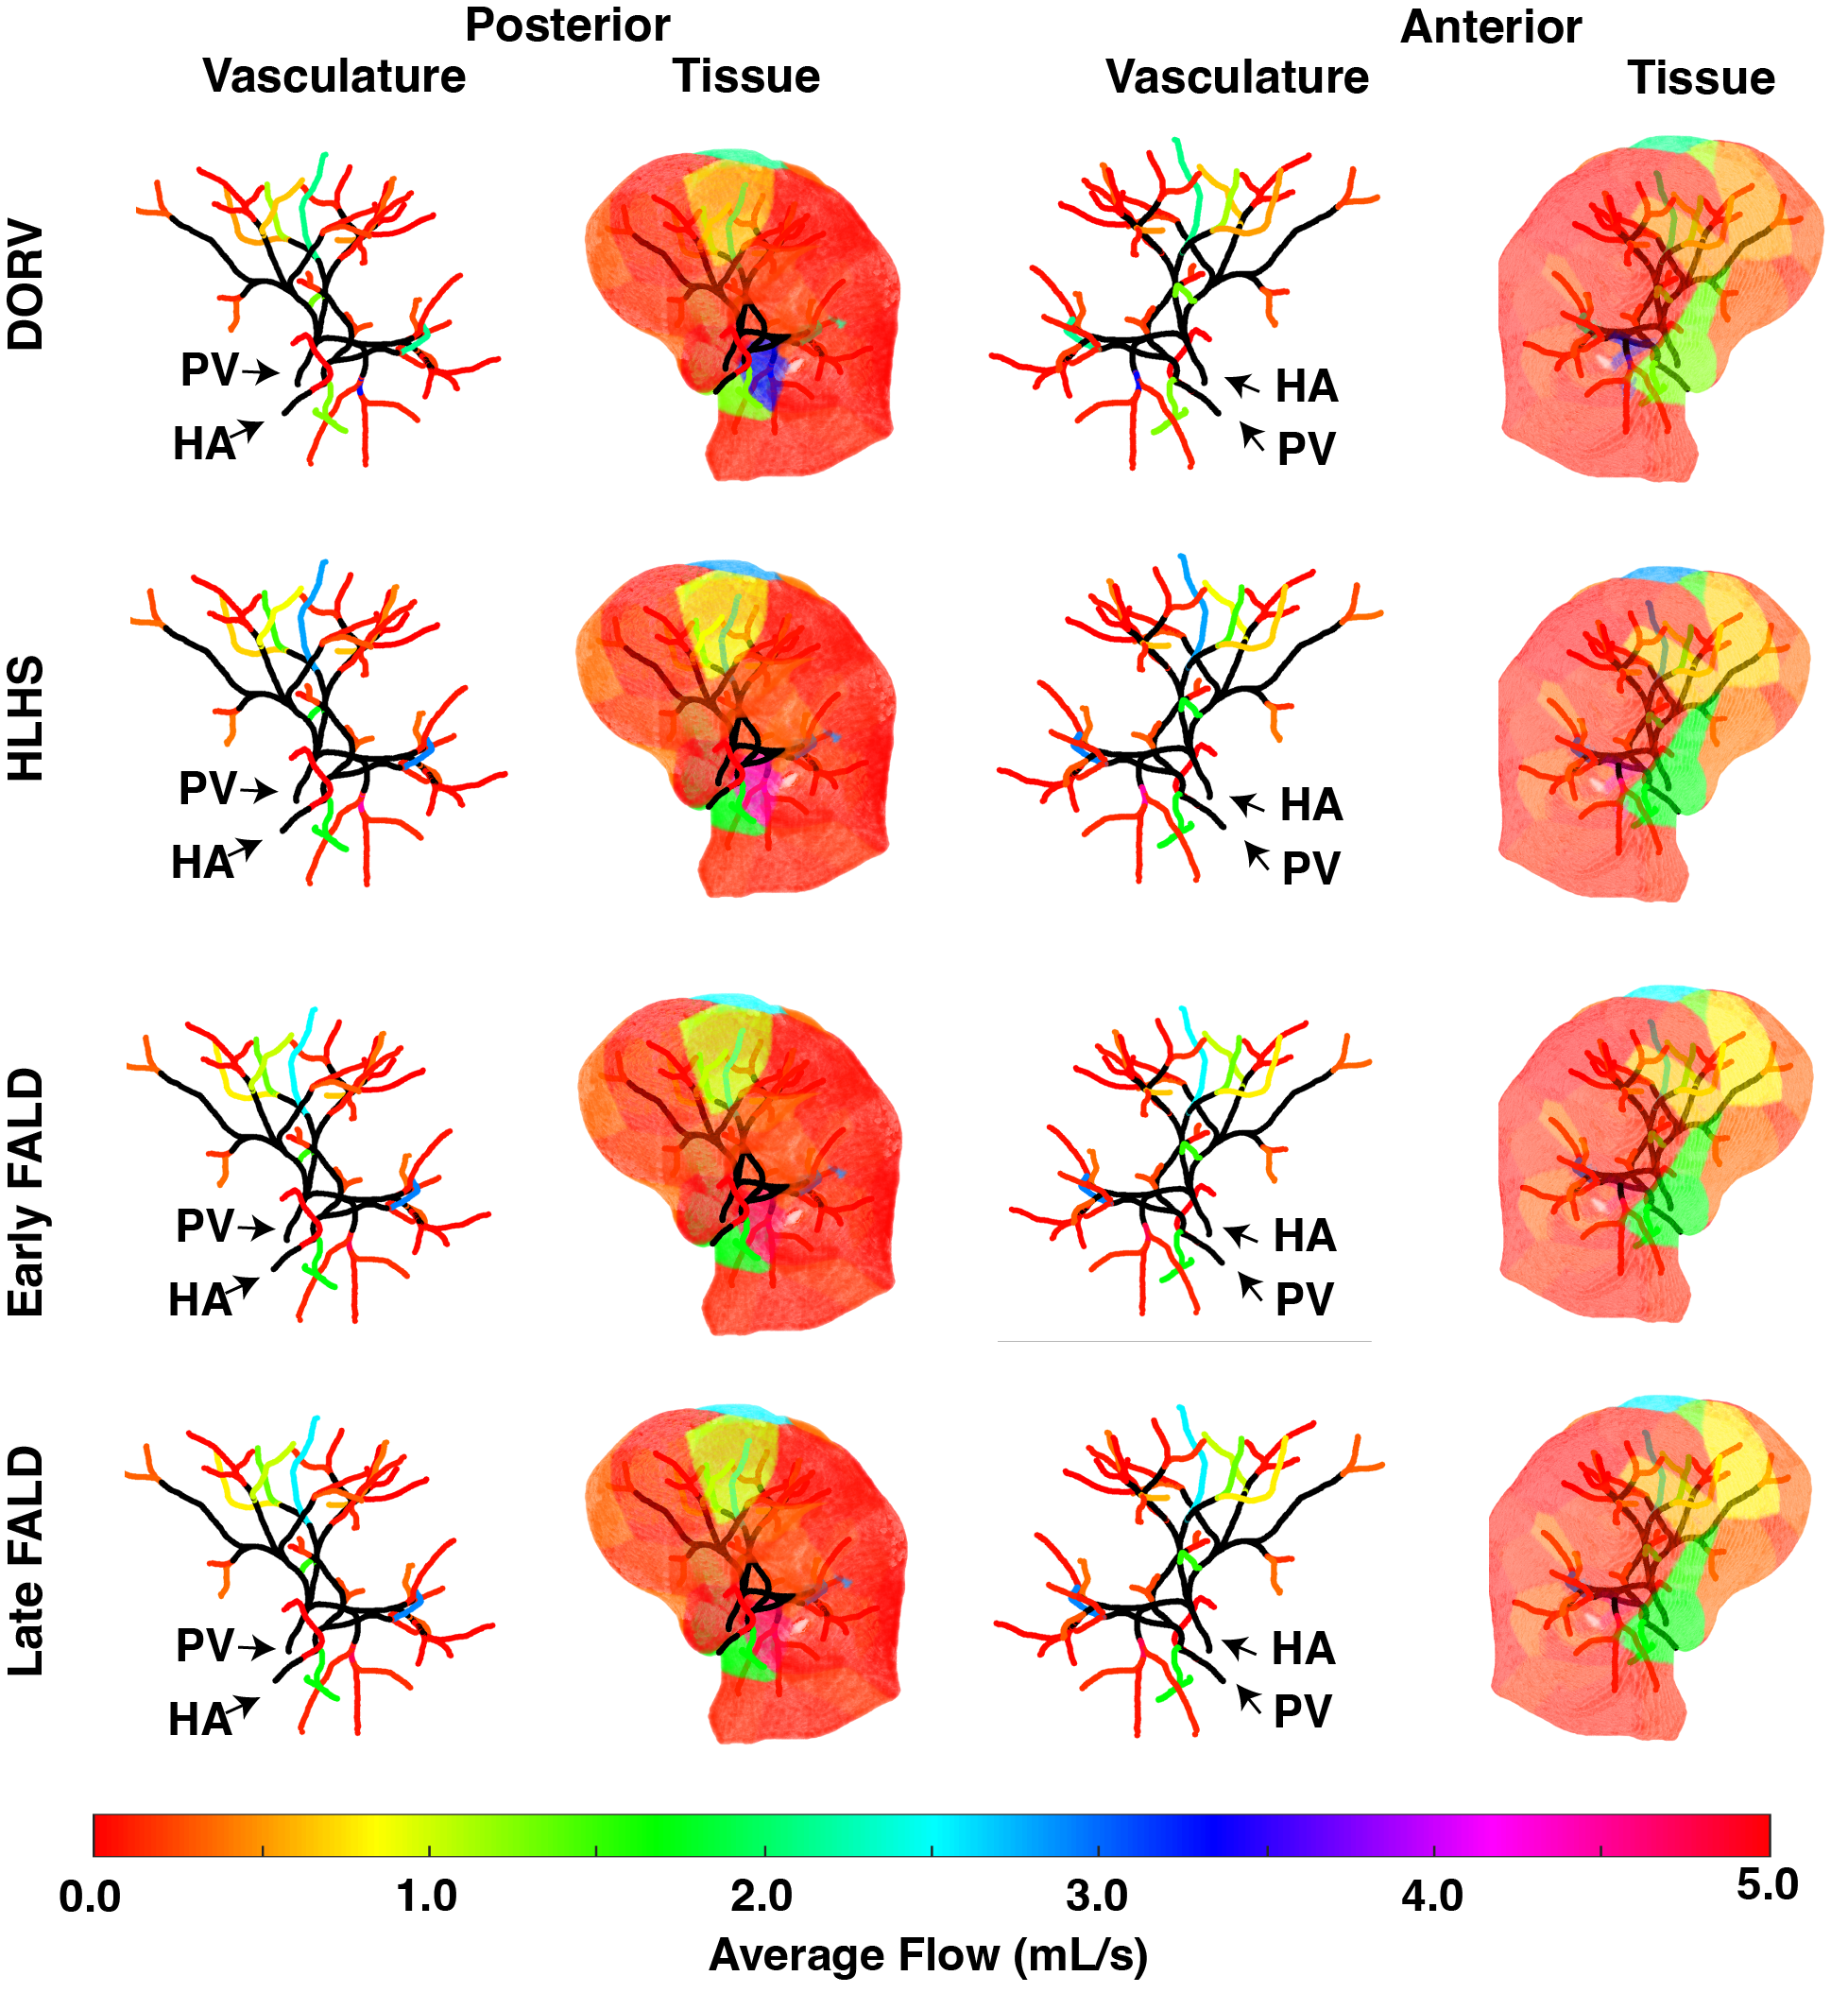
The perfusion and pressure distribution is determined by mapping the 1D flow and pressure predictions from the vessels’ terminals to the liver volume [57]. The end of each terminal vessel is denoted by the coordinate extracted from the centerlines. Each of these points is assigned the mean flow and pressure from the vessel in question. The flow and pressure are distributed to the volume using Matlab’s nearest-neighbor algorithm, providing a 3D representation of blood perfusion and pressure distribution in the liver. To accurately compare differences between patients with different inflows, the flow at the terminals of the hepatic and portal networks are normalized by the average inlet flow of the DORV patient.
To quantify the differences in distributions between patient types, the Kullback-Leibler (KL) divergence is computed 7. The KL divergence measures the relative entropy between two probability distributions. We construct both flow and pressure probability distribution functions (PDFs) and determine the following:
| (13) |
where is the “true” distribution. We assume the DORV flow and pressure PDFs to be true as they have not undergone aortic reconstruction, and to compare degrees of FALD, we let the HLHS flow and pressure PDFs be the true distribution. is the distribution of the HLHS patient, the patient with early FALD, and the patient with severe (late) FALD. and are defined on some probability space, . Identical distributions can be inferred if . Increasing values of indicate a greater mismatch between and .
2.5 Simulations
We simulate liver hemodynamics for the DORV and HLHS networks. To mimic FALD in the HLHS patient, we increase the vascular stiffness in both large and small vessels. For each network, the inflow propagates downstream through the large vessels of the respective portal vein and hepatic artery systems. We define four patient types,
-
•
a control DORV patient,
-
•
an HLHS patient labeled “healthy HLHS”,
-
•
an HLHS patient with early FALD progression, and
-
•
an HLHS patient with late FALD progression.
2.5.1 HLHS vs. DORV
To predict the liver hemodynamics in each patient, we calibrate the models using the dimensions in Table 2 and Table 3. We manually tune the nominal stiffness parameters of the large vessel for each patient to generate flow waveforms and pressure predictions that match both the data of the imaged region and previous studies [49, 58].
2.5.2 FALD Simulation
Patients with liver cirrhosis experience increased vessel stiffness due to alterations in the composition of the extracellular matrix (ECM) [59, 60]. To predict the change in hemodynamics in the diseased patient under the development of FALD, we simulate a liver diseased with FALD by increasing downstream vascular resistance. We increase the parameter , resulting in a stiffness of 3.0 x 10 6(g/cm/s2) in the portal vein and 1.0 x 10 6(g/cm/s2) in the hepatic artery. Furthermore, we decrease the outlet boundary condition to cm to further increase the resistance.
3 Results
We compare the flow and pressure predictions of a DORV, HLHS, and simulated HLHS patient with FALD to investigate differences in hemodynamics. Our results show that the HLHS patient has higher portal vein pressures than the DORV patient and that pressure reaches hypertensive levels under FALD conditions. We see that WSS is higher in the HLHS patient and increases with FALD. The perfusion plots show that the DORV patient has more evenly distributed flow throughout the tissue. It also shows a change in the flow distribution as FALD conditions increase.
3.1 Pressure and flow
Portal vein. Table 4 shows the predicted pressure and flow in the portal vein network. The average pressure is calculated as the mean pressure during the cardiac cycle. The HLHS patient has a higher systolic pressure, pulse pressure, and average flow than the DORV patient. In patients with simulated FALD HLHS, systolic pressures and pulse pressures increase significantly. The average flow remains the same as we did not alter the amount of blood entering each network.
| Healthy HLHS | Early FALD | Late FALD | DORV | |
|---|---|---|---|---|
| Systolic Pressure (mmHg) | 17.91 | 20.19 | 22.9 | 16.29 |
| Diastolic Pressure (mmHg) | 4.76 | 3.72 | 2.24 | 4.25 |
| Pulse (mmHg) | 13.14 | 16.46 | 20.68 | 12.04 |
| Average Pressure (mmHg) | 10.73 | 10.90 | 10.93 | 10.20 |
| Average Flow (mL/s) | 15.85 | 15.85 | 15.85 | 11.85 |
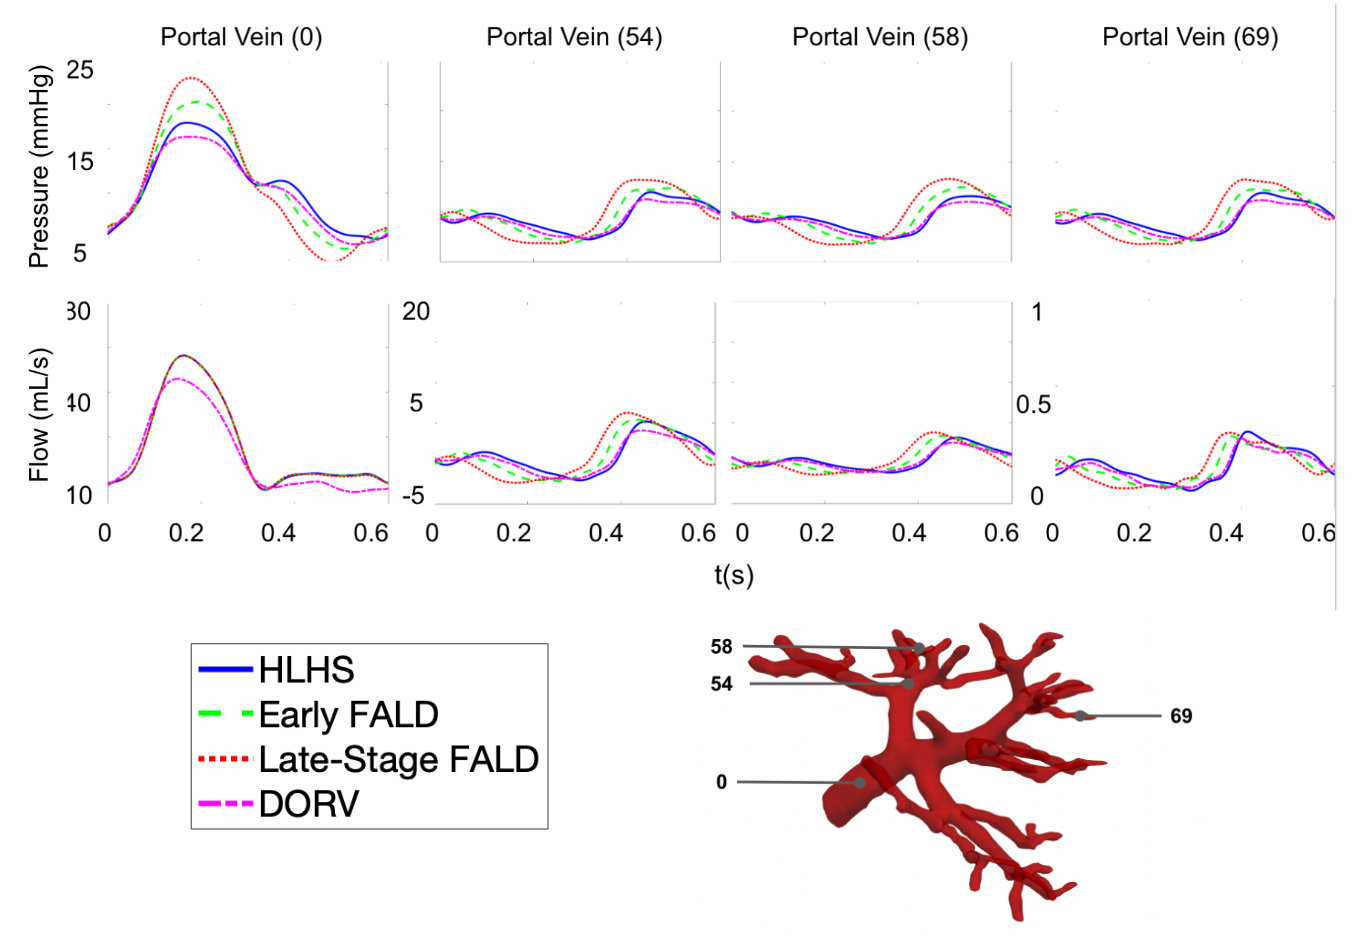
To analyze the change in pressure and flow in specific vessels, we selected four representative vessels (0, 54, 58, 69) in the portal vein vasculature for visual comparison.
The pressure and flow of the inlet vessel (vessel 0) differ significantly between the two patients. The DORV patient has smaller reflective waves than the HLHS patient, and the magnitude and frequency of the reflective waves increase with the severity of FALD. The incident pressure wave becomes steeper and the increase in wave speed causes the reflected wave to coincide with the systolic peak; as a result, the pressure wave loses the dicrotic notch as FALD progresses.
Hepatic Artery
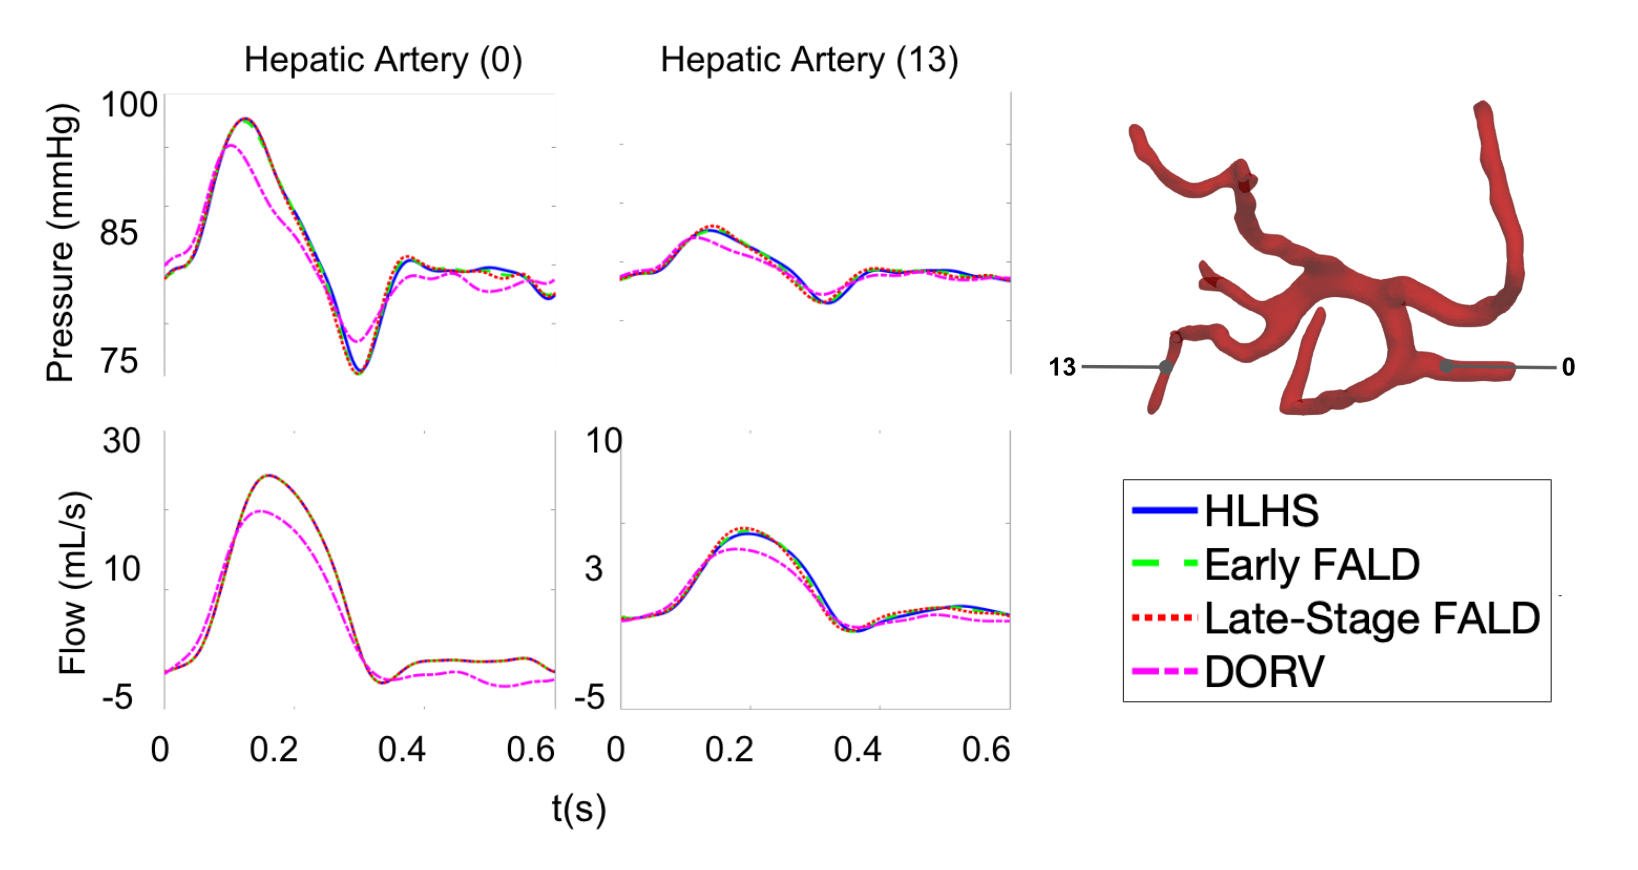
A similar analysis is performed for the hepatic artery network. Table 5 shows the predicted pressure and flow in the hepatic artery network. The HLHS patient has a higher systolic and pulse pressure compared to the DORV patient. However, there is no significant change in pressures under FALD conditions for the HLHS patient.
We selected two representative vessels (0, 13) in the vasculature of the liver artery to compare flow and pressure predictions between patients 4. Vessel 0 is the hepatic artery, the network’s root vessel, while vessel 13 is a terminal vessel. The pressure curves are steeper in the HLHS patient, with no significant changes as FALD is imposed. The flow curves change slightly under FALD conditions, with late-stage FALD shifting the peak of the curve to a somewhat earlier time in the cardiac cycle and presenting a higher maximum flow.
| Healthy HLHS | Early FALD | Late FALD | DORV | |
|---|---|---|---|---|
| Systolic Pressure (mmHg) | 100.14 | 99.87 | 100.02 | 97.30 |
| Diastolic Pressure (mmHg) | 74.64 | 74.28 | 74.33 | 77.56 |
| Pulse (mmHg) | 25.50 | 25.59 | 25.69 | 19.73 |
| Average Pressure (mmHg) | 86.36 | 86.30 | 86.25 | 85.62 |
| Average Flow (mL/s) | 6.79 | 6.79 | 6.79 | 5.08 |
3.2 Wall Shear Stress Approximation
WSS approximations for the hepatic artery and portal vein vasculatures are shown in Table 6. The WSS of the DORV patient is lower in all vessels compared to the HLHS patient.
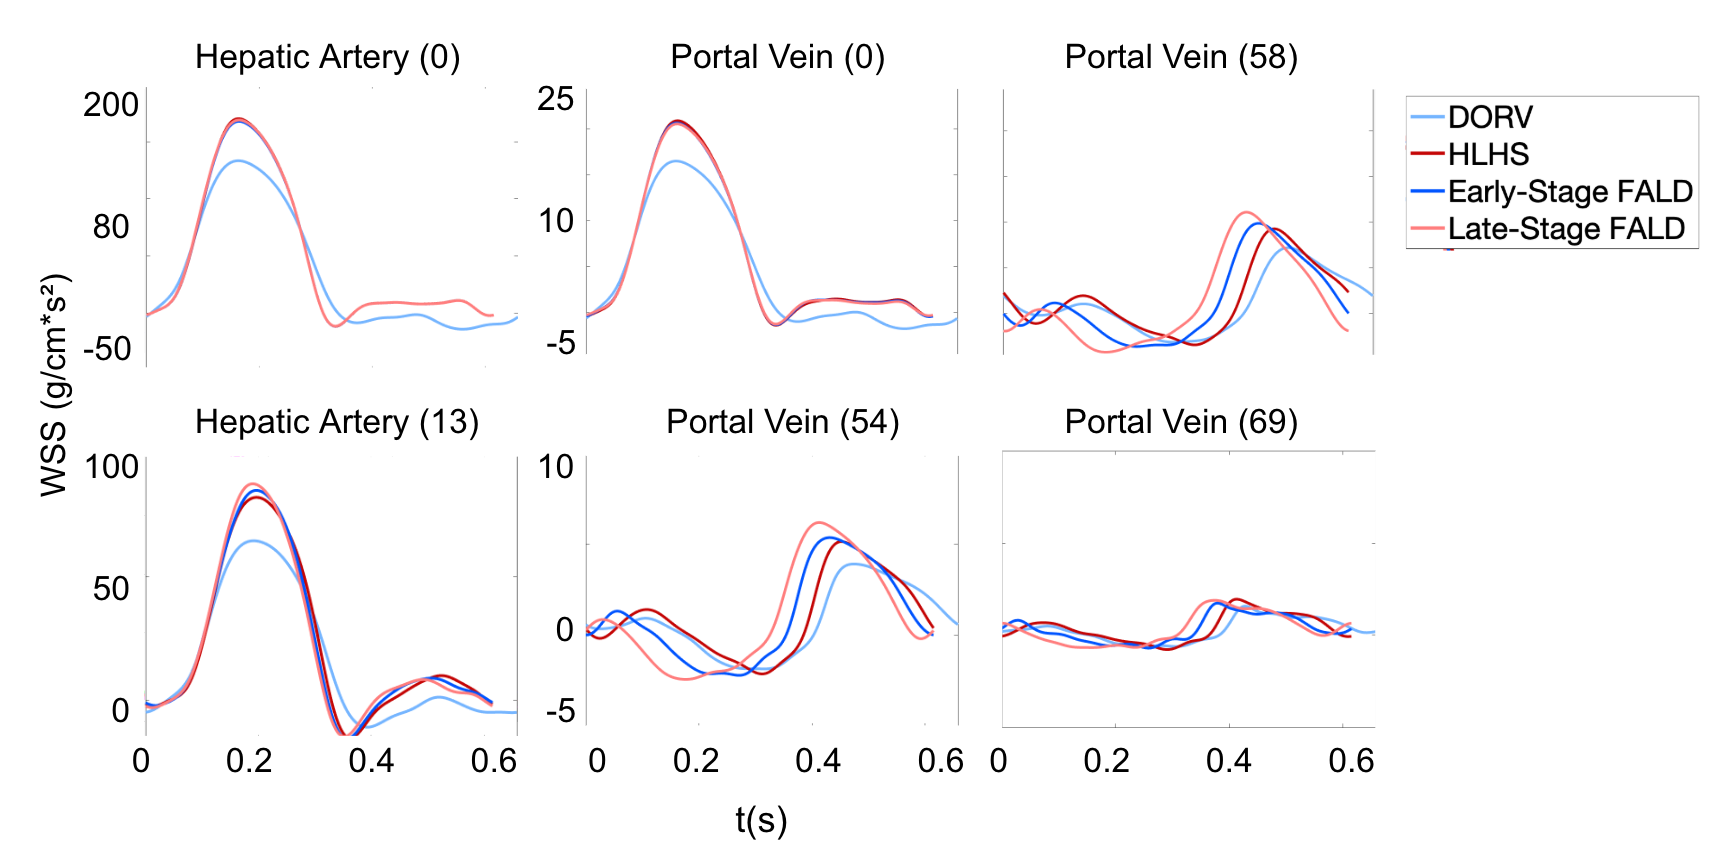
Graphical representations of WSS over one cardiac cycle at the midpoint of the six previously selected vessels are shown in Figure 5. Inlet vessels (vessel 0) of both vasculatures show the most significant difference in WSS between patients. The HLHS patient not only has higher mean WSS values, but the maximum WSS within all vessels is greater than the DORV patient. These values increase with the degree of FALD. The peak of the WSS curve also shifts earlier in the cycle with increasing FALD progression.
| Healthy HLHS | Early FALD | Late FALD | DORV | |
|---|---|---|---|---|
| Hepatic Artery (0) | 48.16 | 47.92 | 48.17 | 34.53 |
| Hepatic Artery (13) | 22.12 | 22.04 | 21.90 | 15.72 |
| Portal Vein (0) | 5.95 | 5.91 | 5.90 | 4.27 |
| Portal Vein (54) | 1.02 | 0.98 | 0.98 | 0.74 |
| Portal Vein (58) | 1.45 | 1.31 | 1.32 | 1.04 |
| Portal Vein (69) | 0.40 | 0.33 | 0.34 | 0.29 |
3.3 Perfusion
| Healthy HLHS | Early FALD | Late FALD | ||
|---|---|---|---|---|
| DORV | Flow | 124.5 | 38.6 | 146.7 |
| Pressure | 22.1 | 55.4 | 83.7 | |
| HLHS | Flow | 207.7 | 344.2 | |
| Pressure | 37.5 | 76.4 |
Perfusion plots (shown in Figure 6) are included to visualize the flow distributions within the liver. The plots reveal differences in blood flow to the top and center of the liver. The healthy HLHS patient has the highest amount of perfusion to the top of the liver (light blue color), and as FALD increases, the amount of flow to this region decreases. However, perfusion increases slightly in the posterior and upper part of the liver as FALD increases. Both DORV and HLHS patients have the highest perfusion at the bottom center of the liver (purple region in DORV, pink in HLHS). Overall, the DORV patient has a more evenly distributed flow throughout the tissue.
KL divergence is calculated to quantify the difference between the flow distributions (Table 7). When comparing HLHS patient types to the control DORV, the flow is more similar to the DORV patient in the early FALD HLHS patient. The most significant flow differences are observed in the late FALD HLHS patient. Comparing the healthy HLHS patient with FALD-induced HLHS patients shows that differences are exacerbated as the severity of FALD increases.
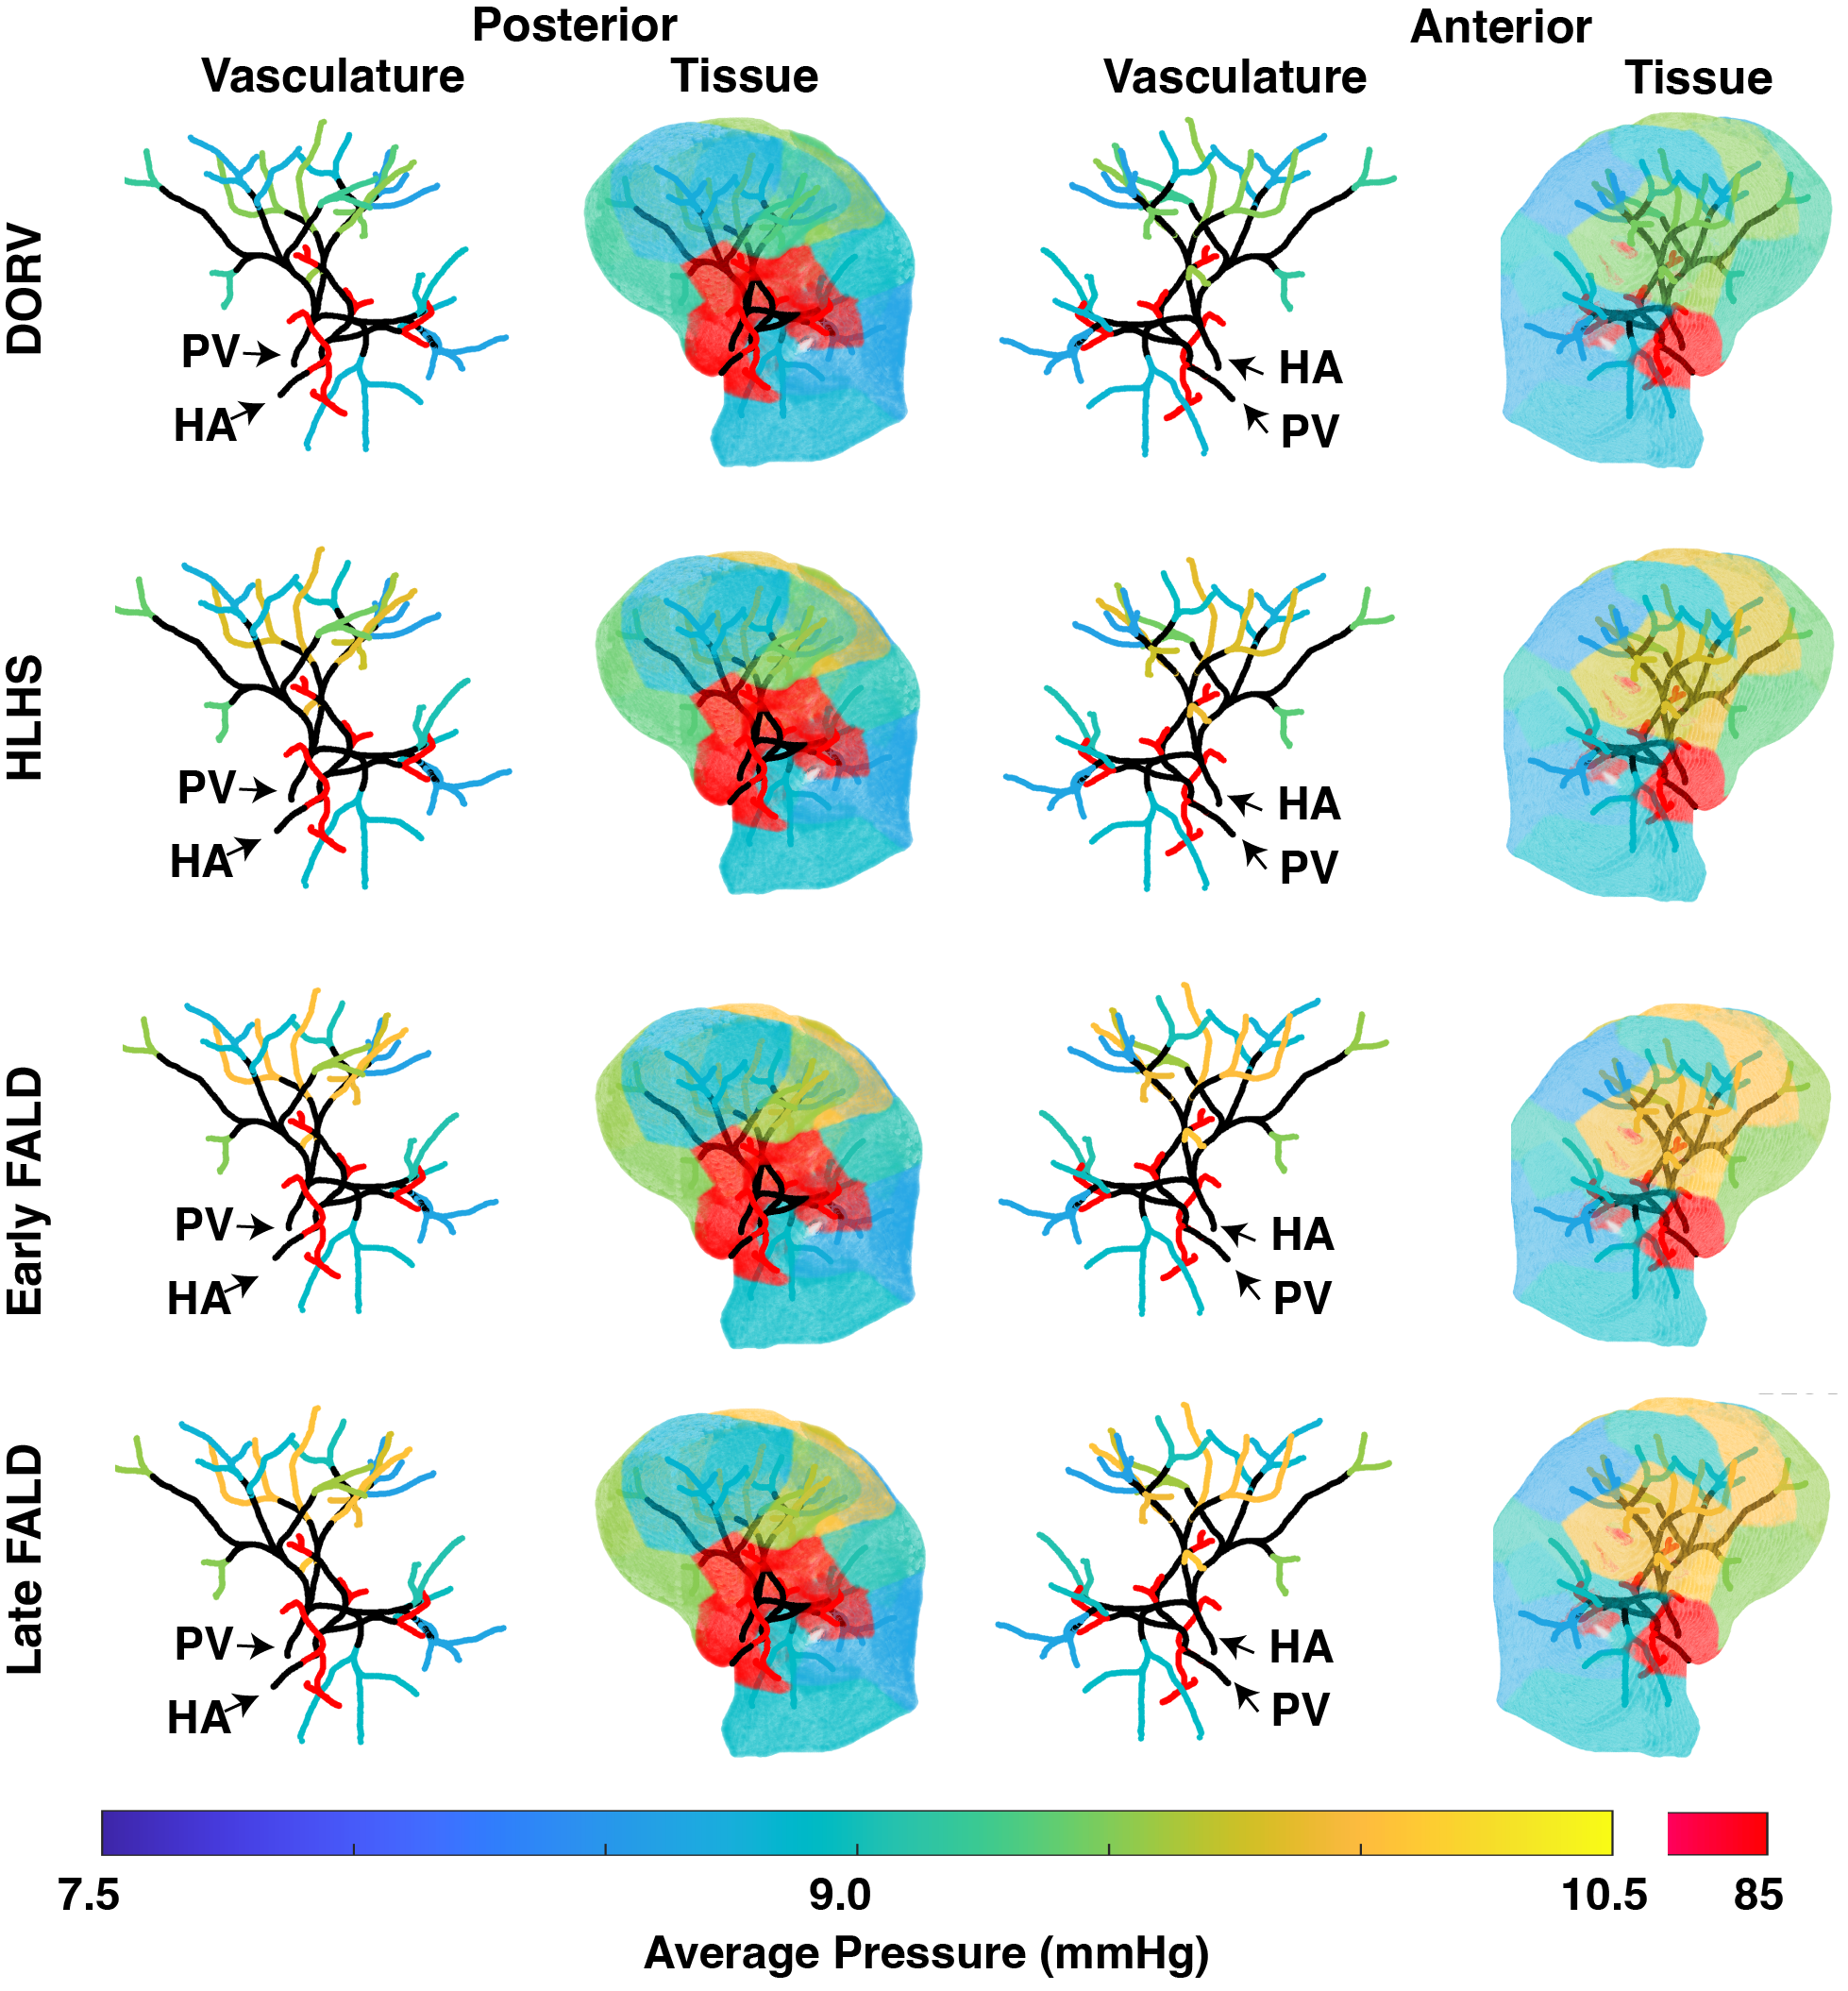
The corresponding pressure distributions are shown in Figure 7. Similarly to flow, results are shown from the posterior and anterior angles. The hepatic artery network transports blood at a significantly higher pressure than the portal vein network. Differences with increased severity of FALD are more pronounced for pressure than flow. There is an increase in pressure in the portal vasculature of patients with HLHS compared to that of the DORV patient. This slight increase suggests that the pulse pressure is also increasing. Increases in pulse pressure, even incremental increases as seen here, indicate that patients may be entering hypertensive levels. Changes in the hepatic network at the terminals are negligible and range from to mmHg.
KL divergence values (Table 7) show that the pressure distribution is similar between the healthy patient with HLHS and the DORV patient, while increasing the severity of FALD leads to a more significant mismatch in the pressure distribution throughout the tissue. The same trend is seen when comparing FALD-induced patients with healthy HLHS patients. As FALD increases, KL divergence values increase, showing more significant differences in pressure distributions.
4 Discussion
In this study, we construct a detailed model of the liver vasculature to explore the hemodynamics of patients with HLHS and DORV. We also impose FALD conditions on the HLHS patient to predict pressure and flow under FALD progression. Results show that the HLHS patient has higher pressure than the DORV patient in the portal and hepatic networks. These values reach hypertensive ranges when FALD is imposed. WSS is also higher for HLHS patients, also increasing with FALD severity. The increased WSS is an indicator of vascular remodeling and contributes to the development of fibrosis [61]. The perfusion and pressure distribution plots show the increased pressure changes with increasing levels of FALD, giving insight into regions of tissue that will be affected by vascular remodeling and fibrosis development due to this increase in pressure.
4.1 Flow and Pressure
Pressure and flow predictions are generated in both hepatic and portal networks. This is a unique contribution of this study in that it considers both inlet networks. The patient parameters are chosen based on a study by Taylor-LaPole et al. [36], and the patient input waveforms are generated using data from the above research.
Model predictions produce a higher average portal venous and hepatic artery pressure for the HLHS patient, as shown in Tables 4 and 5. Although there is no significant variation in the average pressure, there is a significant increase in the predicted systolic and pulse pressure when FALD is imposed, and these values enter hypertensive conditions [62]. The increase in pulse pressure is an indicator of increased arterial stiffening [63]. Portal hypertension and arterial stiffening is a key characteristic of FALD, often associated with the development of fibrosis [11]. Although many patients do not present outward symptoms of FALD until an irreversible stage (i.e., organ failure, liver transplant required), the model is designed to capture the degree of portal hypertension within Fontan patients. Portal hypertension indicates vasculature remodeling, fibrotic development, and venous congestion. It is considered a multiorgan disorder associated with abnormal hemodynamics in the systemic and portal vasculatures [64].
There is no significant change in pressure and flow under FALD conditions in the hepatic artery. This may be caused by the hepatic arterial buffer response (HABR), an intrinsic regulation of hepatic arterial blood flow [65]. Our result agrees with the study by [66], suggesting that HABR is preserved even in patients with advanced cirrhosis with significant portal hypertension. It is also important to note that our model predictions for the hepatic network are consistent with those from the full body network of the same DORV and HLHS patients in the study by Taylor-LaPole et al. [36].
4.2 Wall Shear Stress
The HLHS patient has higher WSS values than the DORV patient, as shown in Table 6. The higher WSS may indicate increased fibrosis and vascular remodeling [61, 67]. As discussed in Taylor-LaPole et al., increased WSS in the HLHS patient is not uncommon, as patients with reconstructed aortas tend to have increased WSS values downstream of surgical reconstruction due to vascular remodeling [36, 68]. Our results for the hepatic network can be confirmed by the study by Taylor-LaPole et al. [69], where the WSS for single-ventricle patients continues to increase with decreasing radius. The results in the portal network closely resemble the results obtained by Bartolo et al. [70] in the pulmonary vasculature. Although the portal vein is systemic, its pressure values and physiology closely resemble the arteries within the pulmonary vasculature. A study by Voges et al. [68] found that patients with reconstructive aortic surgery will have downstream vessels try to dilate in the years following surgery to compensate for the decrease in cardiac output. This dilation increases the WSS, which is consistent with the findings in our analysis.
Our predictions show that WSS decreases slightly as the severity of FALD increases. The decrease in WSS is more prominent in smaller downstream vessels. Decreased WSS from a patient’s norm is indicative of increased hypertension and continued stiffening of the vessel wall. An experimental study by Traub et al. [71] found that low WSS is correlated with the upregulation of vasoconstrictive genes. This upregulation leads to increased vascular modeling, fibrosis, and hypertension [72].
4.3 Perfusion
The perfusion plots reveal that the DORV patient has a more uniform flow distribution throughout the liver tissue than the HLHS patient. For the healthy patient with HLHS, most blood goes to the upper and lower regions of the liver. As FALD progresses, flow in these regions is reduced while flow increases in the upper-center of the liver (yellow/green region). These differences in blood delivery are confirmed with increasing KL divergence values as FALD conditions increase. This is indicative of vascular remodeling in small downstream vessels [73]. It is important to note that blood flow changes occur in tissue regions fed by the portal network. This change in flow, most likely the result of vascular remodeling, is a direct response to portal hypertension as the body tries to relieve downstream resistance in regions of the liver that develop fibrosis [74]. Although this change in flow can reveal indicators of FALD progression, it is not routine practice to monitor blood flow within the liver until patients develop severe outward symptoms. CT and ultrasound are most commonly used to monitor the development of fibrosis [24]. This demonstrates the importance of the mathematical model from which blood distribution in the liver can be detected to provide clinicians with information if more investigation or intervention is required.
The most common indicator of advanced FALD is portal hypertension [24]. The plots showing the pressure distribution demonstrate the pressure differences in specific tissue regions between patient types. The DORV patient has the most consistent pressure distribution throughout the tissue, with very slight differences in the pressures in the tissues fed by the portal network. The pressure in these portal regions increases in the healthy HLHS patient. The left posterior side of the liver has an increase in pressure, and the upper center portion of the anterior side. These regions continue to increase in pressure, reaching hypertensive values as FALD severity increases. As mentioned above, portal hypertension leads to fibrosis. Fibrosis increases downstream resistance, creating a cycle of continual increasing pressures and reduced blood flow [24].
5 Limitations
Our study is the first to use a 1D-CFD to study the pathology of FALD. The computational efficiency of the 1D model employed in this study facilitates a rapid calibration process with clinical data. Our structural tree allows us to predict flow across the entire portal and the hepatic vascular network, which includes vessels beyond the imaged area.
Since our model is one-dimensional, we cannot predict the hemodynamics on different sides of the portal vein and hepatic artery walls. This is relevant because sclerosis could occur, especially when the WSS is low in one area of the vessel [75]. We plan to incorporate a 3D-CFD model in the large portal vein and hepatic artery vessels with our hemodynamic data and liver model in future studies. A description of energy loss can be included in the 1D model, as was done in several previous studies [47, 76]. As discussed by Taylor-LaPole et al. [36], we can incorporate an energy loss model that could be calibrated by comparing 1D and 3D simulations. For example, using a 3D fluid-structure interaction (FSI) model applied to the reconstructed aorta [77], or by identifying potential areas of secondary flow directly from Four-Dimensional Magnetic Resonance Imaging (4D-MRI) data.
Another limitation is the closed-loop nature of this model. We have limited our study to the liver vasculature, neglecting the upstream network that begins at the heart. As a result, the model does not account for the potential hemodynamic disturbances that would propagate from the reconstructed aorta. We used a prescribed inflow waveform predicted from the study by Taylor-LaPole et al. [36]. We did not combine the portal vein and hepatic networks, which may cause some information to be lost. In future studies, we plan to combine the hepatic artery and portal vein networks with a whole-body network containing the patient’s aorta. Additionally, the perfusion analysis was done by mapping predictions at the terminals of vessels to segmented liver tissue. We plan to incorporate a porous media model at the vessel terminals to This will to allow us to account for mixing and drainage of the blood from the two systems. This will give a more complete picture of what is happening within the tissue. We also plan to do more studies were we reduce the cardiac output in accordance with the level of FALD. As FALD progresses and portal hypertension increases, patients will experience further reduced cardiac output. In our study we kept cardiac output consistent across all HLHS and FALD patients. Insight from our clinical collaborators along with increased access to data will make this future study possible.
During calibration, we manually adjusted the stiffness parameters (see Table 2) to fit an expected pressure curve and the portal venous pressure of a healthy individual. However, patients with HLHS are likely to have portal vein hypertension. Thus, the actual pressure of the patient with HLHS may be higher than our predicted pressures. To enhance our model calibration’s precision, we can also incorporate multiple pressure readings from various vessels or utilize multiple blood pressure cuff measurements.
6 Conclusion
This study uses a patient-specific 1D-CFD model to predict hemodynamics in the portal vein and hepatic artery vasculatures of an HLHS patient with a reconstructed aorta and a DORV patient with a native aorta. Our model was calibrated to the cardiac output and liver inflow data from a previous study on this data set by [36] with parameters in Table 2 agreeing with normal portal and hepatic venous pressures. We projected cardiac output from DORV and HLHS patients onto the liver model extracted from an adult liver CT and used the 1D-CFD model to predict flow and pressure in the liver networks. We simulated FALD conditions in the HLHS patient to predict pressure and flow across various stages of FALD progression. Our results show that the HLHS patient has increased pressure and reduced flow in the portal vein compared to the DORV patient. These results were more prominent as FALD conditions increased. The approximate WSS was lower in both the portal and hepatic vessels in the patient with HLHS, suggesting the presence of hypertension. Perfusion analysis shows that progression of FALD results in increased pressures in large regions of liver tissue, possibly leading to fibrosis development, and reduced flow to upper and lower regions of the tissue. In general, our study offers information on FALD pathology by showing specific changes in the hemodynamics of the Fontan circulation that could cause portal hypertension and complications of FALD. More clinical 4D-MRI studies are recommended to gain deeper insights into the dynamic hemodynamics of FALD and Fontan-associated circulatory systems.
Acknowledgments
We thank the following people from the North Carolina School of Science and Math for setting up this collaboration and approving this research. Dr. Sarah Shoemaker, the Director of Research and Innovation, and Dr. Amy Sheck, the Dean of Science for the research opportunities. and program advisor, Bob Gotwals. We thank Justin Weigand, M.D., for providing access to patient data and guidance on its use.
Conflict of interest
We have no conflicts of interest.
References
- Fixler et al. [2010] David E. Fixler, Wendy N. Nembhard, Jason L. Salemi, Mary K. Ethen, and Mark A. Canfield. Mortality in first 5 years in infants with functional single ventricle born in texas, 1996 to 2003. Circulation, 121(5):644–650, Feb 2010. 10.1161/CIRCULATIONAHA.109.869671. URL https://pubmed.ncbi.nlm.nih.gov/20124129/.
- Reller et al. [2008] M. D. Reller, M. J. Strickland, T. Riehle-Colarusso, W. T. Mahle, and A. Correa. Prevalence of congenital heart defects in metropolitan atlanta, 1998-2005. The Journal of Pediatrics, 153(6):807–813, Dec 2008. 10.1016/j.jpeds.2008.06.026. URL https://pubmed.ncbi.nlm.nih.gov/19014816/.
- Noonan and Nadas [1958] Jacqueline A. Noonan and Alexander S. Nadas. The hypoplastic left heart syndrome: An analysis of 101 cases. Pediatric Clinics of North America, 5(4):1029–1056, 1958. 10.1016/S0031-3955(16)30727-1.
- Téllez et al. [2018] L. Téllez, E. Rodríguez-Santiago, and A. Albillos. Fontan-associated liver disease: A review. Ann Hepatol, 17(2):192–204, 2018. 10.5604/01.3001.0010.8634.
- Fontan and Baudet [1971] F. Fontan and E. Baudet. Surgical repair of tricuspid atresia. Thorax, 26:240–248, 1971.
- Lee and Shahjehan [2023] M. Lee and RD. Shahjehan. Fontan completion, 2023. URL https://www.ncbi.nlm.nih.gov/books/NBK558950/. [Updated 2023 Jul 2]. In: StatPearls [Internet]. Treasure Island (FL): StatPearls Publishing; 2023 Jan-.
- Khairy et al. [2008] Paul Khairy, Susan M Fernandes, John E Mayer Jr., John K Triedman, Edward P Walsh, James E Lock, and et al. Long-term survival, modes of death, and predictors of mortality in patients with fontan surgery. Circulation, 117(1):85–92, 2008. 10.1161/CIRCULATIONAHA.107.738559.
- Downing et al. [2017] Timothy E Downing, Kirsten Y Allen, Andrew C Glatz, Lisa S Rogers, Chitra Ravishankar, Jack Rychik, and et al. Long-term survival after the fontan operation: twenty years of experience at a single center. J Thorac Cardiovasc Surg, 154(1):243–53.e2, 2017. 10.1016/j.jtcvs.2017.01.056.
- Schilling et al. [2016] Chris Schilling, Kim Dalziel, Russell Nunn, Khaleda Du Plessis, William Y Shi, David Celermajer, and et al. The fontan epidemic: population projections from the australia and new zealand fontan registry. Int J Cardiol, 219:14–9, 2016. 10.1016/j.ijcard.2016.05.035.
- Kverneland et al. [2018] Liv S Kverneland, Philipp Kramer, and Sergei Ovroutski. Five decades of the fontan operation: a systematic review of international reports on outcomes after univentricular palliation. Congenit Heart Dis, 13(2):181–93, 2018. 10.1111/chd.12570.
- Emamaullee et al. [2020] Juliette Emamaullee, Ali N Zaidi, Thomas Schiano, Jason Kahn, Pamela L Valentino, Ryan E Hofer, Timucin Taner, John W Wald, Kim M Olthoff, John Bucuvalas, and Rebecca Fischer. Fontan-associated liver disease: Screening, management, and transplant considerations. Circulation, 142(6):591–604, August 2020. 10.1161/CIRCULATIONAHA.120.045597. Epub ahead of print. PMID: 32776846; PMCID: PMC7422927.
- Vaikunth et al. [2019] Seyed Shahryar Vaikunth, Windy Concepcion, Taylor Daugherty, Mark Fowler, Glen Lutchman, Katsuhide Maeda, and et al. Short-term outcomes of en bloc combined heart and liver transplantation in the failing fontan. Clin Transplant, 33(6):e13540, 2019. 10.1111/ctr.13540.
- de Lange et al. [2023a] Charlotte de Lange, Thomas Möller, and Hanna Hebelka. Fontan-associated liver disease: Diagnosis, surveillance, and management. Front. Pediatr., 11:1100514, 2023a. 10.3389/fped.2023.1100514. This article is part of the Research Topic Management of the Hypoplastic Left Heart Syndrome: From Fetus to Adult.
- Lautt [2009] William W. Lautt. Overview. In Hepatic Circulation: Physiology and Pathophysiology. Morgan and Claypool Life Sciences, San Rafael, CA, 2009. URL https://www.ncbi.nlm.nih.gov/books/NBK53069/.
- Eipel et al. [2010] Christian Eipel, Kerstin Abshagen, and Brigitte Vollmar. Regulation of hepatic blood flow: the hepatic arterial buffer response revisited. World journal of gastroenterology, 16(48):6046–6057, Dec 2010. 10.3748/wjg.v16.i48.6046.
- Rocha [2012] Flavio G. Rocha. Liver blood flow: Physiology, measurement, and clinical relevance, volume I, pages 74–86.e5. Elsevier, 2012. 10.1016/B978-1-4377-1454-8.00004-7.
- Granger and Kvietys [2004] D. Neil Granger and Peter R. Kvietys. Circulation, overview. In Encyclopedia of Gastroenterology. Elsevier, 2004.
- Xanthopoulos et al. [2019] PhD Xanthopoulos, Andrew MD, MPH Starling, Randall C. MD, PhD Kitai, Takeshi MD, and PhD Triposkiadis, Filippos MD. Heart failure and liver disease: Cardiohepatic interactions. JACC: Heart Failure, 7(2):87–97, February 2019. 10.1016/j.jchf.2018.10.007. Mini-Focus Issue: Cardiac Consequences of Non-Cardiac Disease, State-of-the-Art Review.
- Alvarez and Mukherjee [2011] Ana M Alvarez and Debabrata Mukherjee. Liver abnormalities in cardiac diseases and heart failure. International Journal of Angiology, 20(3):135–142, 2011. 10.1055/s-0031-1284434.
- Navaratnam et al. [2016] D. Navaratnam, S. Fitzsimmons, M. Grocott, H.B. Rossiter, Y. Emmanuel, G.P. Diller, and et al. Exercise-induced systemic venous hypertension in the fontan circulation. Am J Cardiol, 117:1667–1671, 2016. 10.1016/j.amjcard.2016.03.005.
- Van De Bruaene et al. [2015] A Van De Bruaene, G Claessen, A La Gerche, E Kung, A Marsden, P De Meester, S Devroe, J Bogaert, P Claus, H Heidbuchel, W Budts, and M Gewillig. Effect of respiration on cardiac filling at rest and during exercise in fontan patients: A clinical and computational modeling study. Int J Cardiol Heart Vasc, 9:100–108, 2015. 10.1016/j.ijcha.2015.08.002.
- Oka et al. [2023] Hirofumi Oka, Keita Nakau, Yugo Shibagaki, Kei Ito, Yuichi Sasaki, Ryo Imanishi, Shohei Shimada, and Satoshi Takahashi. Liver fibrosis markers represent central venous pressure in post-pubertal patients with congenital heart disease. Cureus, 15(6):e39845, Jun 2023. 10.7759/cureus.39845.
- Mazza et al. [2021] GA Mazza, E Gribaudo, and G Agnoletti. The pathophysiology and complications of fontan circulation. Acta Biomed, 92(5):e2021260, 2021. 10.23750/abm.v92i5.10893.
- Gordon-Walker et al. [2019] Timothy T. Gordon-Walker, Kevin Bove, and Gruschen Veldtman. Fontan-associated liver disease: A review. Journal of Cardiology, 74(3):223–232, 2019. 10.1016/j.jjcc.2019.02.016.
- Goldberg et al. [2017] DJ Goldberg, LF Surrey, AC Glatz, et al. Hepatic fibrosis is universal following fontan operation, and severity is associated with time from surgery: A liver biopsy and hemodynamic study. J Am Heart Assoc, 6:e004809, 2017. 10.1161/JAHA.116.004809.
- Johnson et al. [2013] John A Johnson, Frank Cetta, Robert P Graham, Thomas C Smyrk, David J Driscoll, Sherry D Phillips, and Anitha S John. Identifying predictors of hepatic disease in patients after the fontan operation: a postmortem analysis. The Journal of Thoracic and Cardiovascular Surgery, 146(1):140–145, 2013. 10.1016/j.jtcvs.2012.09.005. URL http://dx.doi.org/10.1016/j.jtcvs.2012.09.005. Medline.
- Schwartz et al. [2012] Michael C Schwartz, Lisa Sullivan, Mitchell S Cohen, Paul Russo, Anitha S John, Rong Guo, Marc Guttenberg, and et al. Hepatic pathology may develop before the fontan operation in children with functional single ventricle: an autopsy study. The Journal of Thoracic and Cardiovascular Surgery, 143(4):904–909, 2012. 10.1016/j.jtcvs.2011.08.038. URL http://dx.doi.org/10.1016/j.jtcvs.2011.08.038. Medline.
- Rychik and Gui-Yang [2002] J Rychik and S Gui-Yang. Relation of mesenteric vascular resistance after fontan operation and protein-losing enteropathy. Am J Cardiol, 90:672–4, 2002. 10.1016/s0002-9149(02)02562-3.
- Daniels et al. [2015] C J Daniels, E A Bradley, M J Landzberg, J Aboulhosn, R H Beekman, W Book, M Gurvitz, A John, B John, A Marelli, B S Marino, Minich L L, Poterucha J J, E B Rand, and G R Veldtman. Fontan-associate liver disease: Proceedings from the american college of cardiology stakeholders meeting. JACC, 2015.
- de Lange et al. [2023b] C. de Lange, T. Möller, and H. Hebelka. Fontan-associated liver disease: Diagnosis, surveillance, and management. Front Pediatr, 11:1100514, 2023b. 10.3389/fped.2023.1100514.
- Cieplucha et al. [2022] Aleksandra Cieplucha, Werner Budts, Marc Gewillig, and Alexander Van De Bruaene. Fontan-associated liver disease in adults: What a cardiologist needs to know. a comprehensive review for clinical practitioners. US Cardiology Review, 16:e25, 2022. 10.15420/usc.2022.02.
- Schleiger et al. [2020] A Schleiger, P Kramer, M Salzmann, F Danne, S Schubert, C Bassir, T Müller, F Tacke, HP Müller, F Berger, J Photiadis, and S Ovroutski. Evaluation of fontan failure by classifying the severity of fontan-associated liver disease: a single-centre cross-sectional study. Eur J Cardiothorac Surg, 2020. 10.1093/ejcts/ezaa310.
- Marsden et al. [2007] AL Marsden, IE Vignon-Clementel, FP Chan, JA Feinstein, and CA Taylor. Effects of exercise and respiration on hemodynamic efficiency in cfd simulations of the total cavopulmonary connection. Ann Biomed Eng, 35:250–263, 2007.
- Ahmed et al. [2021] Y. Ahmed, C. Tossas-Betancourt, PAJ van Bakel, JM Primeaux, WJ Weadock, JC Lu, JD Zampi, A Salavitabar, and CA Figueroa. Interventional planning for endovascular revision of a lateral tunnel fontan: A patient-specific computational analysis. Front Physiol, 12:718254, 2021.
- Puelz et al. [2017] C. Puelz, S. Acosta, B. Rivieere, DJ Penny, KM Brady, and CG Rusin. A computational study of the fontan circulation with fenestration or hepatic vein exclusion. Comput Biol Med, 89:405–418, 2017.
- Taylor-LaPole et al. [2022] Alyssa M. Taylor-LaPole, Mitchel J. Colebank, Justin D. Weigand, Mette S. Olufsen, and Charles Puelz. A computational study of aortic reconstruction in single ventricle patients, 2022.
- Trusty et al. [2018] Phillip M Trusty, Zhenglun Wei, Jack Rychik, Pierre A Russo, Lea F Surrey, David J Goldberg, Mark A Fogel, and Ajit P Yoganathan. Impact of hemodynamics and fluid energetics on liver fibrosis after fontan operation. The Journal of Thoracic and Cardiovascular Surgery, 156(1):267–275, July 2018. 10.1016/j.jtcvs.2018.02.078.
- Ishizaki et al. [2018] Umiko Ishizaki, Michinobu Nagao, Yumi Shiina, Kenji Fukushima, Tatsunori Takahashi, Yamato Shimomiya, Yuka Matsuo, Kei Inai, and Shuji Sakai. Prediction of fontan-associated liver disease using a novel cine magnetic resonance imaging “vortex flow map” in the right atrium. Pediatric Cardiology and Adult Congenital Heart Disease, 82:2143–2151, 2018. 10.1253/circj.CJ-17-1260.
- Goo [2021] Hyun Woo Goo. Double outlet right ventricle: In-depth anatomic review using three-dimensional cardiac ct data. Korean Journal of Radiology, 22(11):1894–1908, Nov 2021. 10.3348/kjr.2021.0248.
- Soler et al. [2010] L. Soler, A. Hostettler, V. Agnus, A. Charnoz, J. Fasquel, J. Moreau, A. Osswald, M. Bouhadjar, and J. Marescaux. 3d image reconstruction for comparison of algorithm database: A patient specific anatomical and medical image database. Tech. rep, IRCAD, Strasbourg, France, 2010.
- Federov et al. [2012] A Federov, R Beichel, J Kalpathy-Cramer, J Finet, J Fillion-Robin, S Pujol, C Bauer, D Jennings, F Fennessy, M Sonka, J Buatti, S Aylward, J V Miller, S Peiper, and R Kikinis. 3d Slicer as an image computing platform for the Quantitative Imagine Network. Magn. Reson. Imaging, 20:1323–1341, 2012. https://doi.org/10.1016/j.mri.2012.05.001.
- Kikinis et al. [2014] R Kikinis, S D Pieper, and K Vosburgh. Intraoperative Imaging and Image-Guided Therapy, chapter 3D Slicer: a platform for a subject-specific image analysis, visualization, and clinical support, pages XX–YY. Springer, New York, NY, 2014. https://doi.org/10.1007/978-1-4614-7657-3_19.
- Ayachit [2015] U Ayachit. The ParaView Guide: A Parallel Visualization Application. Kitware, Inc., Clifton Park, NY, USA, 2015.
- Antiga et al. [2008] L Antiga, M Piccinelli, L Botti, B Ene-Iordache, A Remuzzi, and D A Steinman. An image-based modeling framework for patient-specific computational hemodynamics. Med. Biol. Eng. Comput., 46:1097–1112, 2008. https://doi.org/10.1007/s11517-008-0420-1.
- Izzo et al. [2018] R Izzo, D Steinman, S Manini, and L Antiga. The vascular modeling toolkit: a python library for the analysis of tubular structures in medical images. J. Open Source Softw., 3(25):745, 2018. https://doi.org/10.21105/joss.00745.
- Colebank et al. [2019] M J Colebank, M Paun, M U Quereshi, N C Chesler, D Husmeier, M S Olufsen, and L Ellwein Fix. Influence of image segmentation on one-dimensional fluid dynamics predictions in the mouse pulmonary arteries. J. R. Soc. Interface, 16:20190284, 2019. https://doi.org/10.1098/rsif.2019.0284.
- Colebank et al. [2021a] M J Colebank, M U Qureshi, and M S Olufsen. Sensitivity analysis and uncertainty quantification of 1-d models of pulmonary hemodynamics in mice under control and hypertensive conditions. Int. J. Numer. Method. Biomed. Eng., 37:e3242, 2021a. https://doi.org/10.1002/cnm.3242.
- Bartolo et al. [2023] M.A. Bartolo, A.M. Taylor-LaPole, D. Gandhi, A. Johnson, Y. Li, E. Slack, I. Stevens, Z. Turner, D. Husmeier, and M.S. Olufsen. Framework for generating patient-specific computational models and assessing uncertainty from medical images. In Review, 2023. URL https://arxiv.org/abs/2309.08779.
- Olufsen et al. [2000] M S Olufsen, C S Peskin, W Y Kim, E M Pedersen, A Nadim, and J Larsen. Numerical simulation and experimental validation of blood flow in arteries with structured-tree outflow conditions. Ann. Biomed., 28:1281–1299, 2000. https://doi.org/10.1114/1.1326031.
- Nichols et al. [2011] W W Nichols, M F O’Rourke, and W L Kenney. McDonald’s Blood Flow in Arteries: Theoretical, Experimental and Clinical Principles. CRC Press, Boca Raton, FL, 2011.
- Pedersen et al. [1993] E M Pedersen, H W Sung, A C Burlson, and A P Yoganathan. Two-dimensional velocity measurements in a pulsatile flow model of the normal abdominal aorta simulating different hemodynamic conditions. J. Biomech., 26(10):1237–1247, 1993. https://doi.org/10.1016/0021-9290(93)90071-l.
- Pries et al. [1992] A R Pries, D Neuhaus, and P Gaehtgens. Blood viscosity in tube flow: dependence on diameter and hematocrit. Am. J. Physiol., 263:H1770–H1778, 1992. https://doi.org/10.1152/ajpheart.1992.263.6.h1770.
- Qureshi et al. [2019] M U Qureshi, M J Colebank, L M Paun, L Ellwein Fix, N Chesler, M A Haider, N A Hill, D Husmeier, and M S Olufsen. Hemodynamic assessment of pulmonary hypertension in mice: a model-based analysis of the disease mechanism. Biomech. Model. Mechanobiol., 18:219–243, 2019. https://doi.org/10.1007/s10237-018-1078-8.
- Paun et al. [2020] L M Paun, M J Colebank, M S Olufsen, N A Hill, and D Husmeier. Assessing model mismatch and model selection in a bayesian uncertainty quantification analysis of a fluid-dynamics model of pulmonary blood circulation. J. R. Soc. Interface, 17(173):20200886, 2020. https://doi.org/10.1098/rsif.2020.0886.
- Colebank et al. [2021b] Matthew J. Colebank, Muhammad U. Qureshi, and Mette S. Olufsen. Sensitivity analysis and uncertainty quantification of 1-d models of pulmonary hemodynamics in mice under control and hypertensive conditions. Int. J. Numer. Method Biomed. Eng., 37:e3242, 2021b. 10.1002/cnm.3242.
- Chambers et al. [2020] MJ Chambers, MJ Colebank, MU Qureshi, R Clipp, and MS Olufsen. Structural and hemodynamic properties of murin pulmonary arterial networks under hypoxia-induced pulmonary hypertension. Proc Inst Mech Eng H, 234(11):1312–1329, 2020.
- Colebank et al. [2021c] M J Colebank, M U Qureshi, S Rajagopal, R A Krasuski, and M S Olufsen. A multiscale model of vascular function in chronic thromboebolic pulmonary hypertension. Am J Physiol Heart Circ Physiol, 321, 2021c.
- García-Pagán et al. [1996] J.C. García-Pagán, C. Santos, J.A. Barberá, A. Luca, J. Roca, R. Rodriguez-Roisin, J. Bosch, and J. Rodés. Physical exercise increases portal pressure in patients with cirrhosis and portal hypertension. Gastroenterology, 111(5):1300–6, 1996. 10.1053/gast.1996.v111.pm8898644.
- Arriazu et al. [2014] Elena Arriazu, Marina Ruiz de Galarreta, Francisco J Cubero, Marta Varela-Rey, María P Pérez de Obanos, Tung Ming Leung, Aritz Lopategi, Aitziber Benedicto, Ioana Abraham-Enachescu, and Natalia Nieto. Extracellular matrix and liver disease. Antioxid Redox Signal, 21(7):1078–1097, 2014. 10.1089/ars.2013.5697.
- Villela-Nogueira et al. [2016] Cristiane A Villela-Nogueira, Nathalie C Leite, Claudia R Cardoso, and Gil F Salles. Nafld and increased aortic stiffness: Parallel or common physiopathological mechanisms? Int J Mol Sci, 17(4):460, 2016. 10.3390/ijms17040460.
- Eshtehard et al. [2017] P Eshtehard, A J Brown, A Bhargava, C Costopoulos, O Y Hung, M T Corban, H Hosseini, B D Gogas, D P Giddens, and H Samaday. High wall shear sress and high-risk plaque: an emerging concept. Int J Cardovasc Imaging, 2017.
- Banerjee [2012] JK Banerjee. Portal hypertension. Med J Armed Forces India, 68(3):276–279, 2012. 10.1016/j.mjafi.2012.04.008.
- Staff [n.d.] Mayo Clinic Staff. Pulse pressure: An indicator of heart health?, n.d. URL https://www.mayoclinic.org/diseases-conditions/high-blood-pressure/expert-answers/pulse-pressure/faq-20058189. Accessed: 2024-12-29.
- MacMathuna [2012] P M MacMathuna. Mechanisms and consequences of portal hypertension. Drugs, 2012.
- Lautt [1985] Wayne Lautt. Mechanism and role of intrinsic regulation of hepatic arterial blood flow: Hepatic arterial buffer response. American Journal of Physiology-Legacy Content, 249(5 Pt 1):G549–G556, Dec 1985. 10.1152/ajpgi.1985.249.5.G549.
- Gülberg et al. [2002] V. Gülberg, K. Haag, M. Rössle, and A. L. Gerbes. Hepatic arterial buffer response in patients with advanced cirrhosis. Hepatology, 35(3):630–634, Mar 2002. 10.1053/jhep.2002.31722.
- Piva et al. [2012] A Piva, F Zampieri, M Di Pascoli, A Gatta, D Sacerdoti, and M Bolognesi. Mesenteric arteries responsiveness to acute variations of wall shear stress is impaired in rats with liver cirrhosis. Scandinavian Journal of Gastroenterology, 2012.
- Voges [2015] et al Voges, I. Frequent dilation of the descending aorta in children with hypoplastic left heart syndrome relates to decreased aortic arch elasticity. J Am Heart Assoc, 2015.
- Taylor-LaPole et al. [2024] A M Taylor-LaPole, L M Paun, D Lior, J D Weigand, C Puelz, and M S Olufsen. Parameter selection and optimization of a computational netowrk model of blood flow in single-ventricle patients. arXiv preprint arXiv:2406.18490, 2024.
- Bartolo et al. [2022] M.A. Bartolo, M.U. Qureshi, M.J. Colebank, N.C. Chesler, and M.S. Olufsen. Numerical predictions of shear stress and cyclic stretch in pulmonary hypertension due to left heart failure. Biomech Model Mechanobiol, 21:363–381, 2022. 10.1007/s10237-021-01505-7.
- Traub and Berk [1998] O Traub and B C Berk. Laminar shear stress mechanicsms by which endothelial cells transduce an atherprotective force. ATVB, 1998.
- Iwakiri [2014] Y. Iwakiri. Pathophysiology of portal hypertension. Clin Liver Dis, 18(2):281–291, 2014. 10.1016/j.cld.2013.12.001.
- Kolega et al. [2021] J Kolega, K E Poppenber, H-W Lim, L C Gutierrez, S S Veeturi, A H Siddiqui, H Rajabzadeh-Oghaz, and V M Tutino. Identification of intima-to-media signals for flow-induced vascular remodling using correlative gene expression analysis. Scientific Reports, 2021.
- Lemoinee et al. [2015] S Lemoinee, A Cadoret, P-E Rautou, H E Mourabit, V Ratziu, C Corpechot, C Rey, N Bosselut, V Barbu, D Wendum, G Feldmann, C Boulanger, C Henegar, C Housset, and D Thabut. Portal myofibroblasts promote vascular remodeling underlying cirrhosis formation through the release of microparticles. Hepatology, 2015.
- Zhou et al. [2023] M. Zhou, Y. Yu, R. Chen, X. Liu, Y. Hu, Z. Ma, L. Gao, W. Jian, and L. Wang. Wall shear stress and its role in atherosclerosis. Front Cardiovasc Med, 10:1083547, 2023. 10.3389/fcvm.2023.1083547.
- Mynard and Valen-Sendstad [2015] JP Mynard and K Valen-Sendstad. A unified method for estimating energy losses at vascular junctions. Int J Numer Meth Biomed Eng, 31:e02717, 2015.
- Bazilevs et al. [2009] Y. Bazilevs, MC. Hsu, DJ. Bension, S. Sankaran, and AL Marsden. Computational fluid-structure interaction: Methods and application to a total cavopulmonary connection. Comput Mech, 45:77–89, 2009.