Multi-episodes of remote brightenings driven by a coronal EUV jet on the Sun
Abstract
Remote brightening (RB) is compact brightening at footpoints of magnetic loops, which are remotely-connecting to and confining an eruption in the solar atmosphere. Here, we report on observations of an RB resulting from an EUV jet with a speed of about 90 km s-1. The loops connecting the RB and the jet have an apparent length of about 59 Mm. Intriguingly, the RB exhibits at least two episodes of brightenings, as characterised by two peaks in its lightcurve. The energies, which sustain the first and second peaks of the RB, are erg and erg, respectively, and take a significant proportion of the total energy. The first peak of the RB brightenings coincides with the jet’s peak with a time delay of 12 seconds, while the second peak lags behind by 108 seconds. Besides the flows of the ejecta, we have identified two additional flows originating from the eruption site. One is relatively cool with a temperature of and has a speed of about km s-1. The other is hot with a temperature of and travels much faster with a speed of about 750 70 km s-1. We attribute the second peak of RB directly to this hot flow, which our numerical experiments suggest is the result of a slow shock wave. Considering the minimal time delay between the first peak of RB and the eruption, we infer this first episode is due to heating by nonthermal electrons. Our research demonstrates that the dynamics in an RB can offer vital insights into the nature of the corresponding eruption and help understand how the energy is distributed throughout the solar atmosphere.
1 Introduction
When a solar eruptive event is confined by coronal loops, it might result in remote brightening (RB) at the footpoints of these loops away from the eruptive sites. RBs frequently occur in circular ribbon flares (Strong et al., 1992; Liu et al., 2006; Masson et al., 2009; Sun et al., 2013; Wang et al., 2014), eruptive flares (Balasubramaniam et al., 2005; Uddin et al., 2006; Chandra et al., 2009) and jets (Shimojo et al., 2007; Huang et al., 2020). A statistical study conducted by Zhang et al. (2022) shows that 57% of circular ribbon flares are related to remote brightenings, in which X-class ones have a higher probability of such phenomena. RBs are direct evidence of energy propagations in the horizontal direction in the solar atmosphere. Kundu et al. (1983) estimated that the energy propagating from the initial eruption site along the loop to the remote brightening is approximately 1024 erg. Some RBs associated with flares can also further produce secondary coronal dimmings and/or Coronal mass ejections (Wang et al., 2002; Wang, 2005; Liu et al., 2020).
The dynamics of an RB is reflective of the physical processes associated with their governing eruptions. By analyzing two large flares with RBs, Tang & Moore (1982) found that the RBs occurred nearly simultaneously with type-III radio busts, thus they suggested that the RBs were the results of non-thermal electrons generated at the flaring sites and traveling along closed magnetic loops. When an eruption results from magnetic reconnection at a quasi-separatrix layer (QSL), like a circular ribbon flare does, heat flux and energized particles can propagate along the QSL to the remote footpoint, and then potentially cause heating of the chromosphere and thus an RB (Wang & Liu, 2012). The time delay between a main eruption and the associated RB (see e.g. Shimojo et al., 2007; Wang & Liu, 2012; Huang et al., 2020; Zhang et al., 2022, etc.) is normally much larger than that resulting from nonthermal electron heating (Deng et al., 2013). However, Wang & Liu (2012) pointed out that the time delay might be partly due to the later involvement of magnetic field lines connected to the remote region in the reconnections. By analyzing RBs associated with solar X-ray jets, Shimojo et al. (2007) found that the energy propagation speed from an eruption site to the RB is close to that of a heat conduction front, proposing that Alfvén waves might have been generated in the erupting site. Recently, Wang et al. (2023) analyzed observations of sequential RBs related to M-class flares taken by the Chinese H Solar Explorer (CHASE) and suggested that those RBs are most likely to be caused by the heating from interchange reconnection between the erupting flux rope and the closed ambient field. Other studies also suggested that an RB might be caused by the interactions between the ejected materials and the remote footpoint (e.g. Yang et al., 2014). Motions in RBs related to flares have also contributed to our understanding of the complex interactions between erupting magnetic flux ropes (Wang, 2005; Zheng et al., 2015) and overlying large-scale magnetic structures (Liu et al., 2020). Quasi-periodic pulsations in an RB that show similar periodicity as sunspot oscillations have been observed by Kashapova et al. (2020), suggesting that RBs could be modulated by local intrinsic behavior.
As summarised above, the phenomena of RBs are an active subject for the community, but their real natures are yet to be demonstrated. In the present work, we reported on observations of an RB associated with a coronal EUV jet, in which the RB shows two clear flaring peaks, likely linking to two distinct processes of energy transfer from the main eruption sites. These intriguing observations offer valuable insights into the nature of coronal EUV jets, including their formation processes and their subsequent effects on the surrounding corona. The structure of the rest of this paper is as follows: a description of the data is provided in Section 2, followed by the results in Sections 3 & 4, and a summary of our findings in Section 5.
2 Data and methodology
The data analyzed here were taken by the Atmospheric Imaging Assembly (AIA, Lemen et al., 2012) and the Helioseismic and Magnetic Imager (HMI, Scherrer et al., 2012) on 2017 March 30. The AIA data include those in EUV passbands (94, 131, 171, 193, 211, and 335 Å) with a cadence of 12 s and those in the UV passband of 1600 Å with a cadence of 24 s. The temperature response functions of these EUV passbands peak at 6.3 K, 1.0 K, 6.3 K, 1.3 K, 2.0 K, and K, respectively. The AIA passband at 1600 Å contains emissions from C iv and continuum, thus reflecting the dynamics from both the transition region and the upper photosphere. The evolution of the magnetic field at the photospheric base of the event is traced by using the line-of-sight (LOS) magnetograms with a cadence of 45 s taken by HMI. Both the AIA images and HMI LOS magnetograms have a spatial sampling of 0.6 per pixel.
Both AIA and HMI data have been calibrated by the standard procedure of aia_prep.pro in the Solarsoft. Alignment among images of different passbands has been adjusted after the official calibrations. This refinement has been confirmed through a cross-referencing of the positions of several compact bright features in the region of interest.
For temperature analyses, we use the differential emission measure (DEM) code developed and optimized by Cheung et al. (2015) and Su et al. (2018) based on the AIA 94, 131, 171, 193, 211, and 335 Å passbands. In this step, we have binned the AIA images by 22 pixels to minimize the noise. This results in a spatial sampling of 1.2 for the produced emission measure (EM) images. One should keep in mind that the AIA data provides only a few data points to constrain the DEM. Nevertheless, the analysis can still provide us with general information on the thermal structures of the event.
To drive three-dimensional (3D) magnetic geometries of the events, we carry out a nonlinear force-free field (NLFFF) extrapolation (Wiegelmann, 2007) based on the photospheric vector magnetic fields measured by HMI. The vector magnetic data from HMI have a pixel sampling of 0.5 and a cadence of 720 s. The 3D magnetic geometries of the events are verified by the structures shown in the coronal images.
3 Observations of the jet and its RB
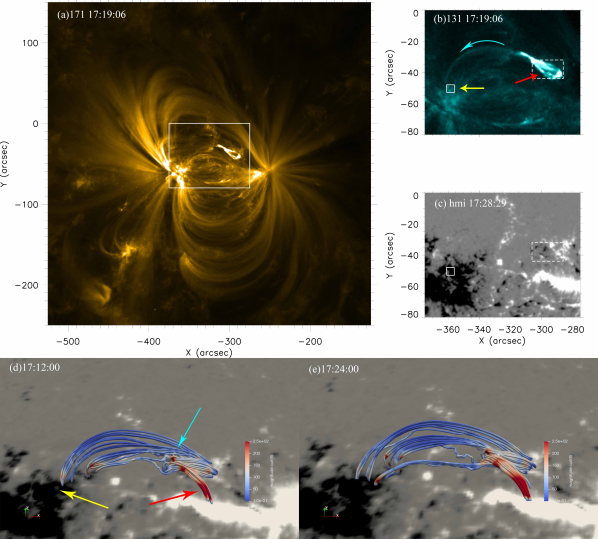
Figure 1(a) shows the context of the event in the AIA 171Å image at 17:19 UT. The EUV jet occurred in the active region NOAA 16245 near the center of the solar disk, and the eruption site is centering around Solar_X= and Solar_Y= (Figure 1(b)). The jet starts at around 17:17 UT, and lasts for six minutes. We can see that the active region consists of multi-scaled loops connecting the main opposite polarities (see panels (a) and (c) of Figure 1), and the jet is confined in some of these loops (see Figure 1(b)). The LOS magnetogram of the region is displayed in Figure 1(c). We can see that the eruptive site of the jet is dominated by positive polarities while small-scale negative polarities are spread around (see the box region enclosed by dashed lines in Figure 1(c)). In the animation associated with Figure 1 (c), we can observe that the positive polarities at the eruption site exhibit a moving feature prior to the jet activity. Although this is not very clear due to the fuzzy surroundings of the feature, we suspect that such moving magnetic feature might accumulate magnetic free energy to facilitate the occurrence of magnetic reconnection (e.g. Pariat et al., 2010; Huang et al., 2012; Yang et al., 2013; Huang et al., 2014; Mou et al., 2016; Wyper & DeVore, 2016; Wei et al., 2023, etc.). The jet is confined in loops as shown in panel (b) of Figure 1 (see the curved cyan arrow in panel (b)), and the other (remote) footpoints of these loops where the RB occurs are observed as single negative polarity (see the box region enclosed by solid lines in Figure 1(c)). Based on the observations, the projected loop-length on the 131 Å image (Figure 1 (b)) from the base of the jet to the RBs is about 58 Mm. We also measure the realistic loop length based on the extrapolation data using the length of the field line connecting the remote site and the jet base and obtain 79 Mm (Figure 1 (d)).
Figures 1(d) and 1(e) depict the 3D magnetic geometries of the event, derived from observations taken before (at 17:12 UT) and after (at 17:24 UT) the jet’s eruption, respectively. These figures exclusively showcase the magnetic field lines that are anchored in the region of the remote brightening (RB), which also shows the complexity of the erupting site. The overall magnetic geometry bridging the RB (negative polarities) and the erupting site (dominated by positive polarities) appears to be conserved. Furthermore, the extrapolation results show that the magnetic field in the dome region is highly twisted with strong curls (see the cyan arrow in panel (d)), indicating that there is a stronger current in the eruption site. However, a closer examination reveals that the footpoints of certain magnetic field lines at the erupting site have changed, indicating a local reconfiguration of magnetic topologies due to the jet’s eruption.
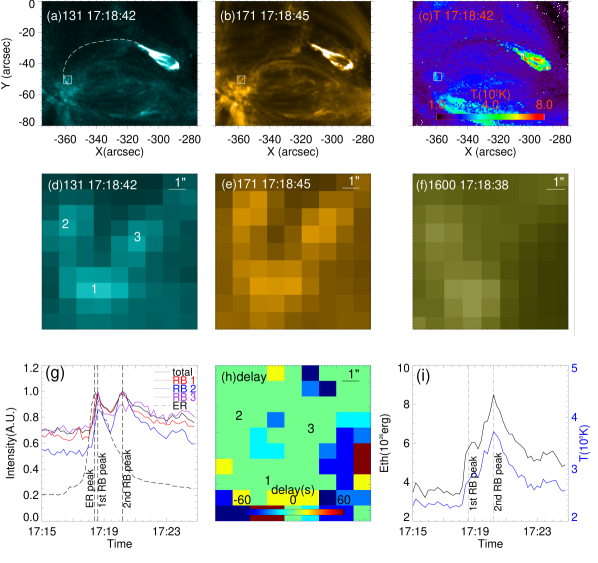
The event initiates at 17:17 UT, at the time of the activation and brightening of the jet’s base. The erupting site of the jet is characterized by a cone-shaped, or dome-like, structure with a circular-ribbon base, as depicted in Figure 2(a)–(b) and the associated animation. The cone-shaped structure brightens uniformly, whereas the circular ribbon exhibits brightening simultaneously. At approximately 17:18:30 UT, after the base has fully brightened, we observe the jet’s ejecta emerging from the tip of the dome and beginning to flow along the loops.
Within less than 12 s (i.e. the limit of the temporal resolution of the AIA EUV observations) after observing the ejecta of the jet, brightenings at the remote footpoints appear, which can be seen in all AIA passbands (see Figure 2(a)&(b) for that in 131 Å and 171 Å passbands ). Upon closer examination, we see that the RB consists of three bright cores (see Figure 2(d)&(e), and the features are numbered by “1–3” in Figure 2(d)). While all three bright features of the RB are discernible in the AIA EUV passbands, their evolution varies with each passband. Notably, the bright feature “3” is absent in the AIA 1600 Å passband, in contrast to the other two (as shown in Figure 2(f)). To investigate the temperature profiles of the event, we perform DEM analyses based on the AIA observations. The average temperatures () are then calculated by using the following equation (Cheng et al., 2012):
| (1) |
where is the differential emission measures given by the DEM analyses and denotes the temperatures. In Figure 2(c), we show an average temperature map of the region obtained at 17:18:42 UT. The temperatures at the erupting site are in the range of 4–8 K, whereas those at the RB are about K. We also notice that only two bright cores of the RB (“1” and “2”) are structured on the temperature map.
While tracking the evolution of the RB, we clearly observe at least two episodes of brightenings within the RB (see the animation associated with Figure 2). In Figure 2(g), we show lightcurves of the RB and the erupting site in AIA 131 Å passband. We can see that the lightcurve of the erupting site has a single peak, whereas the lightcurves of the RB exhibit two clear peaks. The erupting site peaks at 17:18:30 UT, while the RB peaks at 17:18:42 UT and 17:20:18 UT. The two RB peaks lag the erupting peak by 12 s and 108 s, respectively. The radiation of the RB site has enhanced since 17:18:30 UT, which implies that by this time, the non-thermal electrons have arrived at the RB site with high energy flux. While the lightcurve of the RB is taken from the box region containing three bright cores, we also examine the lightcurves of each of their individuals (see Figure 2(g)). Obviously, bright cores “1” and “2” exhibit two peaks that correspond precisely with the overall lightcurve. Although the bright core “3” shows complex multiple peaks, it is also in good agreement with the overall light curve. Furthermore, using the total lightcurve as a reference, we perform a time-lag analysis on all pixels in the box region of the RB. In Figure 2(h), we show the time delay map of the RB, where each pixel shows the applied time delay that gives the best correlation with the reference lightcurve. This analysis reveals that the time delays for all pixels showing brightenings in the RB are effectively zero, indicating that they are well synchronized. Therefore, the multiple episodes of brightenings in the RB are not due to time differences in brightenings from location to location but are instead caused by different physical processes occurring at different times.
We then estimate the thermal energy of the event () using the following equation (Xia et al., 2022):
| (2) |
where is Boltzmann constant, and are the temperature component and the corresponding emission measure integrated over the area of the RB, and is the volume of the RB that is determined by the area of the RB and its column depth that we estimate as the height from the chromospheric top to the corona (i.e. 2). In Figure 2(i), we show the variations of temperatures and thermal energy of the RB. The energies that sustain two peaks of the RB are about erg and erg, respectively. As derived from the slopes of the variations of energy in Figure 2 (i), the energy consumption rates corresponding to the impulsive phase of the first peak is erg s-1 and that for the second peak is erg s-1.
4 Rationales for the multi-episode RB
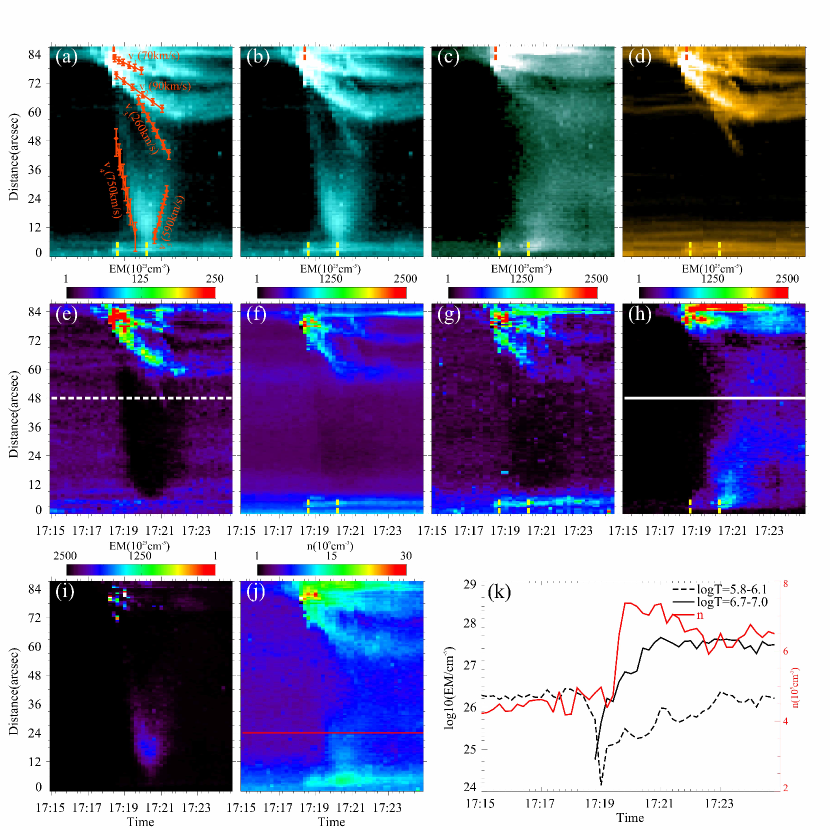
To explore how the multi-episodes of RB occur, we first investigate the relationship between the erupting processes of the jet and the onset of the RB. In Figure 3(a)–(d), we present the time-distance plots that track the jet flows from the erupting site to the RB as seen in the AIA 131 Å, 94 Å, and 171 Å passbands. Two peaks of the RB can be seen in all these passbands and better seen in the 131 Å and 94 Å (see the gold dashed lines in Figure 3(b)&(c)). Four distinct propagating emitting structures are found to originate from the erupting site (see the solid lines denoted by “”–“” in Figure 3 (a). The apparent speeds of these “propagating structures” are about 70 12 km s-1(), 110 6 km s-1(), 275 15 km s-1() and 750 70,km s-1(), respectively. “”– “” are visible in all AIA EUV passbands, while “” are visible only in high-temperature AIA passbands (e.g. 131 Å and 94 Å) but not in the low-temperature ones (such as 171 Å). We notice that “” is not obvious in 94 Å passband at the beginning of the propagation, which may be due to its weak emissions.
In Figure 3, we see that the first peak of the RB (at 17:18:42 UT) does not appear to be associated with any of those propagating emitting structures initiating from the erupting site. In contrast, the second peak of the RB (at 17:20:18 UT) is evidently linked to “”. Additionally, we see a “reflected emitting structure” appears when “” induces the second peak of the RB (see “” in Figure 3(a)). This reflected structure has a speed of 590 30 km s-1.
The DEM analyses of these propagating emitting structures are shown in Figure 3(d)–(h). The erupting site exhibits signatures in temperatures ranging from to . The first peak of the RB seems to be in the temperature range of , whereas the second peak is in the range of . “” and “” can be better seen in the temperature range of . “” appears to be the cool one that is only visible in the temperature range of . “” seems to be the hottest that it can only be seen in the temperature range of . In Figure 3(h), we observe a depletion in EM of after “” passing through. This depletion is due to the material in the loop being heated to a higher temperature, as shown by the black solid line in Figure 3(k), where the EM decreases at low temperatures and increases at high temperatures. Meanwhile, the density also increases (see Figure 3(j) and (k)). The average density after passing of “” () is about cm-3, by contrast to cm-3 () presented previously. Thus, the compression ratio of “” () is 1.6 0.1. “” shows signatures in the temperature range of . It exhibits different features in the low temperature and the high temperature. Its EM in low temperature () increases after the reflected feature passes by, while the EM in high temperature () decreases.
Next, we estimate the average temperature () of the jet flows along the loops from Equation 1 and the number density () from the following equation (Cheng et al., 2012):
| (3) |
where is the column depth of the loop that is assumed to be the apparent width of the flows. is roughly 2.1 cm measured from the observations. Using the emission measures obtained from the DEM analyses, the average temperatures () of “”and “” are about K and the number densities () are about 4.5 0.5 cm-3. The sound speed in the loop is then determined to be about 170 km s-1. Given the magnetic field strength of 75 G near the loop top as provided by the NLFFF model, the Alfvén speed is calculated to be around 2 200 100 km s-1. Consequently, the propagating emitting structures of “” and “” are subsonic, while “” and “” are supersonic. All these structures are significantly slower than the local Alfvén speed. While “” and “” show falling-back motions, they are very likely ejecta flowing along different loops overlapping at the line-of-sight. We suggest that “” is the direct response to the slow shocks generated by the magnetic reconnection processes that also produce the jet. This shock carries heating flux from the reconnection site (i.e. erupting site) and heats the plasmas while it propagates along the loops. “” might be indicative of the thermal conduction front due to the high temperature of plasmas in the erupting site. It represents the expanding speed of the main temperature structure, which is about as shown in Figure 3(d)). The reflected emitting structure of “” could be a reflection of slow shocks at the remote footpoint, which is similar to the simulation work of Fang et al. (2015). We also notice that “” becomes brighter in the AIA 131 Å passband when it propagates toward the remote footpoint. This enhancement may be attributed to a projection effect and/or an increase in density from the loop top toward the footpoint.
Using Equation 1 and Equation 3, the temperature and number density of the jet is found to be about K and 1.0 cm-3. The magnetic energy propagating rate along the jet (erg s-1) includes the enthalpy energy transferred rate , wave energy transferred rate , radiative energy transferred rate , potential energy transferred rate , and kinetic energy transferred rate , where , , , , , and are the plasma pressure, the area of cross-section of the jet, the mass density, the Boltzmann constant, the amplitude of unresolved non-thermal plasma motion, the field strength and the ratio of the specific heats, respectively (Pucci et al., 2013; Joshi & Chandra, 2019). In the present case, the enthalpy and kinetic energy transferred rate is calculated as 1.7 erg s-1 and 1.2 erg s-1, respectively. The energy rates of the RB obtained in Section 3 are a few times the kinetic energy rate of the jet and take one third of the enthalpy energy rate of the jet. If generations of the second peak of the RB is caused by slow shock heating, its energy rate is regarded as . Therefore, except for radiation energy, the majority of energy released by magnetic reconnection goes into the enthalpy energy of the jet, and the energy carried by waves is also significant.
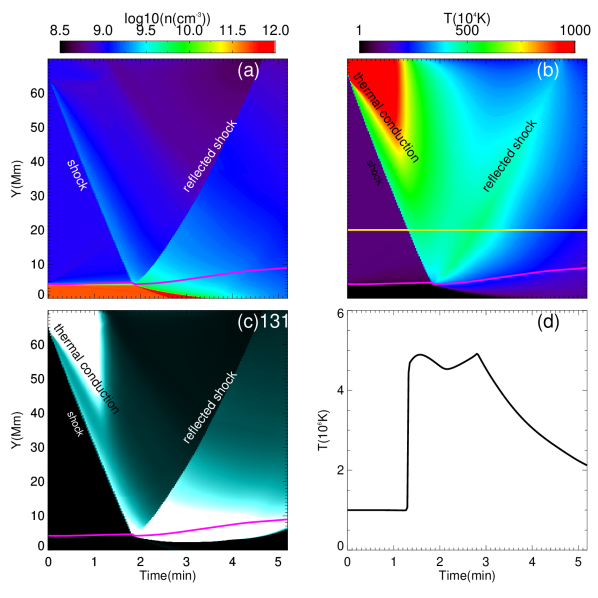
Since it is well known that coronal EUV jets are results of magnetic reconnection (Raouafi et al., 2016, and references therein) that can heat local plasmas to more than 10 million degrees (Pontin & Priest, 2022). To elucidate the possible nature of “” and “”, we conduct a straightforward numerical experiment based on PLUTO, an open-source MHD numerical code developed by Mignone et al. (2007). The simulation results are shown in Figure 4. In the simulation, we follow the evolution of a one-dimensional solar atmosphere with thermal conduction included. To initiate the experiment, a hot heating source at 10 MK is introduced at locations of Mm in the corona, and sustained for 1 minute. The simulation reveals that the rapid heating in the corona immediately results in a shock wave, as indicated by the slope of compression in Figure 4(a). The shock wave travels at a speed of 550 km s-1, which lies between the sound speed (165 km s-1) and the Alfvén speed (900 km s-1) in the corona. Upon reaching the top of the chromosphere, the shock wave is reflected at approximately 400 km s-1, and it also significantly heats the chromosphere to temperatures exceeding one million Kelvin (see Figure 4(b)). The heated chromospheric plasmas ascend as a result of evaporation. This observed propagation of the slow shock is in agreement with our observations of the “propagating emitting structures” of “” and “”. The lower chromosphere is then heated by thermal conduction. In Figure 4(d), we are show the variation of temperature at the location of Y=20 Mm. We can see an increasing trend in temperature after the shock passes through, which is consistent with that derived from the observations as shown in Figure 3(k).
We note that the leading edge of the major heated plasmas progresses at a speed of about 300 km s-1 (see the temperature structure in red shown in Figure 4(b)), which may account for the “flow” of “” observed in our data that is also particularly falling in a specific temperature range (c.f., Figure 3(d)). Such a flow could be representative of the major thermal conduction or entropy flows in the system. In ideal conditions, propagation speeds of thermal conduction discontinuity should be higher than that found here (Rust et al., 1985; Shimojo et al., 2007; Fang et al., 2015). The propagation of thermal conduction discontinuity in our simulation might have been suppressed due to shock heating ahead. These phenomena are well-presented in the synthetic AIA 131 Å emissions as shown in Figure 4(c).
Pariat et al. (2016) showed that the generation of a jet is accompanied by a non-linear fast wave with untwisting characteristics. One would ask whether such a non-linear untwisting wave is at work in the present case. In the present case, such an untwisting wave might be generated due to the existence of the twisted magnetic field at the eruption site as presented in the field extrapolations, even though it does not show in our observations. According to the study of Pariat et al. (2016), such a fast untwisting wave will cause blue shifts and/or red shifts in spectral observations, and this shall be an interesting aspect for a future study with appropriate data. In our observations, “” causes increases in the local plasma density, which is likely produced by a shock wave and a fast untwisting wave might also be generated at the same time. On the other hand, such a non-linear untwisting wave cannot reproduce by our simulation because a torsional motion is required. Nevertheless, our 1D simulation provides a plausible explanation for the second peak of the RB, although the other scenarios cannot be ruled out.
According to the analyses above, we conclude that the second peak of the RB is indicative of chromospheric heating by slow shocks, which are generated in the magnetic reconnection at the erupting site, with thermal conduction also playing a role. The first peak of the RB is not connected to any flows originating from the erupting site and appears only 12 seconds after the jet’s eruption (at the limit of the data’s temporal resolution). This implies a minimum energy propagation speed of 4800 km s-1 from the erupting site to the remote footpoint. Consequently, we suggest that the first peak of the RB is very likely due to heating by nonthermal electrons accelerated by the magnetic reconnection.
5 Conclusions
Remote brightenings (RBs) are phenomena associated with energy propagation that is confined by the magnetic field of the sun. In the present work, we report on observations of an RB that exhibits multiple episodes resulting from a coronal EUV jet confined in coronal loops. Such a dynamics in the RB phenomenon has never been studied in the past, although we notice that it can be seen in many events presented in the literature (e.g. Li et al., 2018; Huang et al., 2020; Devi et al., 2020). By analyzing the dynamics of multiple episodes of the RB, we are able to infer how the energy of the jet is distributed in the solar atmosphere and also the physics behind the jet.
In the present cases, the RB clearly shows two stages of brightening in the AIA EUV passbands. The first peak of the RB occurs 12 s after the peak of the jet, which is at the limit of the temporal resolution of the observations and suggests a minimum energy propagating speed of 4 800 km s-1. The second peak of the RB occurs 108 s after the peak of the jet. The energies that sustain two peaks of the RB are about erg and erg, respectively. The energy consumption rates corresponding to the impulsive phase of the first peak is erg s-1 and that for the second peak is erg s-1. These are significant in the total energy of the event.
The jet is confined within magnetic loops, which span approximately 58 Mm in length. In the AIA 131 Å passband, we observe four distinct streams of “propagating emitting structures” or “flows” originating from the jet’s eruption site. These include two flows, “” and “”, with speeds of 70 km s-1 and 90 km s-1, a third one, “”, with a speed of approximately 260 km s-1, and a fourth one, “”, with a speed of about 750 km s-1. Both “” and “” exhibit falling-back motions, suggesting that they are ejecta from the jet. Obviously, the second peak of the RB is associated with and directly caused by “”. Upon reaching the remote footpoint and leading to the second peak of the RB, “” generates a “reflected flow” () with a speed of approximately 590 km/s.
DEM analyses reveal that the erupting site of the jet has responses in temperatures ranging from =5.8 to =7.0. For the “flows”, “” and “” are in the range of =5.8–6.7; “” is =5.8–6.1; “” is =7.0–7.3; “” is =6.7–7.3. For the RB, the first peak is in the range of =6.1–6.7, and the second one is =6.1–7.0.
The sound speed and Alfvén speed within the jet flows are found to be about 170 km s-1 and 2 100 km s-1, respectively. The “flows” of “”, “” and “” are faster than the sound speed but slower than the Alfvén speed. Our one-dimensional simulation has successfully reproduced the observations of these “flows” and an RB. The numerical experiment suggests that ”” represents the propagation of thermal conduction discontinuity or entropy flow. It indicates that “” is indicative of a slow shock, a product of magnetic reconnection processes that also generate the coronal EUV jet. Our simulations indicate that “flows” observed in images of a coronal EUV jet might have various natures.
Therefore, we conclude that the second peak of the RB is the signature of chromospheric heating by slow shocks generated in the magnetic reconnection at the erupting site. In this process, thermal conduction also plays a role as pointed out by Xia et al. (2022) who show that thermal conduction is the main dissipation mechanism for waves. Regarding the first peak of the RB, its rapid response to the erupting site leads us to suggest that it is due to heating by nonthermal electrons accelerated by the magnetic reconnection (Tang & Moore, 1982; Chen et al., 2023). Our observations indicate that the energy carried by slow shocks is greater than that carried by nonthermal electrons in a particular magnetic reconnection process, despite the latter being more impulsive.
Our analyses demonstrate that the dynamics within an RB can offer vital insights into the physical processes associated with its driving eruption, including how energy from an activity is distributed within the solar atmosphere. A study of RBs is essential for understanding the nature of eruptions confined by magnetic loops in the solar atmosphere.
References
- Balasubramaniam et al. (2005) Balasubramaniam, K. S., Pevtsov, A. A., Neidig, D. F., et al. 2005, ApJ, 630, 1160, doi: 10.1086/432030
- Chandra et al. (2009) Chandra, R., Schmieder, B., Aulanier, G., & Malherbe, J. M. 2009, Sol. Phys., 258, 53, doi: 10.1007/s11207-009-9392-z
- Chen et al. (2023) Chen, Y., Cheng, X., Chen, J., Dai, Y., & Ding, M. 2023, ApJ, 959, 67, doi: 10.3847/1538-4357/ad09d8
- Cheng et al. (2012) Cheng, X., Zhang, J., Saar, S. H., & Ding, M. D. 2012, ApJ, 761, 62, doi: 10.1088/0004-637X/761/1/62
- Cheung et al. (2015) Cheung, M. C. M., Boerner, P., Schrijver, C. J., et al. 2015, ApJ, 807, 143, doi: 10.1088/0004-637X/807/2/143
- Deng et al. (2013) Deng, N., Tritschler, A., Jing, J., et al. 2013, ApJ, 769, 112, doi: 10.1088/0004-637X/769/2/112
- Devi et al. (2020) Devi, P., Joshi, B., Chandra, R., et al. 2020, Sol. Phys., 295, 75, doi: 10.1007/s11207-020-01642-y
- Fang et al. (2015) Fang, X., Yuan, D., Van Doorsselaere, T., Keppens, R., & Xia, C. 2015, ApJ, 813, 33, doi: 10.1088/0004-637X/813/1/33
- Huang et al. (2012) Huang, Z., Madjarska, M. S., Doyle, J. G., & Lamb, D. A. 2012, A&A, 548, A62, doi: 10.1051/0004-6361/201220079
- Huang et al. (2014) Huang, Z., Madjarska, M. S., Xia, L., et al. 2014, ApJ, 797, 88, doi: 10.1088/0004-637X/797/2/88
- Huang et al. (2020) Huang, Z., Zhang, Q., Xia, L., et al. 2020, ApJ, 897, 113, doi: 10.3847/1538-4357/ab96bd
- Joshi & Chandra (2019) Joshi, R., & Chandra, R. 2019, JMR, 14, 43, doi: 10.51220/jmr.v14i1.10
- Kashapova et al. (2020) Kashapova, L. K., Kupriyanova, E. G., Xu, Z., Reid, H. A. S., & Kolotkov, D. Y. 2020, A&A, 642, A195, doi: 10.1051/0004-6361/201833947
- Kundu et al. (1983) Kundu, M. R., Rust, D. M., & Bobrowsky, M. 1983, ApJ, 265, 1084, doi: 10.1086/160750
- Lemen et al. (2012) Lemen, J. R., Title, A. M., Akin, D. J., et al. 2012, Sol. Phys., 275, 17, doi: 10.1007/s11207-011-9776-8
- Li et al. (2018) Li, T., Yang, S., Zhang, Q., Hou, Y., & Zhang, J. 2018, ApJ, 859, 122, doi: 10.3847/1538-4357/aabe84
- Liu et al. (2006) Liu, C., Lee, J., Deng, N., Gary, D. E., & Wang, H. 2006, ApJ, 642, 1205, doi: 10.1086/501000
- Liu et al. (2020) Liu, C., Prasad, A., Lee, J., & Wang, H. 2020, ApJ, 899, 34, doi: 10.3847/1538-4357/ab9cbe
- Masson et al. (2009) Masson, S., Pariat, E., Aulanier, G., & Schrijver, C. J. 2009, ApJ, 700, 559, doi: 10.1088/0004-637X/700/1/559
- Mignone et al. (2007) Mignone, A., Bodo, G., Massaglia, S., et al. 2007, ApJS, 170, 228, doi: 10.1086/513316
- Mou et al. (2016) Mou, C., Huang, Z., Xia, L., et al. 2016, ApJ, 818, 9, doi: 10.3847/0004-637X/818/1/9
- Pariat et al. (2010) Pariat, E., Antiochos, S. K., & DeVore, C. R. 2010, ApJ, 714, 1762, doi: 10.1088/0004-637X/714/2/1762
- Pariat et al. (2016) Pariat, E., Dalmasse, K., DeVore, C. R., Antiochos, S. K., & Karpen, J. T. 2016, A&A, 596, A36, doi: 10.1051/0004-6361/201629109
- Pontin & Priest (2022) Pontin, D. I., & Priest, E. R. 2022, Living Reviews in Solar Physics, 19, 1, doi: 10.1007/s41116-022-00032-9
- Pucci et al. (2013) Pucci, S., Poletto, G., Sterling, A. C., & Romoli, M. 2013, ApJ, 776, 16, doi: 10.1088/0004-637X/776/1/16
- Raouafi et al. (2016) Raouafi, N. E., Patsourakos, S., Pariat, E., et al. 2016, Space Sci. Rev., 201, 1, doi: 10.1007/s11214-016-0260-5
- Rust et al. (1985) Rust, D. M., Simnett, G. M., & Smith, D. F. 1985, ApJ, 288, 401, doi: 10.1086/162804
- Scherrer et al. (2012) Scherrer, P. H., Schou, J., Bush, R. I., et al. 2012, Sol. Phys., 275, 207, doi: 10.1007/s11207-011-9834-2
- Shimojo et al. (2007) Shimojo, M., Narukage, N., Kano, R., et al. 2007, PASJ, 59, S745, doi: 10.1093/pasj/59.sp3.S745
- Strong et al. (1992) Strong, K. T., Harvey, K., Hirayama, T., et al. 1992, PASJ, 44, L161
- Su et al. (2018) Su, Y., Veronig, A. M., Hannah, I. G., et al. 2018, ApJ, 856, L17, doi: 10.3847/2041-8213/aab436
- Sun et al. (2013) Sun, X., Hoeksema, J. T., Liu, Y., et al. 2013, ApJ, 778, 139, doi: 10.1088/0004-637X/778/2/139
- Tang & Moore (1982) Tang, F., & Moore, R. L. 1982, Sol. Phys., 77, 263, doi: 10.1007/BF00156109
- Uddin et al. (2006) Uddin, W., Chandra, R., & Ali, S. S. 2006, Journal of Astrophysics and Astronomy, 27, 267, doi: 10.1007/BF02702529
- Wang et al. (2023) Wang, B. T., Cheng, X., Li, C., Chen, J., & Ding, M. D. 2023, ApJ, 953, 172, doi: 10.3847/1538-4357/ace319
- Wang (2005) Wang, H. 2005, ApJ, 618, 1012, doi: 10.1086/426104
- Wang et al. (2002) Wang, H., Gallagher, P., Yurchyshyn, V., Yang, G., & Goode, P. R. 2002, ApJ, 569, 1026, doi: 10.1086/339349
- Wang & Liu (2012) Wang, H., & Liu, C. 2012, ApJ, 760, 101, doi: 10.1088/0004-637X/760/2/101
- Wang et al. (2014) Wang, H., Liu, C., Deng, N., et al. 2014, ApJ, 781, L23, doi: 10.1088/2041-8205/781/1/L23
- Wei et al. (2023) Wei, H., Huang, Z., Li, C., et al. 2023, ApJ, 958, 116, doi: 10.3847/1538-4357/acf569
- Wiegelmann (2007) Wiegelmann, T. 2007, Sol. Phys., 240, 227, doi: 10.1007/s11207-006-0266-3
- Wyper & DeVore (2016) Wyper, P. F., & DeVore, C. R. 2016, ApJ, 820, 77, doi: 10.3847/0004-637X/820/1/77
- Xia et al. (2022) Xia, F., Wang, T., Su, Y., et al. 2022, ApJ, 936, L13, doi: 10.3847/2041-8213/ac8afe
- Yang et al. (2013) Yang, L., He, J., Peter, H., et al. 2013, ApJ, 777, 16, doi: 10.1088/0004-637X/777/1/16
- Yang et al. (2014) Yang, S., Zhang, J., & Xiang, Y. 2014, ApJ, 793, L28, doi: 10.1088/2041-8205/793/2/L28
- Zhang et al. (2022) Zhang, Y., Zhang, Q., Song, D., et al. 2022, ApJS, 260, 19, doi: 10.3847/1538-4365/ac5f4c
- Zheng et al. (2015) Zheng, R., Korsós, M. B., & Erdélyi, R. 2015, ApJ, 809, 45, doi: 10.1088/0004-637X/809/1/45