Wave induced fracture of a sea ice analog
Abstract
We study at the laboratory scale the rupture of thin floating sheets made of a brittle material under wave induced mechanical forcing. We show that the rupture occurs where the curvature is maximum, and the break up threshold strongly depends on the wave properties. We observe that the corresponding critical stress for fracture depends on the forcing wavelength: our observations are thus incompatible with a critical stress criteria for fracture. Our measurements can rather be rationalized using a energy criteria: a fracture propagates when the material surface energy is lower than the released elastic energy, which depends on the forcing geometry. Our results suggest that current models of sea ice fracture by ocean waves could be refined.
Introduction - Breaking a paper sheet with bending is difficult: for thin ductile materials, the strain induced by bending never exceeds its break-up threshold, even for a radius of curvature smaller than the sheet thickness . On the contrary, for brittle materials, a radius of curvature much larger than can be sufficient to induce breaking. Sea ice, for instance, is broken by ocean swell even when its thickness ( 1 m) is hundred times smaller than the local radius of curvature at the crests and troughs of the forcing wave train Lu et al. (2008); Asplin et al. (2012); Liu and Mollo-Christensen (1988). This phenomenon occurs in particular in the marginal ice zone (MIZ) Dumont (2022), the polar regions partially covered by sea ice fragments. These MIZ play a crucial role in arctic climate dynamics Eayrs et al. (2019) and polar marine biology Ardyna et al. (2014). The fracture of a thin, elastic, brittle sheet depends on the forcing geometry, and the presence of existing cracks Dirgantara and Aliabadi (2002); Hasebe and Inohara (1980). When a thin sheet floats on a liquid surface, the stresses are applied through surface waves. Therefore, the break up threshold should result from an interplay between the mechanical properties of the sheet and the wave characteristics. The deformations of an elastic sheet by surface waves have been previously studied in the linear Domino et al. (2018) or weakly non linear regime Deike et al. (2017), without fracture dynamics. The linear deformations of a thin sheet with negligible inertia, floating on a liquid with negligible surface tension follow the dispersion relation of hydro-elastic waves Lamb (1917),
| (1) |
where is the angular frequency, the wavenumber, the acceleration of gravity, the liquid density and the flexural modulus. The modulus is related to the mechanical properties of the sheet, , with the Young’s modulus and the Poisson ratio. The elasto-gravity length separates the gravity dominated regime () from the elastic regime . For a circular floe excited by free surface waves, the deformation depends on the wave regime of propagation Montiel et al. (2013a, b), hence we expect the breakup threshold to depend on the ratio . Although the mechanical properties and the fracture threshold of sea ice are known to be complex Petrovic (2003); Timco and Weeks (2010), the break up criterion currently used in regional and global models is a critical strain Voermans et al. (2020); Li et al. (2021), independent of the ice mechanical properties and the flexural length . Example of direct observation of natural sea ice breaking by wavese Dumas-Lefebvre and Dumont (2023) as well as laboratory experiments Herman et al. (2018) have shown that sea ice indeed breaks under bending. However, they did not vary systematically the forcing geometry to test different criterion. One recent study by L. Saddier et al. Saddier et al. (2024) used a mimetic material, made of a granular raft, the capillary aggregation of micrometric particles Planchette et al. (2012), to observe the fracture of a granular layer by waves. They show that the raft broke under viscous stresses induced by the waves, a different fracture mechanism than bending induced fracture.
In this letter, we study the fracture of a thin brittle sheet at the laboratory scale. The floating crust is made of a material fragile enough to break under the action of surface waves. Using stationary waves, we show that it breaks under bending stresses, similarly to sea ice break up by ocean swell. We vary the wavelength of the forcing for the same sheet thickness, and we discriminate between several fracture criteria. We model the fracture threshold with an energetic criteria. The critical stress eventually depends on the forcing geometry. We eventually discuss the potential implication of our findings to the fracture of sea ice by ocean waves.
Experimental set-up - We form a thin brittle solid crust floating on the water surface, using a commercial glue varnish (Vernis-colle spray Megacrea DIY 28715). The varnish is sprayed from a height of about cm on a water volume of x x cm. The varnish drops dry on the water surface, forming a floating, textured and semi-transparent solid crust. We combine pycnometer measurements and weight of the deposited mass to deduce the average varnish thickness and density. We found a varnish density kg.m-3, and using the covered area , we extract a typical thickness m. In practice, we measured systematically the deposited mass, showing significant variations of the varnish thickness from an experimental realisation to another. For one varnish crust we also observe spatial variations of its transparency. Using the Beer-Lambert absorption law, we infer that the varnish cover is spatially heterogeneous, corresponding to a spatial thickness variation of 25%. The varnish crust is composed of micro-droplets that solidify into grains and coagulate together in about ten minutes. The crust also presents heterogeneities at the droplet scale of about tens of microns.
To characterize the varnish mechanical properties, we use the experimental set up sketched in [Fig. 1a)]. Sinusoidal plane waves are generated with a linear motor (LinMot DM01-23x80F-HP-R-60_MS11), which actuates an inclined plate oriented with an angle - with the vertical. We vary the wave frequency from to Hz, and concomitantly the amplitude from to mm. For these small wave amplitudes, the varnish does not break, and waves propagate at the surface.
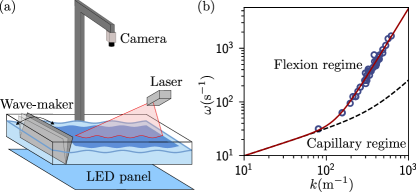
We use a one dimensional profilometry system to extract the wave properties (, , wavenumber ). A laser sheet is projected onto the varnish surface with an angle ranging from to to adapt the magnification ratio, which ranges from 1.7 and 11, depending on the required vertical resolution. We record top-view images of the varnish and the laser line with a Basler a2A1920-160ucBAS color camera of resolution x pixels, corresponding to a x cm field of view. The sampling frequency is chosen to capture a minimum of 5 images per wave period. Using image processing, we extract the position of the laser line with sub-pixel accuracy. We eventually obtain the wavenumber and the amplitude of the surface wave from spatial Fourier analysis. [Fig. 1b)] shows the dispersion relation (blue losange) of the surface waves, namely the angular frequency as a function of the wavenumber for a varnish layer of thickness m. We observe hydro-elastic waves, following the dispersion relation (eq. 1). The flexural modulus depends on the Young’s modulus , the thickness , and the Poisson’s ratio . Using as a fit parameter, we obtain a quantitative agreement with J.m-2. We find that the varnish layer behave as a solid, and we associate a flexural length
| (2) |
that separates the gravito-capillary wave regime () from the hydro-elastic () wave regime. Repeating the experiment for different varnish layers, we extract systematically the flexural modulus and the varnish thickness. We find the average varnish Young’s modulus MPa using . The corresponding flexural length is always larger than the capillary length ( mm). The capillarity is then negligible for all wavelengths.
Fracturing with waves - For larger wave amplitudes, the varnish layer fractures into multiple fragments. [Fig. 2a)] shows 3 snapshots of the varnish layer seen from above, after respectively 12, 105 and 203 periods of oscillation, for Hz , mm , m and a wavelength cm. We observe that the fragmentation of the varnish layer is a complex phenomenon. The orientation and the size of the first fractures presents a wide distribution. On a longer time scale, the fragments collide and get eroded. This leads to the creation of very small fragments with a typical grain size of m, while the shape of the larger fragments become more circular. At last, fragmentation and erosion continues until only grain size fragments are left. To better control the geometry of the first fractures, we modify the setup to produce stationary waves. For each forcing frequency, we adapt the length of the water tank to a multiple of half the wavelength. As a consequence, a stationary wave pattern is excited and the waves impose to the varnish layer a peculiar stress field: the nodes maximize tensions, whereas the crest/trough (anti-nodes) maximize bending. [Fig. 2b)] presents a photograph of an experiment with 3 wavelengths after 307 forcing periods with cm, mm, Hz and m. Stationary, planar waves are produced, but the spatial shape is non linear since .
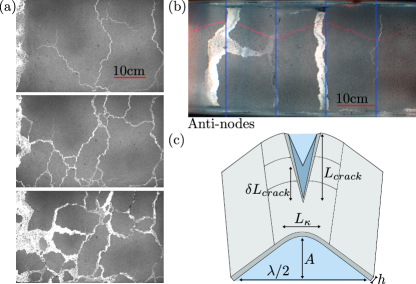
The laser line used for the profilometry appears in red, and we have super-imposed in solid blue the position of the anti-nodes. We observe that the varnish layer breaks along 4 lines parallel to the wave front separated by . Occasionally, secondary fractures appear in the direction perpendicular to the wave front but we will here focus on the primary fractures. They appear at the anti-nodes of the stationary waves, which correspond to a maximum of curvature , i.e. the locii where the flexural stresses are maximal. We thus conclude that the physical mechanism responsible for the varnish fracture is flexion rather than mechanical tension.
Fracture threshold - We will now focus on the appearance of primary fractures. To study the fracture threshold, we excite stationary waves starting from a liquid surface at rest. Doing so, the surface presents a peculiar transient regime. The wave amplitude first grows to a maximum over a few periods, and then decays to approximately 70% of the maximum, reaching a stationary regime. The crack evolution is observed only around the 2-3 periods when the amplitude is maximal. After this transient regime, we do not observe evolution over the following 100 periods. We design this procedure to avoid fatigue effects.
[Fig. 2c)] presents a sketch of the fracture geometry in the vicinity of an existing crack. We assume that the waves are planar, with an amplitude , a frequency , and a wavelength . As the waves are non linear, the curvature profile is not proportional to the local height. We define the typical size on which the curvature is maximal, and the length of the first crack.
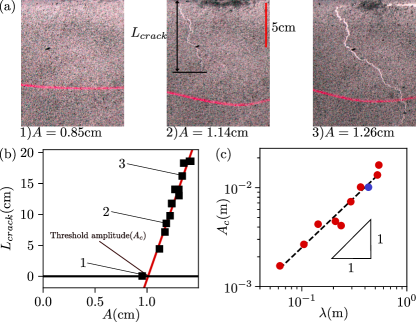
[Fig. 3a)] shows an experiment with Hz, cm and m for three increasing forcing amplitudes . We observe that the varnish layer fractures above a critical threshold , on a finite crack length (images 1 to 3). The crack length increases rapidly with the forcing amplitude. In order to extract the threshold amplitude of crack apparition, we plot the crack length as a function of on [Fig. 3b)]. We observe that is an affine function of for .
We then vary the wave frequency and we measure the critical wave amplitude for a wavelength ranging from to cm, and for different varnish layers [Fig. 3c)]. We observe that the threshold amplitude is proportional to the wavelength corresponding to a constant steepness , corresponding to a non linear wave regime of propagation. Consequently, the amplitude threshold cannot be simply related to the local curvature , which is one of the relevant parameter to describe the flexural stress profile applied on the material.
Fracture models - We propose an energy based criterion to model the crack propagation induced by the waves. Starting from an existing crack, such an energy criteria for fracture propagation results from the balance between the increment of surface energy required to form a new surface and the elastic energy released when the crack propagates on a small distance . The fracture energy writes:
| (3) |
with the energy release rate, a material mechanical property and the newly formed crack surface. The elastic energy released by the crack propagation can be written as Griffith (1921) :
| (4) |
where is the difference between the curvature field around a crack of length and a crack of length . The curvature along the crack vanishes, we thus estimate the variation of elastic energy around the crack as:
| (5) |
where is the characteristic length on which the curvature is released, in the direction perpendicular to the crack, as sketched on [Fig. 2c)].
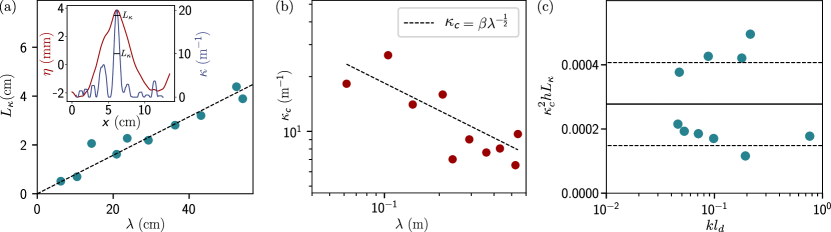
The specificity of this criterion for breaking with waves lies in the geometry, as the waves apply a stress field, with significant bending energy near the wave crest and through. The insert in [Fig. 4a)] shows a wave spatial profile (red line) and the associated curvature profile (blue line) at the amplitude threshold for fracture. We measure as the half width of the curvature peak. [Fig. 4a)] shows at threshold as a function of . Black dash line corresponds to a linear fit with . For each varnish and wavelength, we also measure the maximum of curvature by fitting a second order polynomial on the crest of the wave for different wave amplitudes. We assume that for weak nonlinear wave profile, the curvature can be expressed as , with and two unknown coefficients. We fit the coefficients and for each wavelength, to eventually compute the curvature threshold corresponding to the amplitude threshold .
[Fig.4 b)] shows the critical curvature as a function of the wavelength . We observe that the curvature threshold decreases with the wavelength. We can compare our observation with the energy criterion. The threshold is reached when the elastic energy released by the crack propagation is equal to the energy cost of surface creation. We define the break-up criterion as:
| (6) |
We deduce that at the break-up threshold:
| (7) |
where is the surface energy of the material, independent of the wave properties. [Fig.4 c)] shows as a function of the dimensionless wavenumber . We observe no clear trend with the wavelength, although the experimental measurements are scattered. We deduce that is a material constant, , and we do not observe any clear trend of with the varnish thickness . However, the range of explored thicknesses is too small to be conclusive. Combining the results of figures 4a and c), we eventually deduce that the critical curvature for breakup scales as with m-1/2, which is self-consistent with the experimental observations, as shown by the dashed black line of figure 4b).
Discussion - In this study, we manage to form a thin crust of a brittle material floating on a water surface, and we measure its elastic properties using a non invasive technique. Excited by gravity waves, the crust breaks from bending and we show that the breakup threshold depends on the forcing geometry. The corresponding critical stress for fracture propagation also depends on the forcing wavelength: our observations are incompatible with a critical stress criteria for fracture. Our measurements can rather be rationalized using a energy criteria: the elastic energy release scales with the length , defined as the bending length of the crest. This corresponds to Griffith criteria for fracture, in which the characteristic length here depends on the forcing geometry rather than the defect size Griffith (1921). At much larger scale, sea ice fracture is currently modeled by a critical stress Voermans et al. (2020). However, a large uncertainty remains on the breakup threshold. Our results at the laboratory scale suggest that the break up criteria for sea ice may also depend on the forcing geometry, hence on the dimensionless wavenumber . In practice, the observations remain too scarce to isolate the effects of the forcing scale on the fracture threshold. We expect that further experiments on ice at various forcing scales could help to better understand the fracture of sea ice by ocean swell.
Acknowledgements.
This work has benefited from the financial support of Mairie de Paris through Emergence(s) grant 2021-DAE-100 245973, and from the Agence Nationale de la Recherche through grant MSIM ANR-23-CE01-0020-02.References
- Lu et al. (2008) P. Lu, Z. Li, Z. Zhang, and X. Dong, Journal of Geophysical Research 113 (2008).
- Asplin et al. (2012) M. G. Asplin, R. Galley, D. G. Barber, and S. Prinsenberg, Journal of Geophysical Research: Oceans 117 (2012).
- Liu and Mollo-Christensen (1988) A. K. Liu and E. L. Mollo-Christensen, Journal of Physical Oceanography 18, 1702 (1988), URL https://api.semanticscholar.org/CorpusID:140155505.
- Dumont (2022) D. Dumont, Philosophical Transactions of the Royal Society A: Mathematical, Physical and Engineering Sciences 380, 20210253 (2022).
- Eayrs et al. (2019) C. Eayrs, D. Holland, D. Francis, T. Wagner, R. Kumar, and X. Li, Reviews of Geophysics 57, 1037 (2019).
- Ardyna et al. (2014) M. Ardyna, M. Babin, M. Gosselin, E. Devred, L. Rainville, and J.-É. Tremblay, Geophysical Research Letters 41, 6207 (2014).
- Dirgantara and Aliabadi (2002) T. Dirgantara and M. Aliabadi, Engineering Fracture Mechanics 69, 1465 (2002), ISSN 0013-7944.
- Hasebe and Inohara (1980) N. Hasebe and S. Inohara, Ingenieur-Archiv 49, 51 (1980), ISSN 1432-0681.
- Domino et al. (2018) L. Domino, M. Fermigier, E. Fort, and A. Eddi, EPL (Europhysics Letters) 121, 14001 (2018).
- Deike et al. (2017) L. Deike, M. Berhanu, and E. Falcon, Phys. Rev. Fluids 2, 064803 (2017).
- Lamb (1917) H. Lamb, Proceedings of the Royal Society of London. Series A, Containing papers of a mathematical and physical character 93, 114 (1917).
- Montiel et al. (2013a) F. Montiel, F. Bonnefoy, P. Ferrant, L. G. Bennetts, V. A. Squire, and P. Marsault, Journal of Fluid Mechanics 723, 604–628 (2013a).
- Montiel et al. (2013b) F. Montiel, L. G. Bennetts, V. A. Squire, F. Bonnefoy, and P. Ferrant, Journal of Fluid Mechanics 723, 629–652 (2013b).
- Petrovic (2003) J. J. Petrovic, Journal of Materials Science 38, 1 (2003).
- Timco and Weeks (2010) G. Timco and W. Weeks, Cold regions science and technology 60, 107 (2010).
- Voermans et al. (2020) J. J. Voermans, J. Rabault, K. Filchuk, I. Ryzhov, P. Heil, A. Marchenko, C. O. Collins III, M. Dabboor, G. Sutherland, and A. V. Babanin, The Cryosphere 14, 4265 (2020).
- Li et al. (2021) J. Li, A. V. Babanin, Q. Liu, J. J. Voermans, P. Heil, and Y. Tang, Journal of Marine Science and Engineering 9 (2021), ISSN 2077-1312, URL https://www.mdpi.com/2077-1312/9/4/365.
- Dumas-Lefebvre and Dumont (2023) E. Dumas-Lefebvre and D. Dumont, The Cryosphere 17, 827 (2023).
- Herman et al. (2018) A. Herman, K.-U. Evers, and N. Reimer, The Cryosphere 12, 685 (2018), URL https://tc.copernicus.org/articles/12/685/2018/.
- Saddier et al. (2024) L. Saddier, A. Palotai, M. Aksil, M. Tsamados, and M. Berhanu, Physical Review Fluids p. 094302 (2024).
- Planchette et al. (2012) C. Planchette, E. Lorenceau, and A.-L. Biance, Soft Matter 8, 2444 (2012).
- Griffith (1921) A. A. Griffith, Philosophical transactions of the royal society of london. Series A, containing papers of a mathematical or physical character 221, 163 (1921).