The MUSE Ultra Deep Field (VIII): A 5 Mpc stretch of the cosmic web revealed in emission
Abstract
We detect Ly emission from a Mpc-long (comoving) portion of the cosmic web hosting an overdensity () of 19 Ly emitters (LAEs) at within the MUSE Ultra Deep Field (MUDF), reaching an average surface brightness (SB) of erg s-1 cm-2 Å-1 arcsec-2. This large-scale structure has an average SB similar to the filament across the two MUDF quasars at . However, deep multiwavelength data do not show a clear presence of active galactic nuclei, suggesting that the emission is mainly regulated by the underlying gas density. We find dex higher star formation compared to control samples and a remarkable predominance () of blue-peaked emission lines in the spectra of the embedded LAEs, indicative of favorable conditions for gas accretion. Lastly, we quantify the contribution of intragalactic gas to the Ly SB profile at large distances from LAEs. By studying samples of filaments detected in emission within diverse environments, we are finally gaining new insight into the physics of gas accretion within the cosmic web.
1 Introduction
The emergence of structures on scales is a distinctive prediction of a (cold) dark matter (DM) dominated Universe, in which matter aggregates in overdense sheets and filaments at the intersection of which DM halos form (Klypin & Shandarin, 1983; Springel et al., 2005). Although shaped by pressure, baryons follow the gravitational potential exerted by the DM (Theuns et al., 1998; Bolton et al., 2017), thus tracking the configuration of the large-scale structure (LSS) and offering a test of theoretical predictions.
Indirectly, the geometry of the LSS can be reconstructed by using galaxies as tracers of the underlying matter distribution. Over thirty years of wide-area galaxy surveys have provided exquisite statistical constraints on the nature of DM (Davis et al., 1982; Tempel et al., 2014; Alam et al., 2017; Galárraga-Espinosa et al., 2022). Studying the Ly forest in absorption in quasar spectra is an even more direct probe (Rauch, 1998). Through these techniques, the notion of cosmic web – an intricate network of filaments connecting galaxies – developed (Bond et al., 1996).
Obtaining direct images of the intergalactic gas within this web of filaments has been a long-standing goal, as mapping the morphology of the intergalactic gas with high resolution would augment the diagnostic power for studying the LSS and, hence, the nature of dark matter. However, the intrinsic low surface brightness (SB) of hydrogen ionized by the extragalactic background and the redshift-induced SB dimming (Gould & Weinberg, 1996) made direct imaging of the cosmic web at erg s-1 cm-2 arcsec-2 challenging for decades.
Focusing on , the advent of sensitive integral-field spectrographs finally transformed this field. Initially, detections of filamentary tentacles extending from quasar host halos were reported (Borisova et al., 2016; Arrigoni Battaia et al., 2018; Martin et al., 2019), followed by the detection of emission patches aligned along filamentary structures extending for in overdense regions, such as the SSA22 protocluster (Umehata et al., 2019). Ultradeep observations in the MUSE Extremely Deep Field (MXDF; Bacon et al., 2021) further unveiled evidence of widespread filamentary emission near star-forming galaxies, including a Mpc-scale filament connecting an active galactic nucleus (AGN) with Ly emitters (LAEs). A filamentary nebula has also been discovered in a compact LAE group (Banerjee et al., 2024). Recently, a new ultradeep program in the MUSE Ultra Deep Field (MUDF; Fossati et al., 2019) provided a detailed view of a cosmic filament connecting two massive halos hosting quasars at , and measurements of its physical characteristics (Tornotti et al., 2024). In this work, we further extend the range of environments over which the cosmic web has been analyzed with detailed direct imaging and report a new detection of a filament connecting 19 low-mass star-forming galaxies across comoving Mpc at in the MUDF.
 |
 |
2 Cosmic structures in the MUDF
The MUSE Ultra Deep Field is a 142-hour VLT/MUSE program (PID 110.A-0528) designed to map the connection between gas and galaxies at remarkable depth in a field hosting two bright quasars at . This field has also been the subject of extensive follow-up campaigns from the X-ray to the near-infrared using Chandra, HST, and ALMA. Details of observations and data reduction can be found in previous MUDF publications (Lusso et al. 2019; Fossati et al. 2019; Revalski et al. 2023, 2024; Tornotti et al. 2024; Pensabene et al. 2024). In this work, we rely on the full mean-combined datacube, presented in Tornotti et al. (2024), that reaches a sensitivity of erg s-1 cm-2 Å-1 pix-1 (at Å) in the central region. The cube has been prepared for analysis by subtracting the point spread function of the quasars and of the continuum sources through a non-parametric algorithm (e.g., Borisova et al., 2016; Arrigoni Battaia et al., 2019).
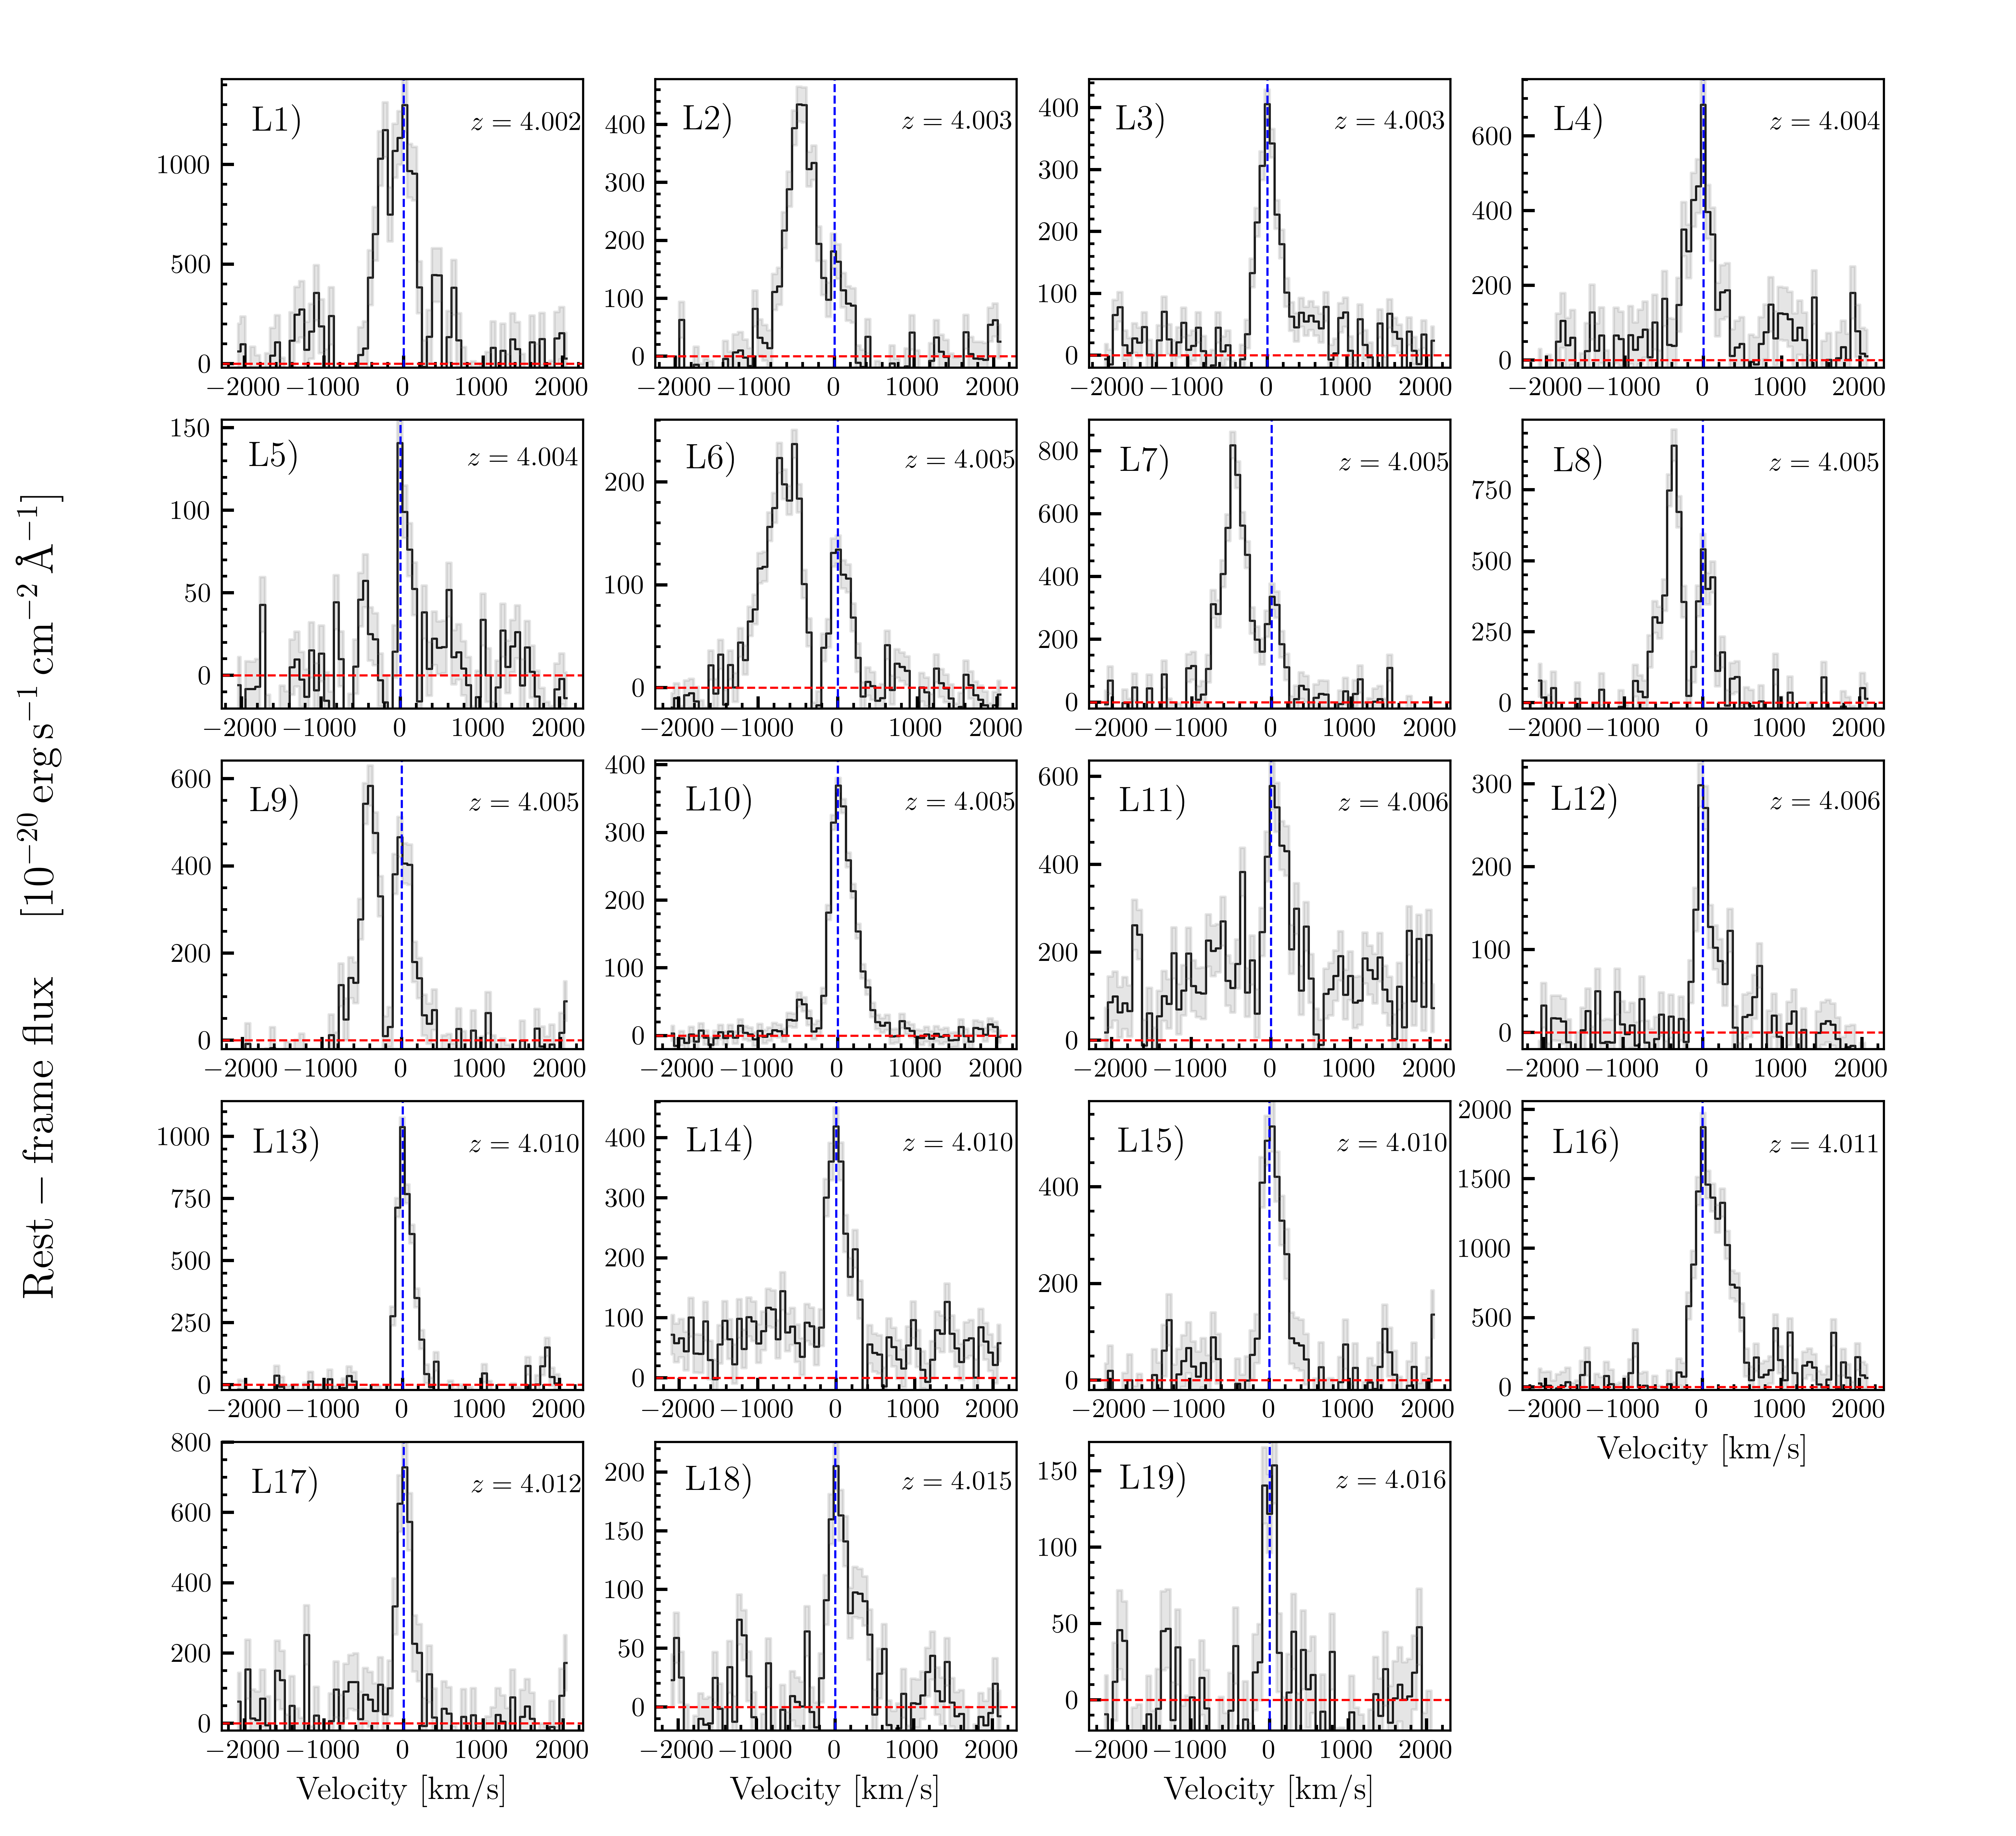
Two galaxy populations have been identified in the MUDF. The first population includes sources, pinpointed by optical and NIR spectroscopy of continuum-detected galaxies in the deep F140W HST image. Details of this catalog are presented in Revalski et al. (2023). The second population includes continuum-faint line emitters and, in particular, sources identified and classified by searching in the cube for Ly emission, as done in previous MUSE surveys (for details, see Fossati et al., 2021; Galbiati et al., 2023). For this work, we have produced a catalog, which we will present in detail in a forthcoming publication, containing LAEs at with integrated over the line. Our catalog reaches Ly luminosities of and is complete to at . The redshifts of the sources are assigned from the maximum of the Ly line. For double-peaked profiles without other non-resonant lines, the red peak is used to assign the redshift.
2.1 Identification of LAE groups
The redshift distribution of the LAEs detected in the MUDF suggests the presence of regions where galaxies are grouped on scales of Mpc, a signpost that filaments may be present (Bacon et al., 2021). Therefore, we identify LAE groups using an algorithm based on the Friends-of-Friends approach (e.g., Huchra & Geller, 1982). The galaxies are linked and considered group members if they are connected within linking lengths (a projected physical distance) and (a velocity in the redshift space). Using kpc and km s-1 (for the choice of parameters, see Fossati et al. 2019), we identify 32 systems of at least two or more galaxies. The complete LAE and group catalog will be presented in a forthcoming publication.
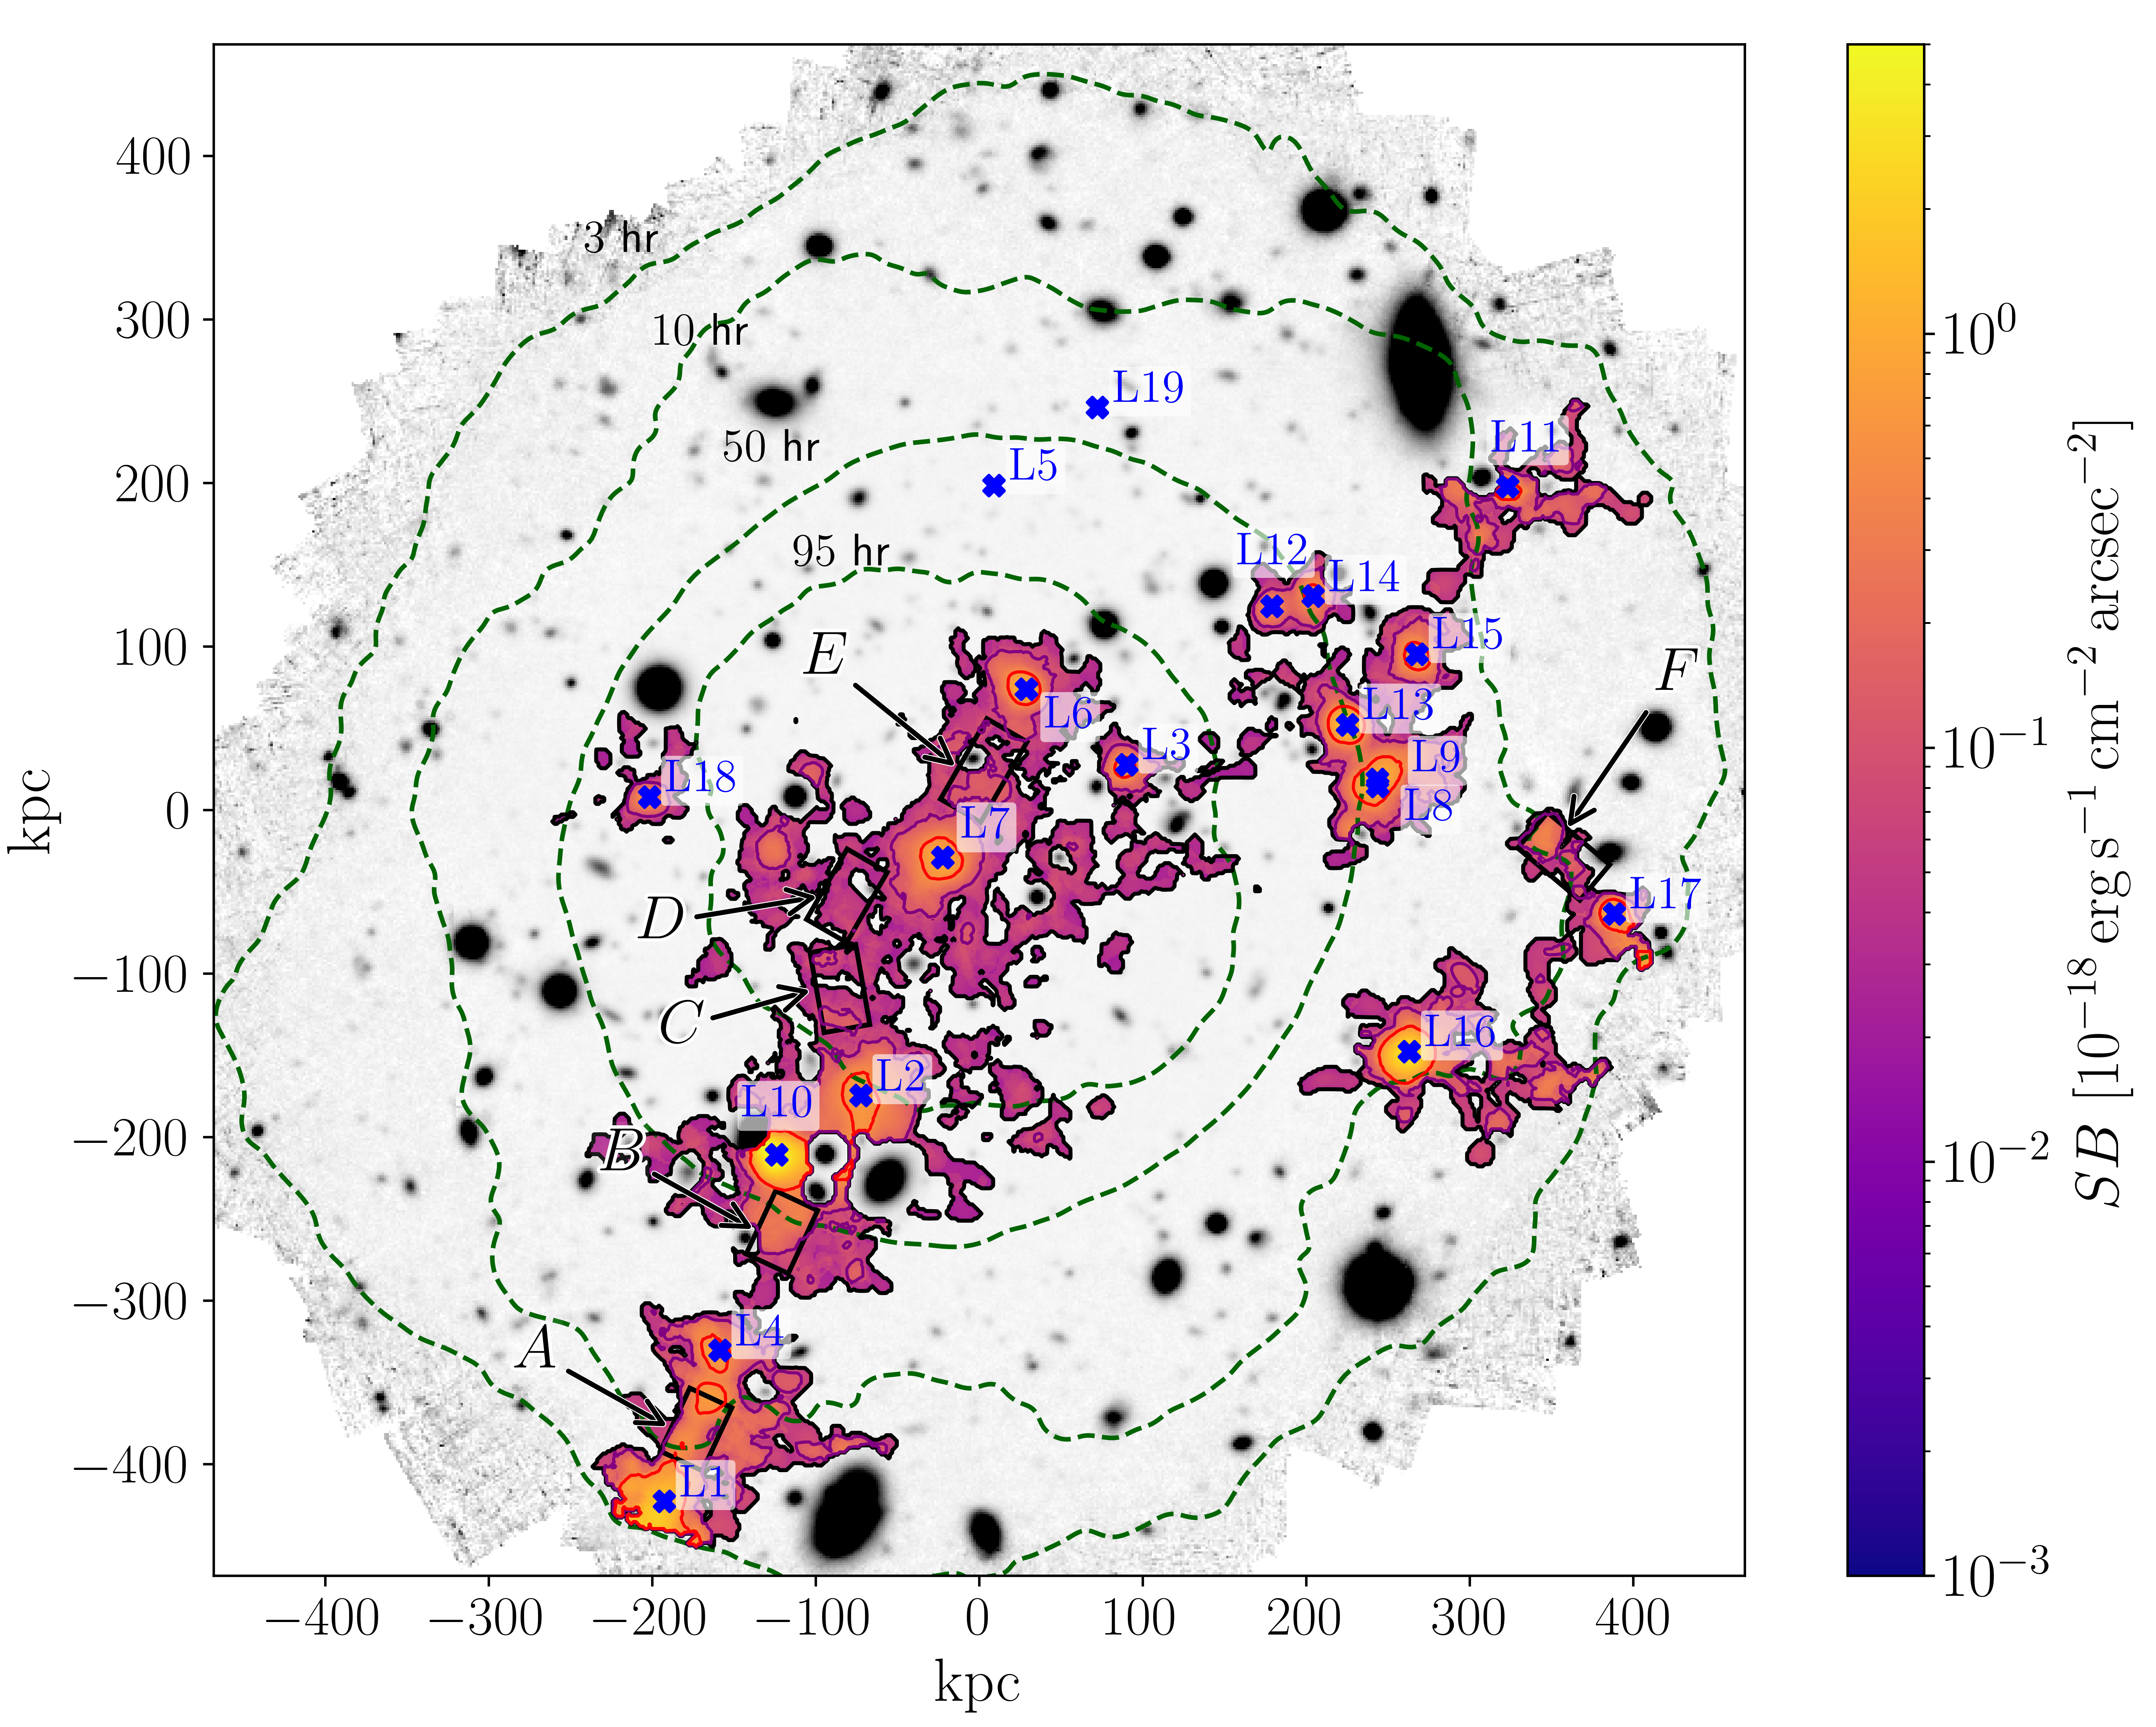
From this analysis, a group with a mean redshift is notable for its richness, as it is composed of at least 19 members (see Fig. 1). Its distribution in velocity space has a dispersion km s-1. All these galaxies are identified as LAEs, with only L4, L9, and L16 also showing continuum detection in HST/NIR imaging at the AB magnitude limit of in F140W (Revalski et al., 2023). No galaxies are detected in ALMA continuum observations (Pensabene et al., 2024) to a flux limit at 1.2 mm of mJy beam-1. Compared to a mean galaxy population, this group corresponds to an overdensity of . Here, is defined as the number of observed LAEs divided by the expected number based on our entire catalog within a velocity window of . Moreover, this group is characterized by a spatial alignment of most of the LAEs in the south-east (SE) and north-west (NW) direction in a long and narrow region of thickness kpc, suggestive of a filamentary structure. The focus of this paper is to search and study the diffuse Ly emission from this region.

3 Imaging the extended Ly emission
At the mean redshift of this LSS, we search for extended Ly emission around the LAEs following a similar methodology to what is detailed in Tornotti et al. (2024). Specifically, we identify connected voxels () with a signal-to-noise ratio () above a threshold of 2, with a minimum number of 500 spatial pixels. To increase the sensitivity at low SB, we apply a Gaussian kernel of pixels ( arcsec) in the spatial directions, masking all continuum sources obtained from the white-light image to avoid contamination from positive or negative residuals. We do not apply any smoothing kernel in the wavelength direction to preserve spectral resolution. Instead, we require at least adjacent spectral layers to be connected to avoid spurious detections. To identify connected pixels, we use an implementation of the algorithm by Rosenfeld & Pfaltz (1968) extended to 3D datasets using a decision tree algorithm known as Scan plus Array-based Union-Find (SAUF, Wu et al., 2005), implemented in a Python routine111The code is publicly available at: https://github.com/matteofox/SHINE.
We then classify as emission associated with this structure all groups of voxels that have a median velocity within km s-1 from the mean redshift of the LAE group. We have checked that the main emission structures are real and not artifacts of the parameter choice, as extracting a signal with different spatial smoothing (3 pixels) and thresholds (up to 2.5) would still identify the same extended emission. The detected signal is finally projected along the wavelength direction to obtain an extracted Ly image. The result is shown in Fig. 1 (left) superimposed to the white-light image of the field. From this analysis, we uncover a coherent structure in emission that traces gas in the circumgalactic medium (CGM) of the LAEs. This signal extends to a low SB region connecting galaxies, revealing diffuse gas in the filamentary structure where LAEs are embedded. Only very deep data allow for the detection of such diffuse components beyond the patches of gas surrounding galaxies.
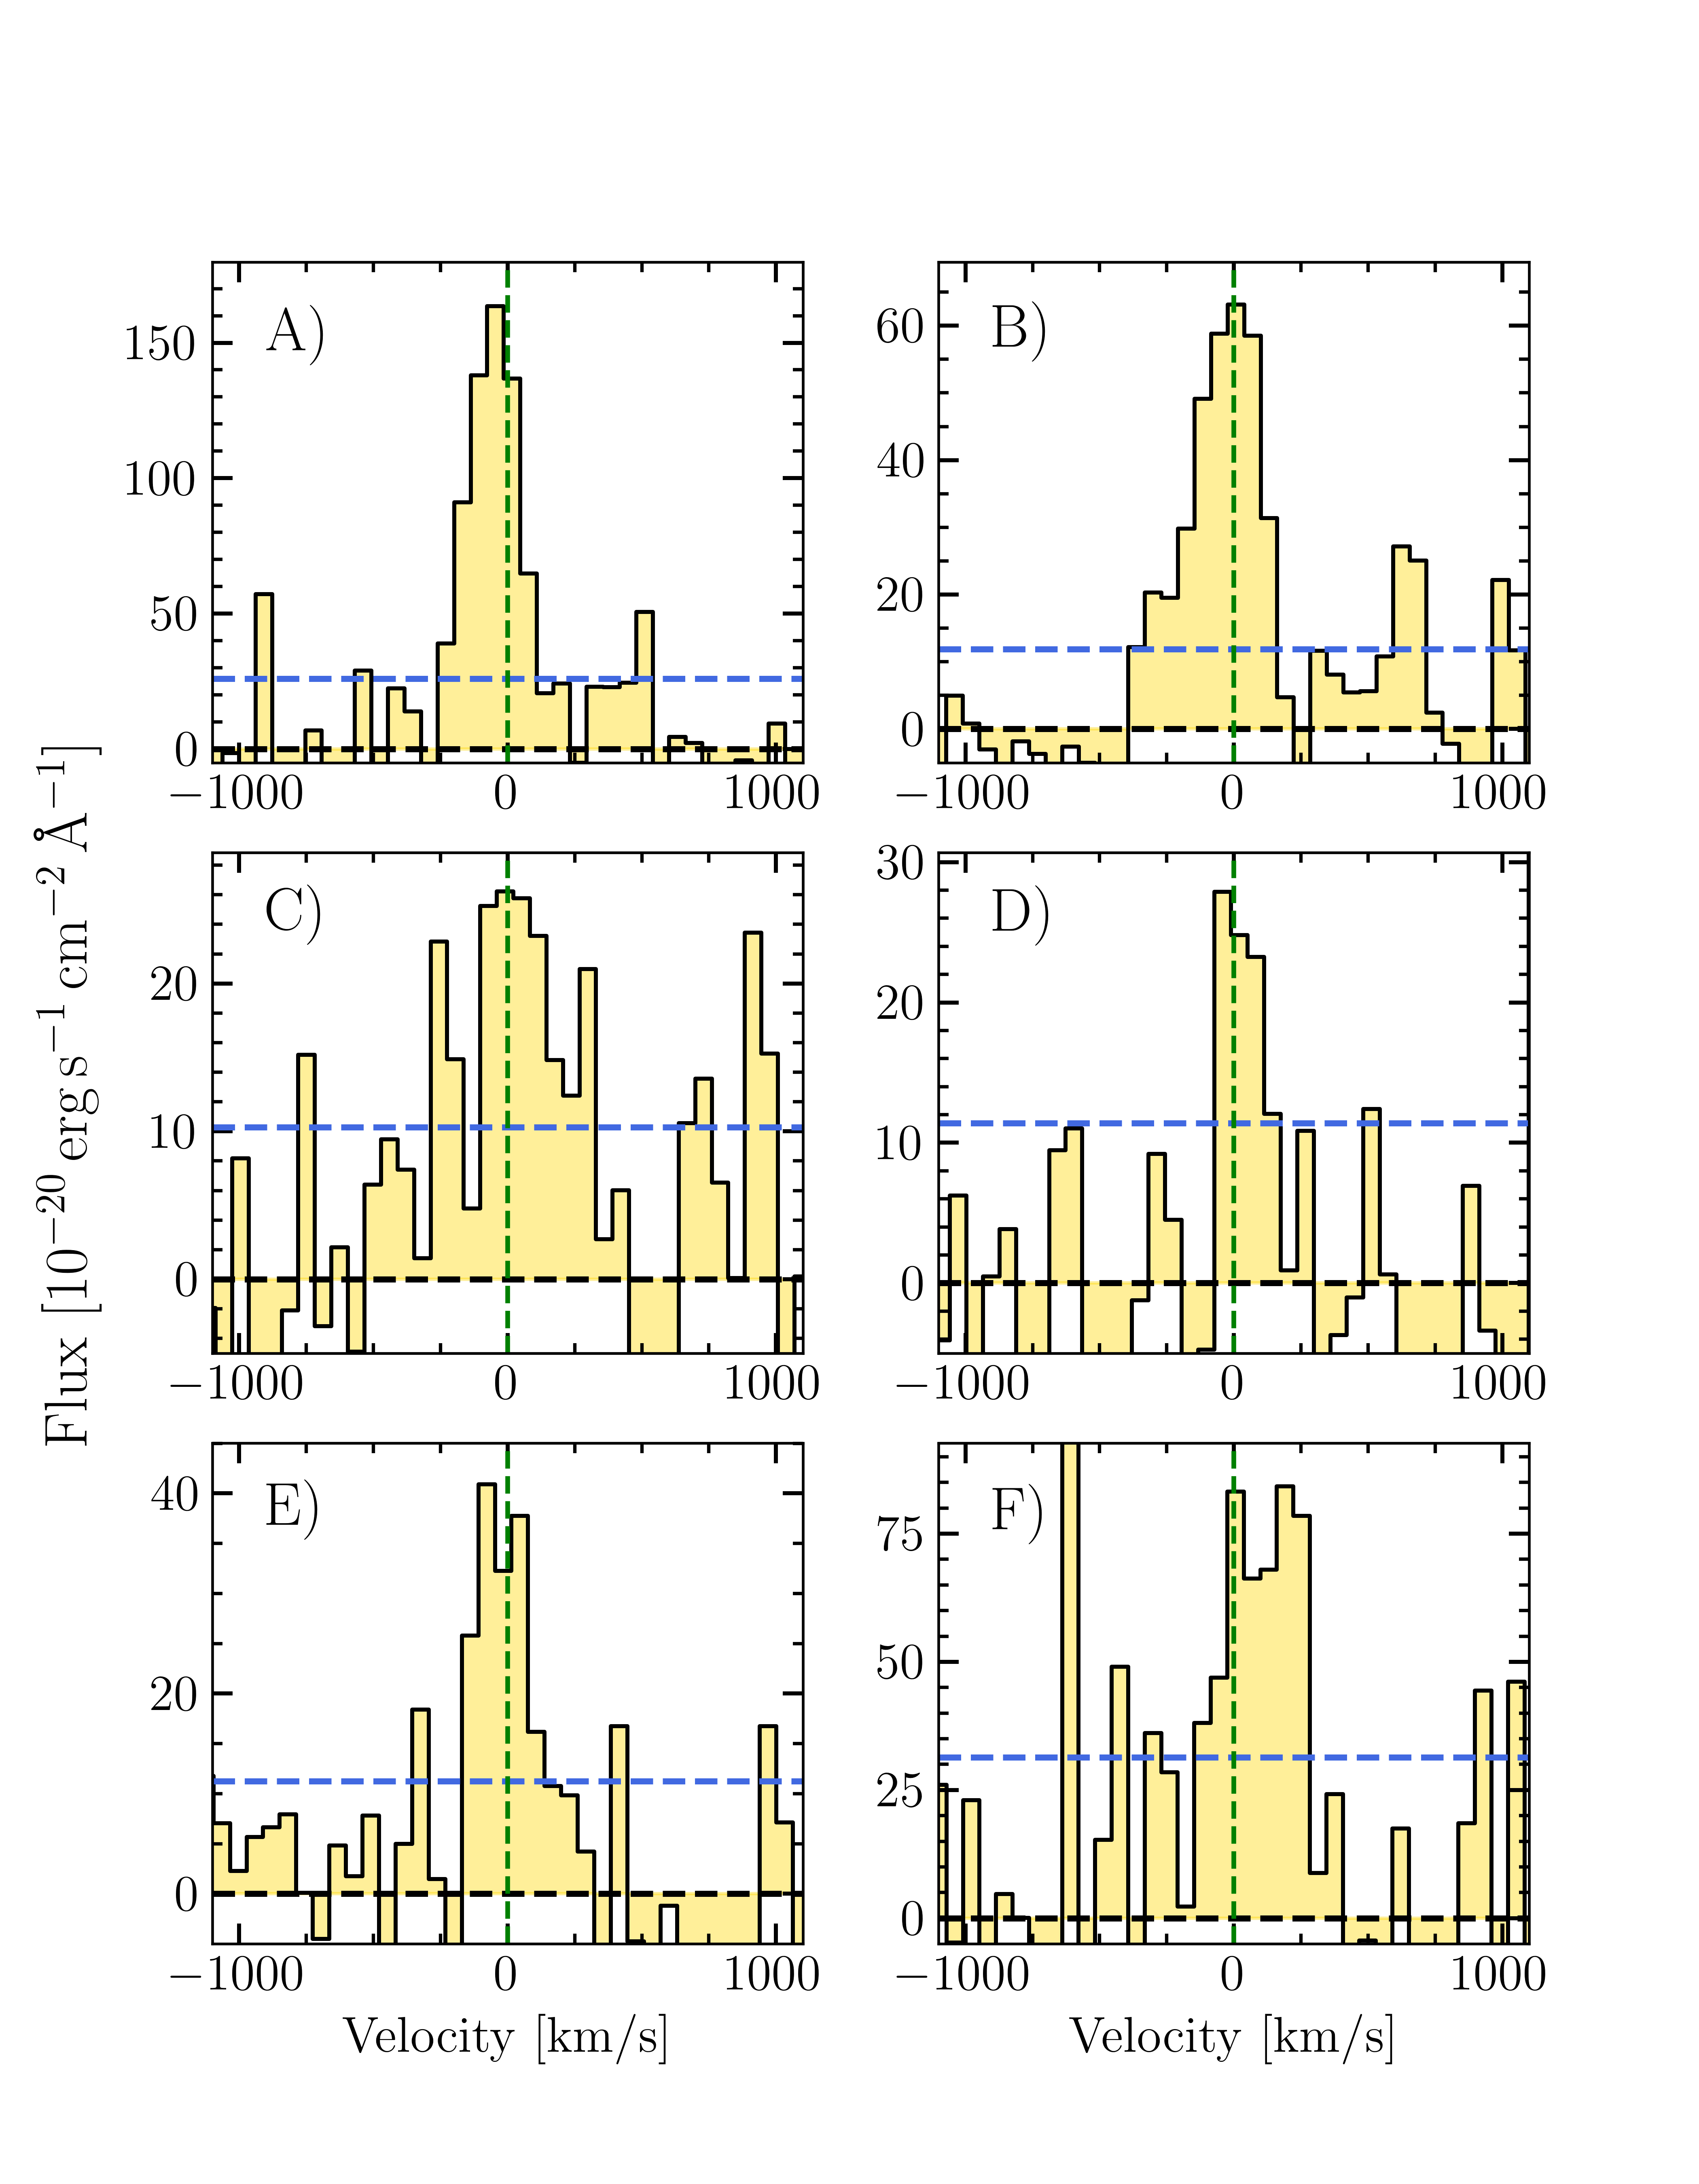
To further confirm the real astrophysical nature of the detected signal, we extracted six spectra from regions surrounding the LAEs and their CGM, focusing in particular on the low SB regions. Ly emission is also detected spectrally, ruling out the possibility that the extracted signal is an artifact of noise (Fig. 1, right).
4 Properties of a cosmic filament
The newly discovered MUDF filament is characterized by a main coherent structure that extends for kpc in the SE-NW direction ( Mpc comoving), with a thickness of kpc as visible on the map above erg s-1 cm-2 arcsec-2. Two secondary patches lie NW and W of the main structure. Overall, the ultra-deep MUDF observations image a portion of the cosmic web extending for at least Mpc ( Mpc comoving), making this one of the largest stretches of cosmic web imaged to date. A bright patch of gas in the SE direction, at the edge of the field of view, points to a much more extended LSS that crosses the MUDF region. A range of SB is visible across the filament. The bright regions above erg s-1 cm-2 arcsec-2 can be identified as the halo gas within kpc of LAEs (see below), as also demonstrated by the analysis of the radial profiles of LAEs with luminosities (typical for our LAEs, Wisotzki et al., 2018; Guo et al., 2024).
At lower SB, reaching erg s-1 cm-2 arcsec-2, data reveal a more diffuse component that we associate with the IGM, with an average SB of erg s-1 cm-2 arcsec-2. Despite the very different environment of the filament reported by Tornotti et al. (2024) across two quasar hosts at , their average SB level is erg s-1 cm-2 arcsec-2, remarkably similar to the filament presented here. Considering the redshift-dependence of the SB dimming (a factor higher at ), we conclude that this high-redshift filament is at least of comparable, if not higher, intrinsic brightness. Although interpreting the detailed origin of the emission mechanism is a difficult task and is the subject of extensive discussion in the literature (Elias et al., 2020; Byrohl & Nelson, 2023; Tsai et al., 2024), the differential analysis of the two filaments provides new insight into the nature of the emission. First, we observe that the presence of two bright quasars does not appear to drastically affect the emergent SB, which is different from what is postulated in the optically thick regions (Gould & Weinberg, 1996) inside the CGM. However, galaxies in the overdensity can still collectively contribute to the photon budget (Umehata et al., 2019). Moreover, a higher emissivity towards a higher redshift seems generally predicted in models due to the higher typical gas densities (Tsai et al., 2024) and the quadratic dependence on density of two fundamental emission mechanisms (collisions and recombinations). Locally, high gas densities can also be encountered in galaxy overdensities due to galaxy interactions. An extensive discussion, supported by modeling, of what powers this and other filaments is deferred to future publications. New observational constraints on the various emission mechanisms can be derived as more and more filaments are detected (Bacon et al., 2021; Tornotti et al., 2024; Banerjee et al., 2024).
Considering the galaxy population found at the same redshift, we observe that the near-totality of LAEs is embedded within the central filament. The lack of continuum detection down to mag in the F140W image and to mJy beam-1 in the 1.2 mm map leads us to conclude that this filament hosts a population of low-mass, moderately star-forming, and dust-poor galaxies ( M⊙, M⊙ yr-1). The Ly emission lines for these galaxies are shown in Fig. 2. Inspection of individual spectra rules out the presence of bright C IV ( Å) and He II lines ( Å), which, given their high ionization potential, are typically excited by AGNs.
Moreover, stacking all the spectra (Fig. 3) results in a deep upper limit (with flux erg s-1 cm-2 for C IV and erg s-1 cm-2 for He II lines in a km s-1 window). These upper limits translate in C IV/Ly of and He II/Ly of . Typical AGN spectra (Hainline et al., 2011) at are characterized by ratios of for C IV/Ly and for He II/Ly (depending on the equivalent width of Ly), higher than our limits. The nondetection of ALMA and X-ray sources (Lusso et al., 2023) further rules out the presence of heavily-obscured accreting black holes. We cannot exclude the presence of low-luminosity AGNs, which are likely to be present in this overdense region. Current deep and multiwavelength observations in the MUDF are, nevertheless, suggesting that the ionizing flux is not dominated by an abundant population of particularly bright and active black holes, as also seen in the filament reported at by Banerjee et al. (2024).
Among the LAEs in this group, seven sources (L2 and L5-10; percent of the total) exhibit a double peak profile according to visual classification. This fraction is consistent with the incidence of multipeaked Ly lines at similar redshifts and luminosities (Kulas et al., 2012; Vitte et al., 2024). Notably, all the double-peaked profiles but two (L5, L10) show a marked blue peak compared to the red peak, a distinctive feature attributed to infalling gas onto these galaxies (Dijkstra et al., 2006; Verhamme et al., 2006). Typically, the fraction of galaxies in which the blue peak dominates over the red peak is below percent in comparable datasets (Kulas et al., 2012; Vitte et al., 2024). With an incidence of 5/7 of high-confidence brighter blue peaks, we conclude that galaxies embedded in this filament may be experiencing favorable conditions for gas accretion. We also explore the kinematics of the gas in the filament more closely. Despite the depth of the data, a pixel-by-pixel analysis is prohibitive because of the faint SB. We, therefore, proceed by examining the shifts in the velocity centroid of the Ly line in the regions highlighted in Fig. 1. No clear velocity gradient appears beyond the tolerance imposed by using a resonant line, km s-1. Futhermore, no noticeable velocity gradient emerges when considering the LAE redshifts. Thus, the filament appears to have a relatively uniform kinematic structure, as also seen in Tornotti et al. (2024). We speculate that this commonality might be related to a preference in detecting emssion from face-on filaments for which we cannot robustly measure kinematics.
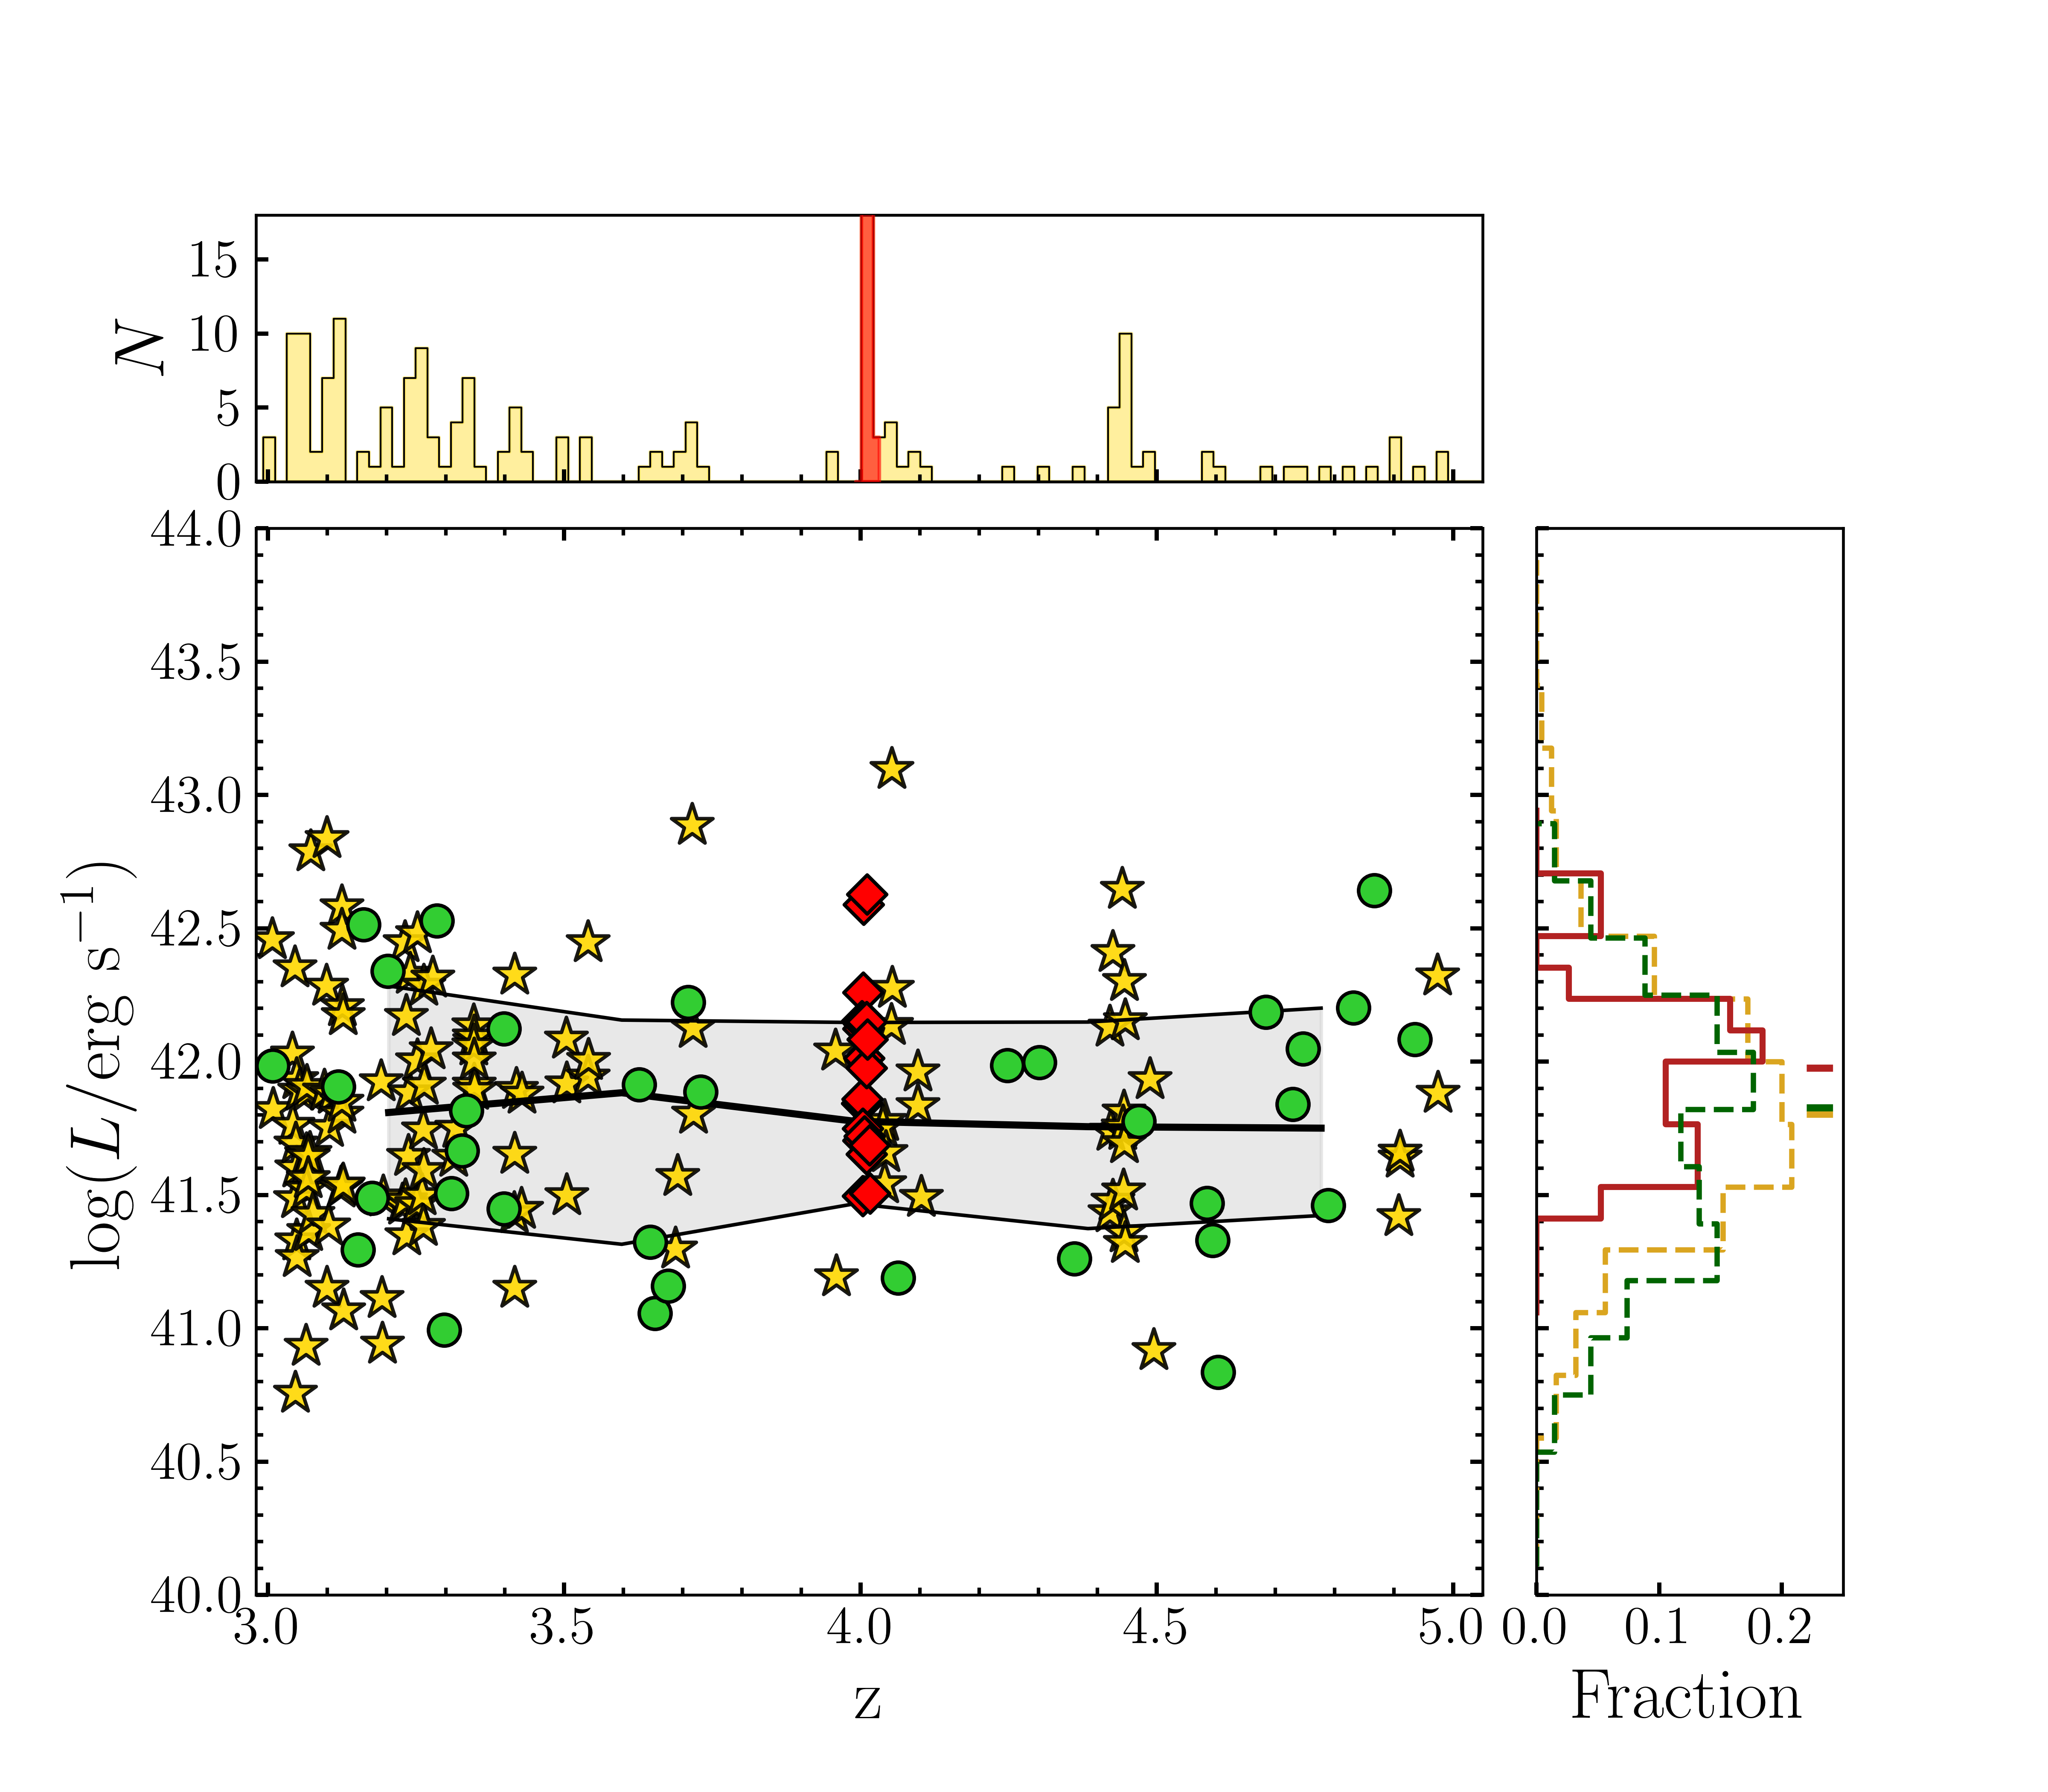
The fact that a significant fraction of galaxies embedded in a gas-rich filament also display spectral signatures of infalling gas opens the question of whether they are experiencing more active star formation. We investigate this in Fig. 4, where we show the Ly luminosity of the members of this structure with the LAE population detected in the MUDF between . Across this redshift, the intrinsic properties of LAEs are weakly evolving, and cosmic time dependence is negligible in this comparison. The 19 LAEs at are generally distributed as the control sample of 159 galaxies (defined as the LAEs not belonging to this group), with a dex offset at higher Ly luminosity distribution (the median Ly in this sample is ). To investigate the significance of this difference, we randomly draw from the control sample sub-samples of 19 galaxies, and we obtain a median value of . Thus, a marginal Ly offset is present at significance. Splitting the control sample in group LAEs, which could trace a similar environment to the filament, and more isolated systems yields comparable results (yellow and green histograms in Fig. 4). This analysis hints at a significant star formation activity within the filament, as expected for regions of enhanced gas accretion (Davé et al., 2012; Lilly et al., 2013). However, additional information (e.g., on the stellar mass or UV-based star formation rates) is required to investigate this trend more robustly.
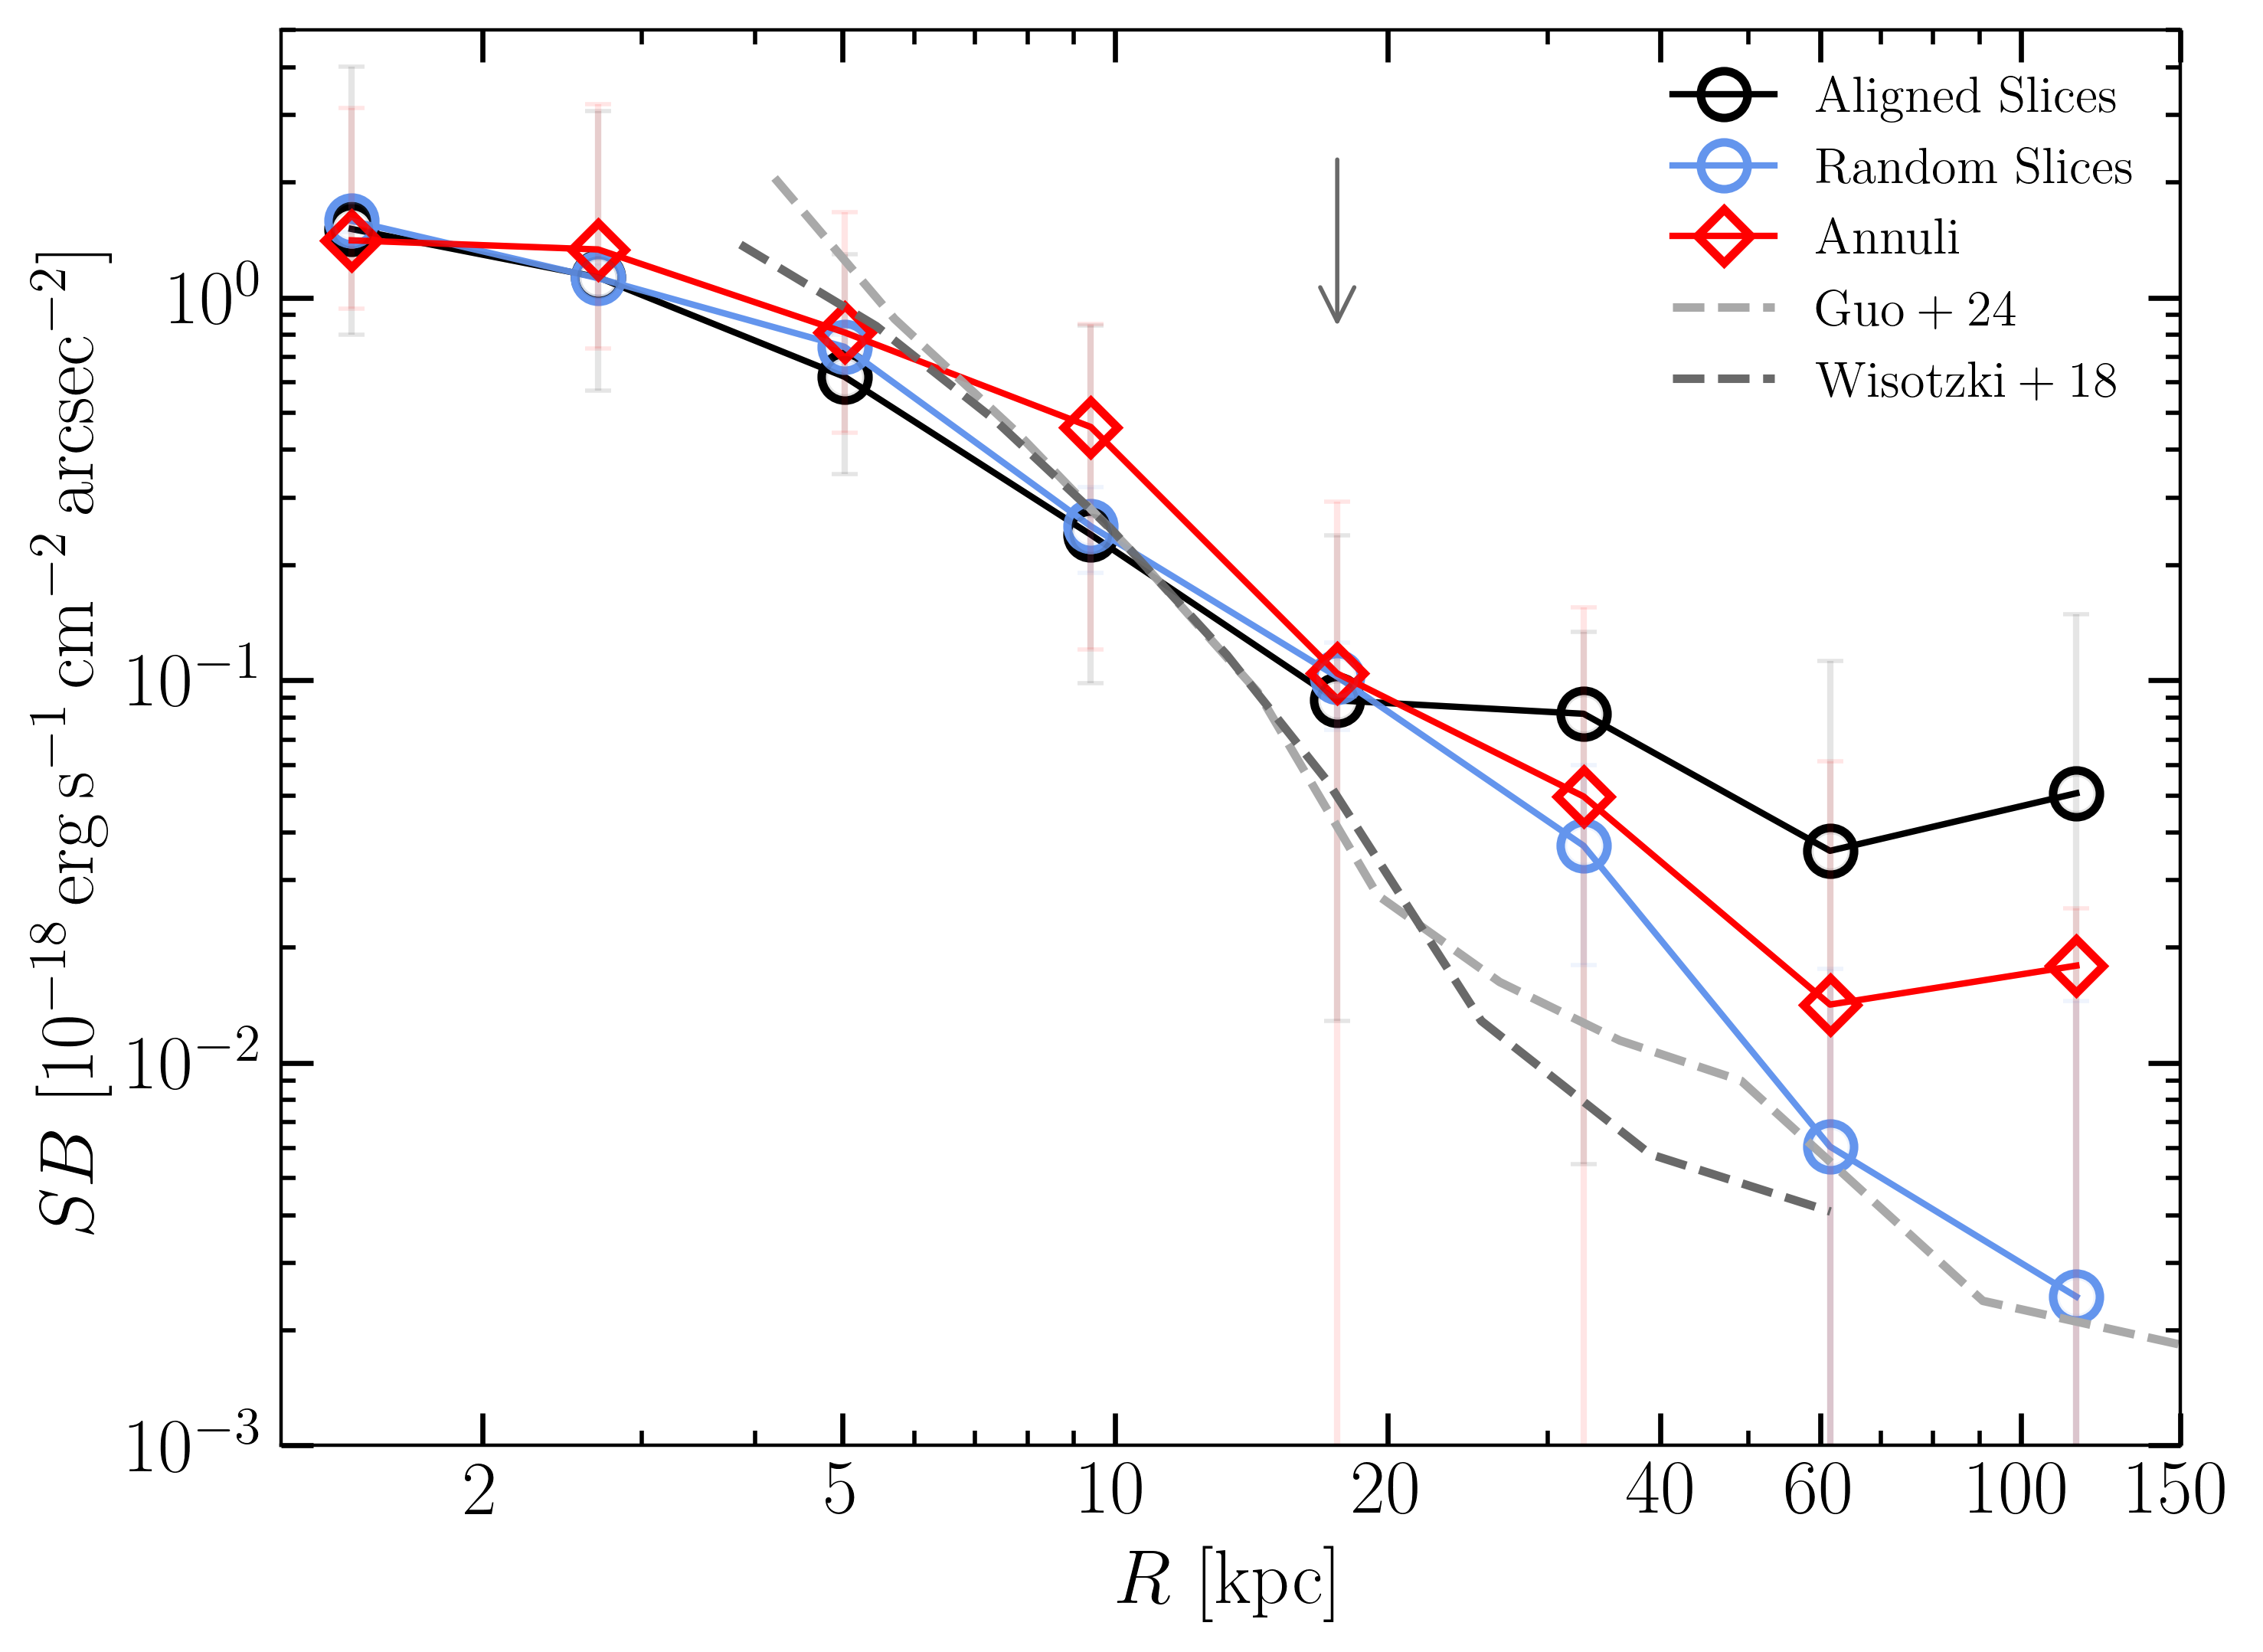
The detection of a considerable sample of LAEs within Ly emitting gas provides a helpful laboratory to study how the CGM of galaxies connects to the IGM. To include all the flux, we construct pseudo narrow-band images of 30 Åbandwidth for each LAE, centering on the peak wavelength of the Ly line. We extract SB profiles at the top of each LAE along a slit in the direction that aligns with the detected filament. The slit width varies in the interval kpc moving outward, while the box length used to sample the profile along the slit is logarithmically spaced. This choice of varying width mimics the adaptive nature of the annuli, which sample the inner regions at higher resolution. The result is shown in Fig. 5. We observe a steepening of the mean profile between kpc, followed by a plateau of almost constant SB at erg s-1 cm-2 arcsec-2 at kpc. The inflection point at around kpc is a signpost of the transition between the CGM and the IGM, as seen also in the filament by Tornotti et al. (2024), who reported evidence of a break in the SB profile around the virial radius of halos embedded inside the cosmic web. This size is, in fact, comparable with the virial radius of halos at , which is kpc ( kpc for masses of ; Herrero Alonso et al. 2023; Guo et al. 2024).
We can also use the direct detection of this filament to compare with the results of stacking experiments conducted on large LAE samples (Leclercq et al., 2017; Wisotzki et al., 2018; Lujan Niemeyer et al., 2022; Guo et al., 2024). In these stacks, a halo profile is identified up to kpc, at which point a flattening to large distances (kpc) is observed. This change in slope can be statistically attributed to the transition between the CGM and the IGM. However, in stacks, this interpretation is complicated by geometric dilution, i.e., the stacking of signals aligned along filaments or across empty regions, further complicated by the range of LAE virial radii. Moreover, models that capture the effect of (unresolved) nearby halos (Byrohl & Nelson, 2023; Bacon et al., 2021) seem to reproduce the SB plateau well with a two-halo term. We directly test the first scenario by stacking SB profiles of LAEs extracted from our map at random orientations, both in slits (blue line in Fig. 5) and in annuli (red line) to mimic the unknown geometry of the undetected filaments. To increase the significance of the measurement in the case of random slits, we combine the sample of 19 LAEs 500 times, each time selecting a random orientation.
A comparison of these different profiles (Fig. 5) reveals, in the inner region, a substantial agreement between the aligned and random slits. This is explained by the fact that the regions at kpc are filled by isotropic emission. At larger radii, the SB profile obtained with random slits steeply declines, as the apertures often select regions devoid of emission. More interesting is the case of the annuli, where a plateau ascribed to the filament emission is still visible, although with a lower average SB because of the geometric signal dilution. This exercise highlights that stacking analysis of large samples can reveal an emission signal from the cosmic web. However, the recovered value of SB does not necessarily reflect the mean SB of the filaments because of the presence of an unknown fraction of empty regions. Examples of stacked profiles in large samples at from the literature are also reported in Fig. 5 (dashed lines). Compared with our mean profile in annuli, we observe substantial agreement in the inner regions. However, the literature profiles decrease much below our result for kpc, and a flattening is observed only at kpc. A possible interpretation of this difference is that the filament we are detecting is generally brighter than the average population, a reasonable conclusion for the first detections of any class of objects that are often the tip of the iceberg. In more typical cases, the outer CGM (between kpc) can still outshine the filament emission that is revealed only at greater distances.
5 Summary and conclusions
Using ultra-deep MUSE observations within the MUDF, we report the discovery of a Mpc (comoving) portion of a cosmic-web filament detected in Ly emission within a overdensity of 19 LAEs. We jointly analyze the emission properties of the diffuse gas in the filament and of the embedded LAEs, and we report the following findings.
-
–
The diffuse emission outside of the CGM of individual galaxies reaches SB levels of erg s-1 cm-2 arcsec-2 and outlines an LSS that extends for Mpc (proper), with thickness of kpc.
-
–
Despite the substantially different galaxy environment, the basic emission properties of the filament resemble the one detected across the two luminous MUDF quasars at . The lack of evident AGNs in this overdensity suggests that the underlying gas density, rather than the radiation field, regulates the emission properties on IGM scales, but galaxies in the overdensity can still contribute collectively to a significant photon budget. Interactions among galaxies may also contribute to higher local densities.
-
–
Most (5/7) of the double-peaked Ly profiles of the embedded LAEs display a dominant blue peak, a signature that can be explained by an increased incidence of gas accretion. LAEs in this filament also show a excess of Ly emission compared to control samples, hinting at higher star-formation activity.
-
–
By stacking the LAE SB profile in slits aligned with the filament, we identify the transition between the CGM and IGM at a radius of kpc, which is comparable to the virial radius expected for LAE hosts. Moreover, we show that the flattening at large radii in stacked profiles from literature samples can be interpreted as emission arising from filaments fainter than the one we detect, albeit modulated by the filling factor of the emitting regions.
Current detections with surface brightness approaching erg s-1 cm-2 arcsec-2, including our new example, arise from searches conducted around galaxy groups (Umehata et al., 2019; Bacon et al., 2021; Tornotti et al., 2024; Banerjee et al., 2024). A link between galaxy overdensities and cosmic-web emission is thus emerging. The range of environments and the richness of the groups probed vary substantially, from rare protoclusters like SSA22 to more common LAE groups. We conclude that filaments emitting at erg s-1 cm-2 arcsec-2 could be somewhat ordinary. Medium-depth programs sensitive to extended emission with erg s-1 cm-2 arcsec-2 have the potential of yielding the first significant samples of cosmic web images.
An open question that emerges is what sets the observed surface brightness level across various environments. Our study shows a possible way forward: the comparative analysis of Ly imaging in filaments within various environments jointly with the properties of embedded galaxies. As larger samples of directly-imaged filaments become available, the homogeneous study of the diffuse emitting gas and the cospatial galaxy population will finally constrain the frequency and physical properties of the cosmic web with solid empirical evidence. A new era of detailed studies of cosmic filaments in emission has finally opened.
References
- Alam et al. (2017) Alam, S., Ata, M., Bailey, S., et al. 2017, MNRAS, 470, 2617, doi: 10.1093/mnras/stx721
- Arrigoni Battaia et al. (2019) Arrigoni Battaia, F., Hennawi, J. F., Prochaska, J. X., et al. 2019, MNRAS, 482, 3162, doi: 10.1093/mnras/sty2827
- Arrigoni Battaia et al. (2018) Arrigoni Battaia, F., Prochaska, J. X., Hennawi, J. F., et al. 2018, MNRAS, 473, 3907, doi: 10.1093/mnras/stx2465
- Astropy Collaboration et al. (2013) Astropy Collaboration, Robitaille, T. P., Tollerud, E. J., et al. 2013, A&A, 558, A33, doi: 10.1051/0004-6361/201322068
- Astropy Collaboration et al. (2018) Astropy Collaboration, Price-Whelan, A. M., Sipőcz, B. M., et al. 2018, AJ, 156, 123, doi: 10.3847/1538-3881/aabc4f
- Astropy Collaboration et al. (2022) Astropy Collaboration, Price-Whelan, A. M., Lim, P. L., et al. 2022, ApJ, 935, 167, doi: 10.3847/1538-4357/ac7c74
- Bacon et al. (2021) Bacon, R., Mary, D., Garel, T., et al. 2021, A&A, 647, A107, doi: 10.1051/0004-6361/202039887
- Banerjee et al. (2024) Banerjee, E., Muzahid, S., Schaye, J., Cantalupo, S., & Johnson, S. D. 2024, MUSEQuBES: Unveiling Cosmic Web Filaments at $z\approx3.6$ through Dual Absorption and Emission Line Analysis, arXiv, doi: 10.48550/arXiv.2412.04546
- Bolton et al. (2017) Bolton, J. S., Puchwein, E., Sijacki, D., et al. 2017, MNRAS, 464, 897, doi: 10.1093/mnras/stw2397
- Bond et al. (1996) Bond, J. R., Kofman, L., & Pogosyan, D. 1996, Nature, 380, 603, doi: 10.1038/380603a0
- Borisova et al. (2016) Borisova, E., Cantalupo, S., Lilly, S. J., et al. 2016, ApJ, 831, 39, doi: 10.3847/0004-637X/831/1/39
- Byrohl & Nelson (2023) Byrohl, C., & Nelson, D. 2023, Monthly Notices of the Royal Astronomical Society, 523, 5248, doi: 10.1093/mnras/stad1779
- Davis et al. (1982) Davis, M., Huchra, J., Latham, D. W., & Tonry, J. 1982, ApJ, 253, 423, doi: 10.1086/159646
- Davé et al. (2012) Davé, R., Finlator, K., & Oppenheimer, B. D. 2012, Monthly Notices of the Royal Astronomical Society, 421, 98, doi: 10.1111/j.1365-2966.2011.20148.x
- Dijkstra et al. (2006) Dijkstra, M., Haiman, Z., & Spaans, M. 2006, The Astrophysical Journal, 649, 14, doi: 10.1086/506243
- Elias et al. (2020) Elias, L. M., Genel, S., Sternberg, A., et al. 2020, Monthly Notices of the Royal Astronomical Society, 494, 5439, doi: 10.1093/mnras/staa1059
- Fossati et al. (2019) Fossati, M., Fumagalli, M., Lofthouse, E. K., et al. 2019, Monthly Notices of the Royal Astronomical Society, 490, 1451, doi: 10.1093/mnras/stz2693
- Fossati et al. (2021) Fossati, M., Fumagalli, M., Lofthouse, E. K., et al. 2021, MNRAS, 503, 3044, doi: 10.1093/mnras/stab660
- Galárraga-Espinosa et al. (2022) Galárraga-Espinosa, D., Langer, M., & Aghanim, N. 2022, A&A, 661, A115, doi: 10.1051/0004-6361/202141974
- Galbiati et al. (2023) Galbiati, M., Fumagalli, M., Fossati, M., et al. 2023, Monthly Notices of the Royal Astronomical Society, 524, 3474, doi: 10.1093/mnras/stad2087
- Gould & Weinberg (1996) Gould, A., & Weinberg, D. H. 1996, ApJ, 468, 462, doi: 10.1086/177707
- Guo et al. (2024) Guo, Y., Bacon, R., Wisotzki, L., et al. 2024, A&A, 688, A37, doi: 10.1051/0004-6361/202347658
- Hainline et al. (2011) Hainline, K. N., Shapley, A. E., Greene, J. E., & Steidel, C. C. 2011, The Astrophysical Journal, 733, 31, doi: 10.1088/0004-637X/733/1/31
- Harris et al. (2020) Harris, C. R., Millman, K. J., van der Walt, S. J., et al. 2020, Nature, 585, 357, doi: 10.1038/s41586-020-2649-2
- Herrero Alonso et al. (2023) Herrero Alonso, Y., Miyaji, T., Wisotzki, L., et al. 2023, A&A, 671, A5, doi: 10.1051/0004-6361/202244693
- Huchra & Geller (1982) Huchra, J. P., & Geller, M. J. 1982, ApJ, 257, 423, doi: 10.1086/160000
- Hunter (2007) Hunter, J. D. 2007, Computing in Science and Engineering, 9, 90, doi: 10.1109/MCSE.2007.55
- Klypin & Shandarin (1983) Klypin, A. A., & Shandarin, S. F. 1983, MNRAS, 204, 891, doi: 10.1093/mnras/204.3.891
- Kulas et al. (2012) Kulas, K. R., Shapley, A. E., Kollmeier, J. A., et al. 2012, ApJ, 745, 33, doi: 10.1088/0004-637X/745/1/33
- Leclercq et al. (2017) Leclercq, F., Bacon, R., Wisotzki, L., et al. 2017, Astronomy & Astrophysics, 608, A8, doi: 10.1051/0004-6361/201731480
- Lilly et al. (2013) Lilly, S. J., Carollo, C. M., Pipino, A., Renzini, A., & Peng, Y. 2013, The Astrophysical Journal, 772, 119, doi: 10.1088/0004-637X/772/2/119
- Lujan Niemeyer et al. (2022) Lujan Niemeyer, M., Komatsu, E., Byrohl, C., et al. 2022, ApJ, 929, 90, doi: 10.3847/1538-4357/ac5cb8
- Lusso et al. (2019) Lusso, E., Fumagalli, M., Fossati, M., et al. 2019, MNRAS, 485, L62, doi: 10.1093/mnrasl/slz032
- Lusso et al. (2023) Lusso, E., Nardini, E., Fumagalli, M., et al. 2023, MNRAS, 525, 4388, doi: 10.1093/mnras/stad2564
- Martin et al. (2019) Martin, D. C., O’Sullivan, D., Matuszewski, M., et al. 2019, Nature Astronomy, 3, 822, doi: 10.1038/s41550-019-0791-2
- Pensabene et al. (2024) Pensabene, A., Galbiati, M., Fumagalli, M., et al. 2024, arXiv e-prints, arXiv:2410.06249, doi: 10.48550/arXiv.2410.06249
- Rauch (1998) Rauch, M. 1998, ARA&A, 36, 267, doi: 10.1146/annurev.astro.36.1.267
- Revalski et al. (2023) Revalski, M., Rafelski, M., Fumagalli, M., et al. 2023, ApJS, 265, 40, doi: 10.3847/1538-4365/acb8ae
- Revalski et al. (2024) Revalski, M., Rafelski, M., Henry, A., et al. 2024, ApJ, 966, 228, doi: 10.3847/1538-4357/ad382c
- Rosenfeld & Pfaltz (1968) Rosenfeld, A., & Pfaltz, J. L. 1968, Pattern Recognition, 1, 33, doi: 10.1016/0031-3203(68)90013-7
- Springel et al. (2005) Springel, V., White, S. D. M., Jenkins, A., et al. 2005, Nature, 435, 629, doi: 10.1038/nature03597
- Tempel et al. (2014) Tempel, E., Stoica, R. S., Martínez, V. J., et al. 2014, MNRAS, 438, 3465, doi: 10.1093/mnras/stt2454
- Theuns et al. (1998) Theuns, T., Leonard, A., Efstathiou, G., Pearce, F. R., & Thomas, P. A. 1998, MNRAS, 301, 478, doi: 10.1046/j.1365-8711.1998.02040.x
- Tornotti et al. (2024) Tornotti, D., Fumagalli, M., Fossati, M., et al. 2024, arXiv e-prints, arXiv:2406.17035, doi: 10.48550/arXiv.2406.17035
- Tsai et al. (2024) Tsai, S.-H., Chen, K.-J., Smith, A., & Chiang, Y.-K. 2024, Diffuse Ly$\alpha$ Emission, arXiv. http://arxiv.org/abs/2410.00450
- Umehata et al. (2019) Umehata, H., Fumagalli, M., Smail, I., et al. 2019, Science, 366, 97, doi: 10.1126/science.aaw5949
- Verhamme et al. (2006) Verhamme, A., Schaerer, D., & Maselli, A. 2006, Astronomy & Astrophysics, 460, 397, doi: 10.1051/0004-6361:20065554
- Virtanen et al. (2020) Virtanen, P., Gommers, R., Oliphant, T. E., et al. 2020, Nature Methods, 17, 261, doi: 10.1038/s41592-019-0686-2
- Vitte et al. (2024) Vitte, E., Verhamme, A., Hibon, P., et al. 2024, arXiv e-prints, arXiv:2411.14327, doi: 10.48550/arXiv.2411.14327
- Wisotzki et al. (2018) Wisotzki, L., Bacon, R., Brinchmann, J., et al. 2018, Nature, 562, 229, doi: 10.1038/s41586-018-0564-6
- Wu et al. (2005) Wu, K., Otoo, E., & Suzuki, K. 2005, Tech. Rep. LBNL-59102, Lawrence Berkeley National Laboratory. https://www.osti.gov/biblio/929013