Conditions for Super-Eddington Accretion onto the First Black Holes
Abstract
Observations of supermassive black holes at high redshift challenge our understanding of the evolution of the first generation of black holes (BHs) in proto-galactic environments. One possibility is that they grow much more rapidly than current estimates of feedback and accretion efficiency permit. Following our previous analysis of super-Eddington accretion onto stellar-mass black holes in mini-haloes under no-feedback conditions, we now investigate whether this can be sustained when thermal feedback is included. We use four sets of cosmological simulations at sub-pc resolution with initial black hole masses varying from , exploring a range of feedback efficiencies. We also vary the feedback injection radius to probe the threshold of numerical overcooling. We find that super-Eddington growth sustained on the order of is possible with very weak thermal feedback efficiency in all environments and moderate efficiency for the BH. Trans-Eddington growth is possible for a BH at moderate feedback efficiencies. We discuss the effectiveness of thermal feedback in heating the gas, suppressing accretion, and driving outflows at these parameter configurations. Our results suggest that super-Eddington growth may be possible in the presence of thermal feedback for black holes formed from the first stars.
keywords:
accretion, accretion discs – black hole physics – hydrodynamics – methods: numerical – software: simulations – early Universe – stars: black holes1 Introduction
There are many unknowns concerning the first generation of black holes: their initial mass distribution, how they influence host haloes and galaxies, their growth pathways, and their feedback mechanisms. Black holes observed in young galaxies by JWST are far more massive and abundant than theoretical models predicted (Madau & Rees, 2001; Reed et al., 2019; Yang et al., 2020; Wang et al., 2021; Harikane et al., 2023; Maiolino et al., 2023b; Greene et al., 2024), indicating three possible scenarios: earlier formation, larger initial seed masses, or extended periods of super-Eddington accretion. A combination of these factors is likely needed to account for all the observed data.
Population III (Pop III) stars are thought to have formed between and after the Big Bang at the beginning of the Epoch of Reionisation. Star formation before this time is unlikely because metal-free gas requires longer cooling times than metal-enriched gas, and the high densities required for star formation in mini-haloes are orders of magnitude higher than the average density of the Universe. While a top-heavy initial mass function is expected due to the longer cooling times (Hirano et al., 2014), consistent near-Eddington growth is required for black hole remnants of Pop III stars to reach by . Assuming that accretion is Eddington-limited, such a high duty cycle is unrealistic, given the suppressing effects of feedback from the accretion disc itself and ionising radiation from supernovae (Trebitsch et al., 2019).
Alternative formation channels that give rise to larger seeds have been proposed, including direct-collapse black holes from supermassive stars (SMS) (Johnson et al., 2010; Agarwal et al., 2016; Regan & Downes, 2018; Latif et al., 2022), stellar cluster mergers (Yajima & Khochfar, 2016; Boekholt et al., 2018; Reinoso et al., 2023), and primordial black holes (Kawasaki et al., 2012; Clesse & García-Bellido, 2015; Carr & Silk, 2018). The first two options solve the issue of small seeds, while primordial black holes could form as early as one second after the Big Bang with a initial mass (Colazo et al., 2024). However, it is uncertain if the conditions required to form some of these massive seeds are prevalent enough to produce the observed number density of early Universe galaxy candidates hosting supermassive black holes (SMBH), which may be higher than previously thought (Harikane et al., 2023; Maiolino et al., 2023a; Atek et al., 2023; Adams et al., 2022; Castellano et al., 2023; Greene et al., 2024). Direct collapse black holes are expected to form from the near-isothermal collapse of a gravitationally unstable massive gas cloud at , which results in a very high accretion rate and avoids major episodes of gas fragmentation (Inayoshi et al., 2020). Mechanisms that suppress the formation of the coolant molecule must occur to keep the cloud warm and prevent fragmentation, such as dissociation from Lyman-Werner photons (Latif & Khochfar, 2019), detachment from near-IR and optical photons (Wolcott-Green & Haiman, 2012), or collisional dissociation in shocked gas (Inayoshi & Omukai, 2012). Stellar cluster formation requires very high star formation efficiencies and central cluster densities for metal-poor clouds to undergo runaway collapse into an intermediate-mass black hole (IMBH) of (Katz et al., 2015). Less dense stellar clusters could also form IMBHs via gas dynamical friction and hyper-Eddington growth (Ryu et al., 2016), though such efficient accretion is difficult to sustain.
The Eddington rate of spherically symmetric accretion onto a black hole is defined as
| (1) |
where is the mass of the black hole, is the radiative efficiency of the accreting matter, is the mass of a proton, is the Thomson scattering cross-section, G is the gravitational constant, and c is the speed of light. This defines the maximum accretion rate a black hole can achieve before radiation pressure prevents further accretion. A radiative efficiency of is often adopted as it is consistent with the thin-disc accretion model for Schwarzschild black holes (Shakura & Sunyaev, 1973; Soltan, 1982) and has been validated on low-redshift quasars (Yu & Tremaine, 2002). However, this may not be the case for high-redshift BHs. Theoretical works have proposed that black holes can grow at super-Eddington rates due to photon trapping in dense accreting material (Begelman, 1979). When the inflow speed of gas exceeds the photon diffusion speed, radiation is trapped and advected towards the black hole, limiting the observable luminosity to the Eddington luminosity regardless of the mass inflow rate. Paczynski & Abramowicz (1982) showed that a geometrically thick disc with equatorial accretion (as opposed to spherically symmetric) can support super-Eddington accretion rates without becoming dynamically unstable; the system can exceed the Eddington luminosity. However, later analytical studies and simulations found that at high accretion rates (), radiatively inefficient accretion streams become unstable, leading to significant outflows in the polar directions and limiting the mass reaching the black hole (Quataert & Gruzinov, 2000; Blandford & Begelman, 2004; Igumenshchev et al., 2003). The photon-trapping effect has been integrated into accretion disc models and direct radiation hydrodynamics simulations, some of which include magnetic fields and general relativistic effects (GRRMHD). It has been found that radiative efficiency decreases modestly with increasing accretion, reaching at super-Eddington rates (Takahashi & Ohsuga, 2015; Ryan et al., 2017) (though higher efficiencies for similar accretion rates are still found (Fragile et al., 2018)) and that magnetic fields can both drive and hinder accretion under different conditions (Mishra et al., 2022). The GRRMHD simulations presented in Sadowski et al. (2015) found and in the case of a magnetically-arrested disc, where strong magnetic fields dominate the inflow of gas.
There have been multiple candidates for super-Eddington SMBH accretion reported in recent times (Du et al., 2018; Yue et al., 2023; Maiolino et al., 2024; Yang et al., 2024; Jin et al., 2024; Suh et al., 2024; Bhatt et al., 2024). King (2024) argues that high-redshift quasars might have much lower black hole masses than currently estimated if their luminosities are due to beamed, super-Eddington accretion. Massive seed black holes aren’t necessary if the accretion process keeps the black hole’s spin low, which reduces the radiative efficiency (King et al., 2008). Consequently, the same luminosity indicates a higher mass. This can occur if the accretion onto the black hole is chaotic, involving successive accretion events with uncorrelated angular momenta. This perspective aligns with the scale-free nature of black hole accretion processes observed in ultra-luminous X-ray sources and suggests that further observational tests are necessary to confirm these implications (King & Lasota, 2024). In a similar vein, Lupi et al. (2024a) question mass measurements of high-redshift MBHs observed by JWST, finding that uncertainties may be higher than previously thought and propose that some MBHs are smaller and accreting more efficiently than current estimates. This would relieve certain observational tensions; for instance, aligning these high-redshift observations closer to the local relation. Non-Eddington limited accretion models could also solve the intermediate-mass black hole (IMBH) gap. Piana et al. (2024) argue that black holes in the IMBH mass range () experience rapid growth due to hyper-Eddington accretion episodes, resulting in masses increasing by one to two orders of magnitude within just . This implies that IMBHs are not observed because they do not exist for long; super-Eddington growth causes them to quickly transition to SMBHs.
In our prior study, Gordon et al. (2024) (G24 henceforth), we showed that a black hole born at the centre of a dark matter mini-halo at could sustain accretion at super-Eddington rates in the absence of feedback. We now investigate the impact of varying degrees of thermal feedback on this BH in a similar set-up. The amount of energy returned by a BH to its surrounding medium in a timestep dt is given by
| (2) |
where is the accretion rate onto the BH and c is the speed of light. The radiative efficiency refers to the fraction of accreted matter that is released as radiation, and it is calculated based on the
| (3) |
For an optically thick and geometrically thin accretion disc, , hence . However, as previously mentioned, this assumption may not apply in the case of geometrically thick discs accreting at super-Eddington rates. We set , which correspond to and , respectively. The feedback efficiency parameter is the efficiency with which the radiated luminosity from the disc couples thermodynamically to the surrounding gas; we adopt values . The range of overall accretion efficiency explored is . Feedback efficiency can be reduced by numerical overcooling if the thermal energy is distributed over too much gas, causing smaller temperature increases and rapid radiative losses (Wang et al., 2018; Dalla Vecchia & Schaye, 2012). This motivates us to also vary the radius of the feedback sphere .
The paper is organised as follows. Section 2 details the set-up of our simulations. The results are presented in section 3. Section 4 contains a comprehensive discussion of the results and comparisons with other works. Section 5 highlights some caveats and limitations of our study. Finally, we summarise our conclusions in section 6.
2 The Simulations
We use the simulation code Enzo (Bryan & Enzo Collaboration, 2014; Brummel-Smith et al., 2019) to generate all data analysed in this work. Enzo is a hydrodynamical, block-structured adaptive mesh-refinement + N-body cosmological simulation code that is capable of achieving arbitrarily high spatial and temporal resolution. Our simulations are designed to follow the collapse of a metal-free gas cloud within a single cosmological halo, the same setup as in G24. We initialise the simulations with a comoving box at using the MUSIC (Hahn & Abel, 2011) initial conditions generator with the WMAP 7 best-fitting cosmological parameters, , , , , , and (Komatsu et al., 2011), the Hu & Eisenstein (1999) transfer function and second-order Lagrangian perturbation theory. We run all simulations with a root grid of dark matter particles and cells.
In order to identify a suitable halo for black hole formation, we run dark matter-only simulations to and locate a halo with total mass in two sets of initial conditions using the Rockstar halo finder (Behroozi et al., 2013). We then re-simulate from with an additional four levels of telescoping refinement around the target halo, adding baryons in the last iteration. The high-resolution region is a rectangular prism that contains all dark matter particles destined to reside within three virial radii of the target halo at . These particles are designated as ‘must-refine particles,’ ensuring adaptive mesh-refinement (AMR) is exclusively applied within this zone (Simpson et al., 2013). Prior to AMR, the high-resolution region has an effective resolution of , corresponding to a comoving spatial resolution of , a baryon mass resolution of , and a dark matter mass resolution of .
AMR occurs only in the high-resolution zoom-in region that is traced by ‘must-refine particles’. These tracer particles indicate that their host cell is destined to reside in the target halo at the end of the simulation. Cells are split by factors of two in each dimension when one of the following conditions is met:
[label=.,label-width=0.4cm](1) \taskthe dark matter mass within a grid cell is greater than four times the initial mass (i.e. when more than four dark matter particles are in the same cell). \taskthe gas mass within a grid cell is greater than four times the mean baryon mass per cell on the root grid multiplied by a factor, , where L is the refinement level. \taskthe local Jeans length is resolved by less than 32 or 64 cells.
Halo 1 forms at the higher end of the expected redshift for the onset of Pop III star formation, while Halo 2 forms at the lower end. Both are close to the minimum baryonic mass a virialised cloud must have to cool sufficiently for the formation of Pop III stars (Tegmark et al., 1997; Abel et al., 2002). This distinguishes these structures as mini-haloes as opposed to young galaxies (Greif et al., 2008). Further details on the pre-black hole accretion properties of each halo can be found in G24.
We use the Grackle non-equilibrium chemistry network (Smith et al., 2017) which follows the interactions of the nine dominant chemical species in primordial gas; , and . The radiative losses from atomic and molecular line cooling, Compton cooling and heating of free electrons by CMB photons are appropriately treated in the optically thin limit. This network includes formation from the and channels, three-body formation according to the Glover (2008) prescription, rotational transitions, chemical heating, and collision-induced emission (important in gas (Ripamonti & Abel, 2004)). The simulations presented here reach densities of in which regime the three-body formation channel has been shown to dominate the cooling (Abel et al., 2002; Turk et al., 2010); hence, its inclusion is essential to accurately capture the gas evolution on these scales.
2.1 Star/Black Hole Particle Formation
We use the Enzo module SmartStars to simulate particle formation and accretion within the high-resolution region. This module was first created by Regan & Downes (2018) to simulate the evolution of supermassive Pop III stars in atomic cooling haloes. We have adapted it for our purposes, the details of which can be found in G24. We summarise the key points here. A Pop III star particle is inserted in a grid cell where the following conditions are met:
[label=.,label-width=0.4cm](1) \taskthe proper baryon number density exceeds . \taskthe gas flow is convergent \taskthe molecular hydrogen mass fraction exceeds , where , and are the neutral molecular hydrogen, singly-ionised molecular hydrogen, and the total baryon densities, respectively. \taskthere is at least twice the mass of the particle in gas within a sphere of radius .
We implemented a formation model based on Wise et al. (2012) in which the star is initialised with its final mass as specified by the user, and stellar accretion is turned off. This approach necessitates the fourth formation criterion, which ensures the conservation of energy-momentum by instantaneously removing the star’s entire mass from the grid. The star particles in this study immediately transition to black holes of equal mass, in accordance with the zero-metallicity Heger-Woosley relation (Woosley et al., 2002).
2.2 Black Hole Accretion
We employ the Bondi-Hoyle-Lyttleton (BHL) sub-grid model:
| (4) |
where is a dimensionless factor, G is the gravitational constant and is the mass of the black hole (Hoyle & Lyttleton, 1939; Bondi, 1952). The input variables are the density of the gas , the sound speed and the velocity , where the latter is with respect to the BH velocity. They are all mass- and Gaussian-kernel-weighted. The black hole is allowed to accrete gas from within the accretion radius, defined as
| (5) |
where is the scale radius of BHL accretion
| (6) |
and is the width of the cells in the high-resolution region. Typically, does not exceed twice . There is a 75 per cent cap on the quantity of gas that can be removed from a cell at each time step. Further details can be found in G24 section 2.5.2.
2.3 Black Hole Thermal Feedback
The precise mechanism by which energy emitted from a BH is coupled to the surrounding medium is as yet unknown (Booth & Schaye, 2009). In our model, BHs inject a fixed fraction of the rest mass energy of the gas they accrete into the surrounding medium. The feedback is implemented thermally, that is: energy is deposited into the surrounding gas by increasing its internal energy. The fraction of the accreted rest mass energy that is injected is assumed to be independent of both the environment and the accretion rate. The amount of energy returned by a BH to its surrounding medium in a timestep dt is given by eq. 2. As discussed in section 1, the two efficiency factors are free parameters in our study as it is impossible to know what value they should take from first principles. In Di Matteo et al. (2005); Springel et al. (2005); Sijacki et al. (2007); Di Matteo et al. (2008) to ensure that the merging SMBHs simulated grow according to the observed relation, where is the velocity dispersion of stars in the galactic bulge. A value of is used in Booth & Schaye (2009); Oppenheimer et al. (2019), where it is noted that ‘this BH model is highly successful at reproducing the observed soft and hard X-ray luminosity functions of AGN’. In Taylor & Kobayashi (2014), is shown to reproduce the observed relation up to for a BH of seed mass of . They find that lower values make BHs more massive at a given galaxy mass. They state that with a larger (25–100) and smaller seed mass , the cosmic star formation rate history and relation are still fairly well reproduced, but the sizes of galaxies tend to be even larger than observed. In Wang et al. (2018), a summary of the feedback efficiency parameters used in large modern simulation suites - TK, Illustris, IllustrisTNG and EAGLE - is shown in Table 2. The product differs by a factor of up to 2.5 in the simulations compared. However, unlike some of the above examples, this work focuses on black holes for which no observed scaling relations have been probed. Furthermore, our simulations can resolve down to the HL radius (eq. 6) scales and amply resolve the Bondi radius (same as eq. 6 but with in the denominator instead). The other works mentioned have not done this and so do not explicitly resolve the gas dynamics and dynamical friction relevant to accretion. See the appendices of G24 for further details on the resolution of the Bondi and HL radii throughout the evolution of our no-feedback simulations.
While relation has been shown to be redshift-independent (Ferrarese et al., 2001; Wyithe & Loeb, 2003), the efficiency of radiation gas coupling depends on many factors; the black hole mass, its mode of accretion and the local gas properties. It is difficult to extrapolate the value for in the above simulations to our set-up. In less dense environments with lower accretion rates, the feedback efficiency might be lower because a smaller fraction of the accreted energy would be needed to influence the halo’s dynamics. Conversely, if the accretion rate is near the Eddington limit and the radiative efficiency is high, a higher value of might be needed to accurately model the feedback effects.
The injected energy (see eq. 2) is computed at each timestep and is deposited into a sphere with a radius that is minimally 5 times the with of the BH host cell (, which corresponds to about 524 cells. We also increase this radius to . These values were chosen such that the sphere fits within the fully resolved square feedback zone around the particle (). It was necessary to implement an energy-budgeting mechanism for the thermal feedback. The environment from which these BHs are accreting is initially much denser than the BHs that formed from a stellar collapse or in the wake of a supernova. Since the energy released is directly proportional to the accretion rate, the BH thermal feedback calculated from eq. 2 was extremely high and the Riemann solver slowed significantly as the timestep shrunk. We imposed a limit on the specific energy (erg ) of the gas per cell based on a maximum temperature :
| (7) |
where is the Boltzmann constant, is the mass of one hydrogen atom, is the adiabatic index of the gas, and is the mean molecular weight of the gas. K, for fully ionised gas and is calculated on the fly. If the specific energy in a cell exceeds , the surplus energy is stored in a variable and injected as feedback at a later timestep when the energy threshold is no longer exceeded. This energy budgeting scheme ensures that mass-energy is conserved whilst releasing the thermal feedback energy at a manageable rate for the simulation.
3 Results
3.1 Simulation Suite Overview
| Event | [] | [] | [] | [] | [] | ||||
|---|---|---|---|---|---|---|---|---|---|
| 1 | 25.95 | 627 | x2 | ||||||
| 2 | 22.48 | 2352 | x4 | ||||||
| 3 | 18.79 | 1166 | x7 | ||||||
| 4 | 19.20 | 1266 | x3 |
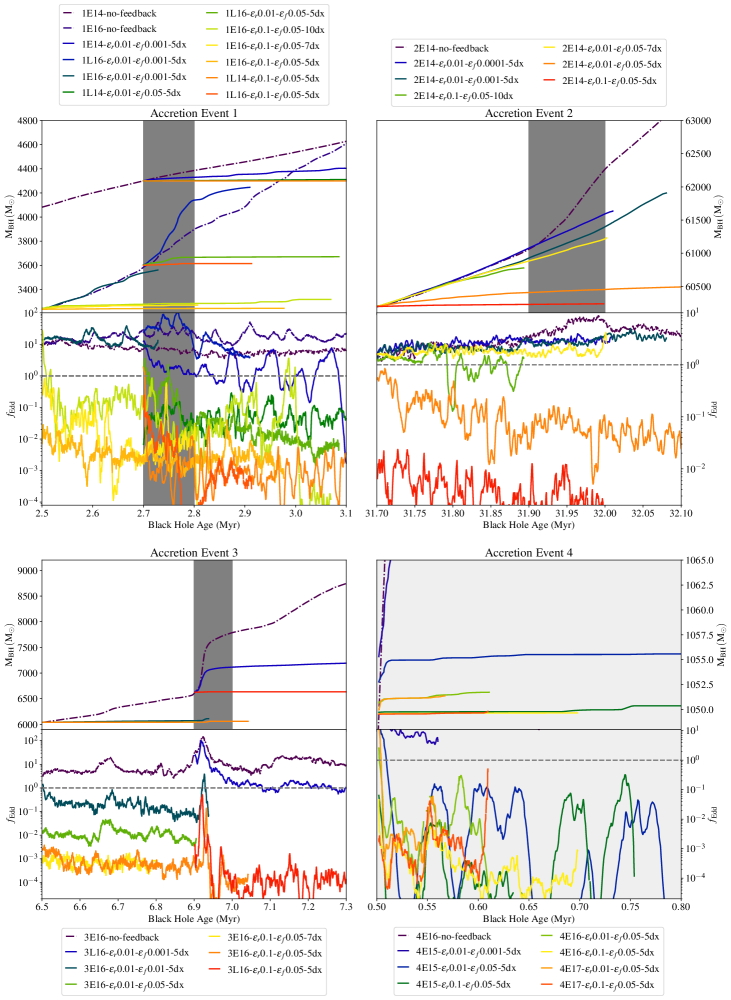
We study the impact of a range of feedback efficiencies on four distinct accretion events, defined simply as short periods () of elevated accretion (a factor of a few greater than in the before and after) identified in the simulations without feedback. The key properties of each accretion event are summarised in Table 1 while their associated simulations are detailed in Table 2. With each event, we focus on different facets of the problem. Event 1 is resimulated across two resolution levels and initiated from two different starting points (further references to an ‘early’ start refers to the first time in and a ‘late’ start refers to the second), allowing us to explore the impact of resolution and feedback duration. Event 2 has the most massive black hole at , resembling a MBH more closely than a stellar seed mass BH, and also has the largest range of feedback parameter combinations (both efficiency and injection radius). Accretion Event 3 is the most intense and distinct, averaging a rate seven times higher within than the intervals before and after the event. The magnitude of this event makes it a good candidate to test subtle differences between feedback efficiencies. Finally, Event 4 has the smallest black hole which has not yet developed a sub-pc scale disc and is resimulated over three refinement levels, enabling us to explore the impact of feedback on disc formation and its dependence on spatial resolution.
The simulations are labelled according to the following convention: [event number: 1-4][early/late start: E/L]-[radiative efficiency]-[feedback efficiency]-[number of cells in feedback injection sphere radius]dx. For example, 1E14---5dx refers to an early start Event 1 simulation at resolution level 14 with , and .
| Re-simulated from Accretion Event with BH Thermal Feedback | |||||||
| Simulation | BH Mass [] | Start [Myr] | dx [pc] | Level | Event End [Myr] | ||
| 1E16-no-feedback | None | None | 16 | ||||
| 1E16---5dx | 16 | ||||||
| 1E16---7dx | 16 | ||||||
| 1E16---10dx | 16 | ||||||
| 1E16---5dx | 16 | ||||||
| 1L16---5dx | 16 | ||||||
| 1L16---5dx | 16 | ||||||
| 1L16---5dx | 16 | ||||||
| 1L14---5dx | 14 | ||||||
| 1L14---5dx | 14 | ||||||
| 1L14---5dx | 14 | ||||||
| 2E14-no-feedback | None | None | 14 | ||||
| 2E14---5dx | 14 | ||||||
| 2E14---7dx | 14 | ||||||
| 2E14---10dx | 14 | ||||||
| 2E14---5dx | 14 | ||||||
| 2E14---10dx | 14 | ||||||
| 2E14---5dx | 14 | ||||||
| 2E14---5dx | 14 | ||||||
| 3E16-no-feedback | None | None | 16 | ||||
| 3E16---5dx | 16 | ||||||
| 3E16---7dx | 16 | ||||||
| 3E16---10dx | 16 | ||||||
| 3E16---5dx | 16 | ||||||
| 3E16---5dx | 16 | ||||||
| 3E16---5dx | 16 | ||||||
| 3L16---5dx | 16 | ||||||
| 3L16---5dx | 16 | ||||||
| 3L16---5dx | 16 | ||||||
| 4E15-no-feedback | None | None | 15 | ||||
| 4E15---5dx | 15 | ||||||
| 4E15---5dx | 15 | ||||||
| 4E15---5dx | 15 | ||||||
| 4E16-no-feedback | None | None | 16 | ||||
| 4E16---5dx | 16 | ||||||
| 4E16---5dx | 16 | ||||||
| 4E17---5dx | 16 | ||||||
| 4E17-no-feedback | None | None | 17 | ||||
| 4E17---5dx | 17 | ||||||
| 4E17---5dx | 17 | ||||||
| 4E17---5dx | 17 | ||||||
3.2 Disc Fragmentation Promotes Accretion

Disc fragmentation plays a key role in facilitating accretion onto the black hole. We analyse the fragmentation of the gas to help characterise the impact of progressively more efficient thermal feedback using a clump-finding algorithm in a manner similar to Smith et al. (2009). Clumps are defined as masses enclosed by the lowest isodensity surface around a local density maximum. The algorithm first defines density contours within a radius sphere centred on the black hole particle. Starting with a single encompassing contour, subsequent iterations refine these contours by incrementally increasing the minimum density by a factor of two, thereby segmenting the data into parent and child clumps. A clump is considered valid if it has negative total energy. That is, the gas kinetic energy, thermal energy and radiative losses are summed together over a free-fall time and subtracted from the gravitational potential energy of the gas and collisionless particle system. Furthermore, we are primarily concerned with clumps that may be accreted by the black hole. Clumps of gas with high angular momentum, such as a disc structure, are unlikely to do so. Hence, we clean the clump data to remove over-massive clumps very close to the black hole, verifying that they correspond to discs with density projections.
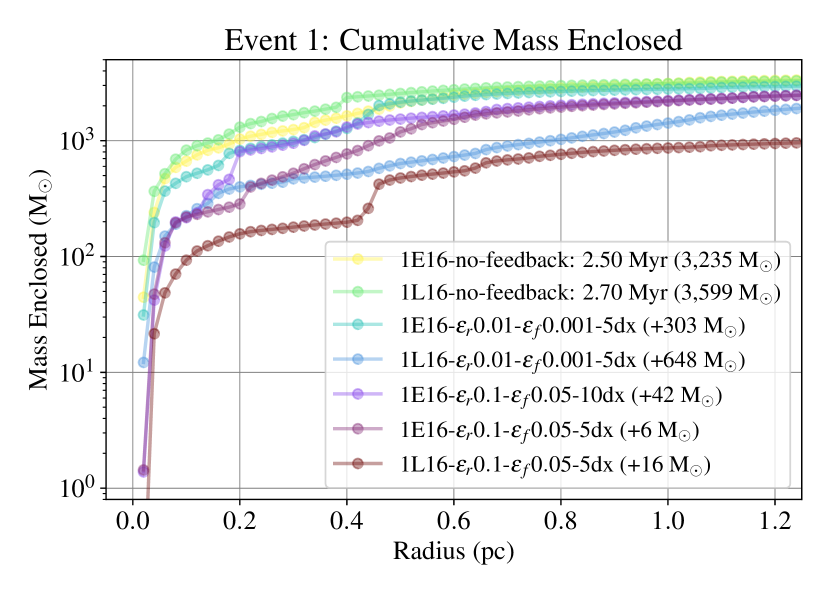
Comparing the high-resolution Event 1 simulation 1E16-no-feedback to its lower-resolution counterpart 1E14-no-feedback in Figure 1, we observe the former accreting almost eight times as much as the latter during the whole period. This discrepancy is attributable to the disc structure; while the disc in 1E14-no-feedback remains smooth, the disc in 1E16-no-feedback fragments into clumps as early as . These clumps are then incorporated into the inner disc that feeds the black hole, driving the accretion event, as seen in Figure 2. Despite 1E14-no-feedback starting with a higher black hole mass of at compared to in 1E16-no-feedback, the clumpy accretion in the latter allows it to surpass the mass of 1E14-no-feedback by . This illustrates the greater efficiency of episodic accretion in contrast to smooth accretion.
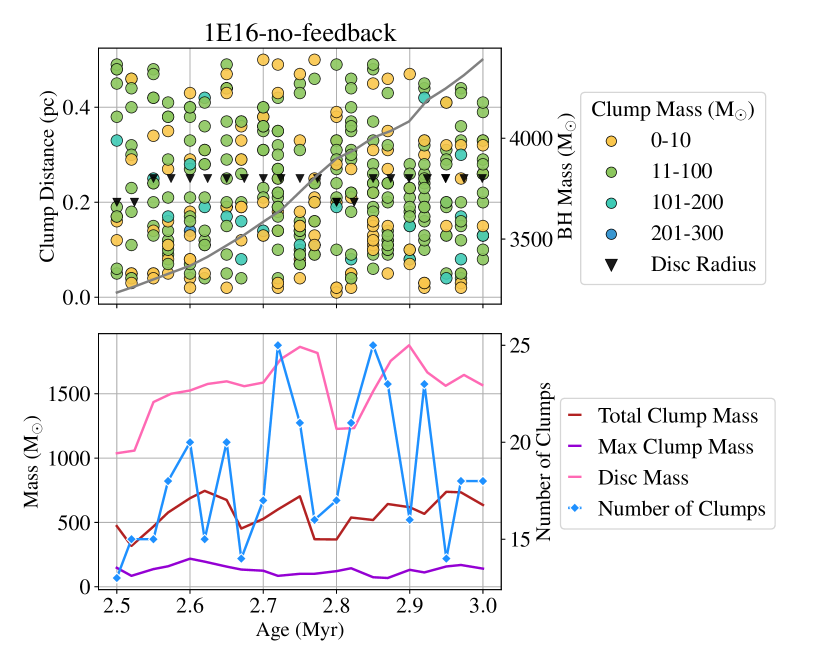
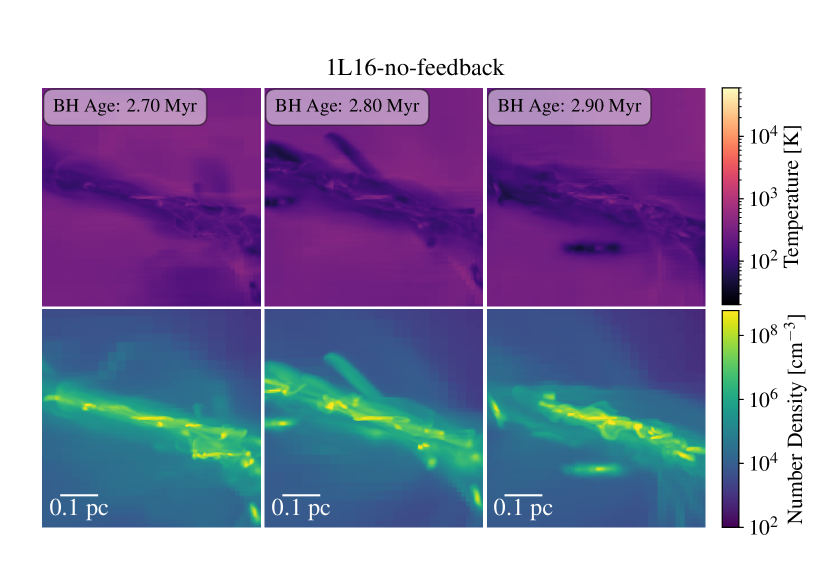
Furthermore, fragmentation helps mitigate the effects of thermal feedback. In the lower-resolution simulation 1L14---5dx, feedback suppresses accretion more effectively, with accretion immediately plummeting to trans-Eddington rates. In contrast, the higher-resolution 1L16---5dx allows super-Eddington accretion to persist. This trend holds for higher efficiency accretion also; 1L14---5dx falls rapidly to , whereas 1L16---5dx declines more gradually. The difference in sensitivity to feedback between resolutions is due to two factors. The physically larger feedback injection radius in lower-resolution simulations () diffuses the energy over a greater volume. This can lead to an overestimation of feedback effects, as the injected thermal energy is spread more evenly and quickly throughout the simulation volume. Secondly, the bound, dense clumps present in 1E16-no-feedback can radiate away energy, further reducing feedback’s effectiveness in halting accretion.
It should be noted that fragmentation before disc formation can impede growth. In Halo 2, the gas cloud did not radially collapse to one point, but rather broke off into two chunks. As a result, there is interaction between a small compact proto-disc around the BH and a self-gravitating cluster of clumps less than a parsec away. The cluster pulls gas from the proto-disc and disrupts its growth until the two structures eventually coalesce, leading to Accretion Event 4 between in the no-feedback run. When thermal feedback is activated at the beginning of this coalescence, the proto-disc is depleted entirely at mid to maximum feedback efficiencies. With no reservoir of dense gas to fuel it, the BH grows little thereon.
3.3 The Impact of Feedback on the Disc
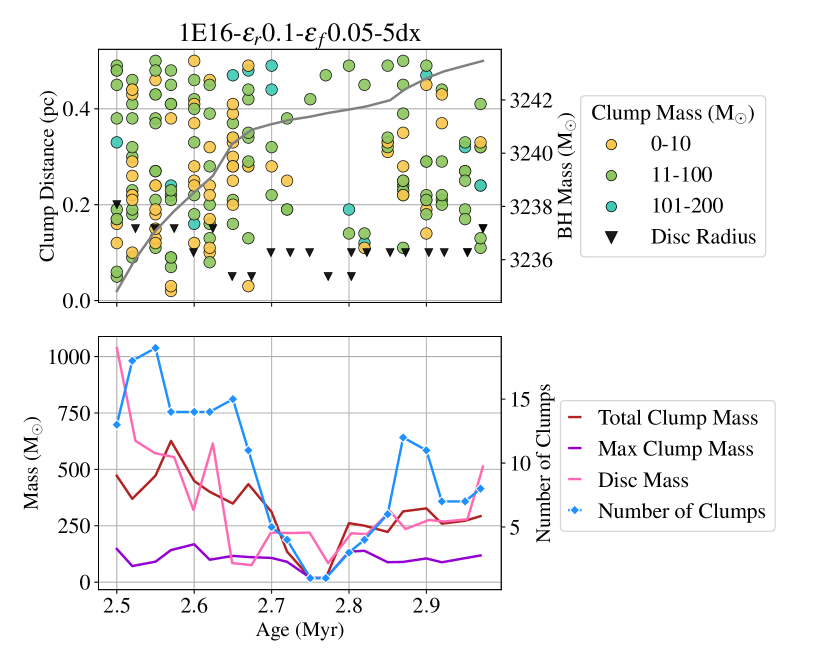
Feedback destroys clumps and homogenises the gas in the vicinity of the black hole. Figure 3 compares the evolution of clump properties in 1E16-no-feedback and 1L16---5dx (most efficient feedback) during Accretion Event 1. The figure is divided into two panels for each case, with the top panels showing the clump distribution, disc radius, and BH mass, and the bottom panels illustrating the evolution of the total/max clump mass, disc mass, and clump count within of the black hole. In the left (no feedback) simulation, clumps are more densely distributed, and there is often a massive clump (blue point) close to the BH (within ). In the right (max feedback) simulation, the clumps are fewer and farther apart, especially towards the later stages where there are no clumps whatsoever within of the BH. The disc radius (defined as the minimum volume that encloses gas of average density ) also reduces throughout the accretion period in the feedback simulation but remains relatively stable without feedback. The lower panel shows a slight upward trend in total and max clump mass and clump number in the no-feedback case, in contrast with a steep decline in the presence of feedback. The plateau in the BH mass (grey line, top panel) in the latter case corresponds with the trough in three of the clump statistics, suggesting that without clumps the BH does not grow. Interestingly, while the total clump mass in the no-feedback run is about double that of the with-feedback run on average, there is little difference in the maximum clump mass. This suggests that the largest clumps can withstand the impact of feedback better than less massive clumps. We can conclude that strong feedback expels gas and clumps from around the BH and thwarts the formation of new clumps in Accretion Event 1.
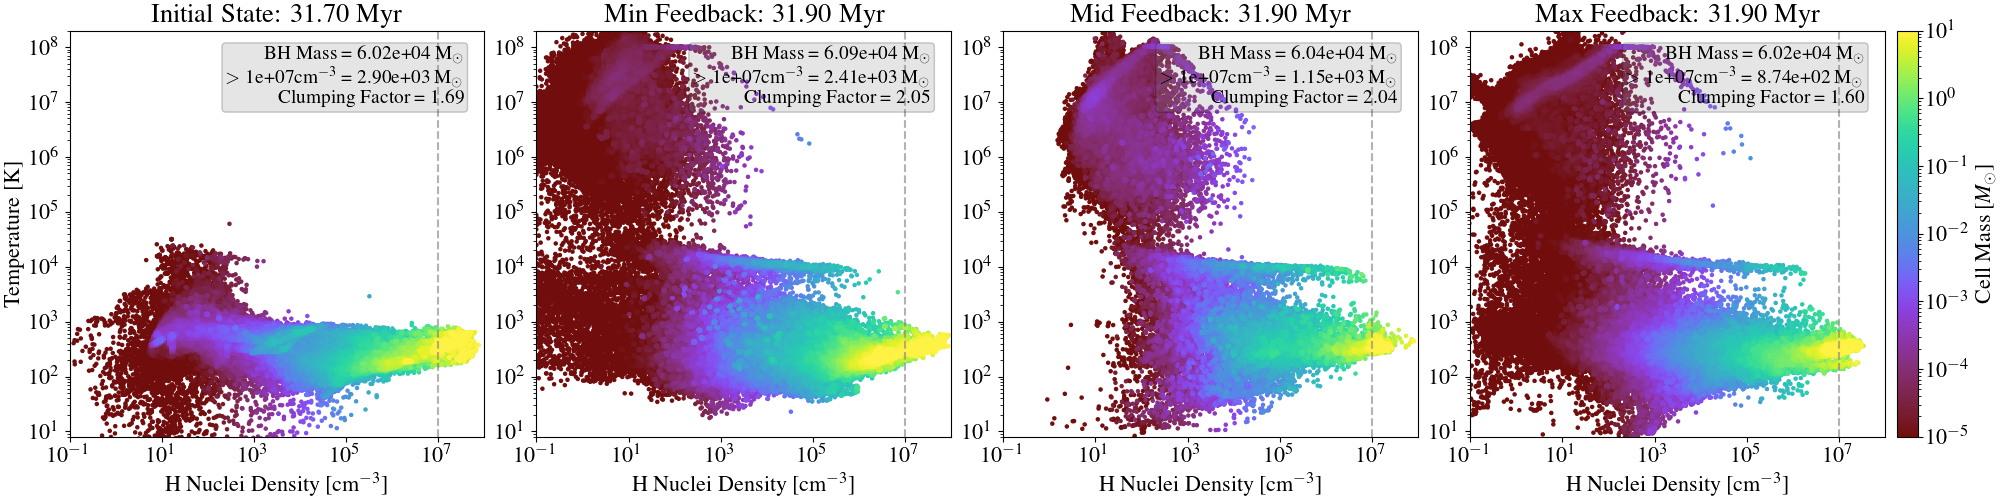
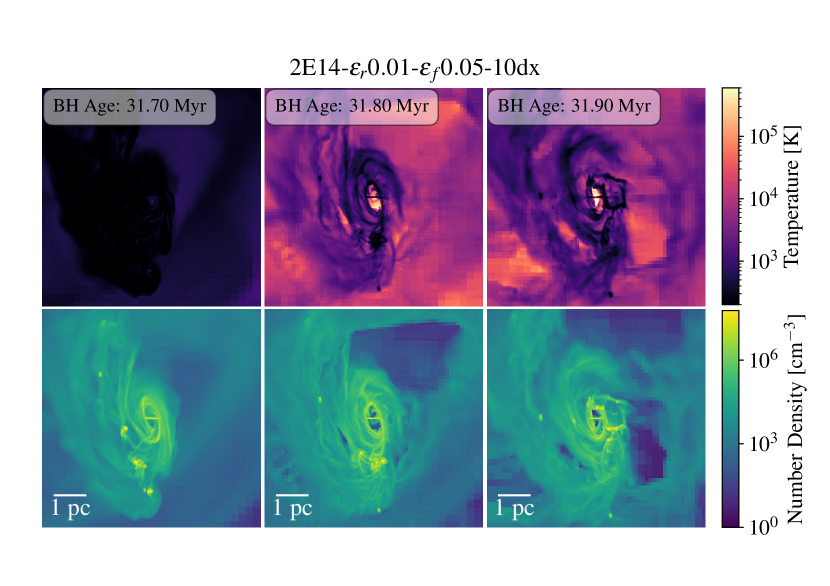
Figure 4 shows the phase evolution of the gas within of the black hole for four simulations from Accretion Event 2. The first plot shows the state of the gas before feedback is activated, while the other three show the impact of feedback later at progressively higher levels of feedback efficiency. Feedback heats the gas near the particle up to , with an extended range of densities at , likely due to the peak in the pristine gas cooling curve at (Thoul & Weinberg, 1994). Additionally, a cluster of more massive cells is visible between , where cooling starts to increase in efficiency again. The clumping factor, defined as , is shown for each feedback scenario as a measure of how concentrated the gas is relative to a uniform distribution. Simulations with maximum feedback exhibit a lower clumping factor (), indicating that feedback homogenises the gas, while simulations with minimum feedback show higher clumping factors (), suggesting greater gas concentration 111While clumping factors have a high variance over time (up to 25 per cent from the mean over ), the ranking of simulations from lowest to highest stated does not change when averaged over the period.. Another clear impact of feedback is the reduction in high-density gas (), with the mass halving from minimum to mid-range efficiencies, and further decreasing by 25 per cent from mid to maximum feedback levels. This demonstrates the self-regulating nature of thermal feedback, which allows the black hole’s gravitational sphere of influence to be periodically replenished while preventing overcooling and excessive clump formation. Though not shown, the no-feedback simulation at has the highest clumping factor at , closely followed by 2E14---7dx and 2E14---5dx, where . Increasing the feedback injection radius from to means that less energy is being deposited per cell, hence the intensity of the feedback is curtailed. 2E14---7dx also has double the quantity of mass at high density compared to 2E14---5dx and a higher black hole mass, though the shape of the phase diagram is similar, so gas is still being heated and blown out of the accretion region. The effectiveness of such feedback is discussed in section 3.5.
3.4 Conditions for Super-Eddington Accretion
We find that super-Eddington growth is possible in a few scenarios. Firstly, a very weak thermal feedback efficiency of and in almost all environments with the fiducial injection radius of results in super-Eddington accretion. The only exception is 1L14---5dx, which accretes at a trans-Eddington rate on average. In contrast, its higher-resolution counterpart 1L16---5dx accretes over 10 times the Eddington rate. The former is more sensitive to feedback due to its lack of disc fragmentation, as explained previously in section 3.2. All other simulations studied contain cool, dense clumps with high optical depths that act as absorbers of thermal energy, diminishing its effectiveness in heating and dispersing the surrounding gas.
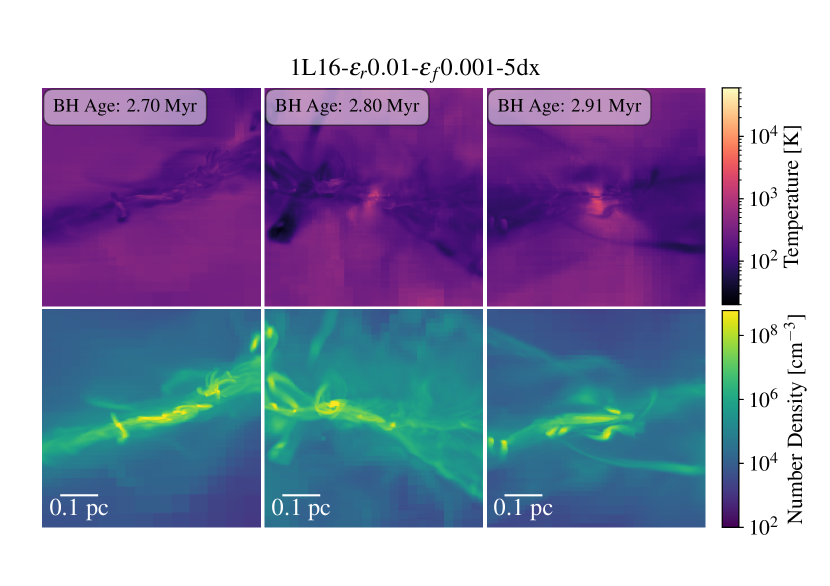
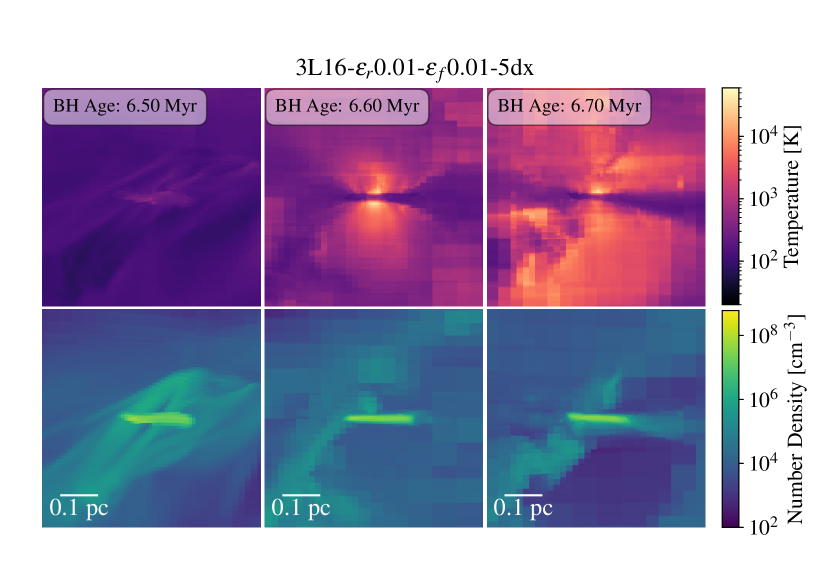
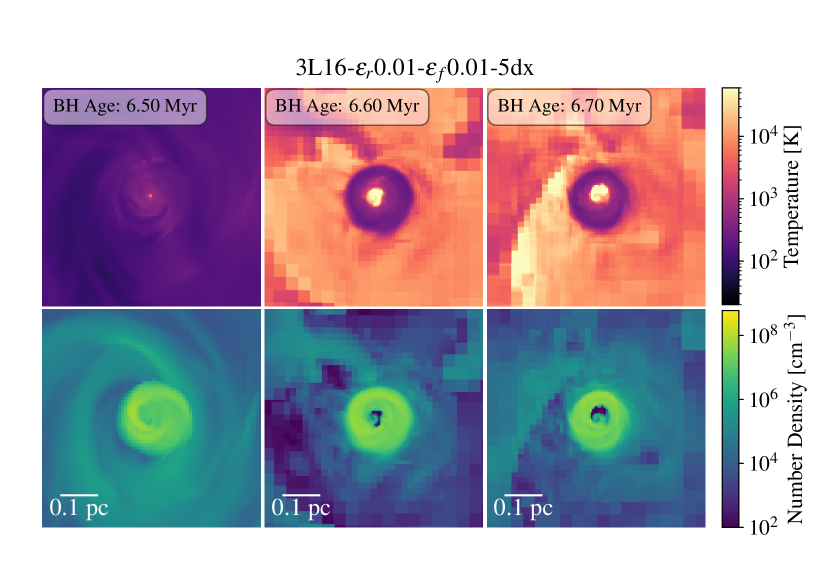
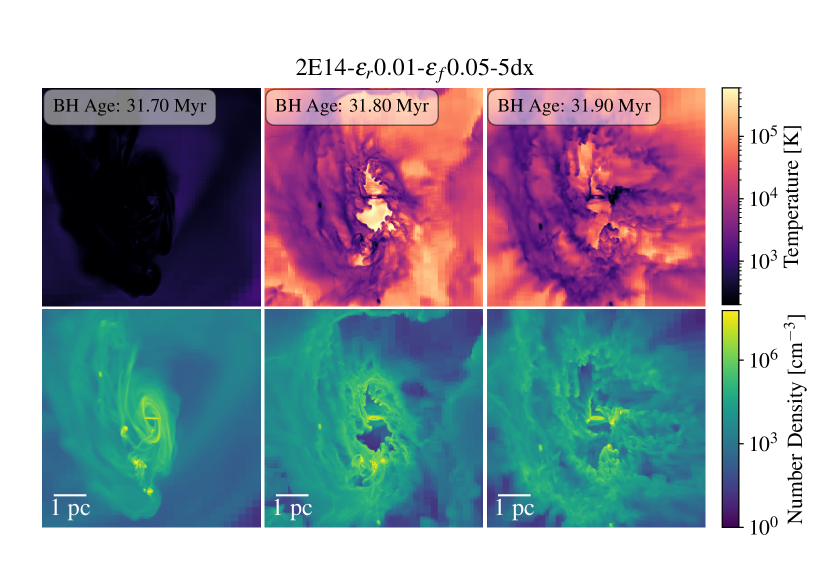
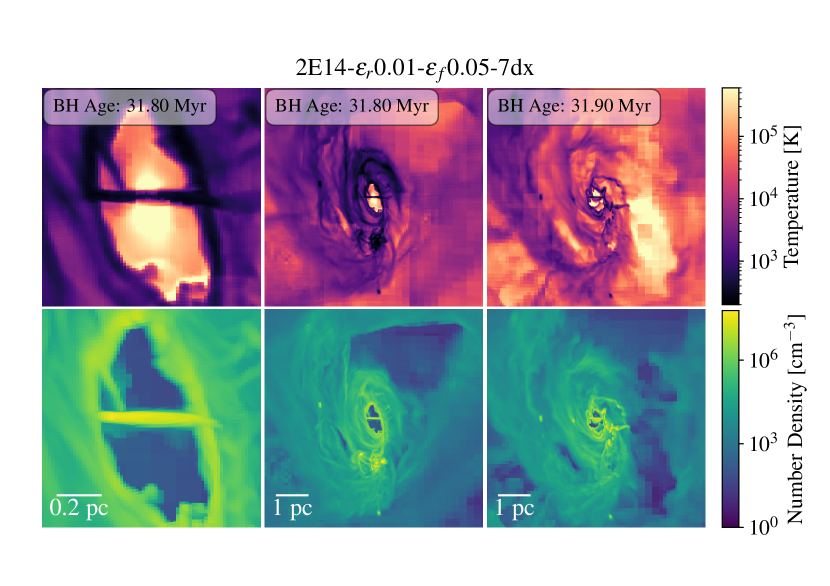
Super-Eddington accretion is also seen in medium- to high-thermal efficiencies for the BH in Accretion Event 2 with . Figure 5 depicts projections of the temperature and density of the disc for three sets of simulations with the same feedback efficiency and (mid-range), but different injection radii; . Note that 2E14---5dx averages at a trans-Eddington accretion rate while the latter two average at super-Eddington. In the first panel, we can see that the pc-scale environment has been impacted by feedback; shocks and dissipation of the disc are visible, some regions have been heated to , and a bubble of sparse, warm gas has formed around the black hole, which previously had the densest gas concentration. However, the zoomed-in final column reveals that a dense, cold sub-pc inner disc (which is orthogonal to the outer disc) remains intact. This structure is robust enough to withstand thermal pressure, even in 2E14---5dx (not shown), where the feedback is 10 times more intense. This helps prevent the Eddington fraction from dropping sharply to once feedback is activated, as in Accretion Events 1 and 3 for the same level of feedback efficiency. The key takeaway is that even under significant feedback, the built-up environment of the massive black hole (usually defined in the range ) is able to stabilise its accretion flow by maintaining a cold, dense core. The differences in feedback radii may influence the large-scale dynamics, but the inner disc’s integrity is central to sustaining accretion in all feedback configurations.
Trans-Eddington growth is possible for the BH of Accretion Event 1 which is nestled within a disc of comparable mass (see Figure 2 for projections). Though the environment is not as built up as for the BH, the clumps present in the higher resolution iterations () provide some shielding from thermal feedback. With , , and in 1L16---5dx, an average Eddington fraction is maintained over . With , , and in 1L16---10dx, an average Eddington fraction is maintained over . Trans-Eddington accretion is also maintained over for the BH in the Accretion Event 3 simulation 3E16---5dx. This and 2E14---5dx are the only two mid-efficiency feedback trans-Eddington simulations with . The effectiveness of thermal feedback to alter the state of the gas, drive outflows, and suppress accretion at lower efficiencies and larger injection radii will be discussed in section 3.5.
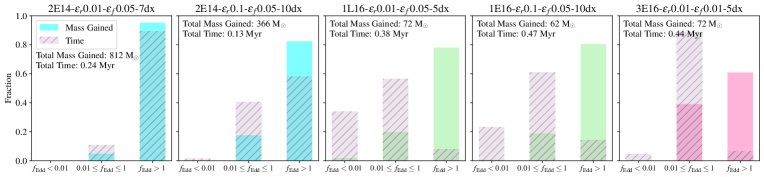
Figure 6 shows the fraction of time spent in each accretion phase (sub-Eddington, trans-Eddington, and super-Eddington) along with the fraction of mass gained over the total time in each mode for a sample of the super- and trans-Eddington accreting black holes. In the two Event 1 simulations, where the black holes spend most of their time in the super-Eddington regime , the majority of mass gain occurs during this phase, which is expected. These periods of sustained super-critical growth illustrate that thermal feedback may not be strong enough to quench further accretion soon after. It is worth remarking that for two of the three black holes that average in the trans-Eddington phase (where ), the super-Eddington mode still accounts for the majority of the mass gain, despite the black hole spending more time in lower accretion states. This suggests that brief periods of super-Eddington accretion are disproportionately important for black hole growth. Even spending as little as 5 per cent of the time in is sufficient to contribute 50 per cent of the mass gain, as observed in the simulation 1L16---5dx. However, longer-term evolution past the accretion event could balance contributions from different phases (as suggested by the results from 1E16---5dx(0.48 Myr)). These results reinforce the idea that even short periods of super-Eddington accretion is an extremely efficient vehicle for black hole growth.
3.5 The Effectiveness of Thermal Feedback
What does effective thermal feedback look like? The non-linear processes governing accretion physics make it difficult to deduce the average feedback efficiency of the first generation of black holes ab initio. Numerical simulations often calibrate feedback efficiencies to produce black holes with properties that align with observed black hole-galaxy scaling relations at low redshift (e.g., ). However, many of these relations may not hold true for the very high redshift proto-galactic environments in this work. In lacking observable benchmarks, we assess the ability of feedback to heat and regulate the gas dynamics by coupling energy to the gas, preventing rapid cooling and driving outflows by comparing the simulations to their no-feedback counterparts and each other.
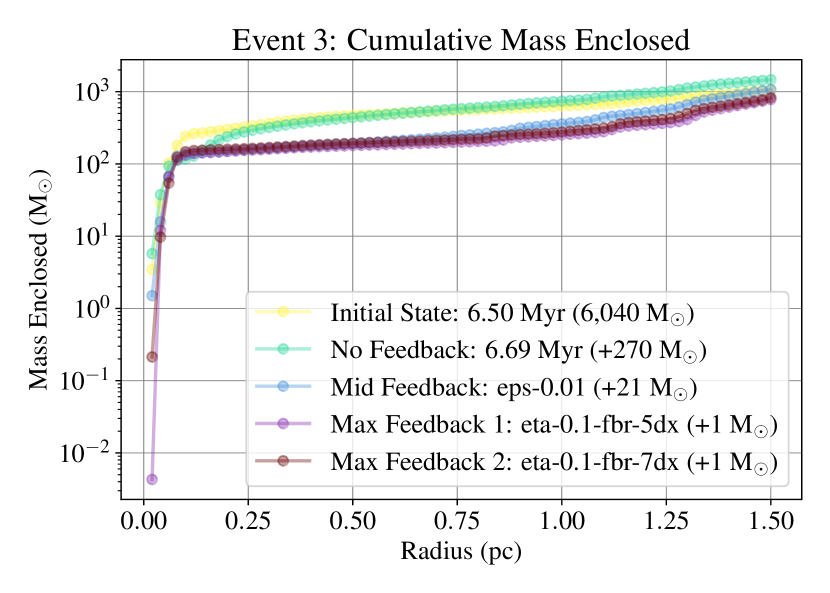
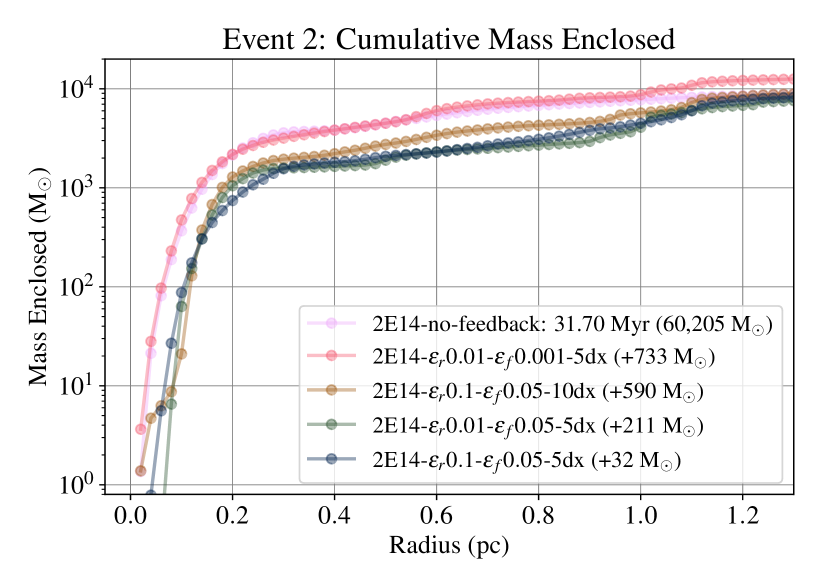
Figure 7 shows the cumulative mass enclosed around the black hole as a function of radius for four Accretion Event 2 simulations: the initial state at with a black hole mass of for reference, and three feedback scenarios of increasing intensity. The mass gained by each simulation over is written in brackets. The mass enclosed rises sharply up to and plateaus around , which roughly corresponds to the radius of the disc (see Figure 5). As feedback intensity increases, the total enclosed mass decreases, indicating more effective gas expulsion at higher efficiencies. The lowest feedback run (blue line) shows the highest mass retention, hardly deviating from the initial state, which suggests that the feedback is not pushing out much gas, if at all. In contrast, the mid-range (purple) and maximum (crimson) feedback runs have up to two orders of magnitude less mass at the lowest radii, and about half the mass enclosed within the disc at - indicating that stronger feedback effectively suppresses mass accumulation, particularly within the disc. While the overall trend suggests that the highest feedback intensity should expel more gas, there are a few points within where mid-range encloses slightly less mass. Moreover, the hump at indicates that mid-range feedback results in a slightly less aggressive interaction with the disc, preserving more gas within its gravitational bounds. These subtle differences reflect the complexity of gas dynamics in feedback-regulated environments. Nonetheless, a clear delineation emerges between the minimum and moderate/maximum feedback ranges for a given injection radius, suggesting that the former is ineffective at driving outflows.
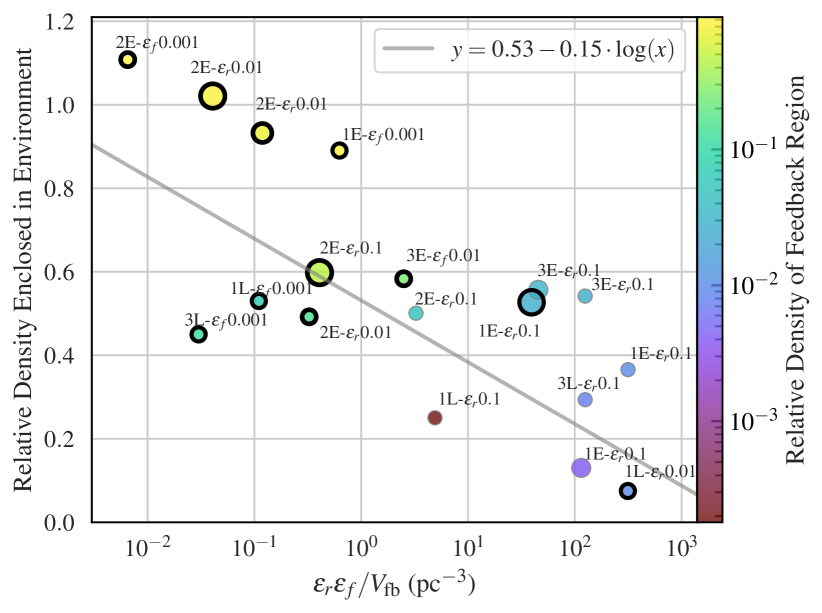
Figure 8 shows a measure of the intensity of the feedback configuration versus the ratio of the mass enclosed after some evolution with feedback to the original mass enclosed before feedback is activated. This ‘feedback intensity’ is defined as /, where the denominator is the volume of the feedback sphere in units of . Lower values might indicate longer-distance but milder effects, where feedback impacts the environment over a wider area but with less intensity, and higher values imply that a significant amount of feedback is concentrated in a relatively small spatial region. The radius within which the mass enclosed per event is measured is defined as half of the radius at which the mass enclosed converges with the initial state; for accretion events 1-3, respectively, which we determine with plots like Figure 7. Each point represents a simulation, which is labelled with the event number, the main feedback parameter from the fiducial setting of and and the radius of the feedback sphere in units of cell widths. The points are coloured according to the relative density of their feedback region in comparison to the density just before feedback is activated. The overall y-weighted least-squares linear regression trendline shows a decline in relative mass enclosed as the feedback efficiency per unit volume increases. This suggests a correlation between high feedback efficiency and the ability to drive outflows away from the black hole. The relative density of the feedback sphere also supports this; lower-density regions correspond with high feedback intensity. The considerable scatter around the trend reflects variations in local conditions; for instance, the ‘L’ simulations, which are initiated before the accretion event, generally enclose less mass relative to the later starting position than those that began prior, even though all measurements are made post feedback activation. The higher accretion rate close to the event drives stronger feedback that may evacuate gas from the region faster in comparison to a more quiescent period.
We focus our discussion on identifying the subset of black circled points in Figure 8 that accrete at trans or super-Eddington rates and also have effective thermal feedback. We draw from previous analyses in this work to reach the simulation classifications. Firstly, the point labelled ‘2E-’ at (0.8, 0.9) corresponds to 1E16---5dx and averages at a accretion rate. However, from its position in the top left corner and the high relative density of its feedback region, the thermal feedback seems too weak to convert to kinetic energy and affect change in the black hole’s environment. This applies to the other yellow points nearby too (2E14---7dx and 2E14---10dx), for which you can see temperature and density projections in Figure 5. On the other end of the relation, 1L16---5dx is located at (314, 0.07) in the bottom right quadrant and has a feedback region relative density of about . This simulation shows strong evidence of effective thermal feedback whilst maintaining a trans-Eddington accretion rate throughout its of evolution (see middle panel of Figure 6). Though it doesn’t push out as much gas in comparison, 1E16---10dx, which is located at (70, 0.55), is also in the bottom right quadrant and has a feedback region relative density of , having pushed out per cent of the gas. It maintains a slightly lower Eddington ratio of . We categorise both of these simulations as having effective thermal feedback.
Clustered in the middle of Figure 8 are four Eddington-accreting simulations that eject between per cent of the gas in the disk, but keep 15 - 45 per cent of the gas in the feedback region. Is this sufficiently disruptive to be considered effective feedback? We must look to other analyses to judge this. From the first row of Figure 5, we can see that 2E14---5dx does appear to drive outflows on pc scales, destroying most of the outer disc. Figure 7 shows that it has a very similar enclosed mass profile to its higher efficiency counterpart, 2E14---5dx. These two pieces of evidence tip the balance in favour of effective feedback. Conducting a similar study on 2E14---10dx reveals that it too has a similar projection plot and mass enclosed to 2E14---5dx. On the other hand, 3E16---5dx has made little impact on its host disc in terms of disrupting its size and dynamics, though the cumulative mass enclosed profile shows that it has reduced the mass within of the black hole by the same amount as the maximum efficiency runs. However, it encloses more mass within , implying that it has not been as effective at expelling gas on pc scales. These considerations tip the balance against 3E16---5dx having effective feedback. Likewise, the cumulative mass enclosed profile of 1L16---5dx shows that it has hardly expelled more gas than the no-feedback run. See Appendix A for the cumulative mass profiles and projections of 3E16---5dx and 1L16---5dx. We summarise our classification of all trans- and super-Eddington accreting black holes in Table 3.
| Simulation | Time [Myr] | Effective Feedback? | |
|---|---|---|---|
| 1E16---5dx | 19.0 | 0.23 | No |
| 1L16---5dx | 33.5 | 0.21 | No |
| 1L16---5dx | 0.32 | 0.38 | Yes |
| 1E16---10dx | 0.13 | 0.47 | Yes |
| 2E14---5dx | 0.43 | 0.84 | Maybe |
| 2E14---7dx | 2.66 | 0.24 | No |
| 2E14---10dx | 2.60 | 0.48 | No |
| 2E14---10dx | 2.09 | 0.13 | Maybe |
| 3E16---5dx | 0.10 | 0.44 | Yes |
4 Discussion
We have shown that super-Eddington accretion is possible for black holes between on short timescales in an early Universe environment, but can it be sustained? Figure 9 displays the BH mass growth across cosmic time for each simulation that accreted at trans- or super-Eddington rates and had ‘Yes’ or ‘Maybe’ classifications for effective thermal feedback, assuming that they continue to grow at their current averaged rates. If this were possible, they could explain a subset of observations (all other data points in Figure 9) from Maiolino et al. (2023a); Greene et al. (2024); Harikane et al. (2023). We now discuss other works that have focused on longer-term efficient accretion at lower spatial resolutions to evaluate the likelihood of this scenario.

Mehta et al. (2024) demonstrate that super-Eddington accretion onto stellar-mass BHs in a compact, high-z galaxy can occur over millions of years with supernova feedback (a single momentum injection) included - provided the black holes are situated in gas-rich environments. They find that the radially inward flow of the cool, dense gas exceeds the outward thrust of the supernova explosion, and the mixing of gas flows conspires to reduce angular momentum. In a minority of cases, nearby supernovae shocks enhance growth, creating inhomogeneities around the BH particle. Their gas element resolution of is comparable to the lowest resolution simulations in this work, for which we found thermal feedback to have a greater adverse effect on growth than at higher resolutions due to the less dense clumps. While we have not included supernova feedback, these findings indicate that it may not significantly stifle super-Eddington growth as the seed evolves, at least on timescales of . It should be noted that the authors sum the BHL formula and a term accounting for turbulence to calculate the overall rate, leading to a greater estimation of accretion onto the BH than used in this work.
In a similar vein, Lupi et al. (2016) show that stellar-mass BHs ( or ) bound to clumps in the circum-nuclear disc of a more advanced galaxy experience periodic super-Eddington growth over , even with thermal feedback present. Once again, the gas resolution is comparable to the lowest resolution simulations present in this work, . They attribute this rapid growth to the low radiative efficiency of super-critical flows as well as gas-rich environs. They compute the radiative efficiency on the fly based on the Eddington ratio, with high ratios corresponding to low . This results in frequent drops to . With a fixed , the overall efficiency of feedback is , which is less than our maximum feedback value. Their environment is most comparable to our Accretion Event 2, in which the MBH remains nestled within a compact inner disc, regardless of feedback efficiency. Our black hole also experiences super-Eddington accretion at similar feedback efficiencies, however, in this work, in contrast to the reached in Lupi et al. (2016). This could be due to their on-the-fly feedback implementation which enables more prolonged periods of super-Eddington growth and/or the presence of metal cooling in their lower redshift galaxy host. This work supports our findings that the black hole being enveloped in dense gas significantly reduces the deleterious impact of thermal feedback on growth.
Lupi et al. (2024b) use cosmological zoom-in simulations at lower resolution (Bondi radius is unresolved) to model a quasar at including both radiative and kinetic feedback. Their results show that super-Eddington accretion can indeed be sustained for , allowing MBHs to grow rapidly by up to three orders of magnitude. Again, lower feedback efficiency during super-Eddington phases makes this possible. A semi-analytic calculation shows that MBH spin remains moderate during super-Eddington phases, which reduces feedback efficiency. They also find that a weaker magnetic field in the disc results in more efficient accretion - in particular, extended phases of super-Eddington growth - in comparison to a magnetically-arrested disc. Since we are simulating the first generation of black holes born into pristine gas, our simulations are metal-free. The discs hosting the BHs are also less massive than a quasar disc. This environment is less likely to support the formation of powerful, relativistic jets, hence we have not included the kinetic feedback that impedes quasar growth so severely. On the other hand, metal line emission available to the quasar enables more efficient cooling and fragmentation of the gas. In essence, they were exploring the possibility of super-Eddington accretion in the unfavourable conditions of magnetically sourced jets, radiative feedback and relatively high black hole spin, whereas our unfavourable conditions are thermal feedback, lack of pressure from inflowing gas from larger scales (due to higher redshift), and lack of metal cooling. They find that the gas-rich conditions and short free-fall time allowed the accretion region to be replenished quickly post-jet feedback episodes, maintaining a density of on average. However, they caution that their limited resolution may not properly resolve the shocked gas and so may be under-representing the impact of the feedback. Since our simulations resolve the Bondi radius by a factor of a few most of the time (see Appendix A of G24), and we simulate in sub-pc gas resolution, we should be capturing shocks quite well. In simulations with strong thermal feedback, the accretion region can retain an average density of (1E16---5dx, 2E14---5dx), or it can quickly drop to (3L16---5dx). However, parts of the gas are heated to temperatures (see Figure 4).
Massonneau et al. (2023) explore the effect of different modes of feedback on a quasar of initial mass within an isolated galaxy simulation. In simulations where only thermal feedback is activated if , the black hole grows rapidly during super-Eddington episodes over . Without kinetic feedback, cold gas inflow is not efficiently counteracted, leading to sustained accretion above the Eddington limit. The BH triples its mass early on and grows per cent more massive than in other simulations with kinetic feedback in this regime. While their total feedback efficiency is over double our maximum (), their built up-environment is even more conducive to growth than in Lupi et al. (2024b). This highlights the significance of the gas composition when determining the effectiveness of feedback. Their -scale disc and more efficient metal cooling can withstand and counteract the detrimental effects of thermal feedback on black hole growth far more effectively than the sparse, pristine landscape of the early Universe mini-haloes, which are gas-poor and small (Correa-Magnus et al., 2023). As the young black holes studied here grow and their host mini-haloes develop into galaxies, higher feedback efficiencies may still allow for super-Eddington growth.
To summarise, it has been shown that super-Eddington accretion can be sustained for in compact gas-rice environments (Mehta et al., 2024; Lupi et al., 2016) and on the scale of in lower-resolution simulations (Lupi et al., 2024b; Massonneau et al., 2023), when feedback efficiencies can be suppressed and accreted gas is replenished frequently. Simulations incorporating spin (Lupi et al., 2024b) show that moderate black hole spins during super-Eddington phases reduce feedback efficiency, further supporting extended growth. Our higher-resolution simulations resolve the Bondi radius and the sub-pc gas structure, capturing shocks more effectively, but operate in pristine, high-redshift environments where gas-poor conditions limit sustained accretion. Collectively, these findings show promise for the simulations in Figure 9 to maintain efficient growth across cosmic timescales and potentially seed the SMBHs observed at .
5 Caveats
The gas content of the mini-haloes in this work is likely too cool and abundant. In galaxy formation simulations, thermal feedback from supernovae is typically used to heat the interstellar medium, drive outflows, and regulate star formation. The effectiveness of this feedback is often evaluated by comparing simulated star formation rates with observed or expected values; rates exceeding expectations indicate ineffective feedback. However, this metric is not applicable to the early Universe environment explored in this study. To simplify the simulations, we have excluded both background feedback and star particle formation. As a result, the gas content represents an upper bound, as star particle formation would ordinarily remove gas from cells and assign it to particles to conserve mass-energy. Furthermore, cooling from HD is not included in the chemistry model. While HD dominates over at , collisional ionisation in primordial gas is required to form the molecule in high abundance. This can occur in shock heating to temperatures above , as in the virialisation of atomic cooling haloes, or through the radiation from nearby Pop III stars (Greif et al., 2010) — or, in our case, thermal black hole feedback. The black holes in this work form from ‘the first star in the Universe’ (a so-called ‘Pop III.I’ star (Tan & McKee, 2008)) in low-mass mini-haloes in which the HD fraction is not high enough to cool the gas to (Yoshida et al., 2007). However, thermal feedback heats and sometimes shocks the gas, which could generate enough HD to become the dominant cooling channel at low temperatures. It may be worth adding this species to the chemistry model in future work.
We have only modelled one type of black hole feedback. While thermal feedback primarily heats and expels gas in the immediate vicinity of the black hole, radiative feedback extends its influence much further, especially in the early universe. Electromagnetic radiation from the accretion disc, particularly in the UV and X-ray bands, not only heats and ionises nearby gas but also exerts radiation pressure, more effectively clearing the region around the black hole. Additionally, radiative feedback impacts larger scales by photoionising distant gas in the halo, inhibiting its cooling and collapse, which can have significant consequences for the evolution of the surrounding environment. Furthermore, kinetic feedback in the form of jets can help transfer energy from small to large scales (Maiolino et al., 2012). Generally, high-velocity jets are observed to arise from early-type galaxies hosting massive black holes with low accretion rates relative to its Eddington rate, while lower-velocity outflows typically arise in systems with higher (Best & Heckman, 2012; Heckman & Best, 2014). However, Regan et al. (2019) find that black holes formed from supermassive stars initially undergo super-Eddington accretion. Bipolar jets triggered by this accretion evacuate gas within of the black hole, reducing the effective accretion rate to , similar to the effects of thermal feedback on our high-resolution simulations with thermal feedback.
The black holes in this work originate from Pop III stars that lived between prior to collapsing into black holes, though we do not simulate their main-sequence lifetime. Ionising radiation has been shown to efficiently evacuate gas from the centre of the mini-halo, either dispersing it to the outskirts or destroying the gas structure completely (Shapiro et al., 2004; Alvarez et al., 2006; Whalen et al., 2008; Latif et al., 2022). This would have significantly reduced the density of the gas in the vicinity of the particles, potentially limiting their initial growth to a small fraction of the Eddington rate (Alvarez et al., 2009). However, Jaura et al. (2022) find that the ionising radiation from Pop III stars does not escape the dense accretion disc surrounding them when photons are injected into the simulation on scales smaller than the local scale height of the disc. Consequently, the inclusion of radiative feedback has little impact on the total mass of protostars formed during the simulated. Therefore, the nature of the environment in which the first generation of stellar-collapse black holes are born — whether gas-rich or gas-poor — remains uncertain.
While the black hole masses at the beginning of the accretion periods are not quite MBHs (apart from Event 2), they are generally still too high to have originated from a standard collapse of a single Pop III stellar core. Our setup of seeding a black hole, letting it evolve without feedback, and then resimulating with feedback complicates defining the assumed formation mechanism. Immediately introducing even weak feedback to the direct-collapse seed quickly quelled accretion and we did not have the computational resources to continue the simulations at high resolution until a significant injection of gas occurred. Note the lack of growth in Accretion Event 4 with a black hole after of evolution; the absence of a disc makes it vulnerable to the destructive effects of feedback. We prioritised the comparison of thermal feedback parameters under more favourable conditions to obtain a reasonable distribution of behaviour with reasonable feedback efficiencies. Nevertheless, there may be particular formation channels that could lead to such a black hole forming, as discussed in the introduction.
We have not accounted for an evolving black hole spin. Instead, we have implicitly assumed a maximum fixed spin of about for . This is the standard solution for a Schwarzschild black hole in the thin-disc model, though the radiative efficiency can quadruple for highly spinning black holes (Blandford & Znajek, 1977; Tchekhovskoy et al., 2011). Madau et al. (2014) argue that the assumptions of the thin-disc model break down at accretion rates where and that a slim-disc solution is more appropriate in this regime. As a result of photon trapping, the efficiency of converting gravitational energy into radiative flux in slim discs decreases with increasing accretion rate. Because of low radiative efficiencies around static as well as rapidly rotating holes, the mass growth in the mildly super-Eddington regime becomes nearly independent of the spin parameter. This is in contrast to the thin-disc solution, where the mass of the growing hole is exponentially sensitive to its spin (see Figure 2 of (Madau et al., 2014)). Therefore, if spin were assigned to the black holes discussed in section 3.4 that spend all their time at trans- or super-Eddington modes, it would make little difference to the mass growth. However, simulations that spend considerable time in regimes would be limited even further, widening the gap in accretion behaviour of the black holes studied in this work. The spin of the black hole is usually assigned based on its formation mechanism; direct collapse black holes are thought to have lower spin due to strong radial inflows and lack of angular momentum required to form them, while strongly spinning black holes may be more prevalent in the low-mass population due inheriting the spin of its progenitor star and fewer mergers (Bustamante & Springel, 2019; Beckmann et al., 2024). We defer a more self-consistent treatment of spin to later work.
6 Conclusions
We investigated the impact of thermal feedback on super-Eddington accretion in early Universe black holes using sub-pc resolution cosmological simulations. We allowed a single stellar-mass black hole born in a dark matter mini-halo to evolve unencumbered by feedback for a certain period of time, then resimulated with thermal feedback activated before a significant accretion event. We did this for four accretion events, resulting in four simulations with initial black hole masses ranging from . Feedback was modelled thermally, injecting energy into the gas surrounding black holes according to accretion rates and radiative efficiencies (), while coupling efficiencies () and feedback sphere radii () were varied systematically. We incorporated a detailed chemical network for primordial gas and analysed gas clump formation, fragmentation, and the resulting effects on accretion. Additionally, we examined how feedback efficiency modulates gas expulsion, disc stability, and clump survival. Our key results can be summarised as follows:
-
1.
The resolution-dependent onset of fragmentation within the nuclear disc around the black hole in the absence of feedback enhances the accretion rate.
-
2.
Discs with a clumpy, inhomogeneous composition are more resistant to thermal feedback than smooth, homogenous discs, and feedback destroys smaller clumps first.
-
3.
Super-Eddington accretion can be sustained in clumpy environments with feedback efficiencies and when the feedback injection radius is , or at higher efficiencies and if the injection radius is increased to .
-
4.
Super-Eddington accretion is responsible for the majority of the mass growth in most simulations, even when the black hole spends less than per cent of the time in this mode.
-
5.
Correlations exist between the relative density enclosed in the disc, the relative density enclosed in the feedback region, and the thermal feedback parameters. These relationships can be leveraged to help determine whether feedback has impacted the environment significantly.
-
6.
We classify three simulations that accrete at trans-Eddington rates to do so in the presence of effective feedback.
-
7.
Two simulations may also have effective feedback, one of which accretes at twice the Eddington rate and the other at a trans-Eddington rate.
Determining whether super-Eddington accretion is feasible at cosmic dawn is crucial for investigating whether such a regime could explain the rapid growth of black holes to the billion-solar-mass scale observed in high-redshift quasars. Our results indicate that, in a gas-rich environment, trans-Eddington and super-Eddington accretion are achievable during the early phases of evolution of the first generation of black holes, even in the presence of effective thermal feedback.
Acknowledgements
We would like to thank Alessandro Lupi for providing the observational data with references in Figure 9. We also extend our gratitude to Molly Peeples for her generous provision of computing resources that enabled this work to be completed. SG is supported by the Science and Technologies Facilities Council (STFC) PhD studentship. BDS and SK are supported by the STFC Consolidated Grant RA5496. SK acknowledges funding via STFC Small Grant ST/Y001133/1. RSB acknowledges support a UKRI future leaders fellowship under grant number MR/Y015517/1. The simulations were run on the high-performance computing (HPC) facility Pleiades. Pleiades is a distributed-memory SGI/HPE ICE cluster, part of the NASA High-End Computing (HEC) Program through the NASA Advanced Supercomputing (NAS) Division at Ames Research Center. Computations and associated analysis described in this work were performed using the publicly available Enzo code (Bryan & Enzo Collaboration, 2014) and the yt (Turk et al., 2011) analysis toolkit, which are the products of collaborative efforts of many independent scientists from institutions around the world. For the purpose of open access, the authors have applied a Creative Commons Attribution (CC BY) licence to any Author Accepted Manuscript version arising from this submission.
Data Availability
All simulations in this work were run from a GitHub fork of Enzo (Bryan & Enzo Collaboration, 2014) containing changes which, at the time of writing, have not been merged into the main branch. Details of the branch used are a ailable on request from the author. All plots were produced using the yt Python package (Turk et al., 2011) and the scripts are available in this GitHub repository222https://github.com/simonetgordon/smartstar_simulation_analysis.
References
- Abel et al. (2002) Abel T., Bryan G. L., Norman M. L., 2002, Science, 295, 93
- Adams et al. (2022) Adams N. J., et al., 2022, Monthly Notices of the Royal Astronomical Society, 518, 4755
- Agarwal et al. (2016) Agarwal B., Smith B., Glover S., Natarajan P., Khochfar S., 2016, MNRAS, 459, 4209
- Alvarez et al. (2006) Alvarez M. A., Bromm V., Shapiro P. R., 2006, ApJ, 639, 621
- Alvarez et al. (2009) Alvarez M. A., Wise J. H., Abel T., 2009, ApJ, 701, L133
- Atek et al. (2023) Atek H., et al., 2023, MNRAS, 519, 1201
- Beckmann et al. (2024) Beckmann R. S., et al., 2024, arXiv e-prints, p. arXiv:2410.02875
- Begelman (1979) Begelman M. C., 1979, MNRAS, 187, 237
- Behroozi et al. (2013) Behroozi P. S., Wechsler R. H., Wu H.-Y., Busha M. T., Klypin A. A., Primack J. R., 2013, ApJ, 763, 18
- Best & Heckman (2012) Best P. N., Heckman T. M., 2012, MNRAS, 421, 1569
- Bhatt et al. (2024) Bhatt M., et al., 2024, A&A, 686, A141
- Blandford & Begelman (2004) Blandford R. D., Begelman M. C., 2004, Mon. Not. Roy. Astron. Soc., 349, 68
- Blandford & Znajek (1977) Blandford R. D., Znajek R. L., 1977, MNRAS, 179, 433
- Boekholt et al. (2018) Boekholt T. C. N., Schleicher D. R. G., Fellhauer M., Klessen R. S., Reinoso B., Stutz A. M., Haemmerle L., 2018, Mon. Not. Roy. Astron. Soc., 476, 366
- Bogdán et al. (2024) Bogdán Á., et al., 2024, Nature Astronomy, 8, 126
- Bondi (1952) Bondi H., 1952, mnras, 112, 195
- Booth & Schaye (2009) Booth C. M., Schaye J., 2009, Monthly Notices of the Royal Astronomical Society, 398, 53–74
- Brummel-Smith et al. (2019) Brummel-Smith C., et al., 2019, Journal of Open Source Software, 4, 1636
- Bryan & Enzo Collaboration (2014) Bryan G. L., Enzo Collaboration 2014, The Astrophysical Journal, 211, 19
- Bustamante & Springel (2019) Bustamante S., Springel V., 2019, MNRAS, 490, 4133
- Carr & Silk (2018) Carr B., Silk J., 2018, Monthly Notices of the Royal Astronomical Society, 478, 3756
- Castellano et al. (2023) Castellano M., et al., 2023, ApJ, 948, L14
- Clesse & García-Bellido (2015) Clesse S., García-Bellido J., 2015, Phys. Rev. D, 92, 023524
- Colazo et al. (2024) Colazo P. E., Stasyszyn F., Padilla N., 2024, A&A, 685, L8
- Correa-Magnus et al. (2023) Correa-Magnus L., Smith B. D., Khochfar S., O’Shea B. W., Wise J. H., Norman M. L., Turk M. J., 2023, Monthly Notices of the Royal Astronomical Society, 527, 307
- Dalla Vecchia & Schaye (2012) Dalla Vecchia C., Schaye J., 2012, MNRAS, 426, 140
- Di Matteo et al. (2005) Di Matteo T., Springel V., Hernquist L., 2005, Nature, 433, 604
- Di Matteo et al. (2008) Di Matteo T., Colberg J., Springel V., Hernquist L., Sijacki D., 2008, The Astrophysical Journal, 676, 33–53
- Ding et al. (2023) Ding X., et al., 2023, Nature, 621, 51
- Du et al. (2018) Du P., et al., 2018, The Astrophysical Journal, 856, 6
- Ferrarese et al. (2001) Ferrarese L., Pogge R. W., Peterson B. M., Merritt D., Wandel A., Joseph C. L., 2001, The Astrophysical Journal, 555, L79
- Fragile et al. (2018) Fragile P. C., Etheridge S. M., Anninos P., Mishra B., Kluzniak W., 2018, Astrophys. J., 857, 1
- Glover (2008) Glover S., 2008, in O’Shea B. W., Heger A., eds, American Institute of Physics Conference Series Vol. 990, First Stars III. pp 25–29 (arXiv:0708.3086), doi:10.1063/1.2905558
- Gordon et al. (2024) Gordon S. T., Smith B. D., Khochfar S., Regan J. A., 2024, Monthly Notices of the Royal Astronomical Society, 529, 604
- Greene et al. (2024) Greene J. E., et al., 2024, The Astrophysical Journal, 964, 39
- Greif et al. (2008) Greif T. H., Johnson J. L., Klessen R. S., Bromm V., 2008, Monthly Notices of the Royal Astronomical Society, 387, 1021
- Greif et al. (2010) Greif T. H., Glover S. C. O., Bromm V., Klessen R. S., 2010, ApJ, 716, 510
- Hahn & Abel (2011) Hahn O., Abel T., 2011, MNRAS, 415, 2101
- Harikane et al. (2023) Harikane Y., et al., 2023, The Astrophysical Journal, 959, 39
- Heckman & Best (2014) Heckman T. M., Best P. N., 2014, ARA&A, 52, 589
- Hirano et al. (2014) Hirano S., Hosokawa T., Yoshida N., Umeda H., Omukai K., Chiaki G., Yorke H. W., 2014, The Astrophysical Journal, 781, 60
- Hoyle & Lyttleton (1939) Hoyle F., Lyttleton R. A., 1939, Proceedings of the Cambridge Philosophical Society, 35, 405
- Hu & Eisenstein (1999) Hu W., Eisenstein D. J., 1999, Phys. Rev. D, 59, 083509
- Igumenshchev et al. (2003) Igumenshchev I. V., Narayan R., Abramowicz M. A., 2003, Astrophys. J., 592, 1042
- Inayoshi & Omukai (2012) Inayoshi K., Omukai K., 2012, Monthly Notices of the Royal Astronomical Society, 422, 2539
- Inayoshi et al. (2020) Inayoshi K., Visbal E., Haiman Z., 2020, Annual Review of Astronomy and Astrophysics, 58, 27–97
- Jaura et al. (2022) Jaura O., Glover S. C. O., Wollenberg K. M. J., Klessen R. S., Geen S., Haemmerlé L., 2022, Monthly Notices of the Royal Astronomical Society, 512, 116
- Jin et al. (2024) Jin P., et al., 2024, MNRAS, 530, 929
- Johnson et al. (2010) Johnson J. L., Khochfar S., Greif T. H., Durier F., 2010, Monthly Notices of the Royal Astronomical Society, 410, 919
- Katz et al. (2015) Katz H., Sijacki D., Haehnelt M. G., 2015, MNRAS, 451, 2352
- Kawasaki et al. (2012) Kawasaki M., Kusenko A., Yanagida T. T., 2012, Phys. Lett. B, 711, 1
- King (2024) King A., 2024, MNRAS, 531, 550
- King & Lasota (2024) King A., Lasota J.-P., 2024, arXiv e-prints, p. arXiv:2402.09509
- King et al. (2008) King A. R., Pringle J. E., Hofmann J. A., 2008, Monthly Notices of the Royal Astronomical Society, 385, 1621
- Komatsu et al. (2011) Komatsu E., et al., 2011, ApJS, 192, 18
- Kovács et al. (2024) Kovács O. E., et al., 2024, The Astrophysical Journal Letters, 965, L21
- Latif & Khochfar (2019) Latif M. A., Khochfar S., 2019, MNRAS, 490, 2706
- Latif et al. (2022) Latif M. A., Whalen D., Khochfar S., 2022, ApJ, 925, 28
- Lupi et al. (2016) Lupi A., Haardt F., Dotti M., Fiacconi D., Mayer L., Madau P., 2016, MNRAS, 456, 2993
- Lupi et al. (2024a) Lupi A., Trinca A., Volonteri M., Dotti M., Mazzucchelli C., 2024a, arXiv
- Lupi et al. (2024b) Lupi A., Quadri G., Volonteri M., Colpi M., Regan J. A., 2024b, A&A, 686, A256
- Madau & Rees (2001) Madau P., Rees M. J., 2001, The Astrophysical Journal, 551, L27–L30
- Madau et al. (2014) Madau P., Haardt F., Dotti M., 2014, ApJ, 784, L38
- Maiolino et al. (2012) Maiolino R., et al., 2012, MNRAS, 425, L66
- Maiolino et al. (2023a) Maiolino R., et al., 2023a, arXiv e-prints, p. arXiv:2305.12492
- Maiolino et al. (2023b) Maiolino R., et al., 2023b, arXiv e-prints, p. arXiv:2308.01230
- Maiolino et al. (2024) Maiolino R., et al., 2024, Nature, 627, 59
- Massonneau et al. (2023) Massonneau W., Volonteri M., Dubois Y., Beckmann R. S., 2023, A&A, 670, A180
- Mehta et al. (2024) Mehta D., Regan J. A., Prole L., 2024, arXiv e-prints, p. arXiv:2409.08326
- Mishra et al. (2022) Mishra B., Fragile P. C., Anderson J., Blankenship A., Li H., Nalewajko K., 2022, Astrophys. J., 939, 31
- Neeleman et al. (2021) Neeleman M., et al., 2021, ApJ, 911, 141
- Oppenheimer et al. (2019) Oppenheimer B. D., et al., 2019, Monthly Notices of the Royal Astronomical Society, 491, 2939
- Paczynski & Abramowicz (1982) Paczynski B., Abramowicz M. A., 1982, ApJ, 253, 897
- Piana et al. (2024) Piana O., Pu H.-Y., Wu K., 2024, MNRAS, 530, 1732
- Quataert & Gruzinov (2000) Quataert E., Gruzinov A., 2000, Astrophys. J., 545, 842
- Reed et al. (2019) Reed S. L., et al., 2019, MNRAS, 487, 1874
- Regan & Downes (2018) Regan J. A., Downes T. P., 2018, MNRAS, 478, 5037
- Regan et al. (2019) Regan J. A., Downes T. P., Volonteri M., Beckmann R., Lupi A., Trebitsch M., Dubois Y., 2019, MNRS, 486, 3892
- Reinoso et al. (2023) Reinoso B., Klessen R. S., Schleicher D., Glover S. C. O., Solar P., 2023, Mon. Not. Roy. Astron. Soc., 521, 3553
- Ripamonti & Abel (2004) Ripamonti E., Abel T., 2004, MNRAS, 348, 1019
- Ryan et al. (2017) Ryan B. R., Ressler S. M., Dolence J. C., Tchekhovskoy A., Gammie C., Quataert E., 2017, ApJ, 844, L24
- Ryu et al. (2016) Ryu T., Tanaka T. L., Perna R., Haiman Z., 2016, MNRAS, 460, 4122
- Sadowski et al. (2015) Sadowski A., Narayan R., Tchekhovskoy A., Abarca D., Zhu Y., McKinney J. C., 2015, Mon. Not. Roy. Astron. Soc., 447, 49
- Shakura & Sunyaev (1973) Shakura N. I., Sunyaev R. A., 1973, A&A, 24, 337
- Shapiro et al. (2004) Shapiro P. R., Iliev I. T., Raga A. C., 2004, Monthly Notices of the Royal Astronomical Society, 348, 753
- Sijacki et al. (2007) Sijacki D., Springel V., Di Matteo T., Hernquist L., 2007, Monthly Notices of the Royal Astronomical Society, 380, 877–900
- Simpson et al. (2013) Simpson C. M., Bryan G. L., Johnston K. V., Smith B. D., Mac Low M.-M., Sharma S., Tumlinson J., 2013, MNRAS, 432, 1989
- Smith et al. (2009) Smith B. D., Turk M. J., Sigurdsson S., O’Shea B. W., Norman M. L., 2009, ApJ, 691, 441
- Smith et al. (2017) Smith B. D., et al., 2017, Monthly Notices of the Royal Astronomical Society, 466, 2217
- Soltan (1982) Soltan A., 1982, MNRAS, 200, 115
- Springel et al. (2005) Springel V., Di Matteo T., Hernquist L., 2005, Monthly Notices of the Royal Astronomical Society, 361, 776–794
- Stone et al. (2024) Stone M. A., Lyu J., Rieke G. H., Alberts S., Hainline K. N., 2024, ApJ, 964, 90
- Suh et al. (2024) Suh H., et al., 2024, arXiv e-prints, p. arXiv:2405.05333
- Takahashi & Ohsuga (2015) Takahashi H. R., Ohsuga K., 2015, in 13th Marcel Grossmann Meeting on Recent Developments in Theoretical and Experimental General Relativity, Astrophysics, and Relativistic Field Theories. pp 2344–2345, doi:10.1142/9789814623995_0437
- Tan & McKee (2008) Tan J. C., McKee C. F., 2008, AIP Conf. Proc., 990, 47
- Taylor & Kobayashi (2014) Taylor P., Kobayashi C., 2014, Monthly Notices of the Royal Astronomical Society, 442, 2751
- Tchekhovskoy et al. (2011) Tchekhovskoy A., Narayan R., McKinney J. C., 2011, MNRAS, 418, L79
- Tegmark et al. (1997) Tegmark M., Silk J., Rees M. J., Blanchard A., Abel T., Palla F., 1997, Astrophys. J., 474, 1
- Thoul & Weinberg (1994) Thoul A., Weinberg D., 1994, ApJ, 442
- Trebitsch et al. (2019) Trebitsch M., Volonteri M., Dubois Y., 2019, Monthly Notices of the Royal Astronomical Society, 487, 819
- Turk et al. (2010) Turk M. J., Clark P., Glover S. C. O., Greif T. H., Abel T., Klessen R., Bromm V., 2010, The Astrophysical Journal, 726, 55
- Turk et al. (2011) Turk M. J., Smith B. D., Oishi J. S., Skory S., Skillman S. W., Abel T., Norman M. L., 2011, The Astrophysical Journal Supplement Series, 192, 9
- Wang et al. (2018) Wang E. X., Taylor P., Federrath C., Kobayashi C., 2018, Monthly Notices of the Royal Astronomical Society, 483, 4640
- Wang et al. (2021) Wang F., et al., 2021, The Astrophysical Journal, 907, L1
- Whalen et al. (2008) Whalen D., van Veelen B., O’Shea B. W., Norman M. L., 2008, ApJ, 682, 49
- Wise et al. (2012) Wise J. H., Turk M. J., Norman M. L., Abel T., 2012, ApJ, 745, 50
- Wolcott-Green & Haiman (2012) Wolcott-Green J., Haiman Z., 2012, Monthly Notices of the Royal Astronomical Society: Letters, 425, L51
- Woosley et al. (2002) Woosley S. E., Heger A., Weaver T. A., 2002, Rev. Mod. Phys., 74, 1015
- Wyithe & Loeb (2003) Wyithe J. S. B., Loeb A., 2003, The Astrophysical Journal, 595, 614
- Yajima & Khochfar (2016) Yajima H., Khochfar S., 2016, MNRAS, 457, 2423
- Yang et al. (2020) Yang J., et al., 2020, ApJ, 897, L14
- Yang et al. (2021) Yang J., et al., 2021, ApJ, 923, 262
- Yang et al. (2024) Yang X., et al., 2024, ApJ, 966, 151
- Yoshida et al. (2007) Yoshida N., Oh S. P., Kitayama T., Hernquist L., 2007, ApJ, 663, 687
- Yu & Tremaine (2002) Yu Q., Tremaine S., 2002, MNRAS, 335, 965
- Yue et al. (2023) Yue M., Fan X., Yang J., Wang F., 2023, AJ, 165, 191
Appendix A Effective Feedback Supplemental Analysis
To supplement the classification of simulations as having effective or ineffective thermal feedback in section 3.5, we provide cumulative mass enclosed radial profiles and projections of temperature and density for Event 1 and Event 3 simulations. Figure 10 pertains to Event 1, and the projections illustrate 1L16---5dx in Figure 10(b) and 1L16-no-feedback in Figure 10(c). This low feedback efficiency simulation exhibits few differences in temperature distribution with the no-feedback run, though it does have a disrupted outer disc structure. It also encloses less mass out to (blue line) in comparison to its initial state (green line). It occupies a mid-way point between the no-feedback run and the maximum feedback run 1L16---5dx (crimson line). It is more deviant from the no-feedback run than its earlier starting counterpart, 1E16---5dx (cyan line), and also accretes double the mass in the same period of time. This is due in part to its evolution coinciding with the accretion event, rather than stopping just before. This illustrates that weak feedback can still affect the environment when it is triggered during a strong inflow of material. However, we still categorise 1L16---5dx as not generating effective feedback as the relative density in the feedback region is mid-high at about and the temperature at pc scales is still .
Figure 11 pertains to Event 3, and the projections illustrate 3L16---5dx in Figure 11(b) at an edge-on perspective and Figure 11(c) at a face-on perspective. Unlike 1L16---5dx, this simulation does heat its environment to warm temperatures of . However, the sub-pc scale nuclear disc remains intact, thought with a hot and underdense ‘hole’ around the BH about the size of the feedback region. Its low relative density in the feedback region and very low relative density enclosed within the environment of (the feedback depletes the gas in the inner disc) in Figure 8, we conclude that feedback is indeed effective in this simulation.