11email: mar@iaa.es 22institutetext: Instituto de Radioastronomía y Astrofísica, Universidad Nacional Autónoma de México, Morelia, Michoacán, Mexico 33institutetext: Escola de Artes, Ciências e Humanidades, USP, Av. Arlindo Bettio 1000, 03828-000 São Paulo, Brazil
Y Gem, a Symbiotic Star Outshined by its Asymptotic Giant Branch Primary Component
Abstract
Context. A considerable number of asymptotic giant branch (AGB) stars exhibit UV excess and/or X-ray emission indicative of the presence of a binary companion. AGB stars are so bright that they easily outshine their companions, making almost impossible their identification. Y Gem has been known to be a far-UV- and X-ray-bright AGB star for some decades now, but the nature of its companion, whether it is a main-sequence star or a white dwarf (WD) in a symbiotic system (SySt), is disputed.
Aims. Our goal is to uncover the true nature of Y Gem to help us peer into the possible misidentified population of SySts.
Methods. Multi-wavelength IR, optical, UV and X-ray observations have been analyzed to investigate the properties of the stellar components and accretion process in Y Gem. In particular, an optical spectrum of Y Gem is presented here for the first time, while X-ray data are interpreted by means of reflection models produced by an accretion disk and material in its vicinity.
Results. The optical spectrum exhibits the typical saw-shaped features of molecular absorptions in addition to narrow recombination and forbidden emission lines. The presence of the emission lines and the analysis of the extinction-corrected UV spectrum suggest a hot component with 60,000 K, =140 L⊙, and =0.11 R⊙, very likely an accreting WD. The late component is found to be an 1.1 M⊙ AGB star with =3350 K and =240 R⊙.
Conclusions. Using IR, optical, UV, and X-ray data, we found that Y Gem is a S-type SySt whose compact component is accreting at an estimated mass accretion rate of M⊙ yr-1. At such accretion rate, the accreting WD has reached the stable and steady burning phase where no recurrent events are expected.
Key Words.:
(Stars:) binaries: symbiotic — Stars: AGB and post-AGB — Stars: mass-loss — Accretion, accretion discs — X-rays: individuals: Y Gem1 Introduction
Planetary nebulae (PNe), the short-lived descendants of low- and intermediate-mass stars after the asymptotic giant branch (AGB), exhibit a high occurrence of axisymmetric morphologies, with bipolar, highly collimated and point-symmetric shapes (Frew & Parker, 2010). The axisymmetric morphology of PNe would be naturally explained by the influence of a companion star during the late AGB phase (Balick & Frank, 2002; Jones & Boffin, 2017). Searches for companions of central stars of PNe (CSPNe) are difficult, yet they have resulted in a growing sample of binary CSPNe (Miszalski et al., 2009; De Marco et al., 2013; Jacoby et al., 2021).
The search for the stellar companions responsible for PN shaping can alternatively be carried out among their precursor AGB stars. These are expected to be UV faint (Sahai et al., 2008) and X-ray quiet as they cannot support a corona (Linsky & Haisch, 1979). Therefore the detection of UV excess and/or X-ray emission has been proposed to be evidence of binarity. In particular, Ortiz & Guerrero (2016) and Sahai et al. (2022) proposed that AGB stars showing a far-UV counterpart (the so-called fuvAGB stars), large near-UV excess (i.e. , the observed-to-predicted near-UV flux ratio), or were most likely in a binary system. Similarly, AGB stars with X-ray counterparts (the so-called X-AGB stars) in excess of a few times erg s-1 (Soker & Kastner, 2003; Sahai et al., 2015; Ortiz & Guerrero, 2021) are most likely members of binary systems. So far about 40 fuvAGB stars (Sahai et al., 2008; Ortiz & Guerrero, 2016) and 50 X-AGB stars (Guerrero et al., 2024, and references therein) are known.
One of the most astounding far-UV and X-ray AGB star is Y Gem, a semi-regular SRb variable showing a visual magnitude between 10.4 and 12.3 within a period of 160 d (Samus et al., 2017). The detection of strong far-UV emission (Sahai et al., 2008) was soon followed by the discovery of variable UV and strong and variable X-ray emission (Sahai et al., 2011, 2015; Ortiz & Guerrero, 2021) that were attributed to accretion onto a companion star or an accretion disk around it. Indeed the flickering of its UV continuum on timescales s strongly supports the presence of an active accretion disk around a companion star, whereas high-velocity absorption and emission components arise from a fast outflow and infalling material from the giant to the disk (Sahai et al., 2018).
| Start Time | Grating | Spec. range | Spec. Dispersion | Slit Width | Exp. Time | ||
|---|---|---|---|---|---|---|---|
| (UTC) | (Å) | (Å) | (Å) | (arcsec) | (s) | ||
| 2024-02-17T21:36 | R1200B | 4050 | 3200 – 4120 | 0.48 | 1.055 | 4220 | 5120 |
| 2024-02-17T21:56 | R1200B | 4950 | 4130 – 5640 | 0.48 | 1.055 | 5430 | 580 |
| 2024-02-16T22:52 | R1200V | 5850 | 5650 – 6180 | 0.48 | 1.055 | 6960 | 550 |
| 2024-02-16T22:38 | R1200V | 6750 | 6170 – 7320 | 0.48 | 1.055 | 8790 | 550 |
| 2024-02-16T22:24 | R1200V | 7650 | 7320 – 8290 | 0.48 | 1.055 | 9660 | 550 |
The nature of the companion star of Y Gem, however, is disputed. Sahai et al. (2018) favored a main-sequence companion based on the amount of its UV excess, the relatively low outflow velocity, and the lack of narrow-band optical emission lines typical of symbiotic stars (SySts), e.g., H i, He ii, and [O iii] (see also Sahai et al., 2011). The X-ray and UV properties of Y Gem have also been used to suggest that Y Gem is actually a SySt (Yu et al., 2022), where a WD in a wide binary orbit accretes material from a cool giant companion, an AGB star in this particular case, in the wind Roche-lobe overflow scenario. Furthermore, the strong X-ray variability and the unambiguous presence of the 6.4 keV Fe fluorescent emission line is strong evidence of X-ray photon reflection from material in the vicinity of the accreting WD companion (e.g., Eze, 2014; Toalá, 2024), but this important observational fact has been overlooked in previous studies of Y Gem.
The confirmation of Y Gem as a SySt (and thus as a binary system with an accreting WD, see Munari, 2019, for a recent review on the properties of SySts) would help clarify the nature of other AGB stars with far-UV and/or X-ray emission suggested to belong to binary systems (e.g., Ortiz et al., 2019). Despite the statement on the lack of optical forbidden line emission in the optical spectrum of Y Gem by Sahai et al. (2018), actually there is no available optical spectra of this star. Furthermore, the X-ray spectral analysis presented by Yu et al. (2022) assumed ad hoc Gaussian lines to fit the Fe lines at 6.4, 6.7, and 6.97 keV, but these lines can be used to derive critical information on the physical properties of the accretion onto the disk around the companion star.
This paper presents the first ever optical spectrum of Y Gem and an in-depth analysis of publicly available visual photometry (light curve), UV, and X-ray observations to fill these gaps. The optical spectrum has been used to search for the typical spectral features expected in SySts, including the broad absorption features of C2, CN, VO, and TiO, among many others, from the photosphere of the AGB (Lançon & Wood, 2000), as well as the narrow emission lines of H i, He ii, and other species in a wide range of ionization stages caused by the strong UV flux of the hot companion (Munari, 2019; Akras et al., 2019). The analysis of the visual light curve help us peer into the orbital properties of this binary system. The X-ray spectral properties and variability of Y Gem are modeled using consistent reflection physical models developed for X-ray-emitting SySts to infer the properties of the accretion disk, including its inclination with the line of sight and accretion rate.
The photo-geometric distance to Y Gem derived by Bailer-Jones et al. (2021) using Gaia DR3 astrometry (Gaia Collaboration et al., 2023) is pc. We note that the values of the goodness-of-fit statistic and RUWE, assessing the quality of the astrometric solution, suggest potential issues for Y Gem. These may arise due to binarity, which is highly probable for Y Gem, and to variations of the photocenter position caused by the inhomogeneity of the star surface, since the angular diameter of a giant star at this distance would be significantly larger than the parallax itself. The latter effects are, however, expected to be small (Béguin et al., 2024). Since a previous estimate based on the absolute magnitude of late-M semi-regular stars provides a value for its distance of 580 pc (Sahai et al., 2011), only a 10 per cent smaller and within of the Gaia distance, the latter can be considered reliable and will be adopted throughout the paper.
The paper is organized as follows. In Section 2 we describe the observations used in the present work and their corresponding analysis. In Sections 3 and 4 we present the results derived from the analysis of the data and the discussion, respectively. Finally, we present our conclusions in Section 5.
2 Observations and data reduction
2.1 Optical spectroscopy
Optical spectra of Y Gem were obtained with the Intermediate-Dispersion Spectrograph (IDS) at the 2.54 m Isaac Newton Telescope (INT) of the Observatorio de El Roque de los Muchachos (ORM, La Palma, Spain) on 2024 February 16 and 17. The 235 mm camera and the EEV10 40962048 CCD were used, resulting the CCD pixel size of 13.5 m in a spatial scale of 0.40 arcsec pixel-1. The high-dispersion R1200B and R1200V gratings were used to make easier the detection of narrow emission lines and SySt spectral features against the bright stellar continuum of Y Gem. The gratings were tilted to different central wavelengths to cover the spectral range from 3200 to 8290 Å. Table 1 provides the details of the different setups, including central wavelength (), spectral range, spectral dispersion, slit width, and spectral resolution ().
| Instrument | Obs. ID. | Observation date | Epoch | Exp. Time | Useful time | Net count rate |
| (UTC) | (yr) | (ks) | (ks) | (cnt ks-1) | ||
| Chandra ACIS-S | 15714 | 2013-12-15T08:58:59 | 2013.96 | 10.34 | 10.34 | 1124 |
| Chandra ACIS-S | 16683 | 2014-11-04T07:22:10 | 2014.84 | 9.84 | 9.84 | 903 |
| XMM-Newton EPIC-pn | 0720340201 | 2014-03-31T05:25:26 | 2014.25 | 7.47 | 2.54 | 60316 |
| XMM-Newton EPIC-pn | 0763050201 | 2015-09-29T01:52:04 | 2015.74 | 16.74 | 11.77 | 1404 |
| XMM-Newton EPIC-pn | 0763050301 | 2015-10-01T01:28:17 | 2015.75 | 16.94 | 14.93 | 1003 |
| XMM-Newton EPIC-pn | 0763050401 | 2015-10-23T00:46:36 | 2015.81 | 13.24 | 9.00 | 1805 |
Five exposures of Y Gem were obtained for each spectral setup with the slit oriented along the parallactic angle. Observations of the spectro-photometric standard stars GJ 246 and HD 19445, were obtained immediately after the R1200V and R1200B observations of Y Gem, respectively. The seeing during the observations varied between 2.3 and 3.7′′ and the sky transparency was photometric.
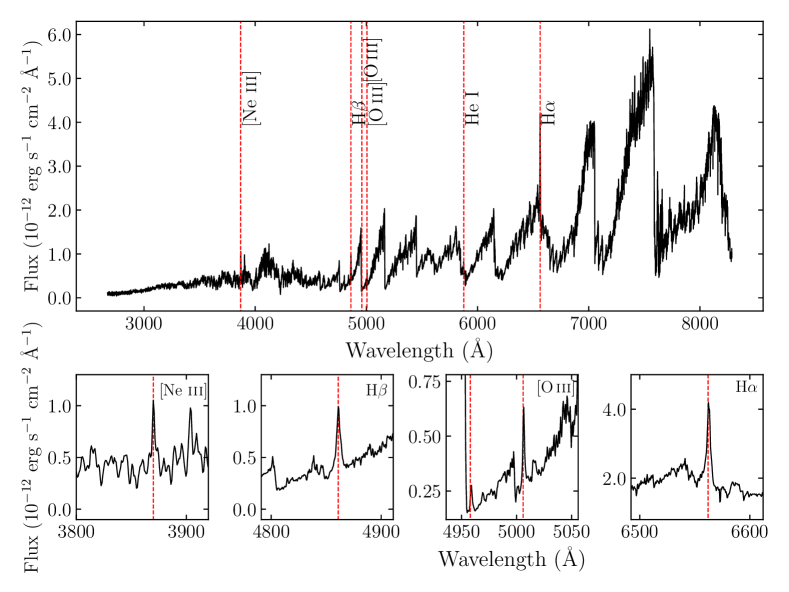
The spectral optical data were processed using standard iraf routines (Tody, 1993). The individual exposures were combined to remove cosmic rays and the bias level subsequently removed. The 2D spectra were then corrected of flat-field using suitable exposures of a tungsten lamp, and corrected of geometrical distortions and wavelength calibrated using Cu-Ar and Cu-Ne arc lamps. One-dimensional spectra were then extracted and flux-calibrated using the spectra of GJ 246 HD 19445 for the R1200V and R1200B gratings, respectively. We note that the IDS optics produce notorious vignetting effects at both extremes of the spectra, reducing the effective spectral coverage (see Table 1 for details). The combined spectrum of Y Gem in the 3200 to 8200 Å spectral range is presented in Figure 1.
2.2 X-ray data
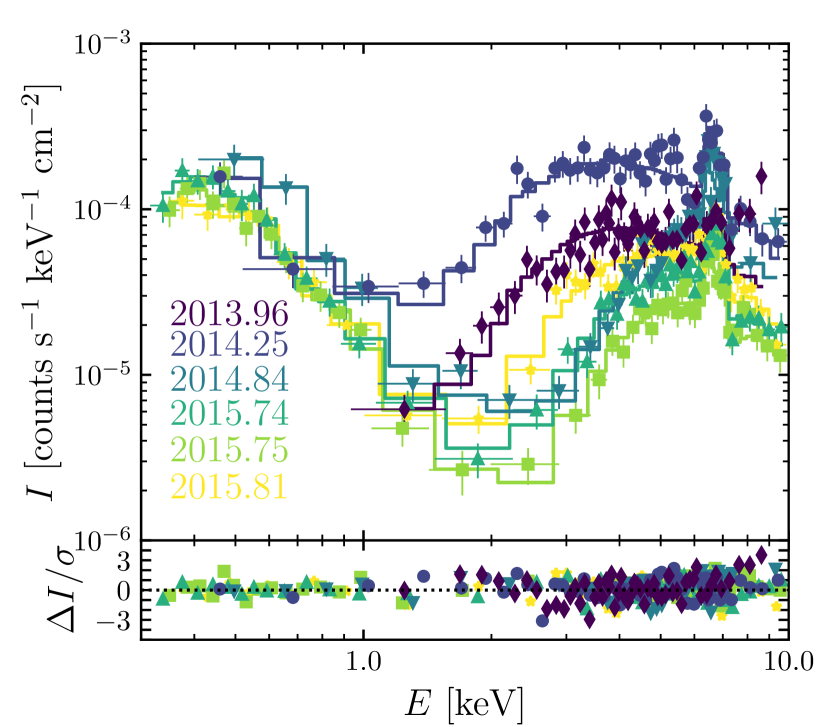
Y Gem has been observed in several occasions with Chandra and XMM-Newton, allowing monitoring its extreme variations in the 0.3–10.0 X-ray band (e.g., Ortiz & Guerrero, 2021; Sahai et al., 2011, 2015; Yu et al., 2022). The details of the observations used here are presented in Table 2.
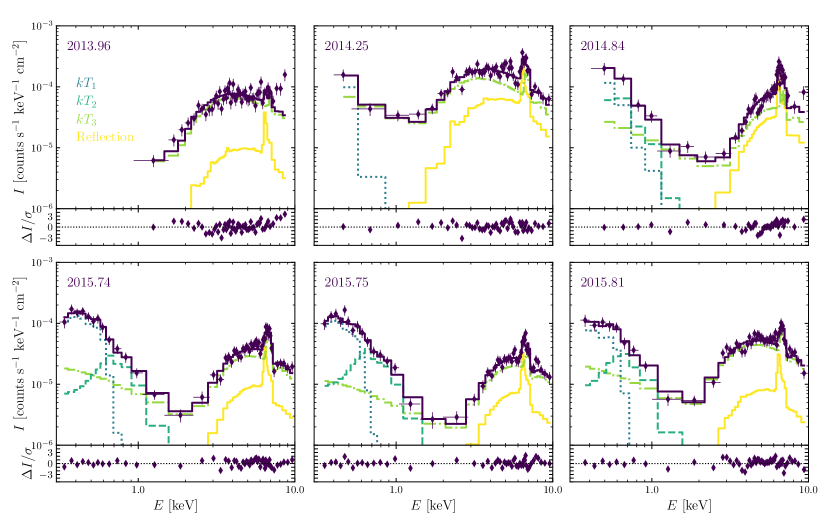
Publicly available Chandra observations of Y Gem (see Tab. 2) were retrieved from the Chandra Data Archive333https://cda.harvard.edu/chaser/. The data were obtained with the Advanced CCD Imaging Spectrometer (ACIS)-S on 2013 Dec 15 (2013.96) and 2014 Nov 4 (2014.84) and correspond to the Obs. IDs. 15714 and 16683, respectively. These data were processed using standard procedures with the Chandra Interactive Analysis of Observations (CIAO) package (Fruscione et al., 2006) version 4.14. Spectra were extracted using the CIAO tasks specextract defining a circular region of 8′′ in radius at the position of Y Gem. This task simultaneously creates the RMF and ARF calibration matrices. The background-subtracted ACIS-S spectrum of the 2013.96 and 2014.84 Chandra epochs are presented in Fig. 2. These were required to have a minimum of 20 counts per bin.
Y Gem has been also observed by XMM-Newton (see Tab. 2) with the European Photon Imaging Camera (EPIC) on four different epochs: 2014 Mar 31 (2014.25), 2015 Sep 29 (2015.74), 2015 Oct 1 (2015.75), and 2015 Oct 23 (2015.81). The observation data files were retrieved from the XMM-Newton Science Archive444https://nxsa.esac.esa.int/nxsa-web/\#search. We processed the EPIC data using the Science Analysis Software (SAS; Gabriel et al., 2004) version 20.0 with the most updated calibration matrices as of 2024 Jun 28. The event files were generated using the epproc and emproc SAS tasks. Source spectra were extracted by defining a circular aperture on the position of Y Gem with a radius of 30′′. The background was extracted from a region in the vicinity with no contribution from any other source. The calibration matrices were produced with the SAS tasks rmfgen and arfgen. The background-subtracted EPIC-pn spectra of Y Gem are also presented in Fig. 2, which were required to have a minimum of 30 counts per bin. We note that given their superior effective area compared to those of the MOS instruments, only the EPIC-pn data will be used for analysis.
2.3 UV spectra
For discussion, we complement our analysis with publicly available UV spectra of Y Gem obtained with the Space Telescope Imaging Spectrograph (STIS) on board the Hubble Space Telescope (HST). The UV spectra were retrieved from the Hubble Legacy Archive555https://hla.stsci.edu/. They correspond to proposal 14713 (PI: R. Sahai) and were obtained with grisms G140L and G230L that together cover the 1120–3200 Å wavelength range. The source was observed at two different epochs on October 2016 and April 2017, but its greater brightness on the second epoch prevented the reliable flux calibration of the spectrum (Sahai et al., 2018). After inspecting the spectra, we confirm this issue, limiting the analysis to those obtained on 2016 Oct 11-12. These correspond to total exposure times of 1728.08 s and 1606.81 s for the G140L and G230L grisms, respectively. To produce single G140L and G230L spectra we averaged the available spectra.
2.4 Optical photometry
To assess the variability of Y Gem we retrieved the visual magnitude ( Å) photometric data from the American Association of Variable Star Observers666https://www.aavso.org/ (AAVSO) and the and magnitudes of the All Sky Automated Survey for SuperNovae777http://asas-sn.ifa.hawaii.edu/skypatrol (ASAS-SN, Shappee et al., 2014; Hart et al., 2023). The AAVSO data cover the period from epoch 1938.01 to 2024.21, spanning a total of 86.2 years, whereas the ASAS-SN data cover a much shorter period of 11 years, from late 2013 to mid 2024. Although the AAVSO visual magnitud data do not include uncertainties, it provides the largest baseline among available photometric measurements, including the ASAS-SN and the AAVSO Photometric All-Sky Survey (APASS).
3 Analysis and Results
3.1 Optical properties of Y Gem
The INT IDS optical spectrum of Y Gem presented in Fig. 1 shows a number of prominent saw-shaped spectral profiles in the spectral range redwards of 4500 Å. These are characteristics of late-type giant stars, associated with absorption bands of CaH, VO, and TiO, among others. On the other hand there is a number of narrow emission lines corresponding to the H, H, [Ne iii] 3889 Å, and [O iii] 4959,5007 Å emission lines (see bottom panels of Fig. 1), a tentative detection of He i 5876 Å, and an unidentified narrow emission line at 4777 Å. These emission lines, particularly the [Ne iii] and [O iii] emission lines, are indicative of the presence of an ionizing source.
The optical spectrum of Y Gem does not fulfill a number of typical criteria used to classify a source as a SySt, such as the presence of (i) strong He ii 4686 Å and emission lines from high-excitation ions (e.g., [Fe vii] 5727,6087 Å), (ii) absorption features TiO 6180,7100 Å and VO 7865 Å, and (iii) O vi Raman-scattered lines at 6830 and 7088 Å (e.g. Mikolajewska et al., 1997; Belczyński et al., 2000). Some of these features might be absent in SySts, with 19%, 50%, and up to 61% confirmed SySts in the New Online Database of Symbiotic Variables888https://sirrah.troja.mff.cuni.cz/merc/nodsv/ (Merc et al., 2019) lacking He ii, O vi Raman-scattered, and [Fe vii] lines, respectively. It must be noted in particular that a SySt hosting a low temperature WD cannot produce the He ii emission line, whose ionization potential is 54.4 eV, much less the Raman-scattered O vi lines, which requires a higher ionization potential of 113.9 eV. Thus, although the detection of Raman-scattered lines at 6830 and 7088 Å is sufficient for a SySt classification (Schmid, 1989), it is not necessary. Less restrictive classification schemes based on the presence of late-type giant features and strong emission lines of H i, He i, and others from species with ionization potentials higher than 35 eV (e.g., [O iii]) have been proposed by several authors (Belczyński et al., 2000; Miszalski et al., 2013; Merc et al., 2021). Y Gem does fulfill these criteria, which might be the case as well for a missing population of low-acretion-rate SySts or systems without shell-burning that are expected to have weak emission lines (e.g., Mukai et al., 2016; Munari et al., 2021; Xu et al., 2024).
| Line | Flux |
|---|---|
| (erg cm-2 s-1) | |
| Ne iii] 3869 | 1.63 |
| ? 4777 Å | 4.17 |
| H 4861 | 2.70 |
| O iii] 4959 | 2.43 |
| O iii] 5007 | 7.32 |
| He i 5876 | 4.95: |
| H 6563 | 1.02 |
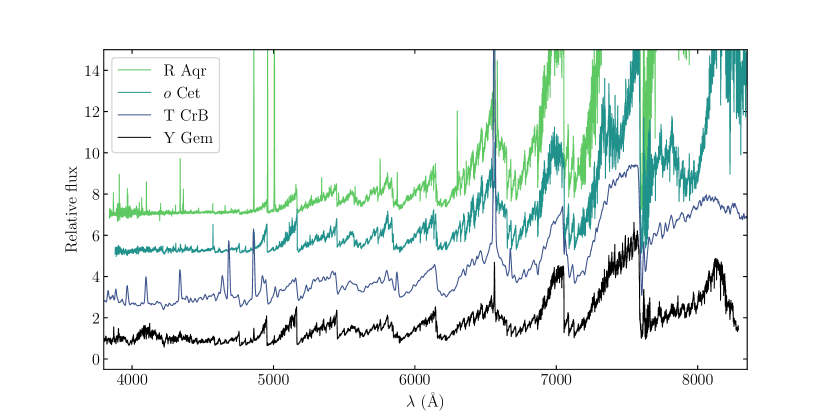
At any rate, the shape of the spectral continuum of Y Gem and the presence of H i and forbidden emission lines make its optical spectrum similar to that of typical SySts. This is illustrated in Fig. 3, which compares the optical spectra of Y Gem together with those of the iconic SySts R Aqr, Cet, and T CrB obtained from the ARAS spectral database of eruptive stars (Teyssier, 2019)101010See also https://aras-database.github.io/database/index.html. The similarities in the saw-shaped spectral profiles are quite notorious, while the intensity of the emission lines with respect to the stellar continua varies notably among these different sources and among different observing epochs. We particularly note that none of the objects shown in Fig. 3 exhibit the Raman-scattered O vi emission lines.
The fluxes of the emission lines detected in the spectrum of Y Gem are reported in Table 3. The full-width at half maximum (FWHM) of the forbidden emission lines is 2 Å, comparable to the instrumental FWHM. On the contrary, the FWHM of the Balmer lines is wider, 4.1 Å. Adopting recombination Case B, the observed H to H line ratio 3.8 derived from the flux values listed in Table 3 implies an extinction value of (BV) = 0.26 mag, that is, =0.80 mag. The interstellar reddening towards Y Gem is, however, much smaller, (BV) mag111111 The interstellar extinction vs. distance curve towards Y Gem provided by Bayestar19 (http://argonaut.skymaps.info, Green et al., 2018) is quite shallow, with values of between 0.02 and 0.06 mag over a wide range of distances around the Gaia distance of 644 pc. This results in an average value for (BV) mag according to the conversion from to provided by Schlafly & Finkbeiner (2011). (or 0.12 mag). A possible explanation is self-absorption of the Balmer lines, which is very likely in the high-density H i-emitting regions of SySts, particularly in those of the S-type. This results in high values of the intrinsic H to H line ratio, producing spurious high extinction values. The observed H to H line ratio in Y Gem, if caused by self-absorption, implies relatively low values of the H optical depth, (Netzer, 1975). To conclude, either the observed H to H line ratio is affected by a mild self-absorption, or the circumstellar material around Y Gem reddens the emission arising from the H i-emitting zone.
3.2 Light curve analysis
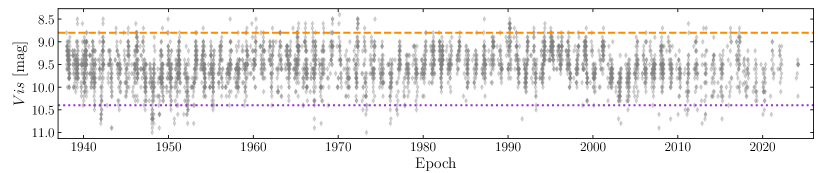
The AAVSO dataset provides the most extended baseline to identify both short- and long-term periodic signals that could eventually provide additional evidence of binarity with periods from a few months to decades. The 86.2 yr light curve in the visual band of Y Gem based on the AAVSO photometric measurements is presented in Fig. 4. The minimum and maximum magnitudes, defined by the 2.5th and 97.5th percentiles are 8.8 mag and 10.4 mag, respectively. The light curve amplitude would be 1.6 mag, which indicates that the cold component of Y Gem is not a Mira-type star, but a semi-regular (SR) variable (see, e.g., Samus et al., 2017).
Fig. 5 shows the resultant power spectrum (PS) of the period distribution derived from applying the Lomb-Scargle method (Lomb, 1976; Scargle, 1982) to the light curve in Fig. 4. Up to six significant discrete periods can be identified in this figure, all of them above the (blue) dashed line that marks the power threshold probability of 0.05 necessary for a peak (period) to be confidently classified as a signal. The peaks at periods d and d are considered spurious. The former corresponds to a signal originating from periodic observational gaps, which achieves significant power due to the extensive sampling, whereas the later is assumed to be an artifact signal due to the Earth’s orbital period, which has already been identified in studies of long period variable (LPV) stars (see, e.g., Fraser et al., 2008).
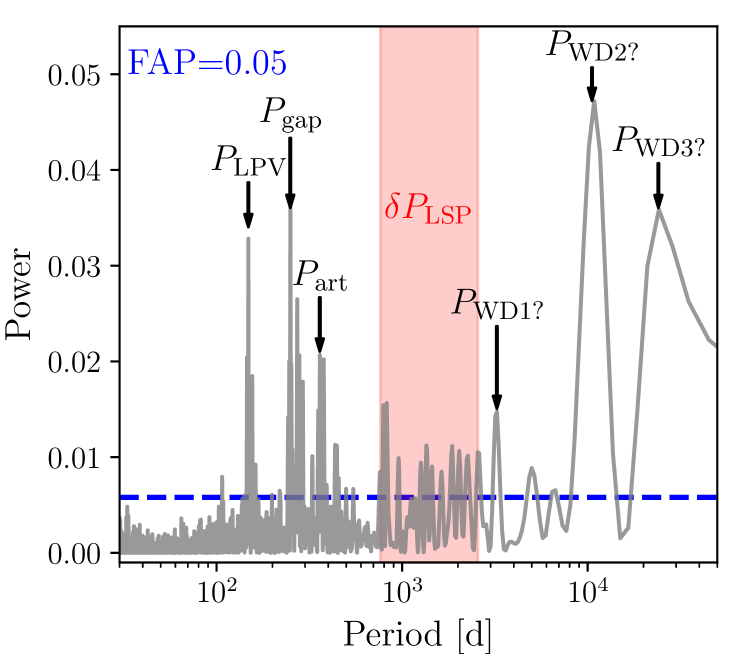
To confirm that the other four discrete peaks in the PS are real, the period-folded AAVSO light curves are shown in Fig. 6 phased with the periods of the four additional peaks at 148.4 d and 8.9, 28.9, and 65.9 yr. To represent the phased light curves, kernel density estimation (see e.g., Parzen, 1962) were used to better visualize the scatter of magnitudes when phased. The models derived from the Lomb-Scargle analysis with the identified periods are also displayed, supporting that these periods indeed correspond to true signal as models (white dashed lines) follow regions with higher density of points.
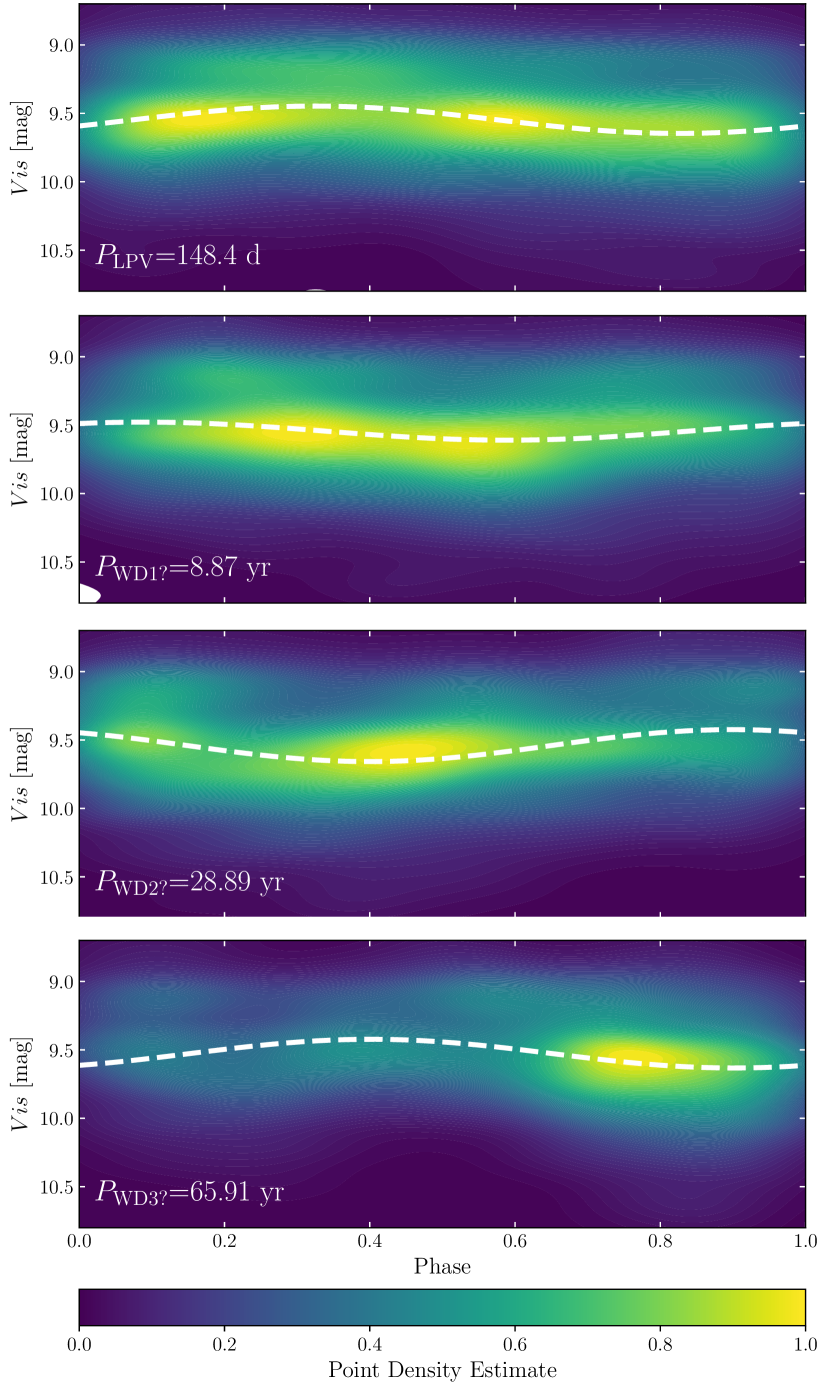
The shortest of these periods at d can be interpreted as the pulsation of the LPV M-type star in Y Gem. This period, that will be referred as , is consistent with the value of 160 days reported by Samus et al. (2017). The PS shows then a group of peaks in the 760 to 2570 d range, referred as , that can be associated with the long secondary period (LSP), a phenomenon present in of LPVs with values 5 to 10 times larger than the primary pulsation mode of the LPV (Olivier & Wood, 2003; Wood et al., 2004). To date, the mechanism that causes LSPs remains unknown (Pawlak, 2021). Multiple periods in SR variables are common and normally interpreted as the result of the simultaneous operation of fundamental and overtone pulsation modes (Kiss, 1999), but their typical period ratio () are much smaller than that of the LSPs observed in Y Gem.
It is worth mentioning that the , , and are recovered in the analysis of the (shorter baseline, 11 yr) photometric measurements provided by ASAS-SN. Indeed the combined analysis of the and ASAS-SN light curves of Y Gem using the Multiband Lomb-Scargle Periodogram method (VanderPlas & Ivezić, 2015) of the LombScargleMultiband module of the Python gatspy library 121212https://www.astroml.org/gatspy/periodic/lomb_scargle_multiband.html finds these three peaks with period values of d, d, and d, the latter thus in the range from 1130 to 2570 d.
The longest periods in the AAVSO data correspond to a several years and even a few decades. Such long periods, amounting up to several years, have been observed in at least one third of the pulsating variables, such as Mira- or SR-type. These are generally attributed to the existence of a low-mass secondary companion (Soszyński et al., 2021) as circumstellar dust matter orbiting the system is asymmetrically distributed in a disk that periodically absorbs a part of the radiation emitted by the primary star and re-emits it in the infrared (Wood & Nicholls, 2009). The shortest of these periods, at years, is indeed in the period range from 8.7 to 12.9 yr estimated for the orbit of the WD companion by Yu et al. (2022). Thus it will be referred as .
The periodogram also reveals another two even longer period peaks denoted as and . The first, yr, is the peak with the highest power, whereas the next is found at 65.9 yr (with a lower limit of 51.6 yr). These can be resonance frequencies of , but it shall be noted that SySts such as R Aqr or Cet show somehow similar long periods of 42.2 (Alcolea et al., 2023) and 500 years (Prieur et al., 2002), respectively. Alternatively similar long periods of around 30 years have been attributed to a magnetic activity cycle, like the 11 year cycle of the Sun, but for evolved stars (see e.g., V694 Mon, Leibowitz & Formiggini, 2015). This opens the possibility that the long and periods of Y Gem may be associated either with the magnetic activity of the giant component of Y Gem or to the orbit of its putative WD companion. However, such long orbital periods would produce less efficient mass accretion process (e.g., Tejeda & Toalá, 2024).
3.3 Reflection physics in Y Gem
As shown by previous authors, Y Gem has exhibited dramatic spectral changes in the 0.3–10.0 keV X-ray band (see Fig. 2; e.g., Sahai et al., 2011, 2015; Ortiz & Guerrero, 2021; Yu et al., 2022). Y Gem initially exhibited a -type X-ray spectrum, which according to the classification scheme defined for X-ray SySts (see Mürset et al., 1997; Luna et al., 2013) are the sources characterized by a heavily-extinguished hot plasma with most emission at energies above 2 keV. All the other epochs exhibit the clear presence of such extinguished plasma with an additional soft spectral contribution in the 0.3–2.0 keV energy range, which is the signature of -type objects (see Fig. 2). SySts are known to evolve from one type to another, particularly, those of the -type often evolve into -type objects (e.g., Lucy et al., 2020; Toalá et al., 2024).
| Parameter | Units | 2013.96 | 2014.25 | 2014.84 | 2015.74 | 2015.75 | 2015.81 |
|---|---|---|---|---|---|---|---|
| /DoF | 83.39/50=1.67 | 54.01/43=1.25 | 170.66/161=1.06 | 170.66/161=1.06 | 170.66/161=1.06 | 170.66/161=1.06 | |
| 1022 cm-2 | … | 0.10.08 | 0.420.23 | 0.500.08 | 0.510.07 | 0.410.14 | |
| keV | … | 0.030.01 | 0.090.04 | 0.040.01 | 0.030.01 | 0.040.01 | |
| cm-5 | … | 14.10.2 | (5.72.2) | 34.62.9 | 72.46.9 | 1.80.3 | |
| erg cm-2 s-1 | … | (3.50.4) | (3.81.4) | (2.80.3) | (2.30.2) | (1.90.3) | |
| erg cm-2 s-1 | … | (5.30.1) | (1.90.8) | (1.60.1) | (1.80.2) | (2.40.4) | |
| keV | … | … | 0.160.01 | 0.210.01 | 0.200.02 | 0.200.01 | |
| cm-5 | … | … | (5.55.2) | (1.50.8) | (2.41.0) | (1.30.8) | |
| erg cm-2 s-1 | … | … | (3.63.4) | (1.50.8) | (1.80.7) | (1.51.3) | |
| erg cm-2 s-1 | … | … | (6.46.3) | (3.11.6) | (4.71.8) | (2.51.5) | |
| 1022 cm-2 | 7.50.6 | 5.60.6 | 37.88.2 | 19.71.22 | 24.81.8 | 12.70.8 | |
| CF | 0.990 | 0.9800.10 | 0.9900.003 | 0.9900.002 | 0.9900.003 | 0.9900.002 | |
| keV | 29.315.3 | 10.5 1.9 | 15.34.4 | 10.01.1 | 16.94.0 | 11.31.4 | |
| cm-5 | (3.40.4) | (5.80.9) | (5.60.6) | (2.70.3) | (1.90.2) | (3.10.2) | |
| erg cm-2 s-1 | (3.30.4) | (6.10.9) | (2.50.3) | (1.70.2) | (1.10.1) | (2.40.2) | |
| erg cm-2 s-1 | (6.80.8) | (1.20.2) | (1.20.1) | (5.70.7) | (4.10.3) | (6.60.5) | |
| Reflection | |||||||
| cm-5 | 1.100.5 | 6.61.2 | 7.01.1 | 1.50.3 | 1.40.3 | 1.10.3 | |
| erg cm-2 s-1 | (5.42.2) | (3.50.6) | (1.80.3) | (5.40.8) | (4.11.1) | (4.61.2) | |
| erg cm-2 s-1 | (7.53.7) | (4.50.7) | (4.70.7) | (1.00.2) | (9.12.3) | (7.51.9) | |
| erg cm-2 s-1 | (3.90.6) | (9.81.5) | (4.40.6) | (2.20.4) | (1.60.2) | (2.90.3) | |
| erg cm-2 s-1 | (7.51.2) | (2.20.2) | (1.90.2) | (1.60.1) | (1.90.1) | (3.20.5) | |
| erg s-1 | (3.70.6) | (1.10.1) | (9.41.6) | (7.90.5) | (9.30.5) | (1.60.3) |
After corroborating that the X-ray emission of Y Gem is consistent with that of a SySt, we can improve our understanding of the production of X-rays from this binary system. We particularly note that using a Gaussian profile to fit the Fe fluorescent line at 6.4 keV is a simplistic observational approximation with no basis on physically-motivated models. Toalá et al. (2023, 2024) recently demonstrated that a considerably fraction of the total observed flux (and luminosity) from the -type SySts CH Cyg and T CrB is originated from jet-like components and reflection at the accretion disk and material in the vicinity of the accreting WD component. Dissecting the flux from each component provides a tool to improve our estimation of the mass accretion rate (see Section 4).
The X-ray spectra of Y Gem were thus modeled making use of the X-ray spectral fitting package XSPEC (version 12.12.1; Arnaud, 1996). Following previous analysis of the X-ray emission from this source (see Yu et al., 2022, and references therein) we require the presence of two soft components with a relatively low hydrogen column density () in addition to the heavily-extinguished plasma component. The optically-thin emission plasma apec model included in XSPEC141414http://astroa.physics.metu.edu.tr/MANUALS/xspec12_html/XSmodelApec.html was adopted for these spectral components. The extinction produced by the hydrogen column density is included by adopting the X-ray absorption model tbabs (Wilms et al., 2000) also included in XSPEC. Abundances were fixed to Solar values (Lodders et al., 2009).
Tailor-made reflection models were then calculated using the Stellar Kinematics Including Radiative Transfer (SKIRT; version 9.0; Camps & Baes, 2020) code, which has been recently extended to include the treatment of X-ray photons. This version of SKIRT includes the effects of Compton scattering on free electrons, photoabsorption, and fluorescence by cold atomic gas, scattering on bound electrons, and extinction by dust (Vander Meulen et al., 2023). We adopted flared disk density distributions characterized by an averaged column density , outer radius , and inclination angle , where is the pole-on line of sight of the SySt orbital plane and corresponds to an edge-on view. The disk is assumed to have a fixed temperature of 104 K with an inner radius of 8000 km (=5.4 AU). Different opening angle values between =10 and 30∘ were explored, but they did not produce strong differences and thus we decided to adopt a fixed value of .
Up to 378 SKIRT models were produced covering the =[] cm-2 and =[0.3, 0.5, 1.0, 1.25, 3.0, 5.0] AU values. For each disk model we created spectral energy distributions (SED) adopting viewing angles between and , with steps of . All 378 models were converted to additive tables using the HEASoft task ftflx2tab. These were then used as one-parameter model components into XSPEC. All these components will be referred as reflection models in the following. We note here that the radius of the reflecting component is intended to simulate the presence of the accretion disk and the densest material in its vicinity (e.g., Lee et al., 2022). For instance, a similar analysis of T CrB suggests that the best reflecting disk structure in this symbiotic recurrent nova has a radius of =1.0 AU (Toalá et al., 2024), which is a factor of larger than the accretion disk reported by Zamanov et al. (2024).
An automatic procedure using python routines was performed in XSPEC, adopting models of the form:
| (1) |
where CF is a covering factor that helps mimicking the non-uniform distribution of material around the accreting WD. The best models were assessed by comparing them with the observations and calculating the reduced statistics ().
As a first attempt we performed a conjoint fit to all epochs by allowing all parameters to vary freely. However, this approach did not result in a consistent single disk model able to produce good quality fits (). The most problematic epochs are those corresponding to 2013.96 and 2014.25. Thus, we started by producing a single joint fit to the 2014.84, 2015.74, 2015.75, and 2015.81 epochs, that resulted in a best fit model () for a disk model with cm2, =1.25 AU, and a viewing angle . Using this reflecting disk model we performed individual fits to the 2013.96 and 2014.25 epochs, which also resulted in acceptable fit qualities ( equal to 1.67 and 1.25, respectively.
The details of the best-fit models for all X-ray epochs are listed in Table 4. This table lists the total observed () and intrinsic () fluxes corresponding to the 0.3–10.0 keV energy range, as well as the contribution from each component. The total luminosities () were computed adopting a distance of =644 pc.
As expected, the 2013.96 epoch did not require any soft component to produce a good model. Similarly the 2014.25 epoch only required one single thermal component to fit the soft X-ray range. The best-fits models of all epochs are also compared with the background-subtracted spectra in Fig. 2 and their details are further illustrated in Fig. 7.
It is important to remark here that, in some epochs, the estimated flux of the reflection component () is of the same order of magnitude of that of the plasma temperature expected from the boundary layer between the accretion disk and the surface of the WD (). The later confirms the indisputably important role of the reflection component in X-ray-emitting SySts.
4 Discussion
4.1 The stellar components of Y Gem
The optical spectrum of Y Gem exhibits features of a cool star, but it also shows forbidden and H i recombination emission lines. The forbidden emission lines of [Ne iii] and [O iii] particularly suggest the presence of a hot companion, with K. The optical spectrum of Y Gem is notably similar to that of the iconic SySts R Aqr, T CrB, and Cet. Thus, although some features typical of SySts are missing in the optical spectrum of Y Gem, such as the He ii and O vi Raman-scattering emission lines, it certainly supports a SySt nature. To peer into the properties of the hot and cool components of Y Gem, their possible contributions to its spectrum need to be disentangled.
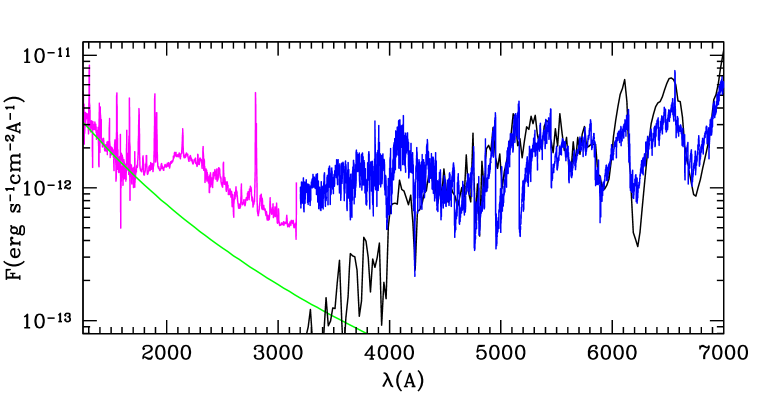
The multi-wavelength spectra of Y Gem are presented in Fig. 8, including the UV spectrum obtained with HST STIS (1100–3200 Å) and the optical INT IDS spectrum151515It must be noted that Y Gem is highly variable, particularly in the UV domain (Sahai et al., 2011), thus its multi-wavelength spectrum in Fig. 8 may be not representative of its average emission.. The spectra have been corrected from extinction using Cardelli’s extinction law161616Cardelli’s extinction law is only valid above 1250 Å, thus the bluest region of the HST STIS G140L spectrum is not be considered for subsequent analyses. (Cardelli et al., 1989) adopting the color excess (BV)=0.26 mag (or =0.80 mag) corresponding to the value of extinction derived from the Balmer line ratio in the optical INT IDS spectrum.
Fig. 8 confirms that the red spectral region of Y Gem mostly presents emission from a cool, late-type component. Its spectral type can be estimated from its observed color of 8.0 mag (Høg et al., 2000; Cutri et al., 2003). A total extinction (i.e. circumstellar plus interstellar) between implies a dereddened , which corresponds to (K) , and spectral type M57 ii, depending on the spectro-photometric calibration adopted (Ridgway et al., 1980; di Benedetto, 1993; Perrin et al., 1998; Pickles, 1998), even though the stellar variability can widen the intervals above.
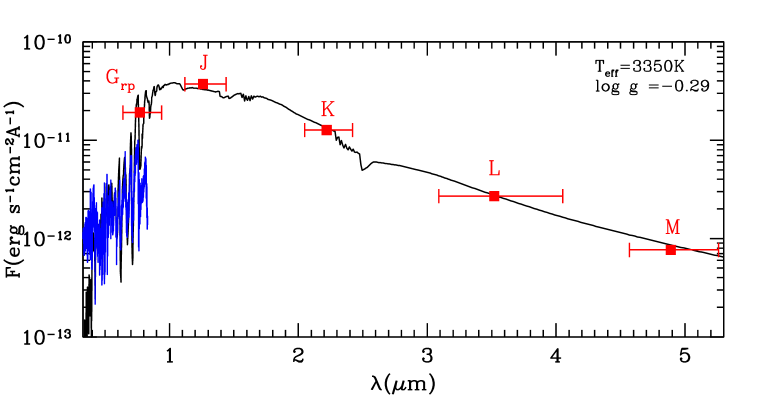
To refine the spectral classification of the cool component of Y Gem, its INT IDS optical spectrum in the range from 6300 Å to 8300 Å, which is expected to be dominated by the cool component, was subsequently compared with the library of synthetic spectra provided by Lejeune et al. (1997) for a wide range of stellar parameters based on the atmosphere models by Bessell et al. (1989), Fluks et al. (1994), and Allard & Hauschildt (1995). Available broadband photometry of Y Gem provided by the multi-epoch monitoring DIRBE () and Gaia (the band centered at 7830 Å) was also used in this comparison. Following the results implied from its intrinsic color, the search focused on models of late-type giant stars (, 3000 K 3500 K) and solar metallicity.
The grid of stellar models of Lejeune et al. (1997) provides the flux density (in units of erg s-1 cm-2 Å -1) at the stellar surface for values of stellar temperature and gravity spaced in intervals of 150–200 K and dex, respectively. Like in Ortiz & Guerrero (2016), was firstly convolved with the filter band-passes (Hauser et al., 1998; Jordi et al., 2010) to obtain the surface flux relative to the filter:
| (2) |
Eventually, these flux densities were equally “scaled” (i.e. multiplied by a constant) in order to match the five extinction-corrected observed flux densities . The best-fit model corresponds to the smallest total residual error, calculated as the sum of the squared individual differences of the five bands. It was found that two models show similar total residuals, namely K, and K, , but the former solution can be discarded because it would imply a primary’s mass below , which is unlikely for a star at this evolutionary stage. At any rate there is a significant uncertainty in the stellar gravity (and consequently stellar mass) derived by the method because of the weak dependence of the stellar spectrum shape of stars like Y Gem. The synthetic spectrum is compared in Figs. 8 and 9 with the optical INT IDS spectrum and the available broadband extinction-corrected photometry, respectively. The best-fit temperature and gravity uncertainties are at least as large as the pace between adjacent models, i.e. K and 0.3 dex, respectively.
The integration of the best-fit “scaled” synthetic spectra over its full range (i.e. between 91 Å and 160 m) results in a flux of erg cm-2 s-1. At the distance of 644 pc, it corresponds to a luminosity of erg s-1 or . For comparison, the luminosity computed from its color index (Whitelock et al., 2000), would be , i.e. a difference from the luminosity derived from its best-fit spectrum, but within the expected uncertainty, considering its variability. The thermal-pulse evolutionary tracks calculated by Marigo et al. (1996) in the H-R diagram for these luminosities and K imply a main-sequence progenitor of 3 M⊙. The present-day stellar mass is smaller than this value because AGB stars lose a considerable part of its mass during the thermal-pulse phase. For example, theoretical models of late stellar evolution by Miller-Bertolami (2016) showed that a 3 M⊙ main-sequence star with solar metallicity reaches the post-AGB phase with a final mass M⊙.
As long as the present-day mass of Y Gem can be roughly estimated from its stellar gravity and radius (), and the latter can be determined from its stellar luminosity () and temperature ():
| (3) |
Assuming K and L we obtain R, and the mass corresponding to this radius and is 1.1 . These quantities do not depend strongly on the extinction, since an increment of 0.1 mag in would raise the stellar luminosity and radius by 4% and 1%, respectively.
Theoretical models establish a relationship between these stellar parameters and the pulsation mode of Mira- and SR-type variables (Ostlie & Cox, 1986; Wood, 1990). The predicted radius of an AGB star pulsating with period in the fundamental mode is:
| (4) |
whereas if the star pulsates in the first-overtone mode with period it is:
| (5) |
For a stellar mass of 1.1 M⊙ the stellar radius would be 165 and 245 R⊙ for the fundamental and first-overtone mode. Therefore, the stellar parameters of Y Gem obtained above points at it pulsating in the first overtone, like the SR variables in the LMC (Wood et al., 1999).
Meanwhile, the extinction-corrected HST STIS UV spectrum in Fig. 8 shows a notorious bluewards ramp starting at 1700 Å, which is suggestive of a hot stellar component. Fitting the slope of this far-UV spectrum with a blackbody requires a minimum temperature of K, which is in agreement with the detection of the [O iii] and [Ne iii] emission lines. Otherwise its cannot exceed significantly a value 54,000 K, as the He ii 4686 emission line is undetected in the optical spectrum. Therefore, a hot component with K seems to be a good trade-off between the far-UV spectral slope and the atomic species in the optical spectrum. The radius of such hot stellar component fitting the far-UV spectrum is 0.11 R⊙, which corresponds to 140 L⊙. We note that accreting WD are known to have much larger radii in comparison with the typical non-interacting WDs (e.g., Livio et al., 1989; Burgarella et al., 1992).
The non-detection of the He ii 4686 emission line seems to point at an effective temperature of the hot companion lower than 54,000 K. This requires a shallower far-UV ramp, which can be reconciled with the observed one if the extinction of equal to 0.8 mag used for its reddening correction were lower. This possibility cannot be neglected, since self-absorption of the Balmer lines, as discussed in Sect. 3.1, can mimic a higher extinction. For comparison, the HST STIS UV spectrum could be fitted by Sahai et al. (2018) without any reddening correction using two blackbody emission models with =35,000 K and =9400 K, respectively. The effective temperature of the hot companion is thus constrained to be in the range 35,000 K to 54,000 K.
It it worth mentioning that Sahai et al. (2018) concluded that the two stellar components required by their spectral fit should originate in an accretion disk. Moreover, they attributed blue absorptions of the Ly, N v, O i, Si iv, and C iv lines to an outflow and assigned the observed radial velocity to a escape velocity to suggest that the accreting star is a low-mass main sequence star. The presence of forbidden emission lines in the optical spectrum of Y Gem and its X-ray emission, however, supports a hot accreting WD companion. Otherwise our best-fit model of the reflecting properties of Y Gem implies an inclination of 50∘ with respect to the orbit of the binary system. The true velocity of the outflow can be as large as 1500 km s-1, after correcting the observed radial velocity km s-1 of the Ly line in the UV spectra of Y Gem (Sahai et al., 2018) from a tilt of the outflow of with the line of sight. Using the definition of the escape velocity
| (6) |
we found that a WD with a mass of 0.8 M⊙ (as estimated by Yu et al., 2022) and =0.11 R⊙ results in a very similar value of 1670 km s-1 for the escape velocity.
4.2 Mass accretion rate
We can assess the accretion disk luminosity by subtracting the contributions of the hot WD companion and the late M-type star from the UV and optical spectrum of Y Gem. This emission excess is estimated to be =28 L⊙.
Assuming that the accretion process produces a total accretion luminosity (), the mass accretion rate can be approximated as (see Shakura & Sunyaev, 1973; Pringle, 1981)
| (7) |
with as the radius of the WD component and, in our case, the best approximation for the accretion luminosity, i.e., .
At this point it is paramount to account for the appropriate X-ray luminosity. Our detailed modeling of the X-ray observations of Y Gem dissected different components contributing to its X-ray spectra. As found in other -type X-ray-emitting SySts (e.g., Lucy et al., 2020; Toalá et al., 2022), the soft X-ray emission (spectral fit components and ) of Y Gem very likely arises from adiabatically-shocked regions due to the high velocity and variable outflows in Y Gem (Sahai et al., 2018). In addition, the reflection component detected in all epochs is neither produced by the accretion process. Therefore only the heavily-extinguished plasma component, , typically associated with the plasma temperature of the boundary layer between the accretion disk and the surface of the WD, should be accounted in the computation of the accretion luminosity.
During the different X-ray observation epochs, the luminosity of the plasma component () ranged from 0.05 to 0.15 L⊙, thus, in order to estimate the mass accretion rate, we will adopt an averaged value of 0.12 L⊙ for the X-ray contribution. Using then Eq. (7) we estimate = 2.5 M⊙ yr-1 adopting a radius of 0.11 R⊙ estimated for the accreting WD in Y Gem and a mass of 0.8 M⊙. By comparing our estimate with theoretical predictions for accreting WDs, it seems that the WD component in Y Gem has reached the stable and steady burning phase described for a 0.8 M⊙ (Cassisi et al., 1998; Wolf et al., 2013), which seems to prevent a recurrent phase for this system.
4.3 Consequences of Y Gem as a SySt
The results discussed in the previous sections confirm the status of Y Gem as a SySt (Yu et al., 2022), instead of an AGB star with an accreting main-sequence companion (see Sahai et al., 2018, and references therein). We have further used the available and WISE mid-IR magnitudes to explore the classification trees and color-color diagrams presented by Akras et al. (2019). These confirm Y Gem to be consistent with a S-type SySt.
The properties of the accreting WD companion, however, are not well constrained. The recombination and forbidden emission lines detected in the optical spectrum constrain between 30,000 and 60,000 K, but the UV spectrum bluewards of 1700 Å requires to be 60,000 K. We note that in some cases, the optical spectra of SySts are extremely variable, with bright recombination lines in their spectra that completely disappear at different epochs (see for example the cases of NQ Gem and RT Cru in the ARAS Spectral Database). This might be the case of Y Gem as well, given its extraordinary UV and X-ray variability.
The multi-wavelength analysis of Y Gem presented here challenges our understanding of X-AGBs. It poses the question on whether all X-AGB systems are unidentified SySts or not. Guerrero et al. (2024) recently discussed these two populations by comparing their UV and X-ray properties. Both X-AGBs and SySts seem to share similar X-ray luminosity values with confirmed SySts having a typical value of =32.00.8, whilst for the distribution of so-called X-AGBs they found =30.60.8. Regardless of the evolution of the X-ray properties of Y Gem exhibited during the XMM-Newton and Chandra observations analyzed here, its total X-ray luminosity is definitely more consistent with the upper limit estimated for SySts. We used the HST STIS UV spectra of Y Gem to estimate its far-UV magnitude adopting the GALEX transmission curve and found it to be M[FUV]=1.63 mag. This places Y Gem as one of the brightest UV and X-ray SySts (see the compilation presented in figure 4 of Guerrero et al., 2024).
Guerrero et al. (2024) suggested that the lower X-ray luminosity range defined for X-AGBs seems to be powered by accreting main sequence stars, but this statement is challenged by Cet, a SySt in the locus of X-AGBs in the M[FUV] versus diagram. The low X-ray luminosity of Cet has been attributed to a low-accretion rate onto the WD resulting from a wide orbit with period 500 yr171717See the details of Cet in the New Online Database of Symbiotic Variables https://sirrah.troja.mff.cuni.cz/~merc/nodsv/stars/omi_cet.html, which might be the case of other X-ray weak SySts. It can be expected that future multi-wavelength studies of X-AGB stars will help unveiling unidentified X-ray-emitting SySts in the low-luminosity range of the X-ray regime.
Finally, the orbital parameters of the binary system formed by the late 1.1 M⊙ Y Gem and its 0.8 M⊙ WD companion can be assessed. Adopting the smallest possible period for the binary obtained from the AAVSO light curve analysis (=8.87 yr), the semi-major axis of the system results in AU for an effective Roche lobe radius of 2.2 AU. The Roche lobe is thus larger than the stellar radius of the primary component of 240 R⊙(=1.12 AU), i.e., the primary cannot fill its Roche lobe. This suggest the accretion mechanism in Y Gem to be through a Bondi-Hoyle-Lyttleton (BHL) scenario (Hoyle & Lyttleton, 1939; Bondi & Hoyle, 1944; Bondi, 1952) or the so-called wind Roche lobe overflow channel (e.g., Podsiadlowski & Mohamed, 2007). This is also the case for the other larger periods ( and ), which imply larger orbital separations (11.7 and 20.3 AU).
Adopting yr as the binary period, the modify BHL model recently presented by Tejeda & Toalá (2024) can be used to assess the mass accretion rate of the WD component in Y Gem. For the most probable stellar wind velocity of 5 km s-1 and typical mass-loss rates of =[0.7–1] M⊙ yr-1 of SR-type stars (e.g., Olofsson et al., 2002), a mass accretion rate of is found. This value is consistent with that estimated from the X-ray observations, favoring the shorter orbital period against the longer and periods of 28.9 and 65.9 yr, respectively, which can be expected to result in lower mass transfer efficiencies from the late-type star’s wind onto the WD component.
5 Conclusions
We presented the analysis of optical, UV, and X-ray observations of Y Gem to corroborate that, this previously classified X-AGB star, is in fact a SySt (as suggested by Yu et al., 2022). Our optical spectroscopic observations show that Y Gem shares very similar spectral properties to other iconic SySts such as Cet, R Aqr, and T CrB. The near and mid-IR colors indicate that Y Gem is a S-type SySt.
The presence of recombination and forbidden lines in the optical spectrum requires a temperature of the companion star 30,000 K, impossible for a main-sequence star companion of an AGB, but typical of a WD. The far-UV spectrum requires an even higher temperature 60,000 K for the hot component. Meanwhile the analysis of the optical spectrum and available IR photometry helped us constraining the properties of the late-type companion, a giant AGB star with effective temperature 3350 K, radius 240 R⊙, and mass 1.1 M⊙. After subtracting the contribution from the hot and cool stellar components, we estimate a UV+optical luminosity for the accretion disk of 28 L⊙.
Publicly available X-ray observations were interpreted by means of a reflection component. Under this scenario, X-ray photons produced at the boundary layer between the accretion disk and the surface of the WD are scattered and reflected by material in the accretion disk and by material in the vicinity of the SySt. This analysis allowed us to dissect the different contributions to the X-ray emission detected from Y Gem. Independent estimates for the soft component (most likely caused by shocks associated with variable jet-like ejections; ), the reflecting component (), and the actual X-ray emission produced at the boundary layer as a consequence of accretion (). Consequently, we estimate that the current accretion luminosity can be approximated by , which can be used to estimate a mass accretion rate 10-7 M⊙ yr-1. By comparing with theoretical models of accreting WDs, its seems that Y Gem has reached a stable and steady burning phase where no recurrent events are expected.
The present study reveals Y Gem to be one of the brightest UV and X-ray SySts reported thus far. Its conversion from AGB star to X-AGB star and finally to SySt encourages pushing searches and multi-wavelength characterizations of X-AGB stars, which might unveil the longtime sought missing population of SySts (see Petit et al., 2023; Xu et al., 2024).
Acknowledgements.
The authors thank the anonymous referee for comments and suggestions that improved the analysis and presentation of our results. M.A.G. acknowledges financial support from grants CEX2021-001131-S funded by MCIN/AEI/10.13039/501100011033 and PID2022-142925NB-I00 from the Spanish Ministerio de Ciencia, Innovación y Universidades (MCIU) cofunded with FEDER funds. J.B.R.G. and D.A.V.T. thank CONAHCyT (Mexico) for student grants. J.B.R.G., D.A.V.T., and J.A.T. are supported by Universidad Nacional Autónoma de México (UNAM) PAPIIT project IN102324. J.A.T. also thanks the Centro de Excelencia Severo Ochoa Visiting-Incoming programme for support during a visit to IAA-CSIC (Spain). R.O. thanks the support of the São Paulo Research Foundation (FAPESP), grant #2023/05298-0. This work is based on service observations made with the Isaac Newton Telescope (programme SST2024-654) operated on the island of La Palma by the Isaac Newton Group of Telescopes in the Spanish Observatorio del Roque de los Muchachos of the Instituto de Astrofísica de Canarias. The observer, R. Clavero, telescope operator, E. Mantero, and support astronomer, Santos, are particularly acknowledged. This work is based on observations obtained with XMM–Newton, an European Science Agency (ESA) science mission with instruments and contributions directly funded by ESA Member States and NASA. The scientific results reported in this paper are based on observations made by the Chandra X-ray Observatory and published previously in cited articles. This research is based on observations made with the NASA/ESA Hubble Space Telescope obtained from the Space Telescope Science Institute, which is operated by the Association of Universities for Research in Astronomy, Inc., under NASA contract NAS 5–26555. These observations are associated with program 14713. We acknowledge with thanks the variable star observations from the AAVSO International Database contributed by observers worldwide and used in this research. This work has made extensive use of NASA’s Astrophysics Data System.References
- Akras et al. (2019) Akras, S., Guzman-Ramirez, L., Leal-Ferreira, M. L., et al. 2019, ApJS, 240, 21
- Alcolea et al. (2023) Alcolea, J., Mikolajewska, J., Gómez-Garrido, M., et al. 2023, Highlights on Spanish Astrophysics XI, 190
- Allard & Hauschildt (1995) Allard, F. & Hauschildt, P. H. 1995, ApJ, 445, 433.
- Arnaud (1996) Arnaud, K. A. 1996, Astronomical Data Analysis Software and Systems V, 101, 17
- Bailer-Jones et al. (2021) Bailer-Jones, C. A. L., Rybizki, J., Fouesneau, M., et al. 2021, AJ, 161, 147
- Balick & Frank (2002) Balick, B. & Frank, A. 2002, ARA&A, 40, 439
- Béguin et al. (2024) Béguin, E., Chiavassa, A., Ahmad, A., et al. 2024, arXiv:2409.03422.
- Belczyński et al. (2000) Belczyński, K., Mikołajewska, J., Munari, U., et al. 2000, A&AS, 146, 407
- Bessell et al. (1989) Bessell, M. S., Brett, J. M., Scholz, M., et al. 1989, A&AS, 77, 1
- Bondi (1952) Bondi, H. 1952, MNRAS, 112, 195
- Bondi & Hoyle (1944) Bondi, H. & Hoyle, F. 1944, MNRAS, 104, 273
- Burgarella et al. (1992) Burgarella, D., Vogel, M., & Paresce, F. 1992, A&A, 262, 83
- Camps & Baes (2020) Camps, P. & Baes, M. 2020, Astronomy and Computing, 31, 100381
- Cardelli et al. (1989) Cardelli, J. A., Clayton, G. C., & Mathis, J. S. 1989, ApJ, 345, 245
- Cassisi et al. (1998) Cassisi, S., Iben, I., & Tornambè, A. 1998, ApJ, 496, 376
- Cutri et al. (2003) Cutri, R. M., Skrutskie, M. F., van Dyk, S., et al. 2003, VizieR Online Data Catalog, 2246. II/246
- De Marco et al. (2013) De Marco, O., Passy, J.-C., Frew, D. J., et al. 2013, MNRAS, 428, 2118.
- di Benedetto (1993) di Benedetto, G., 1993, A&A, 270, 315
- Eze (2014) Eze, R. N. C. 2014, MNRAS, 437, 857.
- Fluks et al. (1994) Fluks, M. A., Plez, B., The, P. S., et al. 1994, A&AS, 105, 311
- Fraser et al. (2008) Fraser, O. J., Hawley, S. L., & Cook, K. H. 2008, AJ, 136, 1242.
- Frew & Parker (2010) Frew, D. J. & Parker, Q. A. 2010, PASA, 27, 129.
- Fruscione et al. (2006) Fruscione, A., McDowell, J. C., Allen, G. E., et al. 2006, Proc. SPIE, 6270, 62701V
- Gabriel et al. (2004) Gabriel, C., Denby, M., Fyfe, D. J., et al. 2004, Astronomical Data Analysis Software and Systems (ADASS) XIII, 314, 759
- Gaia Collaboration et al. (2023) Gaia Collaboration, Vallenari, A., Brown, A. G. A., et al. 2023, A&A, 674, A1.
- Green et al. (2018) Green, G. M., Schlafly, E. F., Finkbeiner, D., et al. 2018, MNRAS, 478, 651.
- Guerrero et al. (2024) Guerrero, M. A., Montez Jr., R., Ortiz, R., Toalá J.A. & Kastner, J.H., 2024, A&A, 689, A62
- Hart et al. (2023) Hart, K., Shappee, B. J., Hey, D., et al. 2023, arXiv:2304.03791.
- Hauser et al. (1998) Hauser, M.G., Kelsall, T., Leisawitz, D. & Weiland, J., 1998, COBE Difuse Infrared Background Experiment (DIRBE) Explanatory Supplement, v2.3
- Høg et al. (2000) Høg, E., Fabricius, C., Makarov, V. V., et al. 2000, A&A, 355, L27
- Hoyle & Lyttleton (1939) Hoyle, F. & Lyttleton, R. A. 1939, Proceedings of the Cambridge Philosophical Society, 35, 405
- Jacoby et al. (2021) Jacoby, G. H., Hillwig, T. C., Jones, D., et al. 2021, MNRAS, 506, 5223
- Jones & Boffin (2017) Jones, D. & Boffin, H. M. J. 2017, Nature Astronomy, 1, 0117
- Jordi et al. (2010) Jordi, C., Gebran, M., Carrasco, J.M., de Bruijne, J., Voss, H., Fabricius, C., Knude, J., Vallenari, A., Kohley, R. & Mora, A., A&A, 523, A48
- Kiss (1999) Kiss, J.J., 1999, A&A, 346, 542
- Lançon & Wood (2000) Lançon, A. & Wood, P.R., 2000, A&AS, 146, 217
- Lee et al. (2022) Lee, Y.-M., Kim, H., & Lee, H.-W. 2022, ApJ, 931, 142
- Leibowitz & Formiggini (2015) Leibowitz, E. M. & Formiggini, L. 2015, AJ, 150, 52. doi:10.1088/0004-6256/150/2/52
- Lejeune et al. (1997) Lejeune, T., Cuisinier, F. & Buser, R., 1997, A&AS, 125, 229
- Linsky & Haisch (1979) Linsky, J. L. & Haisch, B. M. 1979, ApJ, 229, L27
- Livio et al. (1989) Livio, M., Prialnik, D., & Regev, O. 1989, ApJ, 341, 299
- Lodders et al. (2009) Lodders, K., Palme, H., & Gail, H.-P. 2009, Landolt Börnstein, 4B, 712
- Lomb (1976) Lomb, N. R. 1976, Astrophysics and Space Science, 39, 447.
- Lucy et al. (2020) Lucy, A. B., Sokoloski, J. L., Munari, U., et al. 2020, MNRAS, 492, 3107
- Luna et al. (2013) Luna, G. J. M., Sokoloski, J. L., Mukai, K., et al. 2013, A&A, 559, A6
- Marigo et al. (1996) Marigo, P., Bressan, A. & Chiosi, C., 1996, A&A, 313, 545
- Merc et al. (2019) Merc, J., Gális, R., & Wolf, M. 2019, Astronomische Nachrichten, 340, 598
- Merc et al. (2021) Merc, J., Gális, R., Wolf, M., et al. 2021, MNRAS, 506, 4151.
- Mikolajewska et al. (1997) Mikolajewska, J., Acker, A., & Stenholm, B. 1997, A&A, 327, 191
- Miller-Bertolami (2016) Miller-Bertolami, M.M., 2016, A&A, 588, A25
- Miszalski et al. (2009) Miszalski, B., Acker, A., Moffat, A. F. J., et al. 2009, A&A, 496, 813
- Miszalski et al. (2013) Miszalski, B., Mikołajewska, J., & Udalski, A. 2013, MNRAS, 432, 3186
- Mukai et al. (2016) Mukai, K., Luna, G. J. M., Cusumano, G., et al. 2016, MNRAS, 461, L1
- Munari (2019) Munari, U. 2019, ”The Impact of Binary Stars on Stellar Evolution”, G. Beccari and M.J. Boffin eds., Cambridge Univ. Press., Cambridge Astrophysical Series Vol. 54, 77, arXiv:1909.01389.
- Munari et al. (2021) Munari, U., Traven, G., Masetti, N., et al. 2021, MNRAS, 505, 6121
- Mürset et al. (1997) Mürset, U., Wolff, B., & Jordan, S. 1997, A&A, 319, 201
- Netzer (1975) Netzer, H. 1975, MNRAS, 171, 395
- Olivier & Wood (2003) Olivier, E. A. & Wood, P. R. 2003, ApJ, 584, 1035.
- Olofsson et al. (2002) Olofsson, H., González Delgado, D., Kerschbaum, F., et al. 2002, A&A, 391, 1053. doi:10.1051/0004-6361:20020841
- Ortiz & Guerrero (2016) Ortiz, R. & Guerrero, M. A. 2016, MNRAS, 461, 3036
- Ortiz & Guerrero (2021) Ortiz, R. & Guerrero, M. A. 2021, ApJ, 912, 93
- Ortiz et al. (2019) Ortiz, R., Guerrero, M. A., & Costa, R. D. D. 2019, MNRAS, 482, 4697
- Ostlie & Cox (1986) Ostlie, D.A. & Cox, A.N., 1986, ApJ, 311, 864
- Pawlak (2021) Pawlak, M. 2021, A&A, 649, A110.
- Parzen (1962) Parzen, E. 1962, Ann. Math. Stat., 33, 1065.
- Perrin et al. (1998) Perrin, G., Coudé du Foresto, V., Ridgway, S.T., Mariotti, J.-M., Traub, W.A., Carleton, N.P. & Lacasse, M.G., 1998, A&A, 331, 619
- Petit et al. (2023) Petit, T., Merc, J., Gális, R., et al. 2023, New A, 98, 101943
- Pickles (1998) Pickles, A.J., PASP, 110, 863
- Podsiadlowski & Mohamed (2007) Podsiadlowski, P. & Mohamed, S. 2007, Baltic Astronomy, 16, 26
- Prieur et al. (2002) Prieur, J. L., Aristidi, E., Lopez, B., et al. 2002, ApJS, 139, 249.
- Pringle (1981) Pringle, J. E. 1981, ARA&A, 19, 137
- Ridgway et al. (1980) Ridgway, S.T., Joyce, R.R., White, N.M. & Wing, R.F., 1980, ApJ, 235, 126
- Sahai et al. (2008) Sahai, R., Findeisen, K., Gil de Paz, A., et al. 2008, ApJ, 689, 1274
- Sahai et al. (2011) Sahai, R., Neill, J. D., Gil de Paz, A., et al. 2011, ApJ, 740, L39
- Sahai et al. (2018) Sahai, R., Sánchez Contreras, C., Mangan, A. S., et al. 2018, ApJ, 860, 105
- Sahai et al. (2022) Sahai, R., Sanz-Forcada, J., Guerrero, M., Ortiz, R. & Sánchez-Contreras, C., 2022, Galaxies, 10, 62
- Sahai et al. (2015) Sahai, R., Sanz-Forcada, J., Sánchez Contreras, C., et al. 2015, ApJ, 810, 77
- Samus et al. (2017) Samus’, N. N., Kazarovets, E. V., Durlevich, O. V., et al. 2017, Astronomy Reports, 61, 80
- Scargle (1982) Scargle, J. D. 1982, ApJ, 263, 835.
- Schlafly & Finkbeiner (2011) Schlafly, E. F. & Finkbeiner, D. P. 2011, ApJ, 737, 103.
- Schmid (1989) Schmid, H.M., 1989, A&A, 211, L31
- Shakura & Sunyaev (1973) Shakura, N. I. & Sunyaev, R. A. 1973, A&A, 24, 337
- Shappee et al. (2014) Shappee, B. J., Prieto, J. L., Grupe, D., et al. 2014, ApJ, 788, 48.
- Soker & Kastner (2003) Soker, N. & Kastner, J. H. 2003, ApJ, 592, 498
- Soszyński et al. (2021) Soszyński, I., Olechowska, A., Ratajczak, M., Iwanek, P., Skowron, D.M., Mróz, P., Pietrukowicz, P., Udalski, A., Szymański, M.K., Skowron, J. et al., 2021, ApJL, 911, L22
- Tejeda & Toalá (2024) Tejeda, E. & Toalá, J. A. 2024, arXiv:2411.01755.
- Teyssier (2019) Teyssier, F. 2019, Contributions of the Astronomical Observatory Skalnate Pleso, 49, 217
- Toalá et al. (2024) Toalá, J. A., González-Martín, O., Sacchi, A., et al. 2024, MNRAS, 532, 1421
- Toalá et al. (2023) Toalá, J. A., González-Martín, O., Karovska, M., et al. 2023, MNRAS, 522, 6102
- Toalá (2024) Toalá, J. A. 2024, MNRAS, 528, 987
- Toalá et al. (2022) Toalá, J. A., Sabin, L., Guerrero, M. A., et al. 2022, ApJ, 927, L20
- Tody (1993) Tody, D. 1993, Astronomical Data Analysis Software and Systems II, 52, 173
- Vander Meulen et al. (2023) Vander Meulen, B., Camps, P., Stalevski, M., et al. 2023, A&A, 674, A123
- VanderPlas & Ivezić (2015) VanderPlas, J. T. & Ivezić, Ž. 2015, ApJ, 812, 18.
- Whitelock et al. (2000) Whitelock, P., Marang, F. & Feast, M., 2000, MNRAS, 319, 728
- Wilms et al. (2000) Wilms, J., Allen, A., & McCray, R. 2000, ApJ, 542, 914
- Wolf et al. (2013) Wolf, W. M., Bildsten, L., Brooks, J., et al. 2013, ApJ, 777, 136
- Wood et al. (2004) Wood, P. R., Olivier, E. A., & Kawaler, S. D. 2004, ApJ, 604, 800.
- Wood & Nicholls (2009) Wood, P.R. & Nicholls, C.P., 2009, ApJ, 707, 573
- Wood et al. (1999) Wood, P.R., Alcock, C., Allsman, R.A., Alves, D., Axelrod, T.S., Becker, A.C., Bennett, D.P., Cook, K.H., Drake, A.J., Freeman, K.C. et al., 1999, IAU Symp., 191, 151
- Wood (1990) Wood, P.R., 1990, ASPC, 11, 355
- Xu et al. (2024) Xu, X.-jie, Shao, Y., & Li, X.-D. 2024, ApJ, 962, 126
- Yu et al. (2022) Yu, Z.-li, Xu, X.-jie, Shao, Y., et al. 2022, ApJ, 932, 132
- Zamanov et al. (2024) Zamanov, R. K., Stoyanov, K. A., Marchev, V., et al. 2024, arXiv:2405.11506.