Intrinsic inverse band gap versus polarization relation in ferroelectric materials
Abstract
Ferroelectric materials have promising applications in solar-energy conversion and electro-optic devices. The internal gradient fields produced by the macroscopic polarization may improve electronic and transport semiconducting properties. However, ferroelectrics tend to display relatively large band gaps and hence low solar-energy conversion efficiencies. In this work, we explore materials with an intrinsic inverse relation between band gap and polarization in a single ferroelectric phase. Ferroelectrics with an inverse band gap versus polarization relation are characterized by low density of states contribution at the conduction states and negligible orbital hybridization at the valence states. We use high-throughput and first principles methods to find 11 ferroelectric materials with an inverse band gap versus polarization relation in the Materials Project database. Our work provides a new pathway to design small-band gap large-polarization ferroelectrics, by simultaneously tailoring the band gap and polarization of ferroelectrics with an inverse relation through an external tuning parameter.
pacs:
Valid PACS appear hereNew functional properties are desired to identify and optimize materials for solar-energy conversion applications You et al. (2018); Tyunina et al. (2015); Abel et al. (2013). Ferroelectrics, dielectric materials with a spontaneous and switchable macroscopic polarization, have promising potential applications in photovoltaic Butler et al. (2015); Qin et al. (2008), photocatalytic Li et al. (2014) and electro-optic devices Scott (2007); Sando et al. (2018); Hu et al. (2009). Previous work have suggested that the internal gradient field produced by the ferroelectric polarization may improve carrier transport Han et al. (2022); Tan et al. (2022), electron-hole separation Zheng et al. (2015), optical properties Wessels (2007), and photocurrent efficiencies Young and Rappe (2012); Dai and Rappe (2023); Daranciang et al. (2012), sparking great interest in electronic properties of ferroelectrics and their properties under sunlight irradiation Kreisel et al. (2012); Seidel and Eng (2014); Kim et al. (2018).
However, ferroelectrics tend to have relatively large band gaps ( eV) Li et al. (2017); Choi et al. (2012a) and are therefore normally unsuitable as photoactive semiconductors. Hence, previous work has focused on the discovery of so-called small band gap ferroelectrics ( eV) Bennett and Rabe (2012), and the development of semiconducting ferroelectrics for electro-optic devices Guo et al. (2013) and solar-energy conversion applications Han et al. (2022); Grinberg (2020); Yang et al. (2012). Despite great progress, the list of small band gap ferroelectrics remains limited Bennett et al. (2012); Wang et al. (2015). Additionally, experimental verification of small band gap ferroelectrics predicted by theory is hindered by charge leakage and sample stability Zhang et al. (2017); Wang et al. (2014).
Previous work on ferroelectrics has shown that the electronic band gap and macroscopic polarization can be tuned using hydrostatic pressure Ghosh et al. (2021); Bonomi et al. (2018), epitaxial strain Yang et al. (2016); Berger et al. (2011); Vonrüti and Aschauer (2018); Manzeli et al. (2015), superlattices Zhang et al. (2017), quantum confinement Reyes-Lillo et al. (2016); Birol and Fennie (2013), alloying Shimada et al. (2011); Qi et al. (2011), chemical composition Islam and Podder (2021); Wang et al. (2022); Choi et al. (2012b), charge disproportion He et al. (2017) and structural transitions Wang et al. (2014).
For the case of the prototypical perovskite SrTiO3, the application of biaxial epitaxial strain on the non-polar cubic structure induces a band gap reduction due to the splitting of the t2g Ti- conduction edge states Berger et al. (2011). However, polar off-centering of the Ti ions and antiferrodistortive octahedral rotations have the opposite effect and induce a band gap increase. The band gap increase arises due to the increasing orbital hybridization between Ti- and O- states and the subsequent repulsion between the edge states forming the band gap Berger et al. (2011); Qi et al. (2011). These results suggest a competition between symmetry breaking and bond length, with opposite effects on the electronic band gap. While symmetry breaking of orbital degeneracies tend to narrow the band gap, structural distortions leading to smaller bond lengths and increasing orbital hybridization tend to increase the band gap. In the case of SrTiO3, the latter effect dominates over the former, and results in a band gap increase with ferroelectric polarization increase, i.e. band gap and polarization display a direct relation. Similar direct relation between band gap and polarization has been observed in other ferroelectric families Vonrüti and Aschauer (2018); Parker et al. (2011). More generally, a phenomenological modeling suggest a direct relation between band gap and polarization for proper ferroelectrics Fridkin (1979).
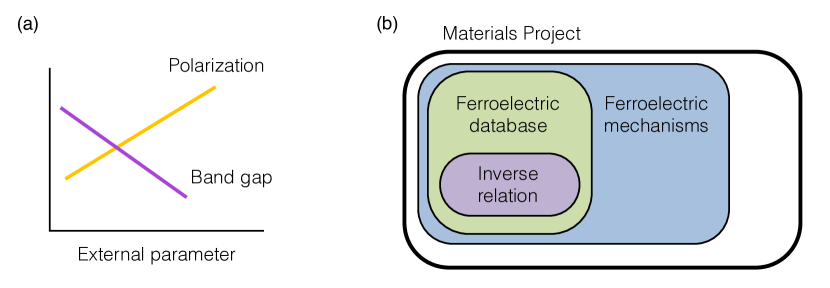
Nevertheless, as shown below, the microscopic interplay between the atomic polar displacement responsible for the ferroelectric polarization and the near edge state orbitals forming the band gap display different behaviors across different families of ferroelectrics. Ferroelectric mechanisms where the band gap orbitals are not associated to the polar atomic displacement could, in principle, lead to a situation where band gap and polarization are uncorrelated or have an inverse relation under an external effect, as shown in Fig. 1(a). Ferroelectrics with an inverse band gap polarization relation may lead to new pathways to search for small band gap ferroelectrics, and more generally, new strategies to simultaneously optimize band gap and polarization values for solar-energy applications through external effects such chemical doping Ma et al. (2020); Choi et al. (2012b), strain Rus et al. (2016); Sando et al. (2018), or pressure Ghosh et al. (2021) engineering. Notably, a concomitant band gap reduction and polarization increase has been observed due to phase transitions and film thickness Tyunina et al. (2015); Sando et al. (2018). Here, we explore the possibility of a simultaneous band gap decrease and polarization enhancement within a single ferroelectric phase.
To explore the possibility of such property in ferroelectrics, we must investigate a wide variety of microscopic ferroelectric mechanisms in different families of ferroelectrics. Recently, materials databases of ferroelectric materials have been constructed by integrating symmetry analysis, high throughput methods and first principles calculations Smidt et al. (2020); Ricci et al. (2024). The ferroelectric database of Smidt et al. Smidt et al. (2020) reports a dataset of 200 high quality ferroelectric materials. Ferroelectric materials are identified in the Materials Project database Jain et al. (2013) by searching for materials possessing a non-polar and a polar structure related through a continuous symmetry breaking, and computing the Berry phase polarization along an adiabatic insulating path connecting the non-polar and polar structures. For each ferroelectric material identified, the structural ferroelectric mechanism is provided, namely the high-symmetry non-polar reference structure, the low-symmetry polar structure, and the symmetry distortion connecting the high and low symmetry structures. The ferroelectric mechanism represents a class or family of ferroelectric materials, and here we assume that each ferroelectric compound reported in the ferroelectric database of Smidt et al. corresponds to a representative of the ferroelectric class.
In this work, we use a combination of high-throughput and first-principles methods to search for ferroelectric materials displaying an inverse relation between polarization and electronic band gap under hydrostatic strain. We propose this intrinsic property as a new strategy to design small band gap ferroelectrics. To our knowledge, such novel property has not been reported previously. Here we report 11 ferroelectrics with an inverse band gap versus polarization relation among different families of ferroelectrics (Fig. 1(b)). We first identify ferroelectrics with an inverse relation within the ferroelectric database of Smidt et al. and latter generalize our search to identify new ferroelectrics with inverse relation within the Materials Project database.
High-throughput selection of materials is performed using the Materials Project database. Materials properties are explored using Pymatgen Jain et al. (2011a); Ong et al. (2013). Density functional theory (DFT) calculations are performed using the Vienna Ab initio Simulation Package (VASP) code Kresse and Furthmüller (1996a, b). We use the generalized gradient approximation of Perdew, Burke, Ernzerhof (PBE) Perdew et al. (1996). In selected cases, we use the Hubbard U approximation to properly describe localized orbitals of transition metal ions Liechtenstein et al. (1995); Dudarev and Botton (1998). Our calculations use the Materials Project settings, including an energy cut-off of 520 eV, symmetry adapted -point grids, projected augmented wave pseudopotentials Kresse and Joubert (1999) and Hubbard U parameters Wang et al. (2006); Jain et al. (2011b). Density of states are computed using dense grids (12 -points per 2 0.25 Å-1 reciprocal space length). Band structures are plotted along symmetry lines with Pyprocar Hinuma et al. (2017); Herath et al. (2020). Selected materials are studied using the Heyd, Scuzeria, Ernzerhof (HSE) hybrid functional Heyd et al. (2005, 2006). Structural relaxations are performed until forces are smaller than 0.001 eV/Å. Irreducible representation of polar modes are obtained with Phonopy Togo and Tanaka (2015). Macroscopic polarization is computed using the modern theory of polarization, as implemented in VASP King-Smith and Vanderbilt (1993).
We start by exploring the possibility of ferroelectrics with an inverse band gap polarization relation within the ferroelectric database of Smidt et al. (see Fig. 1(a)). This database reports the structural information of the non-polar and polar structures, and is therefore, suitable for the screening strategy proposed here. We leave the study of other ferroelectric databases for future work. As a first step, we identify the set of materials in the ferroelectric database having a polar band gap smaller than the reference non-polar band gap , i.e. . The motivation behind this criteria is as follows. The polarization is expected to monotonically increase along the adiabatic path connecting the non-polar and polar structures. Therefore, if the band gap decreases along the same adiabatic path, any external parameter that further enhances the polar distortion will simultaneously induce a band gap reduction. Therefore, the criteria is expected to suggest an inverse relation between band gap and polarization.
As a first approximation, we consider the non-polar and polar band gaps reported by the Materials Project, denoted here as and respectively, and compute for the materials in the ferroelectric database. From the initial 200 materials, we find that 62 ferroelectric materials (31%) display a band gap reduction from the non-polar to the polar structure, i.e. . Among these, 15 cases are reported with polarization values C/cm2, too small to investigate polarization trends under an external parameter, and are therefore disregarded. In addition, 5 cases display a large volume increase % between the non-polar and polar structure. Here, we consider these volume expansions rather unphysical and we therefore disregard these cases. We further eliminate 7 materials containing only reactive non-metal ions (e.g. H2O) since these typically correspond to specific structural transitions and are unlikely to represent a family of ferroelectrics.
Table S1 reports the remaining 35 ferroelectric materials with . Note that some cases have the equal stoichiometry but different ferroelectric mechanism (e.g. Ag3SI), because either the nonpolar, the polar or both phases are different. These cases are labeled with a number after the stoichiometry (e.g. Ag3SI-1 and Ag3SI-2). To verify the band gap values reported by the Materials Project, we perform full structural relaxations and compute band gaps using dense-grid density of states calculations. Table S1 compares band gap values reported in the Materials Project with our computed band gaps. Our results are generally in line with the Materials Project. In few cases, small band gap differences lead to qualitative differences between and . These cases are explained by initially small band gap differences between non-polar and polar structures, and by slightly different numerical input parameters in the calculations. We disregard 7 cases with band gap difference below eV, where band gap changes are expected to be negligible. We confirm 19 cases with a band gap reduction from the non-polar to polar structure, i.e (highlighted in green in Table S1).
| Prototypical | Non polar | Polar | Irrep. | CBM | VBM | ||||
|---|---|---|---|---|---|---|---|---|---|
| material | sp. group | sp. group | polar mode | () | () | (eV) | (eV) | ||
| Ag3SI-2 | Pmm Didisheim et al. (1986) | P21 | (Ag,S,I) | 56.1i | 0.4 | 0.34 | 1.22 | Ag-/S- | S-/I- |
| InHO2 | Pnnm Christensen et al. (1964) | Pmn21 Lehmann et al. (1970) | (In,H,O) | 442.3i | 13.1 | 1.76 | 3.57 | In- | O- |
| K4CO4-3 | P3m | R3m | (K,C,O) | 72.6 | 4.6 | 2.17 | 3.97 | K- | O- |
| KP(HO2)2-1 | I2d Endo et al. (1989) | Fdd2 Miyoshi et al. (2011) | (P,H,O) | 516.9i | 0.6 | 5.42 | 7.33 | K-/P-/O- | O- |
| KP(HO2)2-2 | P21/c | Cc | (K,P,H,O) | 494.5i | 0.4 | 5.28 | 6.98 | K-/O- | O- |
| Mg3B7ClO13 | F3c Sueno et al. (1973) | Pca21 Wang et al. (2018) | (Mg,B,Cl,O) | 115.1i | 0.4 | 5.69 | 7.73 | Mg-/Cl- | O- |
| Rb4CO4-2 | P3m Mattauch et al. (2004) | R3m | (Rb,C,O) | 49.1 | 2.6 | 1.83 | 3.37 | Rb- | O- |
| RbP(HO2)2 | I2d | Fdd2 | (P,H,O) | 532.4i | 6.7 | 5.23 | 7.09 | Rb-/P-/O- | O- |
| YBiO3 | P63/mmc | P63cm | (Y,Bi,O) | 100.3i | 11.4 | 2.02 | 2.83 | Bi-/O- | O- |
Next, for the 19 cases displaying a band gap reduction, we construct an adiabatic structural path connecting the non-polar and polar structures to compute the ferroelectric polarization. Table S2 reports our results for total energy differences, macroscopic polarizations and volume changes along the adiabatic path connecting the non-polar and polar structures. In 4 cases, the ferroelectric structure corresponds to a metastable phase. Our computed polarizations using the Berry phase approach are in overall good qualitative agreement with the values reported in the ferroelectric database. Quantitative differences are explained by the stringent force threshold used here for relaxation. In some cases, non-polar reference structures correspond to shallow local minima and require small distortion steps to remain within the local minimum. Energies above hull for the polar structures are extracted from the Materials Project database.
Figs. S1 ans S2 show the band gap and polarization along the linearly interpolated structural path connecting the non-polar and polar structures for the materials reported in Table S2. Plots are separated in two sets for later convenience. In most cases, band gaps display a monotonic decrease as the polarization monotonically increases along the structural path connecting non-polar and polar structures. The latter suggests that an inverse relation between band gap and polarization may arise if the polar distortion is further enhanced through some external parameter. In few cases, band gaps display a non monotonic behavior due to the presence of an energy barrier or a change in band gap position along the path. Polarization values obtained with the Berry phase approach are corroborated using the linear approximation , where and are the Born effective charges and atomic displacement between non-polar and polar structures for atom , respectively, is the polar structure volume, is the electron charge, and the sum runs over all the ions in the structure. In both cases, we use the non-polar structure as reference. Therefore, as expected, polarization values obtained with Born effective charges display a linear behavior and agree with the Berry phase approach for small polar distortions.
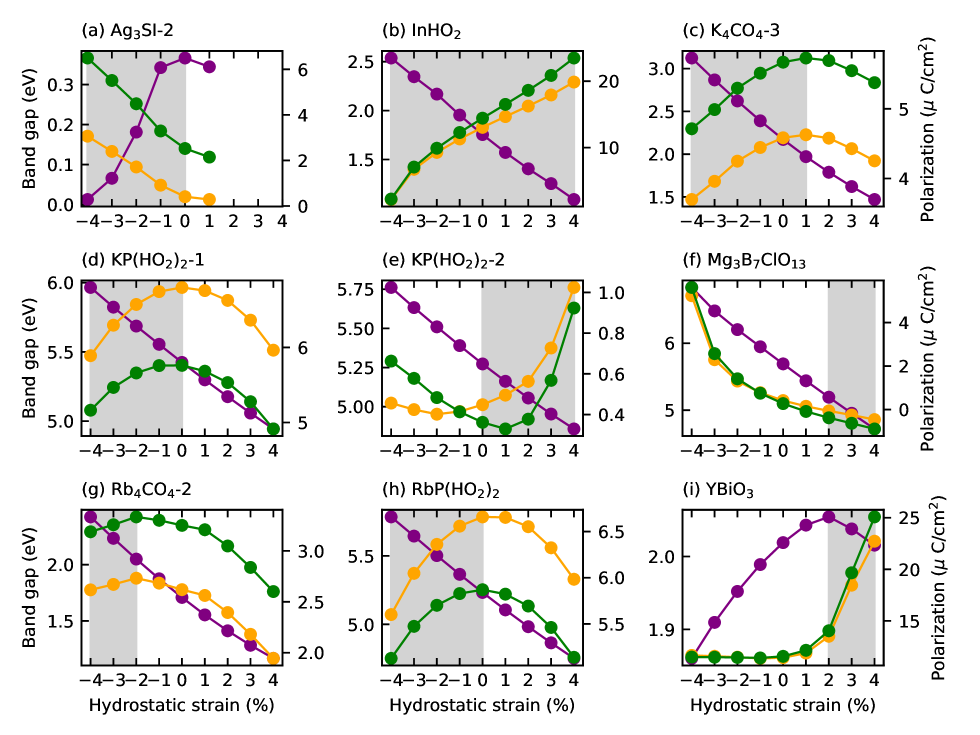
In the following, we investigate the relation between band gap and polarization under the effect of hydrostatic strain for the 19 materials in Table S2. Here, hydrostatic strain is chosen as a simple way to increase the volume of the structure without changing the symmetry of the ferroelectric phase. Indeed, we find that 9 ferroelectrics display an inverse relation between band gap and polarization (highlighted in green in Table S2), whereas 10 display a direct relation. Figs. 2 and S3 show the band gap and polarization as a function of applied hydrostatic strain for the ferroelectrics displaying an inverse and direct relation, respectively. Regions of inverse band gap and polarization relation are highlighted in gray. Ag3SI-2 becomes unstable above 1% strain, and undergoes a structural distortion, we therefore disregard that portion of the graph. The same occurs for Mo(HO2)2-1 and Zn(NO3)2 at compressive and tensile strain, respectively (see Fig. S3).
For Ag3SI-2 and YBiO3 the band gap decreases at large compressive strain, with decreasing volume, and the structures become metallic. For the rest of the materials in Fig. 2, the band gap decrease monotonically with increasing strain. In these cases, the band gap is modulated by the volume, not by the magnitude of the polarization, and decreases due to the increasing bond lengths in the structure. In parallel, the polarization has a monotonic behavior for Ag3SI-2, InHO2 and YBiO3. For the case of Mg3B7ClO13, the polarization changes sign around 2%, and the polarization magnitude increases above 2% strain. YBiO3 display a nearly constant polarization for compressive strain and a sharp increase above 1%. For K4CO4-3, KP(HO2)2-1, KP(HO2)2-2, Rb4CO4-2 and RbP(HO2)2 the polarization display a non-monotonic behavior. The polarization reaches a maximum (minimum) value near 0% strain for K4CO4-3, KP(HO2)2-1, Rb4CO4-2 and RbP(HO2)2 (for KP(HO2)2-2), and decreases (increases) at both compressive and tensile strains.
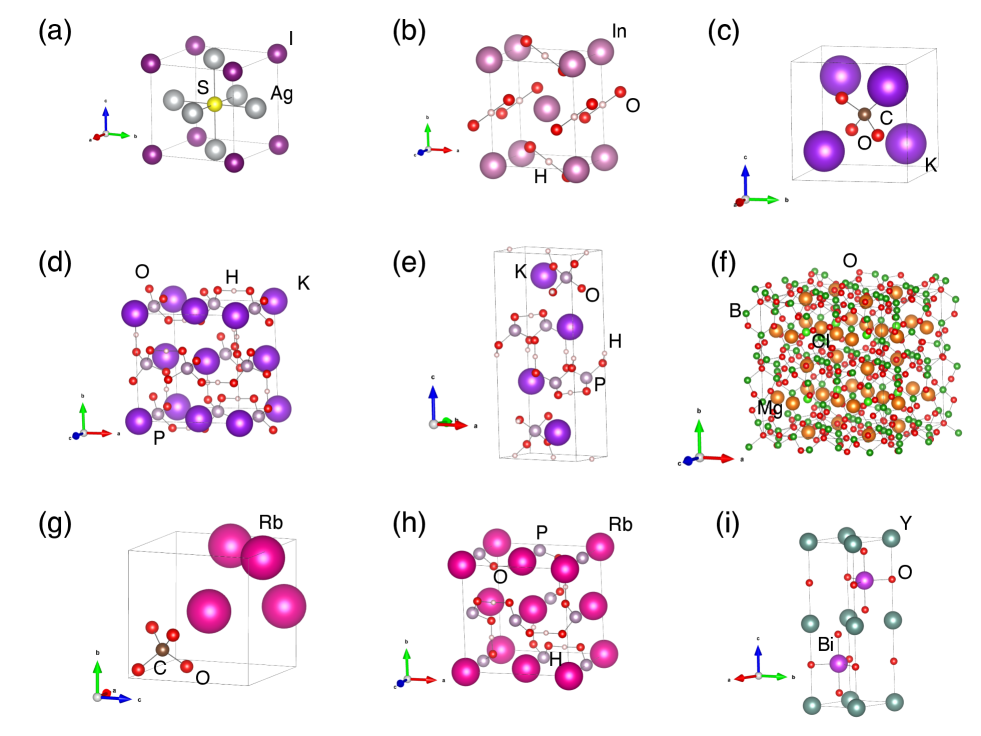
Fig. 3 shows the atomic structure for the 9 ferroelectric displaying an inverse band gap polarization relation. Table 1 reports their space group symmetries, irreducible representation and frequency of the lowest ferroelectric polar mode, polarization, as well as band gaps and band edge orbital character of the conduction band minium (CBM) and valence band maximum (VBM). KP(HO2)2-1, Mg3B7ClO13 and RbP(HO2)2-2 are well known ferroelectrics Lines and Glass (1977). Ag3SI-2, InHO2 and Rb4CO4-2 have experimentally accessible structures. The rest of the materials have been theoretically predicted with first principles Cancarevic et al. (2007).
Polar modes are obtained by performing a -centered phonon mode calculation for the non-polar structure. From the 9 candidate materials, 7 display a polar mode with imaginary frequencies and therefore correspond to proper ferroelectrics. The 2 other cases, namely K4CO4-3 P3m and Rb4CO4-2 P3m display real frequencies, signaling an improper ferroelectric mechanism. These results show that an inverse relation between band gap and polarization is not exclusive for proper or improper ferroelectric mechanism, but rather an intrinsic property of the polar phase.
Semi-local functionals such as PBE tend to underestimate experimental band gaps due to well-known limitations of DFT Mori-Sánchez et al. (2008). Therefore, to confirm the band gap narrowing, we perform full structural relaxations using HSE and compute HSE band gaps with dense-grid density of states calculations. Table 1 display band gaps computed with PBE and HSE. Table S3 reports HSE lattice parameters and HSE band gap differences for the materials in Table 1. HSE display a large (%) band gap increase and relatively small lattice parameter change with respect to PBE. Notably, HSE confirms the band gap narrowing between the non-polar and polar structures (see Table S3). With the only exception of YBiO3, spin orbit interaction has a negligible effect on the magnitude of the polar structures band gaps ( eV). For YBiO3, spin-orbit interaction decreases the magnitude of the band gap but maintains the trend (see Fig. S4).
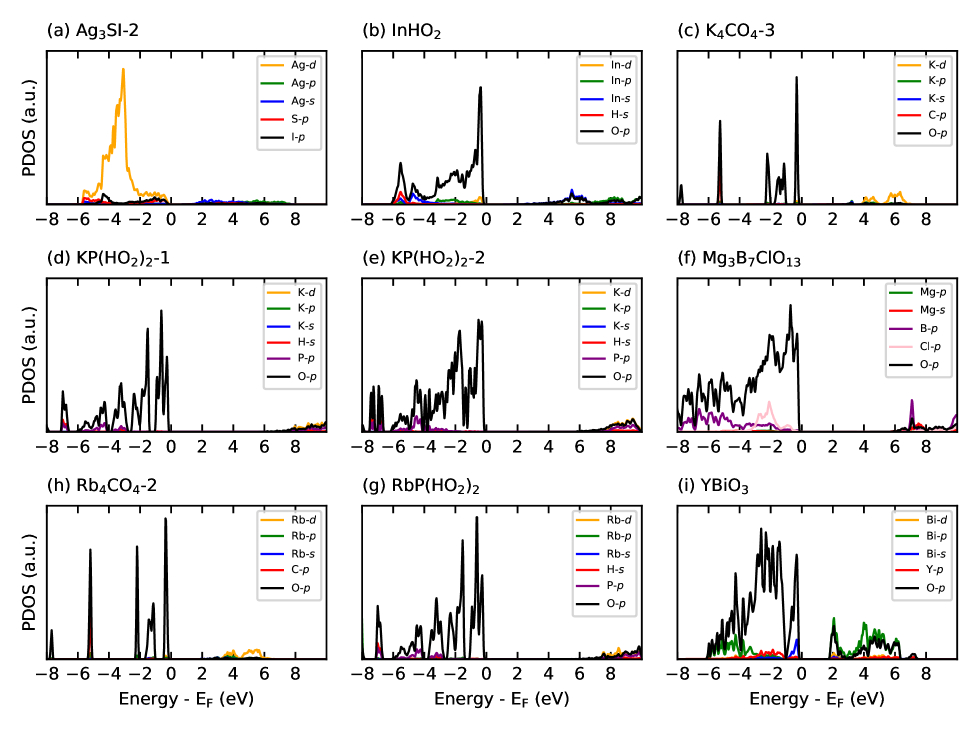
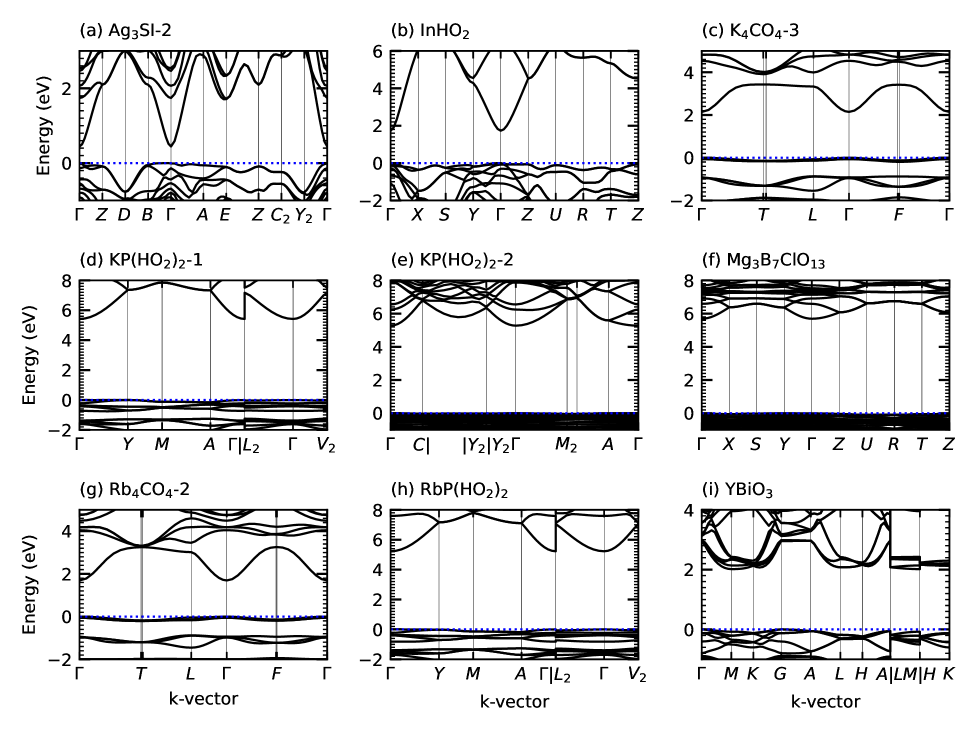
To explore the origin of the inverse relation between band gap and polarization, we investigate the electronic properties of the materials. Figs. 4 shows DFT-PBE partial density of states for the materials reported in Table 1. The main common characteristic among the different densities of states is the small density contribution at the conduction states, relative to the respective valence states (similarly for some materials in Fig. S3). Accordingly, as shown in Fig. 5, the band structures display dispersive conduction bands. The lack of conduction states density also explains the small effect of spin orbit interaction in the band gap Krach et al. (2023). In addition, the dominating orbital contribution at the valence states display negligible hybridization with other types of orbitals.
For Ag3SI, the main polar distortion involves displacements of S against Ag. However, Ag- and S- display negligible hybridization in the density of states. Similarly, for the sets (i) InHO2, KP(HO2)2-1, KP(HO2)2-2, RbP(HO2)2, (ii) K4CO4, Rb4CO4-2 and (iii) Mg3B7ClO13, the polar mode involves polar displacements between (i) H, O, (ii) C, O, and (iii) B, O, respectively, which hybridizes deep into the valence states, and therefore have negligible effect on band gap. Finally, the improper ferroelectric mechanism of YBiO3 involves displacements of Y against O. However, Y- and O- display negligible hybridization in the density of states.
The lack of density contribution at the conduction states and hybridization in the valence states leads to a small interaction between the near edge gap states and the polar distortion. More specifically, the atomic orbitals participating in the polar distortion have negligible contribution at the band gap edges, and therefore, polarization and band gap are effectively decoupled. The ferroelectrics in Fig. 2 can be described as geometric, in the sense that the polarization is not driven by changes in chemical bonding or orbital hybridization, but rather due to electrostatics and size effects. The latter explains the non-monotonic behavior of the polarization for K4CO4-3, KP(HO2)2-1, KP(HO2)2-2, Rb4CO4-2 and RbP(HO2)2. At large compressive strain, i.e small volumes, atoms have little room to displace and the polarization decreases. At large tensile strain, the polar displacement reaches a maximum and the polarization decreases due to the volume increase. For Ag3SI, InHO2 and YBiO3, the behavior of the polarization under hydrostatic strain is specific to their ferroelectric mechanism.
| Ferroelectric | ||||
|---|---|---|---|---|
| material | () | (eV) | (meV) | (%) |
| AlHO2 (Pmn21) Komatsu et al. (2006) | 21.0 | 5.69 | -36.9 | 2.2 |
| CsAs(HO2)2 (Fdd2) | 7.1 | 3.91 | -65.0 | 2.6 |
Interestingly, KP(HO2)2-1 and RbP(HO2)2 as well as K4CO4-3 and Rb4CO4-1 belong to the same family of ferroelectrics. This suggests the existence of more ferroelectric materials with the desired property within the ferroelectric families in Table 1. To explore this possibility, we search for other ferroelectric materials with an inverse band gap polarization relation in the Materials Project (see Fig. 1(b)). To this end, we generalize our high-throughput search by interpreting the prototypical ferroelectric materials in the ferroelectric database as representatives of families of ferroelectrics. The initial set of ferroelectric materials is enlarged by considering all materials in the Materials Project database possessing a phase isostructural to either the polar or the non polar structure of one of the prototypical materials reported in Table 1. The resulting group of materials are excluded from the ferroelectric database, since these ferroelectrics have both non polar and polar structures reported in the Materials Project database.
Isostructural materials are identified within the Materials Project by imposing structural conditions, specifically, equal space group, total number of atoms, number of species, Wyckoff positions, and coordination number around each atom. These conditions are screened using the pymatgen functions Ong et al. (2013). Our search identifies 21 polar and 25 non polar materials in the Materials Project isostructural to one of the prototypical materials in Table 2. However, only 9 polar and 6 non polar are insulating. We perform full structural relaxations and compute band gaps using dense-grid density of states calculations for these 15 materials. For the case of polar structures, the associated reference non-polar structure is constructed isostructural to the non-polar structure in the ferroelectric database. In this case, we confirm the non polar structure is insulating, therefore allowing a direct calculation of the Berry phase polarization. Similarly, for the case of the non-polar structures, the polar structure is constructed isostructural to the polar structure in the ferroelectric database. In this case, the stability of the polar structure is determined from full structural relaxations.
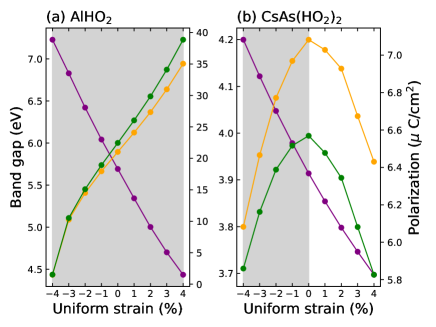
We confirm 5 cases with a band gap narrowing from non-polar to polar, namely AlHO2 Pmn21, Cd(NO3)2 Pca21, CsAs(HO2)2 Fdd2, YCoO3 P63cm, and YMnO3 P63cm. Note that YMnO3 is a well-known geometric ferroelectric Van Aken et al. (2004). From these, only AlHO2, CsAs(HO2)2 display and inverse band gap polarization relation (see Fig. 6). Table 2 reports their Berry phase polarization, PBE band gaps, as well as energy and volume differences between non-polar and polar phases. CsAs(HO2)2 is a well known ferroelectric Lines and Glass (1977), and the polar structure of AlHO2 is experimentally accessible. Notably, AlHO2 Pmn21 and CsAs(HO2)2 Fdd2 display larger polarizations and smaller PBE band gaps than their isostructures counterparts InHO2 Pmn21 and KP(HO2)2 Fdd2, respectively.
We make several observations from our results summarized in Table 3. We first highlight that 9 from 200 (4.5%) prototypical ferroelectrics display an inverse relation between polarization and band gap. Families of ferroelectrics may have more than one example of ferroelectrics displaying the inverse relation property. We also note that isostructural materials within a ferroelectric family may either have or not have the inverse polarization band gap relation. These results suggest that our search is far from exhaustive.
| Materials | Search | Number of |
| database | criteria | ferroelectrics |
| Ferroelectrics | Ferroelectric database | 200 |
| database | Ferroelectrics with | 20 |
| Inverse vs. relation | 9 | |
| Materials | Polar isostructures | 21 |
| Project | Non polar isostructures | 25 |
| Isostructures with | 4 | |
| Inverse vs. relation | 2 |
Interestingly, the ferroelectrics in Table 2 were identified as inverse band gap versus polarization ferroelectrics simply due to the fact that their prototypical ferroelectric class representative displayed themselves the property. The latter suggest that other inverse relation ferroelectrics may exist within families of ferroelectrics whose representative in the ferroelectric database does not display the property. The latter calls for a systematic search of materials with the property.
In usual ferroelectrics where the polarization arises due to chemical bonding or orbital hybridization, the behavior of the band gap is determined by polarization orientation, symmetry breakings, volume, and type of near edge orbital contribution. Here, ferroelectrics are characterized by low conduction density of states and valence orbital hybridization, therefore band gaps and polarizations are greatly affected by the volume. We emphasize that the band gap reduction from non-polar and polar structures , is not a sufficient condition to identify inverse relation ferroelectrics. In addition, not all ferroelectrics within a certain class display the inverse relation property, therefore the property is independent of the ferroelectric mechanism. We conclude that in addition to low density of states contribution at the conduction states and negligible orbital hybridization at the valence states, inverse relation ferroelectrics require the right rates of band gap and polarization change under the external parameters, which in turn is determined by details of orbital interaction and distortions in the polar structure.
In summary, we have found 11 examples of ferroelectric materials displaying a novel property, an inverse relation between band gap and polarization. We find 9 examples of such type of ferroelectrics within the ferroelectric database and propose 2 candidates present in the Materials Project. Our results suggest new pathways to engineer small-band gap large-polarization ferroelectrics.
I Acknowledgments
This work was supported by ANID FONDECYT Regular grant number 1220986. Powered@NLHPC: This research was supported by the supercomputing infrastructure of the NLHPC (CCSS210001).
References
- You et al. (2018) L. You, F. Zheng, L. Fang, Y. Zhou, L. Z. Tan, Z. Zhang, G. Ma, D. Schmidt, A. Rusydi, L. Wang, L. Chang, A. M. Rappe, and J. Wang, Science Advances 4, 1 (2018).
- Tyunina et al. (2015) M. Tyunina, L. Yao, D. Chvostova, A. Dejneka, T. Kocourek, M. Jelinek, V. Trepakov, and S. Van Dijken, Science and Technology of Advanced Materials 16, 26002 (2015).
- Abel et al. (2013) S. Abel, T. Stöferle, C. Marchiori, C. Rossel, M. D. Rossell, R. Erni, D. Caimi, M. Sousa, A. Chelnokov, B. J. Offrein, and J. Fompeyrine, Nature Communications 4, 1671 (2013).
- Butler et al. (2015) K. T. Butler, J. M. Frost, and A. Walsh, Energy and Environmental Science 8, 838 (2015).
- Qin et al. (2008) M. Qin, K. Yao, and Y. C. Liang, Applied Physics Letters 93, 122904 (2008).
- Li et al. (2014) L. Li, P. A. Salvador, and G. S. Rohrer, Nanoscale 6, 24 (2014).
- Scott (2007) J. F. Scott, Science 315, 954 (2007).
- Sando et al. (2018) D. Sando, Y. Yang, C. Paillard, B. Dkhil, L. Bellaiche, and V. Nagarajan, Applied Physics Reviews 5, 041108 (2018).
- Hu et al. (2009) Z. Hu, M. Tian, B. Nysten, and A. M. Jonas, Nature Materials 8, 62 (2009).
- Han et al. (2022) X. Han, Y. Ji, and Y. Yang, Advanced Functional Materials 32, 2109625 (2022).
- Tan et al. (2022) B. Tan, A. M. Reyes, E. Menéndez-Proupin, S. E. Reyes-Lillo, Y. Li, and Z. Zhang, ACS Energy Letters 7, 3492 (2022).
- Zheng et al. (2015) F. Zheng, L. Z. Tan, S. Liu, and A. M. Rappe, Nano Letters 15, 7794 (2015).
- Wessels (2007) B. W. Wessels, Annual Review of Materials Research 37, 659 (2007).
- Young and Rappe (2012) S. M. Young and A. M. Rappe, Physical Review Letters 109, 116601 (2012).
- Dai and Rappe (2023) Z. Dai and A. M. Rappe, Chemical Physics Reviews 4, 011303 (2023).
- Daranciang et al. (2012) D. Daranciang, M. J. Highland, H. Wen, S. M. Young, N. C. Brandt, H. Y. Hwang, M. Vattilana, M. Nicoul, F. Quirin, J. Goodfellow, T. Qi, I. Grinberg, D. M. Fritz, M. Cammarata, D. Zhu, H. T. Lemke, D. A. Walko, E. M. Dufresne, D. A. Reis, K. Sokolowski-tinten, K. A. Nelson, A. M. Rappe, Y. Li, P. H. Fuoss, G. B. Stephenson, and A. M. Lindenberg, Physical Review Letters 108, 087601 (2012).
- Kreisel et al. (2012) J. Kreisel, M. Alexe, and P. A. Thomas, Nature Materials 11, 260 (2012).
- Seidel and Eng (2014) J. Seidel and L. M. Eng, Current Applied Physics 14, 1083 (2014).
- Kim et al. (2018) S. Kim, N. T. Nguyen, and C. W. Bark, Applied Sciences 8, 1526 (2018).
- Li et al. (2017) P. F. Li, Y. Y. Tang, W. Q. Liao, H. Y. Ye, Y. Zhang, D. W. Fu, Y. M. You, and R. G. Xiong, NPG Asia Materials 9, 1 (2017).
- Choi et al. (2012a) W. S. Choi, H. N. Lee, and T. M. Ti, Applied Physics Letters 3, 100 (2012a).
- Bennett and Rabe (2012) J. W. Bennett and K. M. Rabe, Journal of Solid State Chemistry 195, 21 (2012).
- Guo et al. (2013) R. Guo, L. You, Y. Zhou, Z. S. Lim, X. Zou, L. Chen, R. Ramesh, and J. Wang, Nature Communications 4, 1990 (2013).
- Grinberg (2020) I. Grinberg, Israel Journal of Chemistry 60, 823 (2020).
- Yang et al. (2012) X. Yang, X. Su, M. Shen, F. Zheng, Y. Xin, L. Zhang, M. Hua, Y. Chen, and V. G. Harris, Advanced Materials 24, 1202 (2012).
- Bennett et al. (2012) J. W. Bennett, K. F. Garrity, K. M. Rabe, and D. Vanderbilt, Physical Review Letters 109, 167602 (2012).
- Wang et al. (2015) F. Wang, I. Grinberg, L. Jiang, S. M. Young, P. K. Davies, and A. M. Rappe, Ferroelectrics 483, 1 (2015).
- Zhang et al. (2017) Y. Zhang, M. P. Sahoo, and J. Wang, Physical Chemistry Chemical Physics 19, 7032 (2017).
- Wang et al. (2014) F. Wang, I. Grinberg, and A. M. Rappe, Applied Physics Letters 104, 152903 (2014).
- Ghosh et al. (2021) P. S. Ghosh, J. Doherty, S. Lisenkov, and I. Ponomareva, Journal of Physical Chemistry C 125, 16296 (2021).
- Bonomi et al. (2018) S. Bonomi, I. Tredici, B. Albini, P. Galinetto, A. Rizzo, A. Listorti, A. Tamburini, and L. Malavasi, ChemComm 54, 13212 (2018).
- Yang et al. (2016) X. Yang, Y. Wang, H. Yan, and Y. Chen, Computational Materials Science 121, 61 (2016).
- Berger et al. (2011) R. F. Berger, C. J. Fennie, and J. B. Neaton, Physical Review Letters 107, 146804 (2011).
- Vonrüti and Aschauer (2018) N. Vonrüti and U. Aschauer, Physical Review Materials 2, 105401 (2018).
- Manzeli et al. (2015) S. Manzeli, A. Allain, A. Ghadimi, and A. Kis, Nano Letters 15, 5330 (2015).
- Reyes-Lillo et al. (2016) S. E. Reyes-Lillo, T. Rangel, F. Bruneval, and J. B. Neaton, Physical Review B 94, 041107 (2016).
- Birol and Fennie (2013) T. Birol and C. J. Fennie, Physical Review B - Condensed Matter and Materials Physics 88, 094103 (2013).
- Shimada et al. (2011) K. Shimada, A. Zenpuku, K. Fujiwara, K. Hazu, S. F. Chichibu, M. Hata, H. Sazawa, T. Takada, and T. Sota, Journal of Applied Physics 110, 074114 (2011).
- Qi et al. (2011) T. Qi, I. Grinberg, and A. M. Rappe, Physical Review B - Condensed Matter and Materials Physics 83, 224108 (2011).
- Islam and Podder (2021) M. N. Islam and J. Podder, Materials Science in Semiconductor Processing 121, 105419 (2021).
- Wang et al. (2022) Y. Wang, S. Bruyère, Y. Kumagai, N. Tsunoda, F. Oba, J. Ghanbaja, H. Sun, B. Dai, and J. F. Pierson, RSC Advances 12, 21940 (2022).
- Choi et al. (2012b) W. S. Choi, M. F. Chisholm, D. J. Singh, T. Choi, G. E. Jellison, and H. N. Lee, Nature Communications 3, 686 (2012b).
- He et al. (2017) J. He, C. Franchini, and J. M. Rondinelli, Chemistry of Materials 29, 2445 (2017).
- Parker et al. (2011) W. D. Parker, J. M. Rondinelli, and S. M. Nakhmanson, Physical Review B - Condensed Matter and Materials Physics 84, 245126 (2011).
- Fridkin (1979) V. M. Fridkin, Photoferroelectrics (Springer Berlin Heidelberg, 1979).
- Ma et al. (2020) X. Ma, L. Yang, K. Lei, S. Zheng, C. Chen, and H. Song, Nano Energy 78, 105354 (2020).
- Rus et al. (2016) S. F. Rus, T. Z. Ward, and A. Herklotz, Thin Solid Films 615, 103 (2016).
- Smidt et al. (2020) T. E. Smidt, S. A. Mack, S. E. Reyes-Lillo, A. Jain, and J. B. Neaton, Scientific Data 7, 72 (2020).
- Ricci et al. (2024) F. Ricci, S. E. Reyes-Lillo, S. A. Mack, and J. B. Neaton, npj Computational Materials 10, 1 (2024).
- Jain et al. (2013) A. Jain, S. P. Ong, G. Hautier, W. Chen, W. D. Richards, S. Dacek, S. Cholia, D. Gunter, D. Skinner, G. Ceder, and K. A. Persson, APL Materials 1 (2013).
- Jain et al. (2011a) A. Jain, G. Hautier, C. J. Moore, S. Ping Ong, C. C. Fischer, T. Mueller, K. A. Persson, and G. Ceder, Computational Materials Science 50, 2295 (2011a).
- Ong et al. (2013) S. P. Ong, W. D. Richards, A. Jain, G. Hautier, M. Kocher, S. Cholia, D. Gunter, V. L. Chevrier, K. A. Persson, and G. Ceder, Computational Materials Science 68, 314 (2013).
- Kresse and Furthmüller (1996a) G. Kresse and J. Furthmüller, Physical Review B - Condensed Matter and Materials Physics 54, 11169 (1996a).
- Kresse and Furthmüller (1996b) G. Kresse and J. Furthmüller, Computational Materials Science 6, 15 (1996b).
- Perdew et al. (1996) J. P. Perdew, K. Burke, and M. Ernzerhof, Physical Review Letters 18, 3865 (1996).
- Liechtenstein et al. (1995) A. I. Liechtenstein, V. Anisimov, and J. Zaanen, Physical Review B 52, 5467 (1995).
- Dudarev and Botton (1998) S. Dudarev and G. Botton, Physical Review B - Condensed Matter and Materials Physics 57, 1505 (1998).
- Kresse and Joubert (1999) G. Kresse and D. Joubert, Physical Review B - Condensed Matter and Materials Physics 59, 1758 (1999).
- Wang et al. (2006) L. Wang, T. Maxisch, and G. Ceder, Physical Review B - Condensed Matter and Materials Physics 73, 195107 (2006).
- Jain et al. (2011b) A. Jain, G. Hautier, S. P. Ong, C. J. Moore, C. C. Fischer, K. A. Persson, and G. Ceder, Physical Review B - Condensed Matter and Materials Physics 84, 045115 (2011b).
- Hinuma et al. (2017) Y. Hinuma, G. Pizzi, Y. Kumagai, F. Oba, and I. Tanaka, Computational Materials Science 128, 140 (2017).
- Herath et al. (2020) U. Herath, P. Tavadze, X. He, E. Bousquet, S. Singh, F. Muñoz, and A. H. Romero, Computer Physics Communications 251, 107080 (2020).
- Heyd et al. (2005) J. Heyd, G. E. Scuseria, M. Ernzerhof, J. Heyd, G. E. Scuseria, and M. Ernzerhof, The Journal of Chemical Physics 118, 8207 (2005).
- Heyd et al. (2006) J. Heyd, G. E. Scuseria, and M. Ernzerhof, Journal of Chemical Physics 124, 219906 (2006).
- Togo and Tanaka (2015) A. Togo and I. Tanaka, Scripta Materialia 108, 1 (2015).
- King-Smith and Vanderbilt (1993) R. D. King-Smith and D. Vanderbilt, Physical Review B 47, 1651 (1993).
- Didisheim et al. (1986) J. J. Didisheim, R. K. McMullan, and B. J. Wuensch, Solid State Ionics 18-19, 1150 (1986).
- Christensen et al. (1964) A. N. Christensen, R. Gronbek, and S. E. Rasmussen, Acta Chemica Scandinavica 18, 1261 (1964).
- Lehmann et al. (1970) M. S. Lehmann, F. K. Larsen, F. R. Poulsen, A. N. Christensen, S. E. Rasmussen, E. Sunde, and N. A. Sørensen, Acta Chemica Scandinavica 24, 1662 (1970).
- Endo et al. (1989) S. Endo, T. Chino, S. Tsuboi, and K. Koto, Nature 340, 452 (1989).
- Miyoshi et al. (2011) T. Miyoshi, H. Mashiyama, T. Asahi, H. Kimura, and Y. Noda, Journal of the Physical Society of Japan 80, 044709 (2011).
- Sueno et al. (1973) S. Sueno, J. J. Clark, J. J. Papike, and J. A. Konnert, American Mineralogist 58, 691 (1973).
- Wang et al. (2018) Z. Wang, A. A. Gaskell, M. Dopita, D. Kriegner, N. Tasneem, J. Mack, N. Mukherjee, Z. Karim, and A. I. Khan, Applied Physics Letters 112, 222902 (2018).
- Mattauch et al. (2004) S. Mattauch, G. Heger, and K. H. Michel, Crystal Research and Technology 39, 1027 (2004).
- Momma and Izumi (2008) K. Momma and F. Izumi, Applied Crystallography 41, 653 (2008).
- Lines and Glass (1977) M. E. Lines and A. M. Glass, Principles and Applications of Ferroelectrics and Related Materials (Clarendon Press Oxford University, 1977).
- Cancarevic et al. (2007) Z. Cancarevic, J. C. Schon, and M. Jansen, Chem. Eur. J. 13, 7330 (2007).
- Mori-Sánchez et al. (2008) P. Mori-Sánchez, A. J. Cohen, and W. Yang, Physical Review Letters 100, 146401 (2008).
- Krach et al. (2023) S. Krach, N. Forero-Correa, R. I. Biega, S. E. Reyes-Lillo, and L. Leppert, Journal of Physics Condensed Matter 35, 174001 (2023).
- Komatsu et al. (2006) K. Komatsu, T. Kuribayashi, A. Sano, E. Ohtani, and Y. Kudoh, Acta Crystallographica Section E: Structure Reports Online 62, 216 (2006).
- Van Aken et al. (2004) B. B. Van Aken, T. T. M. Palstra, A. Filippetti, and N. A. Spaldin, Nature materials 3, 164 (2004).