Globalping: A Community-Driven, Open-Source Platform for Scalable, Real-Time Network Measurements
Abstract
We present Globalping, an open-source, community-driven platform for scalable, real-time global network measurements. It democratizes access to network diagnostics by offering every user, including non-technicals, technicals, and companies, the ability to perform ping, traceroute, and DNS lookups from a globally distributed network of user-hosted probes using either the intuitive Globalping front-end or REST API. Unlike solutions like RIPE Atlas, official integrations with other platforms, such as Slack and GitHub, make Globalping even more effective in real-time monitoring and collaboration.
Index Terms:
Network Monitoring, Distributed Systems, Crowdsourced Testing, Internet Performance, Network Diagnostics, Cloud Computing, Remote Probes, Ping Testing, Traceroute Analysis, DNS Lookup, Latency Measurement, Network Troubleshooting, Geographically Distributed Nodes.I Introduction
With the expansion of global internet infrastructure in recent years, real-time network diagnostics and monitoring have become extremely important for both technical and non-technical users [8]. Most of the available diagnostic tools in the traditional sense serve a select few professionals rather than more general groups. This paper introduces Globalping, a community-driven, open-source platform that provides democratic access to scalable, real-time network measurements. Unlike similar tools, Globalping empowers all users, including experts and non-technicals, to carry out networking diagnostics such as ping, traceroute, and DNS lookups from a globally distributed network of user-hosted probes. Globalping seeks to bridge technical complexity with ease of use through an intuitive front end and REST API.
This paper presents the novel benefits of Globalping compared to existing tools like RIPE Atlas. It illustrates flexible, community-powered architecture, which makes it a valuable resource for real-time performance monitoring of the Internet and network troubleshooting. This paper makes the following contribution to the literature:
-
•
Presenting the only community-driven network diagnostic tool for every user base.
-
•
A comparative study on Globalping’s advantages over similar tools.
II Model Overview
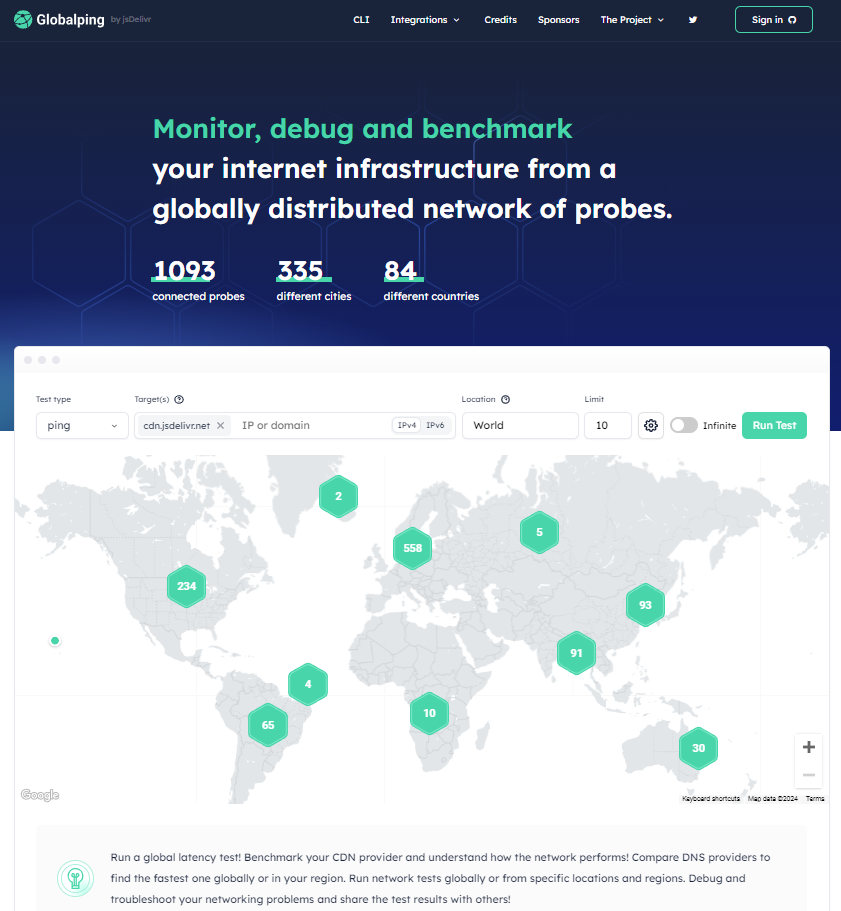
Users can utilize Globalping via its user interface (front end) on https://globalping.io/, REST API endpoints on https://api.globalping.io/v1, or CLI. Globalping’s front end focuses on simplicity by allowing anyone to run measurements by clicking the ”Run Test” button in Figure 1 after setting the parameters near that button. Users don’t even have to log in to run measurements. To the best of our knowledge, similar platforms, such as RIPE Atlas, don’t allow users to run measurements through their landing page without login.
Globalping’s CLI is a command-line tool to interact with Globalping’s REST API endpoints to carry out network measurements and authenticate using either a browser-based flow or a token. The CLI is helpful for scripting and maintaining a command history.
Globalping’s REST API uses HTTPS to perform network commands, such as ping or traceroute programmatically, and retrieve data for embedding Globalping functionality into user tools or dashboards. While the user has to poll Globalping’s HTTP endpoint continuously to get their measurement results, Globalping uses WebSockets internally, allowing real-time interaction for continuous monitoring with instantaneous presentation of data and measurement results at minimum latency.
Globalping is community-driven and utilizes users around the world to power its globally distributed probe infrastructure. Thus, it built an economy that rewards users with credits for hosting probes, and users could spend their credits to conduct measurements on other probes. Anonymous users who don’t host probes or have an account can still run measurements with a limit of 250 free tests per hour and 50 probes per measurement. When users run a measurement, they provide how many results they want. For instance, running ping measurements from 10 locations in Germany means users will request ten different probes in Germany, which will result in a ten-credit cost. Users with an account will have 500 free tests per hour and 500 probes per measurement. Users only need a GitHub account to sign in to increase their limit. Users can also earn 150 tests for each probe they host that remains online all day and receive more than 2000 tests per $1 donated.
II-A Measurement Capabilities
Users have to fill in two parameters to run most measurements: the target IP or URL and the origin location, say, Germany. Each measurement type has optional configurations that users can set programmatically or through the front end with the gear icon in Figure 1. For instance, the user can decide how many packets they want for their ping measurement. Without any configurations, Globalping’s most simple capabilities are:
-
•
Ping measurements output the RTT for a set of packets sent to and from a target IP address or domain. It outputs statistics, such as packet loss, RTT minimum, average, and maximum.
-
•
Traceroute measurements visualize a packet’s path to a target by showing each hop (router) taken en route with the timing taken to reach each hop.
-
•
HTTP measurements check the availability of a web service by sending GET or HEAD requests. It also measures the time for DNS resolution and TCP connection establishment with the web service.
-
•
Multi-hop measurement is similar to traceroute, showing the path taken by packets. In addition, they can measure other protocols, such as HTTP or TCP.
-
•
DNS measurements are similar to the domain information groper (dig) command. The measurements can verify and troubleshoot DNS problems and perform DNS lookups.
II-B Node Setup
We have used both terms, node, and probe, interchangeably throughout this paper. Globalping has a distributed architecture via a network of community-hosted nodes. Geographic diversity is a core feature of Globalping, as it enables users to conduct network performance measurements from a variety of locations around the world. Users need a server or virtual machine with at least one vCPU and 512 MB of RAM. Globalping only requires the user to install Docker and pull its image. If users need to set up multiple nodes, Globalping provides an automation script for the probe setup in Linux servers. Globalping also has a Podman alternative for users not using Docker.
II-C Official Integrations
Globalping comes with an official Slack integration that enables teams to run measurements and receive real-time updates, results, and probe statuses without having to leave their Slack channels. Such Slack integration enables collaborative troubleshooting and immediate sharing of results, keeping teams ahead in taking quick actions against issues in the network. There is also an official integration with the GitHub bot that can interact with the Globalping network in GitHub comments. Globalping developers are currently working on developing more integrations, including ChatGPT, Zapier, GitHub Action, IFTTT, and NetBox. A complete list of current and planned integrations is in the https://globalping.io/integrations web page.
III Implementation
Globalping’s main services are the Core API Server and Probe Management Module. The Core API Server follows a monolithic architecture with the Probe Management Module, meaning they’re a single service. Globalping also utilizes a front end, GeoIP Service, and Redis
III-A System Architecture Overview
The Core API Server contains the REST API endpoints for users to submit their measurement requests. It maintains the measurement settings and communicates with other services as the central server. The Core API Server uses the GeoIP Service to determine the location of IP addresses from geolocation providers like MaxMind, IPInfo, and Fastly. The Core API Server also uses Redis for various tasks, such as measurement results storage.
Besides REST API requests, the Core API Server can receive measurement requests from the front end, which is a web interface that allows users to set up their measurements and view the results. The front end interacts with the Core API Server’s REST API endpoints to visualize the measurement data.
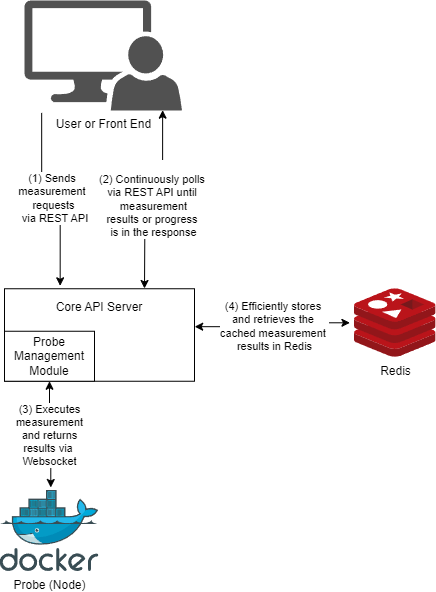
The front end initiates measurements by making REST API requests to the Core API Server. The Core API Server triggers the Probe Management Module. Globalping’s Probe Management Module manages a set of preconfigured and geographically distributed probes to execute the measurements. The Probe Management Module connects to a probe via WebSocket and sends the measurement job details. The probe executes the job and returns the result to the Probe Management Module via the WebSocket connection. The Probe Management Module delivers the results to the Core API Server, which returns them to the front end.
The front end receives real-time updates for user measurement requests from the Core API Server by polling its REST API endpoints every second. This polling technique is useful for displaying long-running measurements, such as traceroute or multi-hop, in real-time. The Core API Server uses Redis to cache and quickly handle the measurement results. The front end also uses Redis to manage login, sessions, and permissions with its separate API. Globalping’s complete workflow for measurement requests is in Figure 2. If the user doesn’t use the front end and made measurement requests to the Core API Server’s REST API directly, the user would have to continuously poll the Core API Server to get their results.
The Core API Server also utilizes Redis to handle the caching and storage of real-time updates on network measurement results, probe statuses, and geolocation information. Redis has the latest update regarding the status of the measurements, but only the Core API Server can store or retrieve data in it. The results have a time-to-live (TTL) set in Redis, which ensures that Globalping can handle multiple concurrent measurements. Redis is useful for fast lookups of frequently accessed data and keeping the state in sync across Globalping’s distributed components.
III-B Node Infrastructure and Management
Each node refers to one probe that executes the measurement request it receives from the Probe Management Module inside the Core API Server. Globalping deploys the probes with Docker containers, making them platform-agnostic and adaptable to cloud environments such as AWS. Whenever a new probe becomes online, it sends its IP address and unique node identifier to the Core API Server. The Core API Server will create a new record for it in its node registry and resolve its geographical information, including the probe’s city and country, using the GeoIP Service. Once a node has registered, it must send a regular heartbeat to the Probe Management Module to indicate that it is online. Otherwise, the Probe Management Module will mark it as offline.
If a developer wants to contribute to and debug Globalping nodes, they’d need to clone its repo and set the environment variables of the probe’s Docker container. The critical environment variables are API_HOST, ADMIN_KEY, and SYSTEM_API_KEY. These configurations tell the node which Core API Server’s Probe Management Module it needs to connect to and provide the credentials for authentication, which returns a session token to the node to avoid repeatedly sending its API key. The node initiates a WebSocket connection, which is the primary channel for all interactions, to the Probe Management Module. The setup instructions on Globalping documentation on the user interface and GitHub README include how to generate API keys, set environment variables, and properly configure the nodes.
III-C Measurement Scheduling and Assignment
III-C1 Measurement Request Handling
Users can trigger a measurement via Core API Server’s REST API endpoints with a POST request, the CLI, or the front end. All requests must have a set of parameters such as the measurement type (e.g., ping, traceroute), origin city, the URL of the target, and any options pertaining to the request. Globalping will validate each request and, if invalid, will return a 400 Bad Request response with information regarding which parameters are invalid and why. After the Core API Server validates each request, it en-queues the requests into Redis for prioritization based on priority rules. For example, authenticated users have higher priority. Once the measurement results are ready, Globalping makes them available for the user or front end for HTTP polling while logging every response and its outcome for auditing purposes.
III-C2 Measurement Assignment Algorithm
Globalping assigns measurements to probes by their location, availability, and capacity. In case any of the probes become unresponsive during measurement task scheduling, Globalping will move to other probes in the appropriate region. Probes also report their CPU and memory utilization so that Globalping can distribute tasks across probes evenly, ensuring that no node is overloaded. Globalping maintains a cap of the concurrent measurements a probe can receive.
III-D Measurement Execution
For pinging measurements, Globalping’s probes measure the RTT of packets. RTT is the sum of the time that packets take to go to the destination and come back to the source. Globalping sends several packets and records their statistics, such as packet losses, RTT minimums, averages, and maximums. Probes can also perform traceroute measurements by sending a set of packets with incremented TTLs. Each router (hop) along the packet path reduces the value of TTL. Once each packet’s TTL reaches zero, the router where the packet TTL becomes zero sends a message back to the originating probe. The message contains the router’s information, such as its geographical location. Traceroute uses these messages to record the packet’s path. In addition, Globalping can perform HTTP requests to check the availability of a website along with the response times by issuing a GET or HEAD request against an identified URL. Globalping’s HTTP requests can also track additional metrics such as time to DNS resolution and establishment of a TCP connection.
III-E Measurement Result Aggregation and Analysis
Many probes may execute a user’s measurements. Measurement results from probes exist as JSON objects. The probes send the measurement results along with their unique identifiers to the Probe Management Module, and the Core API Server sends them to Redis. A centric measurement repository combines them in Redis.
Globalping’s front end can visualize in real-time the measurement results. In the front end, a map will show the exact location of the probes executing the measurements and their packet latency, loss, and response times. Globalping can also integrate with Slack and GitHub to display measurement results in their workspaces or in GitHub log issues that are related to network performance.
III-F Scalability and Performance Optimization
Globalping uses load balancers that spread the incoming requests to multiple Core API Server instances, reducing the bottleneck risk. Globalping also monitors API performance and probe health using New Relic.
Globalping’s API can support concurrent requests through queuing and asynchronous processing. Globalping uses Redis for caching, reducing the database load with fewer reads. Probes can also automatically adjust how many measurements they handle based on their host machine’s CPU load.
III-G Security Considerations
Globalping has several countermeasures against malicious use of the probes. The probes will only issue an outgoing WebSocket connection to the Probe Management Module. There are no open ports on the probe, nor will it ever accept any incoming connections, limiting the risk of unauthorized access or attacks against the probe itself. The probes will only communicate with Probe Management Module and execute the measurement.
Because of the possibility of abuse, all users, by default, can only perform a few requests per minute to prevent DDoS. Globalping has up-to-date lists of domains and IP addresses known to host malware. These domains and private IP addresses are blocked to avoid malicious servers and to prevent unauthorized scanning of internal networks.
For resource management, volunteers can configure Docker to cap their CPU utilization; hence, no probe can ever overwhelm the host machine. Only one probe can run from one IP address to avoid misuse of resources and coordinated attacks. Globalping also logs access and usage patterns for probes.
IV Evaluation
| Official Integrations | Wider Target Audience | Community-Hosted Probes | Unlimited-Time Free Tier | Open Source | |
| RIPE Atlas | ✓ | ✓ | ✓ | ||
| PerfOps | ✓ | ||||
| Cedexis | |||||
| KeyCDN Tools | |||||
| Globalping | ✓ | ✓ | ✓ | ✓ | ✓ |
This section will present our comparative study. The closest tools we identified to Globalping are as follows:
-
•
RIPE Atlas
-
•
PerfOps
-
•
Cedexis
-
•
KeyCDN Tools
RIPE Atlas is a global Internet measurement network that collects information about Internet connectivity and reachability via thousands of probes around the world [2]. Users can also earn credits in RIPE Atlas by hosting probes and spending them by requesting measurements from RIPE Atlas, similar to Globalping.
Globalping and RIPE Atlas use a globally distributed network of community-hosted probes to perform ping, traceroute, and DNS resolution on target hosts from anywhere in the world [1, 2]. In addition, both have open-source components [1, 2]. RIPE Atlas also offers more sophisticated features that include custom measurements and anchoring probes for the constant monitoring of critical points on the Internet [1]. RIPE Atlas has over 12,000 probes spread across the globe, while Globalping is still developing at +1000 probes [6]. Researchers published an academic paper describing RIPE Atlas in 2015 [2]. This paper is the only scholarly work we found in the literature that is related to introducing a system that performs network diagnostics globally. Therefore, we were unable to create a dedicated ”Related Work” section in this paper.
Designwise, RIPE Atlas is more oriented toward research and academics [1]. Network engineers, researchers, and ISPs use it to make large-scale measurements [1]. On the other hand, Globalping values simplicity and ease of use for all users, including researchers and non-technicals [1]. Its primary use cases are benchmarking DevOps, monitoring CDN, and fast diagnostics by teams in real-time troubleshooting [1]. It aims for casual/commercial use and has official integrations for platforms such as Slack and GitHub [1]. We are not aware of any official integrations for RIPE Atlas. However, users can still build custom tools with RIPE Atlas API to send notifications or data to platforms such as Slack. Another shortcoming is that Bajpai et al. showed that RIPE Atlas probes’ AS-based distribution is heavily skewed, limiting measurement capabilities from a specific origin-AS [6]. We are not aware of a researcher indicating a similar shortcoming with Globalping.
In contrast to RIPE Atlas, PerfOps takes a more enterprise-oriented approach. PerfOps is a commercial network analytics tool that helps DNS and CDN providers troubleshoot their network by collecting performance metrics by measuring their resources [3]. The DigiCert company owns PerfOps, and it has over 300 testing servers around the globe [3]. PerfOps is more enterprise-oriented, offering companies comprehensive monitoring, benchmarking, and optimization of traffic routing across CDNs, DNS, and cloud services [3]. It targets enterprise users who need to make real-time decisions about multi-CDN strategies [3]. PerfOps helps optimize traffic and perform load balancing to assist companies in improving their content delivery through the analysis and comparison of various infrastructure providers [3]. On the other hand, Globalping focuses on targeting all users with a simple interface and low barrier of entry.
Another enterprise-oriented tool, Cedexis, is a SaaS-based internet traffic management platform designed to offer automated, predictive, and cost-optimal routing of application, video, and web content [4]. Cedexis has been a part of Citrix Systems since 2018. It enables enterprises to divert their traffic across any number of CDNs based on real-time performance metrics [4]. Core competencies for Cedexis include gathering real-time performance data and then using that information to make intelligent routing decisions to ensure users’ content comes from the fastest possible location [4].
KeyCDN Tools is a set of online tools that can help users analyze their website’s performance and identify connectivity issues [5]. It can perform similar operations to Globalping, such as pinging and traceroute [5]. Its tools also help web developers and IT admins who want to optimize their web delivery, troubleshoot CDN-related issues, and analyze HTTP performance [5]. Users don’t have to host probes on KeyCDN Tools or set up Docker containers. Instead, KeyCDN’s network contains all the probes. However, KeyCDN Tools only allow the traceroute operation from 14 locations, far less than Globalping’s capabilities [7]. Globalping thrives on its decentralized probe model, allowing it to boast a much more geographically diverse testing environment.
Finally, we created a simple comparison illustration for Globalping and its similar tools in Table I. We did not include extensive tools, such as Datadog, in our comparison. Datadog can conduct API tests from different regions around the world. However, its primary purpose is application monitoring rather than network diagnostics.
V Discussion
In our opinion, Globalping and RIPE Atlas have the most similar architecture due to their community-driven and open-source approach. While RIPE Atlas is more established and older, Globalping has unique benefits and use cases that RIPE Atlas may not cover. Globalping is a modern solution that focuses on user experience and casual/commercial use cases. Globalping developers worked on making its front end intuitive to target every user base, including experts. This focus also makes it easier for non-technical users to run measurements quickly, which makes Globalping more approachable to resource-constrained small businesses. They can lack technical experts, but the front end’s intuitive interface helps all users’s learning curve. In addition, RIPE Atlas requires at least $5000 to earn credits via donations while Globalping is only $1 [10].
Non-technical business users can also utilize Globalping’s official integrations instead of building their custom applications to get data into their workspaces. Although RIPE Atlas and Cedexis may have community-developed integrations, official integrations are more stable, secure, and reliable because they are supported and updated by the platform’s development team. Essentially, Globalping democratizes access for all users to network diagnostics from anywhere in the world.
We will not elaborate on Globalping’s advantages over PerfOps, KeyCDN Tools, and Cedexis as they target enterprises. We determined RIPE Atlas is the closest to Globalping although it targets a different user base, such as researchers. We also believe community-driven probes have a significant advantage over commercial ones. For instance, if Globalping or RIPE Atlas don’t have probes in a region, their admins can find a user there and incentivize them to host a probe. Globalping or RIPE Atlas is highly flexible and collaborative, hence fitting in teams that would need real-time, geographically distributed network testing.
Besides Globalping’s comparison with RIPE Atlas, its adoption is still growing. It has 1102 Probes across 339 cities. Globalping’s founder, Dmitriy Akulov, powers approximately 300 of these probes currently. However, the rest of the probes across 82 countries are community-hosted. The probes are also in 437 Autonomous System Numbers, indicating a high ISP reach. Researchers also used Globalping and published their findings as a bachelor’s thesis in the Faculty of Information Technology CTU in Prague [9].
In addition, Every day, users initiate more than 300000 measurements across Globalping’s API, front end, and the CLI. We have not measured which channel users utilize the most to request measurements. However, we have measured Globalping’s API’s response average time, which was less than 14 milliseconds, indicating low latency.
Finally, our future work for this paper includes conducting UX surveys, such as the System Usability Scale, Single Ease Question, and User Effort Score, to receive user feedback and make Globalping easier to use. We also plan on conducting additional quantitative studies to provide more robust evidence on Globalping’s low latency and ease of use.
VI Conclusion
Globalping enables technical and non-technical end-users to apply scalable, community-driven, open-source, and real-time network diagnostics. It is a globally distributed network of probes that allow users to conduct a wide range of network measurements like ping, traceroute, and DNS lookups from various diversified geographic locations. These features, in combination with official integrations like Slack and GitHub, help users who are both casual and in teams with real-time network troubleshooting. In comparison with similar tools, such as RIPE Atlas, Globalping targets all users, including experts and non-technicals, yet maintains robust capabilities for real-time monitoring and diagnostics. We believe Globalping is a valuable tool in performance measurement as it offers globally powerful and user-friendly solutions.
Acknowledgment
We thank Dmitriy Akulov for building and supporting this project.
References
- [1] Globalping, “RIPE Atlas and GlobalPing: Choosing the right network Measurement platform,” HackerNoon, Feb. 26, 2024. https://hackernoon.com/ripe-atlas-and-globalping-choosing-the-right-network-measurement-platform
- [2] Staff, RIPE Ncc, “Ripe atlas: A global internet measurement network,” Internet Protocol Journal, vol. 18, no. 3, pp. 2–26, 2015.
- [3] DigiCert, “Comprehensive overview of the PerFOPS platform,” 2024. [Online]. Available: https://www.digicert.com/content/dam/digicert/pdfs/perf-ops-overview.pdf
- [4] O. Hohlfeld, J. Rüth, K. Wolsing, and T. Zimmermann, “Characterizing a Meta-CDN,” in Lecture notes in computer science, 2018, pp. 114–128. doi: 10.1007/978-3-319-76481-8_9.
- [5] “KeyCDN Tools - Simplify problem resolution,” KeyCDN. https://tools.keycdn.com/
- [6] V. Bajpai, S. J. Eravuchira, and J. Schönwälder, “Lessons learned from using the RIPE Atlas platform for measurement research,” ACM SIGCOMM Computer Communication Review, vol. 45, no. 3, pp. 35–42, Jul. 2015, doi: 10.1145/2805789.2805796.
- [7] “KeyCDN Tools - Analyze website speed and Performance - KeyCDN,” KeyCDN. https://www.keycdn.com/blog/keycdn-tools-analyze-website-speed
- [8] F. Khan, L. Yuan, C.-N. Chuah, and S. Ghiasi, “A programmable architecture for scalable and real-time network traffic measurements,” Proceedings of the 4th ACM/IEEE Symposium on Architectures for Networking and Communications Systems, pp. 109–118, Nov. 2008, doi: 10.1145/1477942.1477958.
- [9] V. Šletr and prof. Ing. Pavel Tvrdík, CSc., “Performance impact of the EDNS Client Subnet Extension,” Bachelor’s thesis, Czech Technical University in Prague, Faculty of Information Technology, 2024. [Online]. Available: https://dspace.cvut.cz/bitstream/handle/10467/115552/F8-BP-2024-Sletr-Vojtech-thesis.pdf?sequence=-1&isAllowed=y
- [10] “Data and measurements sponsorship,” RIPE Network Coordination Center. https://www.ripe.net/analyse/data-and-measurements-sponsorship/