DiaMond: Dementia Diagnosis with Multi-Modal Vision Transformers
Using MRI and PET
Abstract
Diagnosing dementia, particularly for Alzheimer’s Disease (AD) and frontotemporal dementia (FTD), is complex due to overlapping symptoms. While magnetic resonance imaging (MRI) and positron emission tomography (PET) data are critical for the diagnosis, integrating these modalities in deep learning faces challenges, often resulting in suboptimal performance compared to using single modalities. Moreover, the potential of multi-modal approaches in differential diagnosis, which holds significant clinical importance, remains largely unexplored. We propose a novel framework, DiaMond, to address these issues with vision Transformers to effectively integrate MRI and PET. DiaMond is equipped with self-attention and a novel bi-attention mechanism that synergistically combine MRI and PET, alongside a multi-modal normalization to reduce redundant dependency, thereby boosting the performance. DiaMond significantly outperforms existing multi-modal methods across various datasets, achieving a balanced accuracy of 92.4% in AD diagnosis, 65.2% for AD-MCI-CN classification, and 76.5% in differential diagnosis of AD and FTD. We also validated the robustness of DiaMond in a comprehensive ablation study. The code is available at https://github.com/ai-med/DiaMond.
1 Introduction
Dementia presents a growing concern for individuals and society, with Alzheimer’s Disease (AD) constituting 60-80% of the cases and frontotemporal dementia (FTD) ranking as the second most common type in the younger-elderly population under 65 years old [33]. Accurately diagnosing AD and distinguishing it from other dementia types is crucial for patient management, therapy, and prognosis, but challenging as symptoms overlap. To address this challenge, a variety of diagnostic tools are employed, including magnetic resonance imaging (MRI), positron emission tomography (PET), and cognitive tests [1]. Structural MRI provides details on neuroanatomy for identifying regional atrophy, while fluorodeoxyglucose (FDG) PET tracks the distribution of glucose metabolism in the brain. Recent research into machine learning methods has revealed that using both MRI and PET scans improves the accuracy of diagnosing AD and distinguishing it from other types of dementia, compared to single-modality imaging [6]. In deep learning (DL), CNNs have been widely employed to combine these two modalities, but recent results pointed out that the combination may not surpass the efficacy of using PET alone [26]. The emergence of Transformers and attention mechanisms gives rise to a surge of new techniques in multi-modal AD diagnosis [35, 8, 31], yet they commonly integrate CNNs for initial feature extraction with vision Transformers (ViTs) for feature fusion, which may not fully exploit the multi-modal potential of ViTs. Moreover, although the main clinical objective for neuroimaging of dementia patients is differential diagnosis, current studies have been limited to consider one single type of dementia, namely AD [7, 30, 14].
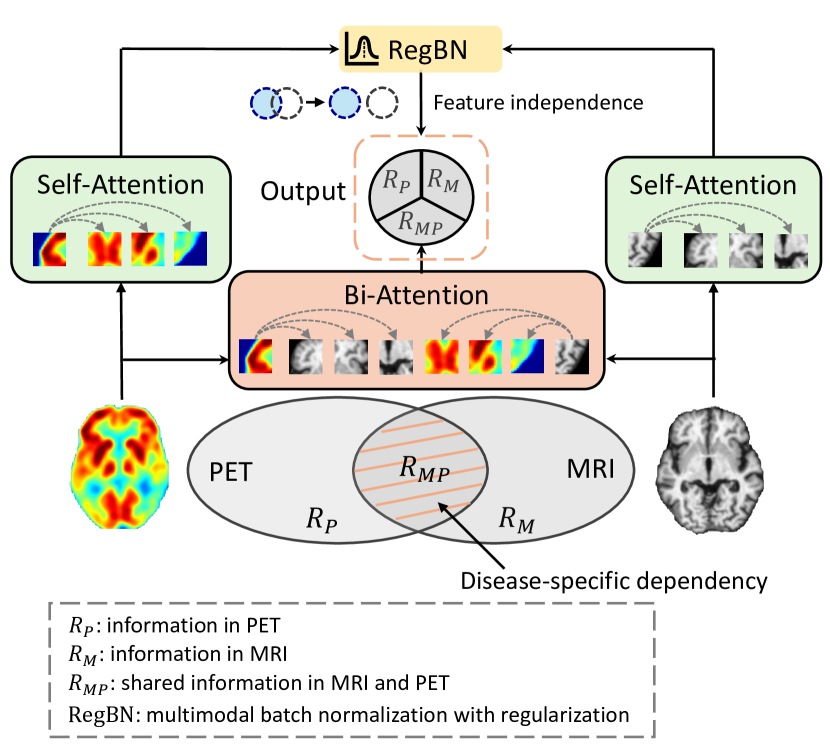
We address this gap by introducing DiaMond, a novel framework that leverages pure ViTs with multiple attention mechanisms for effective multi-modal classification, which exhibits high efficacy in both AD prediction and differential diagnosis of dementia. DiaMond consists of independent branches incorporating self-attention and bi-attention mechanisms, where the former extracts unique features from PET and MRI modalities independently while the latter exclusively captures correlations between modalities in their overlapping information, as illustrated in Fig. 1. Since the bi-attention block explicitly focuses on the potential similarity between modalities, we remove the redundant partial dependencies between modalities from the self-attention computation using the multi-modal normalization technique RegBN [10], enabling these branches to efficiently explore distinct features within each modality. Evaluated on three distinct medical datasets, DiaMond shows significant improvement not only in the classification of AD progression but also in the differential diagnosis between AD and FTD. In summary, our contributions are:
-
•
An efficient multi-modal classification framework using pure ViTs for feature extraction and interaction.
-
•
A novel bi-attention mechanism to exclusively explore the underlying similarities between PET and MRI data in high-dimensional feature space.
-
•
Integrating the multi-modal normalization technique RegBN to reduce redundant dependencies between multiple modalities for enhanced diagnosis accuracy.
-
•
Robustness of DiaMond evaluated on three distinct datasets for AD prediction and differential diagnosis of AD and FTD. DiaMond is the first method to leverage deep neural networks to enhance differential diagnosis of dementia with MRI and PET.
2 Related Work
Multi-Modal Learning for AD Diagnosis. Recent studies have advanced AD diagnosis by combining structural MRI and FDG-PET through various DL approaches. Different fusion strategies have been explored, including early [30, 20, 14, 32], middle [26, 36], and late fusion [26, 14, 7, 36]. Lu et al. [23] use a multiscale deep neural network to fuse the extracted patch-wise 1D features from MRI and PET. Liu et al. [21] propose a cascaded framework including multiple deep 3D-CNNs to learn from local image patches and an upper 2D-CNN to ensemble the high-level features. Feng et al. [7] combine a 3D CNN and LSTM with a late fusion of MRI and FDG-PET for AD diagnosis. Huang et al. [14] propose an early and a late fusion approach for the two modalities based on a 3D-VGG. Lin et al. [20] first propose a 3D reversible GAN for imputing missing data and then use a 3D CNN to perform AD diagnosis with channel-wise early fused MRI and PET data. Wen et al. [32] introduce an adaptive linear fusion method for MRI-PET fusion based on 2D CNNs. Song et al. [30] propose an early fusion approach by overlaying gray matter (GM) tissues from MRI with the FDG-PET scans and feeding them into a 3D CNN for classification. However, after investigating several multi-modal methods with 3D CNN across image-level early, middle, and late fusion of MRI and PET, Narazani et al. [26] find that the diagnostic performance of these existing multi-modal fusion techniques may not yet outperform that of using PET alone for AD diagnosis.
As Transformers and attention mechanisms have shown promising results in various medical imaging tasks [12, 4, 9], recent applications have started to integrate them for multi-modal feature fusion with CNNs as encoders for feature extraction [34, 17, 18, 8, 35, 25, 31]. Li et al. [18] combine a CNN and a Transformer module for multi-modal medical image fusion. Zhang et al. [34] propose an end-to-end 3D ResNet framework, which integrates multi-level features obtained by attention mechanisms to fuse the features from MRI and PET. Gao et al. [8] introduce a multi-modal Transformer (Mul-T) using DenseNet and spatial attention for global and local feature extraction, followed by cross-modal Transformers for T1-, T2-MRI, and PET fusion. Zhang et al. [35] use MRI and PET for dementia diagnosis by first employing adversarial training with CNN encoders for feature extraction, then applying Transformers through the cross-attention mechanism for feature fusion and finally classification with a fully-connection layer. Miao et al. [25] propose a multi-modal multi-scale transformer fusion network (MMTFN), combining CNN-based residual blocks and Transformers to jointly learn from multi-modal data for diagnosing AD. Tang et al. [31] first employ a 3D CNN to extract deep feature representations of structural MRI and PET images, then utilize an improved Transformer to progressively learn the global correlation information among features. Note that these recent approaches typically combine CNNs for initial feature extraction with ViTs for feature fusion, which may not fully leverage the capabilities of ViTs for multi-modal learning.
Differential Diagnosis of Dementia. Despite the extensive research focused on AD diagnosis, there has been limited exploration in multi-modal learning for differential diagnosis of dementia, which holds significant importance in clinical practices [5]. Current research in differential diagnosis primarily adopts machine learning algorithms [6, 11, 3] or focuses on single modality [19, 27], yet the potential of employing multi-modal deep neural networks for this purpose remains unexplored.
3 Proposed Method
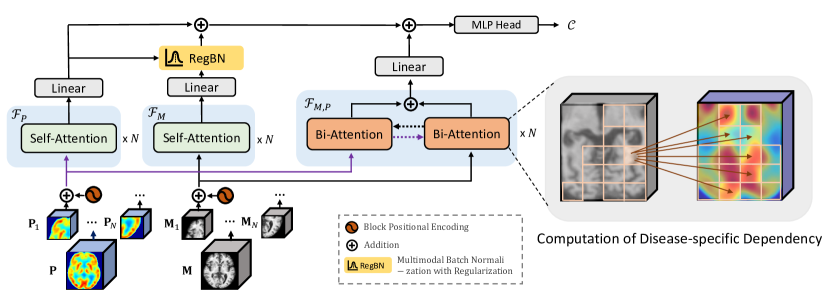
Fig. 2 presents the main steps of DiaMond, a multi-modal ViT-based framework incorporating multiple attention mechanisms for effective dementia diagnosis. We begin by outlining the foundational concepts underlying our approach and subsequently delve into the specifics of each component.
3.1 Preliminaries
Let’s denote the 3D MRI and PET images as and respectively, with height , width , and depth . The objective is to classify the given multi-modal data into a set of labels . In this study, includes CN (Cognitively Normal), MCI (Mild Cognitive Impairment), AD, and FTD labels. MRI and PET data exhibit inherent dependencies that can be introduced during data collection and revealed in high-dimensional feature space. Hence, we divide the data space into three non-overlapping regions denoted by , as highlighted in Fig. 1. Our proposed framework DiaMond consists of three branches based on pure ViTs to process each of the data space:
-
1.
maps input MRI from data space (Fig. 1) into the latent encoding with length ;
-
2.
maps PET from data space into the latent encoding of length ;
-
3.
receives both MRI and PET, then captures their shared information in data space , and finally maps those to the latent encoding of length .
We extract regions using self-attention mechanisms, together with a recently-developed normalization technique RegBN [10] to ensure feature independence. A novel bi-attention mechanism is introduced to explore the similarities between the two modalities in region .
3.2 Self-Attention for Single Modality
and operate over single modalities separately with self-attention mechanisms. Let and be partitioned into voxel patches , where denotes the length of the feature embedding, and the number of input patches. The input patch is projected into the query , key , and value matrices, giving:
| (1) |
Let denote transpose, the self-attention for a single modality is defined as
| (2) |
Each self-attention branch aims to independently extract unique features from one input modality. To ensure that each branch efficiently identifies distinct modality-dependent features, a normalization technique RegBN [10] is later applied to the latent space, aiming to reduce redundant partial dependency between the self-attention branches.
3.3 Bi-Attention for Multiple Modalities
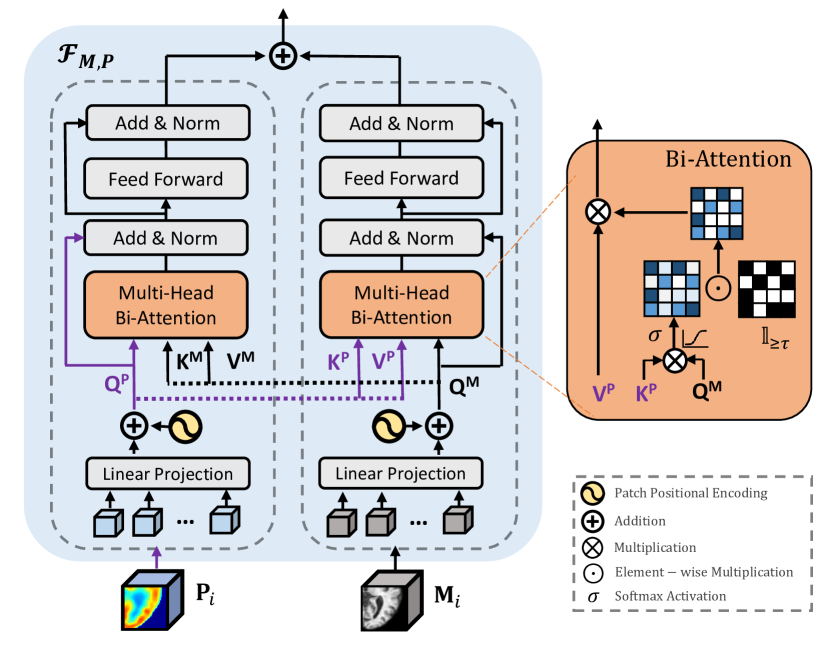
A novel bi-attention mechanism is introduced in to compute the interweaved attention between two modalities , uniquely designed to focus on capturing their similarities in the high-dimensional feature space:
| (3) |
| (4) |
where , , and . is the indicator function to threshold the correlation matrix between the features of the two modalities to be above a constant threshold . Note that . Illustrated in Fig. 3, the bi-attention blocks aim to produce features for each modality conditioned on the other, targeting on their potential disease-specific similarities. Distinct from the conventional cross-attention mechanism, which captures both similarities and dissimilarities between patches in the correlation matrices, our proposed bi-attention selectively preserves only the pronounced similarities, resulting in a sparse representation. This sparsity is achieved by applying a constant threshold to the correlation matrix between the query and key matrices from two modalities, filtering out negligible values. This mechanism enables efficient capture of dependencies between modalities for improved diagnostic accuracy and robustness, as validated in Sec. 6.1 & 6.3.
3.4 RegBN for Dependency Removal
RegBN is a normalization method devised for dependency and confounding removal from low- and high-level features before fusing those [10]. As discussed earlier, MRI and PET input images are mapped into latent space, represented as for MRI and for PET. Dependencies between modalities are present during image acquisition; thus, such information can be transferred to the latent space, as illustrated by in Fig. 1. Since the proposed bi-attention block focuses explicitly on the underlying similarities between input modalities via the self-attention modules, it is essential to eliminate redundant shared information between them. Otherwise, the neural network may primarily optimize within the overlapped region , increasing the risk of getting trapped in local minima. Thus, we use RegBN to separate the latent encoding from .
RegBN represents one latent encoding in terms of another using a linear regression model:
| (5) |
in which is a projection matrix, and denotes the difference between the input latent encodings, so-called residual. The residual segment contains a portion of that is independent from . RegBN uses the Frobenius norm as a regularizer to minimize over mini-batches. As demonstrated in Sec. 6.2, RegBN enables a neural network to integrate data from all three non-overlapping regions , leading to improved diagnosis performance. The issue of falling into the redundant overlapping region regularly occurs in multi-modal data learning, yet is often overlooked despite its potential side effects.
In the final step, the attention maps from all three branches , , and pass through the feed-forward network and yield their latent feature vectors respectively. All latent vectors of the three branches are then summed and unified through an MLP layer to obtain the diagnostic label, i.e., .
3.5 Backbone Architecture
We adopt a 3D multiple instance neuroimage Transformer [28] as our backbone, while it is straightforward to generalize the backbone to any 3D ViT architecture. The adopted backbone is a convolution-free Transformer-based architecture inspired by the multiple instance learning paradigm. Given the input image, the backbone first splits it into non-overlapping cubiform blocks , where , , and denotes the block size. Each is then treated as one instance to be fed into the Transformer encoder independently. Learned block positional embeddings will be added to each , aiming to preserve the positional information of each block within the whole image. The Transformer encoder consists of Transformer layers. Each of the layers contains either a multi-head self-attention block or a multi-head bi-attention block, followed by a feed forward network including two linear projections with Gaussian Error Linear Units (GELU) non-linearity [13] applied in between. We apply layer normalization [2] before each block, and residual connections after each block within a Transformer layer.
4 Experiment Setup
Dataset and Preprocessing: We use paired FDG-PET and T1-weighted MRI scans from three datasets:
-
1.
Alzheimer’s disease neuroimaging initiative (ADNI) database [16], including 379 CN, 257 AD, and 611 MCI samples.
-
2.
Japanese Alzheimer’s Disease Neuroimaging Initiative (J-ADNI) database [15], including 104 CN, 78 AD, and 124 MCI samples.
-
3.
In-house clinical dataset containing two types of dementia, with 143 CN, 110 AD, and 57 FTD samples, from Klinikum rechts der Isar, Munich, Germany.
Due to the lack of a public multi-modal dataset for both AD and FTD subjects, we evaluate the differential diagnosis on a well-characterized, single-site in-house clinical dataset from Klinikum rechts der Isar, Munich, Germany. Tab. 1 reports statistics of all used datasets. Only scans from baseline visits are selected. We extract the gray matter (GM) density maps from MRI as input. All scans were normalized, registered to the MNI152 template with voxel size, and rescaled to the intensity range between 0 and 1, with the final size of 128 × 128 × 128.
To avoid biased results due to data leakage and confounding effects, we split the data using only baseline visits and ensure that diagnosis, age, and sex are balanced across sets. Further information on data preprocessing and splitting can be found in Sec. A.1.
| Dataset | Diagnosis | # Samples | % Female | Age |
|---|---|---|---|---|
| ADNI | CN | 379 | 50.92 | 73.46 5.93 |
| AD | 257 | 40.47 | 74.41 7.89 | |
| MCI | 611 | 41.41 | 72.31 7.30 | |
| J-ADNI | CN | 104 | 51.66 | 68.38 5.64 |
| AD | 78 | 57.05 | 74.03 6.53 | |
| MCI | 124 | 50.21 | 73.25 5.86 | |
| In-House | CN | 143 | 46.85 | 64.14 9.97 |
| AD | 110 | 50.00 | 67.25 8.37 | |
| FTD | 57 | 38.60 | 65.25 9.66 |
Baselines:
First, we compare DiaMond against single-modality inputs by employing a 3D ResNet [26] or a 3D neuroimage ViT [28] as the backbone.
Subsequently, we compare alternative multi-modal fusion techniques, including early, late, and middle fusion [26], using both backbones. In the end, we compare with the latest fusion methods Mul-T [8] and MMTFN [25].
Network Parameters:
The ViT-based backbone of DiaMond adopts a patch size of 8, a feature embedding dimension of 512, 8 attention heads, a model depth of 4, and a dropout rate of 0.0.
These parameters were selected after an exhaustive search and comparison using the validation set, with detailed information and results presented in Sec. 6.4.
Miscellaneous:
We implement models with PyTorch, using the AdamW [22] optimizer with a learning rate of , a weight decay of , a batch size of , and cosine annealing as the learning rate scheduler. The models are trained on one NVIDIA A100 GPU with 40 GByte memory for 3,800 iterations, with early-stop to prevent overfitting. Tab. A.2
reports the detailed hyperparameters.
Evaluation: We perform 5-fold cross-validation, partitioning each dataset into training, validation, and test sets with ratios of 65%, 15%, and 20% respectively. We train all models for three different tasks:
-
1.
Binary classification of healthy controls (CN) vs. patients with AD.
-
2.
Three-way classification of CN vs. MCI vs. AD.
-
3.
Three-way classification of CN vs. AD vs. FTD.
We use balanced accuracy (BACC) and area under the ROC curve (AUC) to evaluate the results for binary classification. For the three-way classification, we adopt BACC, F1-Score, Precision, and Recall. In addition, we illustrate the fairness evaluation on DiaMond across different demographics.
5 Results
| Data | Method | Modality | CN vs. AD | CN vs. MCI vs. AD | ||
|---|---|---|---|---|---|---|
| BACC | AUC | BACC | F1-Score | |||
| ADNI | 3D-ResNet [26] | 86.59 4.22 | 93.67 2.43 | 53.58 6.20 | 53.70 6.16 | |
| 3D-ResNet [26] | 89.07 2.67 | 95.19 2.22 | 54.84 3.40 | 55.79 4.22 | ||
| 3D-ViT [28] | 86.22 3.83 | 93.66 2.50 | 60.83 7.41 | 60.03 7.45 | ||
| 3D-ViT [28] | 88.75 1.69 | 93.53 1.39 | 58.24 4.64 | 53.20 4.41 | ||
| ResNet-based early-fusion[30] | + | 82.66 2.40 | 85.58 7.29 | 57.30 2.30 | 55.79 1.02 | |
| ResNet-based middle-fusion[26] | + | 82.63 7.04 | 88.17 6.77 | 53.01 3.40 | 53.70 6.16 | |
| ResNet-based late-fusion[26] | + | 89.74 1.98 | 96.73 0.92 | 57.71 2.90 | 58.89 1.73 | |
| ViT-based early-fusion | + | 89.20 3.29 | 94.87 1.80 | 62.89 2.08 | 59.84 0.73 | |
| ViT-based late-fusion | + | 90.60 3.57 | 96.48 1.24 | 61.86 3.00 | 59.60 5.83 | |
| Mul-T [8] | + | 86.37 3.25 | 93.59 1.54 | 56.49 3.82 | 55.54 3.94 | |
| MMTFN [25] | + | 88.76 1.98 | 93.69 1.95 | 63.11 4.51 | 60.51 3.49 | |
| DiaMond (Ours) | + | 92.42 2.63 | 97.11 1.47 | 65.18 1.57 | 64.89 2.78 | |
| J-ADNI | 3D-ResNet [26] | 84.66 2.92 | 91.40 3.16 | 56.89 1.64 | 54.87 1.83 | |
| 3D-ResNet [26] | 85.48 9.87 | 92.22 4.51 | 50.87 12.8 | 46.16 18.7 | ||
| 3D-ViT [28] | 83.65 4.15 | 92.26 1.29 | 55.11 1.62 | 47.71 5.23 | ||
| 3D-ViT [28] | 89.42 3.08 | 96.14 1.16 | 51.77 5.45 | 51.32 4.74 | ||
| ResNet-based early-fusion[30] | + | 86.02 6.85 | 91.61 3.82 | 53.46 3.92 | 53.28 3.70 | |
| ResNet-based middle-fusion[26] | + | 77.73 8.97 | 74.12 6.78 | 49.48 2.85 | 43.94 7.39 | |
| ResNet-based late-fusion[26] | + | 88.81 3.36 | 94.85 1.79 | 50.20 6.23 | 48.90 6.50 | |
| ViT-based early-fusion | + | 89.59 3.68 | 93.86 2.98 | 54.68 5.32 | 52.25 3.42 | |
| ViT-based late-fusion | + | 86.70 7.73 | 96.34 2.42 | 54.07 5.80 | 50.83 4.89 | |
| Mul-T [8] | + | 81.02 6.08 | 88.45 2.96 | 50.04 7.28 | 45.66 8.46 | |
| MMTFN [25] | + | 86.74 6.05 | 84.27 7.91 | 57.55 2.81 | 53.45 6.97 | |
| DiaMond (Ours) | + | 91.72 2.52 | 96.20 2.50 | 58.44 3.61 | 58.88 1.73 | |
5.1 Alzheimer’s Prediction
We compare DiaMond with other baseline methods for the task of Alzheimer’s prediction on two different datasets. Tab. 2 reports the results for both binary (CN vs. AD) and three-way (CN vs. MCI vs. AD) classification on ADNI and J-ADNI datasets, respectively. For binary classification, PET scans generally yield better results than MRI as a single modality input, reaching a BACC of 89% on ADNI and 89.4% on J-ADNI, whereas MRI only achieves a BACC of 86.6% on ADNI and 84.7% on J-ADNI at the largest. Early, middle, and late fusion methods, together with Mul-T [8] and MMTFN [25], regardless of using ResNet or ViT as the backbone structure, can only achieve on-par performance as PET alone, which is aligned with the conclusion in [26], as the diagnostic performance of existing multi-modal fusion methods may not yet outperform that of using PET alone. On the contrary, DiaMond outperforms all other methods and single modality input by a large margin for both datasets, achieving a BACC of 92.4% in ADNI, and 91.7% in J-ADNI.
As for the three-way classification between CN, AD, and MCI, despite an overall performance decline due to the complexity of MCI as a syndrome, DiaMond consistently surpasses all other methods, achieving a notable BACC of 65.2% on the ADNI dataset. The results highlight the effectiveness of the multi-modal fusion mechanisms employed in DiaMond. The high and consistent accuracy is likely achieved through the efficient feature extraction and integration enabled by the attention mechanisms in our ViT-based framework.
5.2 Differential Diagnosis of Dementia
Further, we conduct a three-way differential diagnosis of dementia, between subjects of CN, AD, and FTD. This task is challenging due to the overlapping symptoms between different types of dementia; however, it is highly important due to its distinctive clinical value [5]. Tab. 3 reports the results of DiaMond and other baseline methods on this task.
When using single modalities as input, MRI only achieves a BACC of 56.7% with ResNet, and 66.0% using ViT as backbone. PET can achieve a BACC of 68.7% with ResNet and 69.5% with ViT, confirming its higher sensitivity in the differential diagnosis. Using multi-modal input of both MRI and PET can elevate the diagnostic accuracy compared to using single modality alone, particularly when employing the late fusion strategy using either ResNet or ViT, achieving a BACC of 73.2% and 74.1%, respectively. Recent fusion methods Mul-T [8] and MMTFN [25] combine CNNs for feature extraction with ViTs for fusion, however, their performance falls short compared to pure ViT-based late fusion. Notably, utilizing ViT as the backbone consistently outperforms ResNet in differential diagnosis, whether employing a single modality or multiple modalities as input. In the end, applying DiaMond further boosts the diagnostic accuracy to more than 2%, reaching the highest BACC of 76.5%. These outcomes confirm the efficacy of Transformers, particularly the efficient use of attention mechanisms in DiaMond, in effectively integrating multi-modal data for the challenging task of differential diagnosis of dementia, highlighting its substantial clinical value.
| Method | Modality | CN vs. AD vs. FTD | |||
|---|---|---|---|---|---|
| BACC | F1-Score | Precision | Recall | ||
| 3D-ResNet [26] | 56.73 4.12 | 55.32 5.28 | 64.20 5.62 | 56.62 4.92 | |
| 3D-ResNet [26] | 68.68 5.84 | 69.07 6.81 | 69.97 3.96 | 68.23 5.07 | |
| 3D-ViT [28] | 65.99 6.58 | 62.58 7.81 | 63.46 8.50 | 65.30 5.28 | |
| 3D-ViT [28] | 69.47 5.05 | 69.53 5.84 | 69.81 3.88 | 69.20 5.87 | |
| ResNet-based early-fusion [30] | + | 55.06 6.55 | 53.10 6.61 | 61.72 6.07 | 54.87 5.03 |
| ResNet-based middle-fusion [26] | + | 50.83 11.3 | 43.64 15.5 | 55.12 12.6 | 51.56 11.4 |
| ResNet-based late Fusion [26] | + | 73.19 3.81 | 73.87 4.26 | 74.90 3.44 | 73.28 4.67 |
| ViT-based early-fusion | + | 71.04 5.00 | 72.32 5.40 | 75.50 3.92 | 70.89 5.63 |
| ViT-based late-fusion | + | 74.06 3.15 | 73.14 6.56 | 71.62 4.07 | 74.42 6.53 |
| Mul-T [8] | + | 70.84 4.27 | 70.70 3.94 | 72.43 5.01 | 72.91 4.11 |
| MMTFN [25] | + | 72.74 3.80 | 68.94 3.91 | 71.97 3.09 | 71.41 3.14 |
| DiaMond (Ours) | + | 76.46 3.33 | 75.53 4.38 | 76.76 4.88 | 75.39 3.23 |
5.3 Fairness Evaluation
Ensuring fairness is a paramount consideration in the domain of medical imaging. DL models employed in medical applications must minimize biases towards specific demographic groups, such as age, gender, and diagnostic labels. In this regard, we evaluate the fairness of the diagnostic results produced by DiaMond on the ADNI dataset for AD prediction, by examining its test accuracy across diverse patient cohorts. The results presented in Tab. 4 indicate that DiaMond achieves minimal variance in the diagnostic accuracy across different demographic categories, suggesting a uniform and equitable performance.
| Demographics | Groups | BACC (%) |
| Age | 65 | 93.04 4.53 |
| 65 - 70 | 91.79 8.11 | |
| 70 - 75 | 93.20 4.21 | |
| 75 - 80 | 90.13 2.07 | |
| 80 | 90.44 3.93 | |
| Gender | Male | 92.52 3.40 |
| Female | 91.71 3.93 | |
| Diagnosis | CN | TPR = 94.46 |
| AD | TPR = 89.49 | |
| Total | 92.42 2.63 | |
6 Ablation Study
We conduct a comprehensive ablation study on the important components in DiaMond. This includes evaluating the inclusion of different ViT branches (self- and bi-attention), the integration of RegBN, and the application of the attention threshold in our bi-attention design. In the end, we include the ablation on the network parameters.
6.1 Different Branches
DiaMond comprises three independent ViT branches: with MRI as input, with PET, and receives both MRI and PET as input simultaneously. To validate the efficacy of the three branches in DiaMond, we conduct ablation studies on each of the branch and their different combinations. As shown in Tab. 5, using or alone achieves a BACC of 86.2% and 88.8%, respectively, indicating that PET is slightly more effective as a single modality input. The model achieves a BACC of 90.87% when it relies solely on the branch, suggesting the high benefits from our introduced bi-attention mechanism for integrating multiple modalities. The efficacy of the combination of multiple attention mechanisms is further evidenced when is combined alongside either or , resulting in BACC scores of 91.0% and 91.5%, respectively. Finally, combining all three branches, as in our final DiaMond framework, achieves the highest BACC of 92.4%, confirming the synergistic effect of DiaMond with self- and bi-attention interaction.
| Modality | BACC (%) | |||
|---|---|---|---|---|
| ✓ | 86.22 3.83 | |||
| ✓ | 88.75 1.69 | |||
| ✓ | + | 90.87 3.68 | ||
| ✓ | ✓ | + | 91.02 2.48 | |
| ✓ | ✓ | + | 91.77 2.05 | |
| ✓ | ✓ | + | 91.45 2.89 | |
| ✓ | ✓ | ✓ | + | 92.42 2.63 |
6.2 Integration of RegBN
RegBN is incorporated into DiaMond as a normalization technique to make self-attention branches independent, aiming to reduce the redundant partial dependency between the input modalities. We further evaluate the impact of RegBN in our model. As shown in Tab. 6, the performance of DiaMond is affected by the presence of RegBN across all three datasets, with this normalization method enhancing classification results by up to 2%. This improvement underscores two key issues in multi-modal classification. First, partial dependency and confounders in multi-modal data can mislead a classification neural network, causing it to fall into the overlapped region. Second, RegBN demonstrates a unique ability to counteract the negative impact of overlapping data, thereby contributing to a more efficient and robust framework. As discussed in previous sections, the classification of multi-modal data may differ from that of single-modal data due to the heterogeneous nature of multi-modal data sources, which can exhibit positive or negative correlations affecting the distributions of learned features [29, 24]. This study demonstrates and substantiates that accounting for the data space of each modality in classification leads to significant improvements in results. This topic has received limited attention and study thus far. Importantly, recent deep learning methods have shown an increased focus on multi-modal analysis, and the strategy employed in our model for managing multi-modal data demonstrates significant potential for future research.
| BACC | CN vs. MCI vs. AD | CN vs. AD vs. FTD | |
|---|---|---|---|
| ADNI | J-ADNI | ||
| w/o RegBN | 63.97 3.11 | 56.35 3.49 | 74.32 5.80 |
| w/ RegBN | 65.18 1.57 | 58.44 3.61 | 76.46 3.33 |
6.3 Bi-Attention Threshold
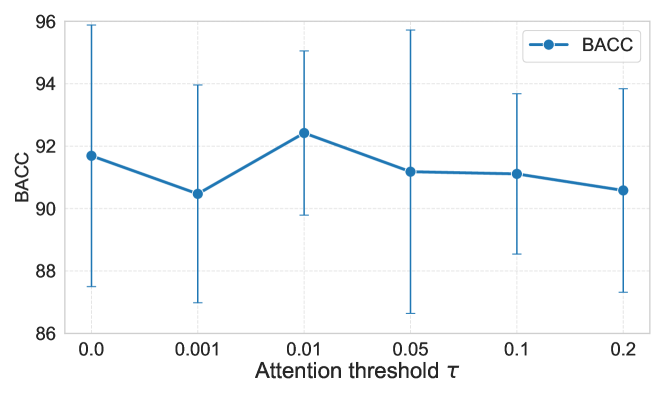
We use a constant threshold in Eq. 3 to filter out very small values in the correlation matrices within the bi-attention block, so that it focuses primarily on similarities between modalities. As illustrated in Fig. 4, a value of approximately 0.01 typically results in better and more stable performance. In contrast, having no threshold (, equals to a conventional cross-attention mechanism) or setting the threshold too high causes a drop in performance or high variation in the outcomes. Thus, including an optimal attention threshold is crucial for the bi-attention block, as it reduces the redundancy of learning repetitive features as captured in the self-attention blocks, and efficiently helps to focus on the dependencies between modalities.
6.4 Network Parameters
We conduct ablation studies on the network parameters, performing an exhaustive search over the following parameters: patch size in {4, 8}, embedding dimension in {128, 256, 512, 1024}, number of attention heads in {8, 16}, model depth in {1, 2, 4, 8}, and dropout rate in {0, 0.2, 0.5}. We use the validation set to compare different configurations, with the results presented in Tab. 7. As a result, the combination of a patch size of 8, a feature dimension of 512, 8 heads, a depth of 4, and a dropout rate of 0.0 yields the highest validation accuracy. Therefore, we adopt these parameters for all experiments.
| Patch Size | Embedding dim. | #Heads | Depth | Dropout rate | BACC (%) | ||||||||||
| 4 | 8 | 128 | 256 | 512 | 1024 | 8 | 16 | 1 | 2 | 4 | 8 | 0 | 0.2 | 0.5 | |
| ✓ | ✓ | ✓ | ✓ | ✓ | 91.71 1.42 | ||||||||||
| ✓ | ✓ | ✓ | ✓ | ✓ | 89.25 3.41 | ||||||||||
| ✓ | ✓ | ✓ | ✓ | ✓ | 92.43 2.56 | ||||||||||
| ✓ | ✓ | ✓ | ✓ | ✓ | 93.19 2.55 | ||||||||||
| ✓ | ✓ | ✓ | ✓ | ✓ | 93.75 2.52 | ||||||||||
| ✓ | ✓ | ✓ | ✓ | ✓ | 90.88 1.81 | ||||||||||
| ✓ | ✓ | ✓ | ✓ | ✓ | 91.79 3.72 | ||||||||||
| ✓ | ✓ | ✓ | ✓ | ✓ | 89.81 2.78 | ||||||||||
| ✓ | ✓ | ✓ | ✓ | ✓ | 91.61 1.23 | ||||||||||
| ✓ | ✓ | ✓ | ✓ | ✓ | 91.90 3.20 | ||||||||||
| ✓ | ✓ | ✓ | ✓ | ✓ | 91.79 3.32 | ||||||||||
| ✓ | ✓ | ✓ | ✓ | ✓ | 91.60 3.54 | ||||||||||
| ✓ | ✓ | ✓ | ✓ | ✓ | 90.72 1.91 | ||||||||||
| ✓ | ✓ | ✓ | ✓ | ✓ | 92.69 2.36 | ||||||||||
| ✓ | ✓ | ✓ | ✓ | ✓ | 91.79 3.72 | ||||||||||
| ✓ | ✓ | ✓ | ✓ | ✓ | 91.40 3.21 | ||||||||||
| ✓ | ✓ | ✓ | ✓ | ✓ | 91.15 1.92 | ||||||||||
| ✓ | ✓ | ✓ | ✓ | ✓ | 92.12 3.40 | ||||||||||
7 Conclusion
We introduced DiaMond, a ViT-based framework for Alzheimer’s prediction and differential diagnosis of dementia using MRI and PET. DiaMond effectively learns from multi-modal data via self- and a novel bi-attention mechanism from a pure ViT backbone. The self-attention mechanism extracts distinct features from individual modalities, along with a normalization strategy to ensure feature independence; our novel bi-attention mechanism exclusively focuses on the similarities between multiple modalities, aiming to capture their disease-specific dependency. Across three distinct datasets, DiaMond consistently outperformed all competing methods, achieving a balanced accuracy of 92.4% for AD-CN classification, 65.2% for AD-MCI-CN classification, and 76.5% for differential diagnosis between AD, FTD, and CN subjects, highlighting its significant clinical value. We evaluated the fairness of our model, which indicated equitable performance across various demographic groups. Our comprehensive ablation study validated DiaMond’s robustness and synergistic effect of integrating multiple modalities with its intricate design. Overall, DiaMond demonstrated that leveraging the attention mechanisms in vision Transformers offers superior fusion compared to CNNs [26], enabling the combination of MRI and PET to significantly surpass the accuracy of PET alone.
Acknowledgements
This work was supported by the Munich Center for Machine Learning (MCML) and the German Research Foundation (DFG). The authors gratefully acknowledge PD Dr. Igor Yakushev and PD Dr. Dennis M. Hedderich from Klinikum rechts der Isar (Munich, Germany) for their invaluable provision of the in-house clinical data, as well as the Leibniz Supercomputing Centre for providing the computational and data resources.
References
- [1] Paul S Aisen, Jeffrey Cummings, Clifford R Jack, John C Morris, Reisa Sperling, Lutz Frölich, Roy W Jones, Sherie A Dowsett, Brandy R Matthews, Joel Raskin, et al. On the path to 2025: understanding the alzheimer’s disease continuum. Alzheimer’s research & therapy, 9:1–10, 2017.
- [2] Jimmy Lei Ba, Jamie Ryan Kiros, and Geoffrey E Hinton. Layer normalization. arXiv preprint arXiv:1607.06450, 2016.
- [3] Annachiara Cagnin, Giorgio Pigato, Ilaria Pettenuzzo, Giovanni Zorzi, Beatrice Roiter, Maria Giulia Anglani, Cinzia Bussè, Stefano Mozzetta, Carlo Gabelli, Cristina Campi, et al. Data-driven analysis of regional brain metabolism in behavioral frontotemporal dementia and late-onset primary psychiatric diseases with frontal lobe syndrome: A pet/mri study. Neurobiology of Aging, 137:47–54, 2024.
- [4] Jieneng Chen, Jieru Mei, Xianhang Li, Yongyi Lu, Qihang Yu, Qingyue Wei, Xiangde Luo, Yutong Xie, Ehsan Adeli, Yan Wang, et al. 3d transunet: Advancing medical image segmentation through vision transformers. arXiv preprint arXiv:2310.07781, 2023.
- [5] Leonidas Chouliaras and John T O’Brien. The use of neuroimaging techniques in the early and differential diagnosis of dementia. Molecular Psychiatry, 28(10):4084–4097, 2023.
- [6] Juergen Dukart, Karsten Mueller, Annette Horstmann, Henryk Barthel, Harald E Möller, Arno Villringer, Osama Sabri, and Matthias L Schroeter. Combined evaluation of fdg-pet and mri improves detection and differentiation of dementia. PloS one, 6(3):e18111, 2011.
- [7] Chiyu Feng, Ahmed Elazab, Peng Yang, Tianfu Wang, Feng Zhou, Huoyou Hu, Xiaohua Xiao, and Baiying Lei. Deep learning framework for alzheimer’s disease diagnosis via 3d-cnn and fsbi-lstm. IEEE Access, 7:63605–63618, 2019.
- [8] Xingyu Gao, Feng Shi, Dinggang Shen, and Manhua Liu. Multimodal transformer network for incomplete image generation and diagnosis of alzheimer’s disease. Computerized Medical Imaging and Graphics, 110:102303, 2023.
- [9] Morteza Ghahremani, Mohammad Khateri, Bailiang Jian, Benedikt Wiestler, Ehsan Adeli, and Christian Wachinger. H-vit: A hierarchical vision transformer for deformable image registration. In Proceedings of the IEEE/CVF Conference on Computer Vision and Pattern Recognition, pages 11513–11523, 2024.
- [10] Morteza Ghahremani Boozandani and Christian Wachinger. Regbn: Batch normalization of multimodal data with regularization. Advances in Neural Information Processing Systems, 36, 2024.
- [11] Le Gjerum, Kristian Steen Frederiksen, Otto Mølby Henriksen, Ian Law, Marie Bruun, Anja Hviid Simonsen, Patrizia Mecocci, Marta Baroni, Massimo Eugenio Dottorini, Juha Koikkalainen, et al. Evaluating 2-[18f] fdg-pet in differential diagnosis of dementia using a data-driven decision model. NeuroImage: Clinical, 27:102267, 2020.
- [12] Along He, Kai Wang, Tao Li, Chengkun Du, Shuang Xia, and Huazhu Fu. H2former: An efficient hierarchical hybrid transformer for medical image segmentation. IEEE Transactions on Medical Imaging, 42(9):2763–2775, 2023.
- [13] Dan Hendrycks and Kevin Gimpel. Gaussian error linear units (gelus). arXiv preprint arXiv:1606.08415, 2016.
- [14] Yechong Huang, Jiahang Xu, Yuncheng Zhou, Tong Tong, Xiahai Zhuang, and ADNI. Diagnosis of alzheimer’s disease via multi-modality 3d convolutional neural network. Frontiers in neuroscience, 13:509, 2019.
- [15] Takeshi Iwatsubo, Atsushi Iwata, Kazushi Suzuki, Ryoko Ihara, Hiroyuki Arai, Kenji Ishii, Michio Senda, Kengo Ito, Takeshi Ikeuchi, Ryozo Kuwano, Hiroshi Matsuda, Japanese Alzheimer’s Disease Neuroimaging Initiative, Chung-Kai Sun, Laurel A. Beckett, Ronald C. Petersen, Michael W. Weiner, Paul S. Aisen, Michael C. Donohue, and Alzheimer’s Disease Neuroimaging Initiative. Japanese and north american alzheimer’s disease neuroimaging initiative studies: Harmonization for international trials. Alzheimer’s & Dementia, 14(8):1077–1087, 2018.
- [16] Clifford Jack, Matt Bernstein, Nick Fox, Paul Thompson, Gene Alexander, Danielle Harvey, Bret Borowski, Paula Britson, Jennifer Whitwell, Chadwick Ward, Anders Dale, Joel Felmlee, Jeffrey Gunter, Derek Hill, Ron Killiany, Norbert Schuff, Sabrina Fox-Bosetti, Chen Lin, Colin Studholme, and Michael Weiner. The alzheimer’s disease neuroimaging initiative (adni): Mri methods. Journal of magnetic resonance imaging: JMRI, 27:685–91, 05 2008.
- [17] Rahma Kadri, Bassem Bouaziz, Mohamed Tmar, and Faiez Gargouri. Efficient multimodel method based on transformers and coatnet for alzheimer’s diagnosis. Digital Signal Processing, 143:104229, 2023.
- [18] Weisheng Li, Yin Zhang, Guofen Wang, Yuping Huang, and Ruyue Li. Dfenet: A dual-branch feature enhanced network integrating transformers and convolutional feature learning for multimodal medical image fusion. Biomedical Signal Processing and Control, 80:104402, 2023.
- [19] Yitong Li, Tom Nuno Wolf, Sebastian Pölsterl, Igor Yakushev, Dennis M Hedderich, and Christian Wachinger. From barlow twins to triplet training: Differentiating dementia with limited data. In Medical Imaging with Deep Learning, 2024.
- [20] Wanyun Lin, Weiming Lin, Gang Chen, Hejun Zhang, Qinquan Gao, Yechong Huang, Tong Tong, Min Du, and ADNI. Bidirectional mapping of brain mri and pet with 3d reversible gan for the diagnosis of alzheimer’s disease. Frontiers in Neuroscience, 15:646013, 2021.
- [21] Manhua Liu, Danni Cheng, Kundong Wang, Yaping Wang, and ADNI. Multi-modality cascaded convolutional neural networks for alzheimer’s disease diagnosis. Neuroinformatics, 16:295–308, 2018.
- [22] Ilya Loshchilov and Frank Hutter. Decoupled weight decay regularization. In International Conference on Learning Representations, 2019.
- [23] Donghuan Lu, Karteek Popuri, Gavin Weiguang Ding, Rakesh Balachandar, and Mirza Faisal Beg. Multimodal and multiscale deep neural networks for the early diagnosis of alzheimer’s disease using structural mr and fdg-pet images. Scientific reports, 8(1):5697, 2018.
- [24] Mandy Lu, Qingyu Zhao, Jiequan Zhang, Kilian M Pohl, Li Fei-Fei, Juan Carlos Niebles, and Ehsan Adeli. Metadata normalization. In Proceedings of the IEEE/CVF Conference on Computer Vision and Pattern Recognition, pages 10917–10927, 2021.
- [25] Shang Miao, Qun Xu, Weimin Li, Chao Yang, Bin Sheng, Fangyu Liu, Tsigabu T. Bezabih, and Xiao Yu. Mmtfn: Multi-modal multi-scale transformer fusion network for alzheimer’s disease diagnosis. International Journal of Imaging Systems and Technology, 34(1):e22970, 2024.
- [26] Marla Narazani, Ignacio Sarasua, Sebastian Pölsterl, Aldana Lizarraga, Igor Yakushev, and Christian Wachinger. Is a pet all you need? a multi-modal study for alzheimer’s disease using 3d cnns. In MICCAI, 2022.
- [27] Huy-Dung Nguyen, Michaël Clément, Boris Mansencal, and Pierrick Coupé. Interpretable differential diagnosis for alzheimer’s disease and frontotemporal dementia. In International Conference on Medical Image Computing and Computer-Assisted Intervention, pages 55–65. Springer, 2022.
- [28] Ayush Singla, Qingyu Zhao, Daniel K Do, Yuyin Zhou, Kilian M Pohl, and Ehsan Adeli. Multiple instance neuroimage transformer. In International Workshop on PRedictive Intelligence In MEdicine, 2022.
- [29] Mohammad Soleymani, David Garcia, Brendan Jou, Björn Schuller, Shih-Fu Chang, and Maja Pantic. A survey of multimodal sentiment analysis. Image and Vision Computing, 65:3–14, 2017.
- [30] Juan Song, Jian Zheng, Ping Li, Xiaoyuan Lu, Guangming Zhu, and Peiyi Shen. An effective multimodal image fusion method using mri and pet for alzheimer’s disease diagnosis. Frontiers in digital health, 3:637386, 2021.
- [31] Yan Tang, Xing Xiong, Gan Tong, Yuan Yang, and Hao Zhang. Multimodal diagnosis model of alzheimer’s disease based on improved transformer. BioMedical Engineering OnLine, 23(1):8, 2024.
- [32] Jinyu Wen, Asad Khan, Amei Chen, Weilong Peng, Meie Fang, CL Philip Chen, and Ping Li. High-quality fusion and visualization for mr-pet brain tumor images via multi-dimensional features. IEEE Transactions on Image Processing, 2024.
- [33] Juan Joseph Young, Mallika Lavakumar, Deena Tampi, Silpa Balachandran, and Rajesh R. Tampi. Frontotemporal dementia: latest evidence and clinical implications. Therapeutic Advances in Psychopharmacology, 8:33 – 48, 2018.
- [34] Yanteng Zhang, Xiaohai He, Yixin Liu, Charlene Zhi Lin Ong, Yan Liu, and Qizhi Teng. An end-to-end multimodal 3d cnn framework with multi-level features for the prediction of mild cognitive impairment. Knowledge-Based Systems, 281:111064, 2023.
- [35] Yuanwang Zhang, Kaicong Sun, Yuxiao Liu, and Dinggang Shen. Transformer-based multimodal fusion for early diagnosis of alzheimer’s disease using structural mri and pet. In IEEE 20th International Symposium on Biomedical Imaging (ISBI), 2023.
- [36] Tao Zhou, Kim-Han Thung, Xiaofeng Zhu, and Dinggang Shen. Effective feature learning and fusion of multimodality data using stage-wise deep neural network for dementia diagnosis. Human brain mapping, 40(3):1001–1016, 2019.