CCAT: LED Mapping and Characterization of the 280 GHz TiN KID Array
Abstract
Prime-Cam, one of the primary instruments for the Fred Young Submillimeter Telescope (FYST) developed by the CCAT Collaboration, will house up to seven instrument modules, with the first operating at 280 GHz. Each module will include three arrays of superconducting microwave kinetic inductance detectors (KIDs). The first KID array fabricated for the 280 GHz module uses titanium-nitride (TiN) as the superconducting material and has 3,456 individual detectors, while the other two arrays use aluminum. This paper presents the design and laboratory characterization of the 280 GHz TiN array, which is cooled below its critical temperature to 0.1 K and read out over six RF feedlines. LED mapping, a technique for matching the measured resonant frequency of a detector to its physical position, was performed on the array so that the results can be used to lithographically trim the KID capacitors and increase the yield of the array by reducing frequency collisions. We present the methods and results of LED mapping the 280 GHz TiN KID array before deployment on FYST.
Index Terms:
Other non-equilibrium (non-thermal) detectors (e.g. SIS, MKID), submillimeter wave detectors, superconducting detectors.I Introduction
The Fred Young Submillimeter Telescope (FYST) is a six-meter-aperture submillimeter telescope to be located at a 5,600 m elevation site in Cerro Chajnantor. This outstanding high-altitude site will allow for high atmospheric transmission in the submillimeter to millimeter wavelength range that will be measured using the Prime-Cam instrument, which is one of the primary receivers for FYST and is currently being constructed for use by the CCAT Collaboration [1].
Prime-Cam will house up to seven instrument modules, including those for broadband observations ranging from 280850 GHz as well as imaging spectrometers for line intensity mapping [2] [3]. Prime-Cam’s multi-frequency capabilities will enable studies of science goals including Big Bang cosmology through the Epoch of Reionization, measuring cosmic microwave background (CMB) foregrounds, and tracing galaxy cluster evolution with the Sunyaev-Zeldovich effect [1].
For first light, the 280 GHz module will be deployed with Mod-Cam [4], and will later be moved to the Prime-Cam instrument for measurements with multiple frequency modules. The focal plane of the 280 GHz instrument module will consist of three kinetic inductance detector (KID) arrays with a total of 10,352 detectors. One of the arrays uses a TiN-Ti-TiN trilayer as the superconducting material, while two use Al. The TiN array was the first array fabricated for CCAT, with Al selected later for the other two arrays to improve noise performance [4].
This paper focuses on the 280 GHz TiN array. In the following section, we describe the design of the 280 GHz TiN KID array and the experimental setup, and then the process used for LED mapping the array. We then discuss the results from this LED mapping process and describe the next steps for the TiN array.
II Instrument and Experiment
A full description of the design and assembly of the 280 GHz TiN array is provided in [5]. The TiN array uses a TiN/Ti/TiN trilayer as its superconducting material, which has a critical temperature of 1.1 K [6].
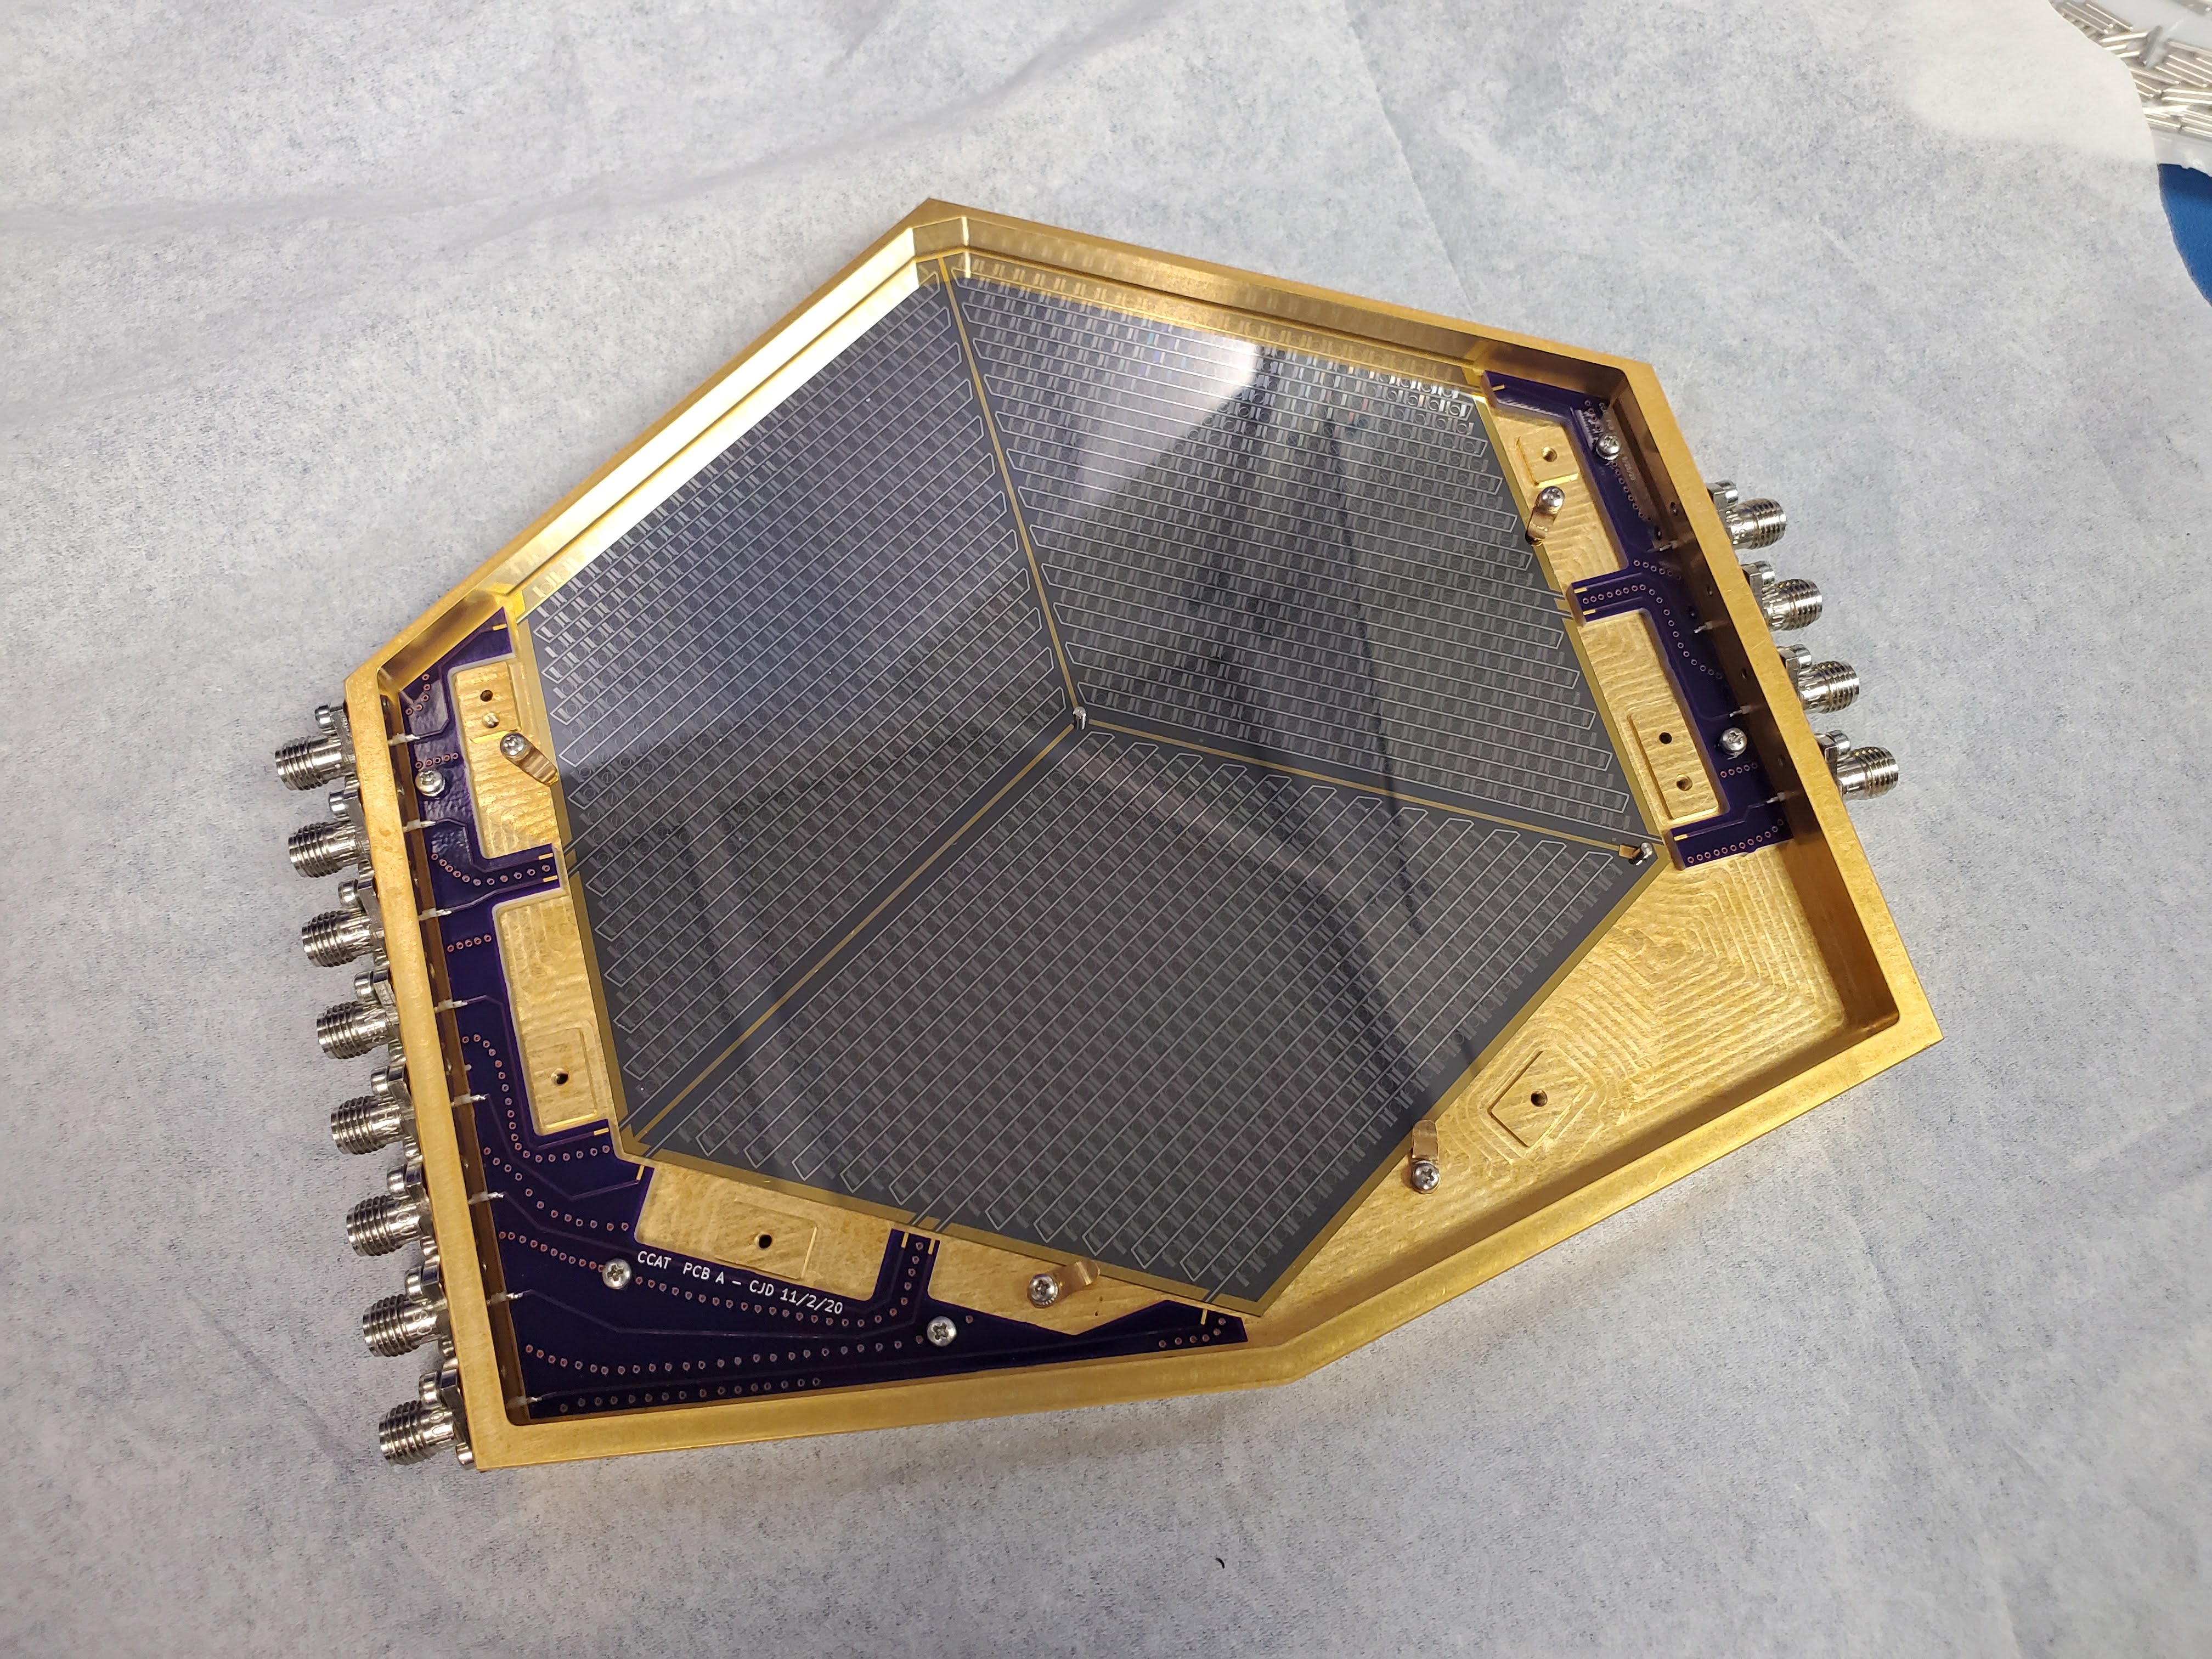
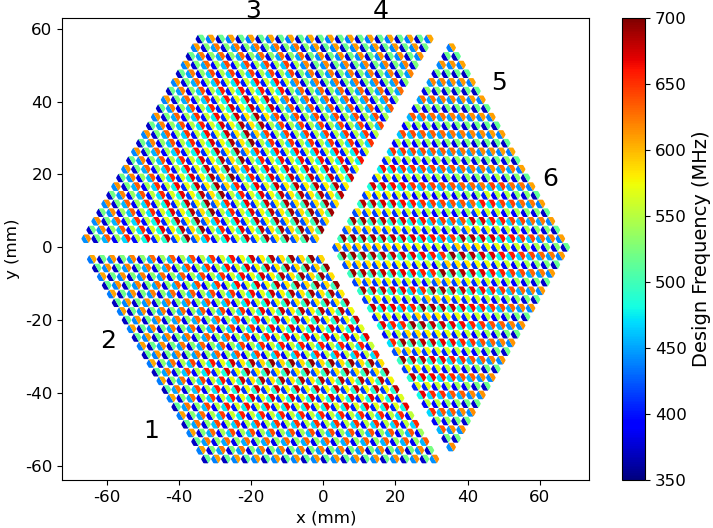
The array was designed with a total of 3,456 individual detectors that are read out over six RF feedlines with 576 detectors per feedline. There are two detectors per pixel which are rotated such that they are orthogonal to one another for polarization sensitivity. The designed resonant frequencies for each detector are shown in the bottom panel of Figure 1.
The array was assembled onto a gold-plated aluminum base, pictured in the top panel of Figure 1, and coupled to an aluminum feedhorn array. This array package was then mounted to a Bluefors LD400 system and cooled to a base temperature of 100 mK, and read out using a second generation Reconfigurable Open Architecture Computing Hardware (ROACH-2) board [7].
Although the resonant frequencies of the detectors across an array can be identified by locating the resonators in an sweep, it is less trivial to identify where these detectors are physically located on the array itself. LED mapping is a technique used to match the measured of each detector to its physical location, which is essential information for maximizing the yield of a KID array.
The resulting LED resonator-position map from LED mapping is used to lithographically trim the capacitors of each detector to reduce frequency collisions, leading to an improved array yield. Frequency collisions, which occur when the peaks of two or more resonators overlap in frequency space, reduce sensitivity of the array by preventing differentiation of individual detectors. This capacitor trimming process, which will be performed at the National Institute of Standards and Technology (NIST) in Boulder, CO, is described in [8].
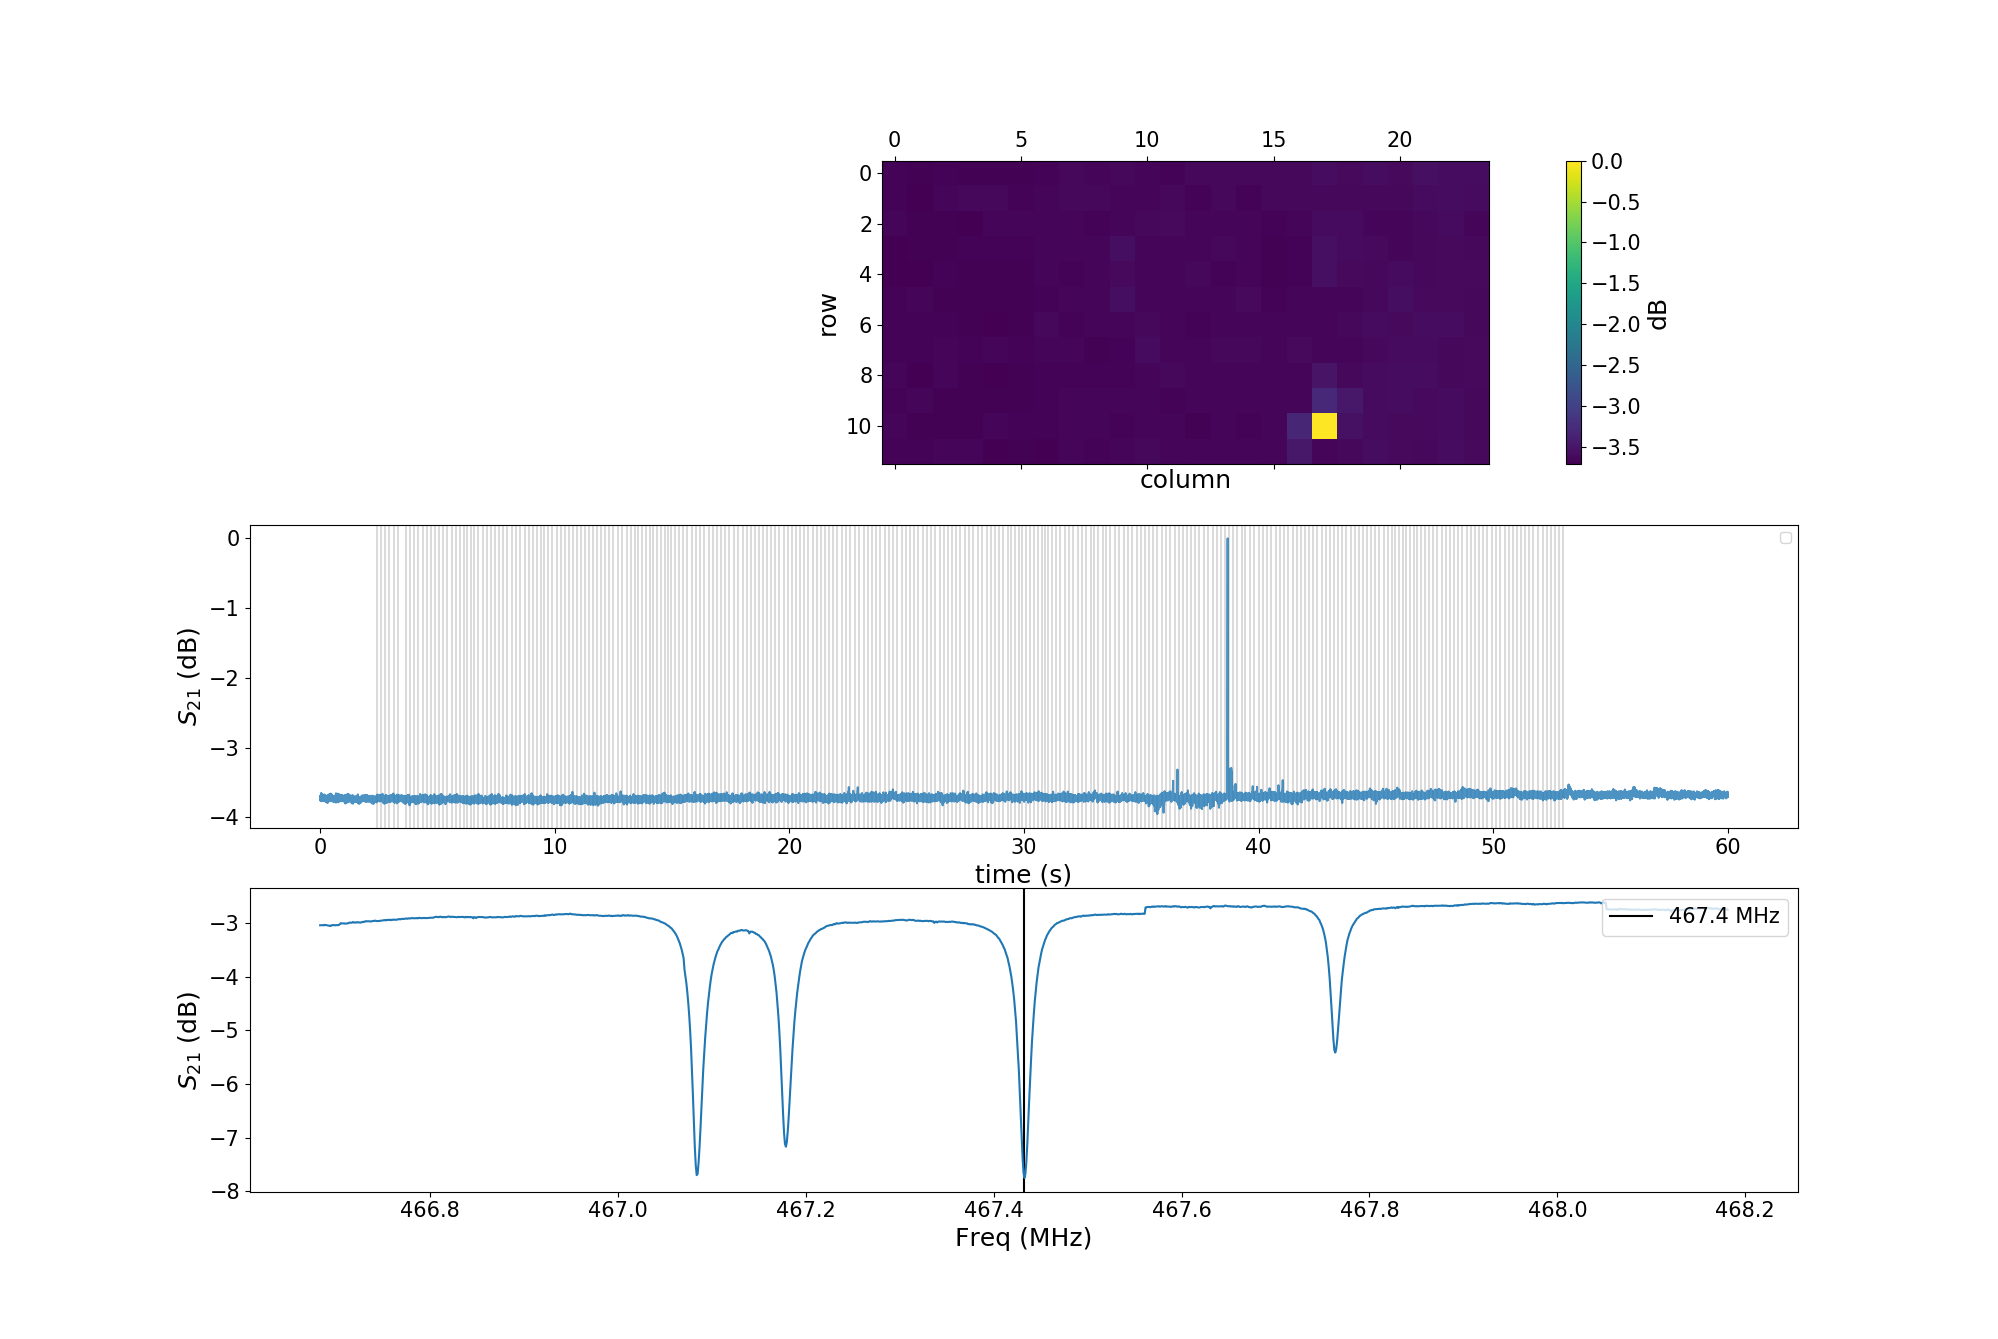
When a KID absorbs incident photons from an LED, Cooper pairs are broken in the superconducting material, generating quasiparticles. This causes an increase in the kinetic inductance of the resonator and results in a downward shift of the resonant frequency. Quasiparticle generation also causes an increase in losses that lower quality factor of the resonator. A decrease in and are therefore indicative of a KID detecting a signal from an LED.
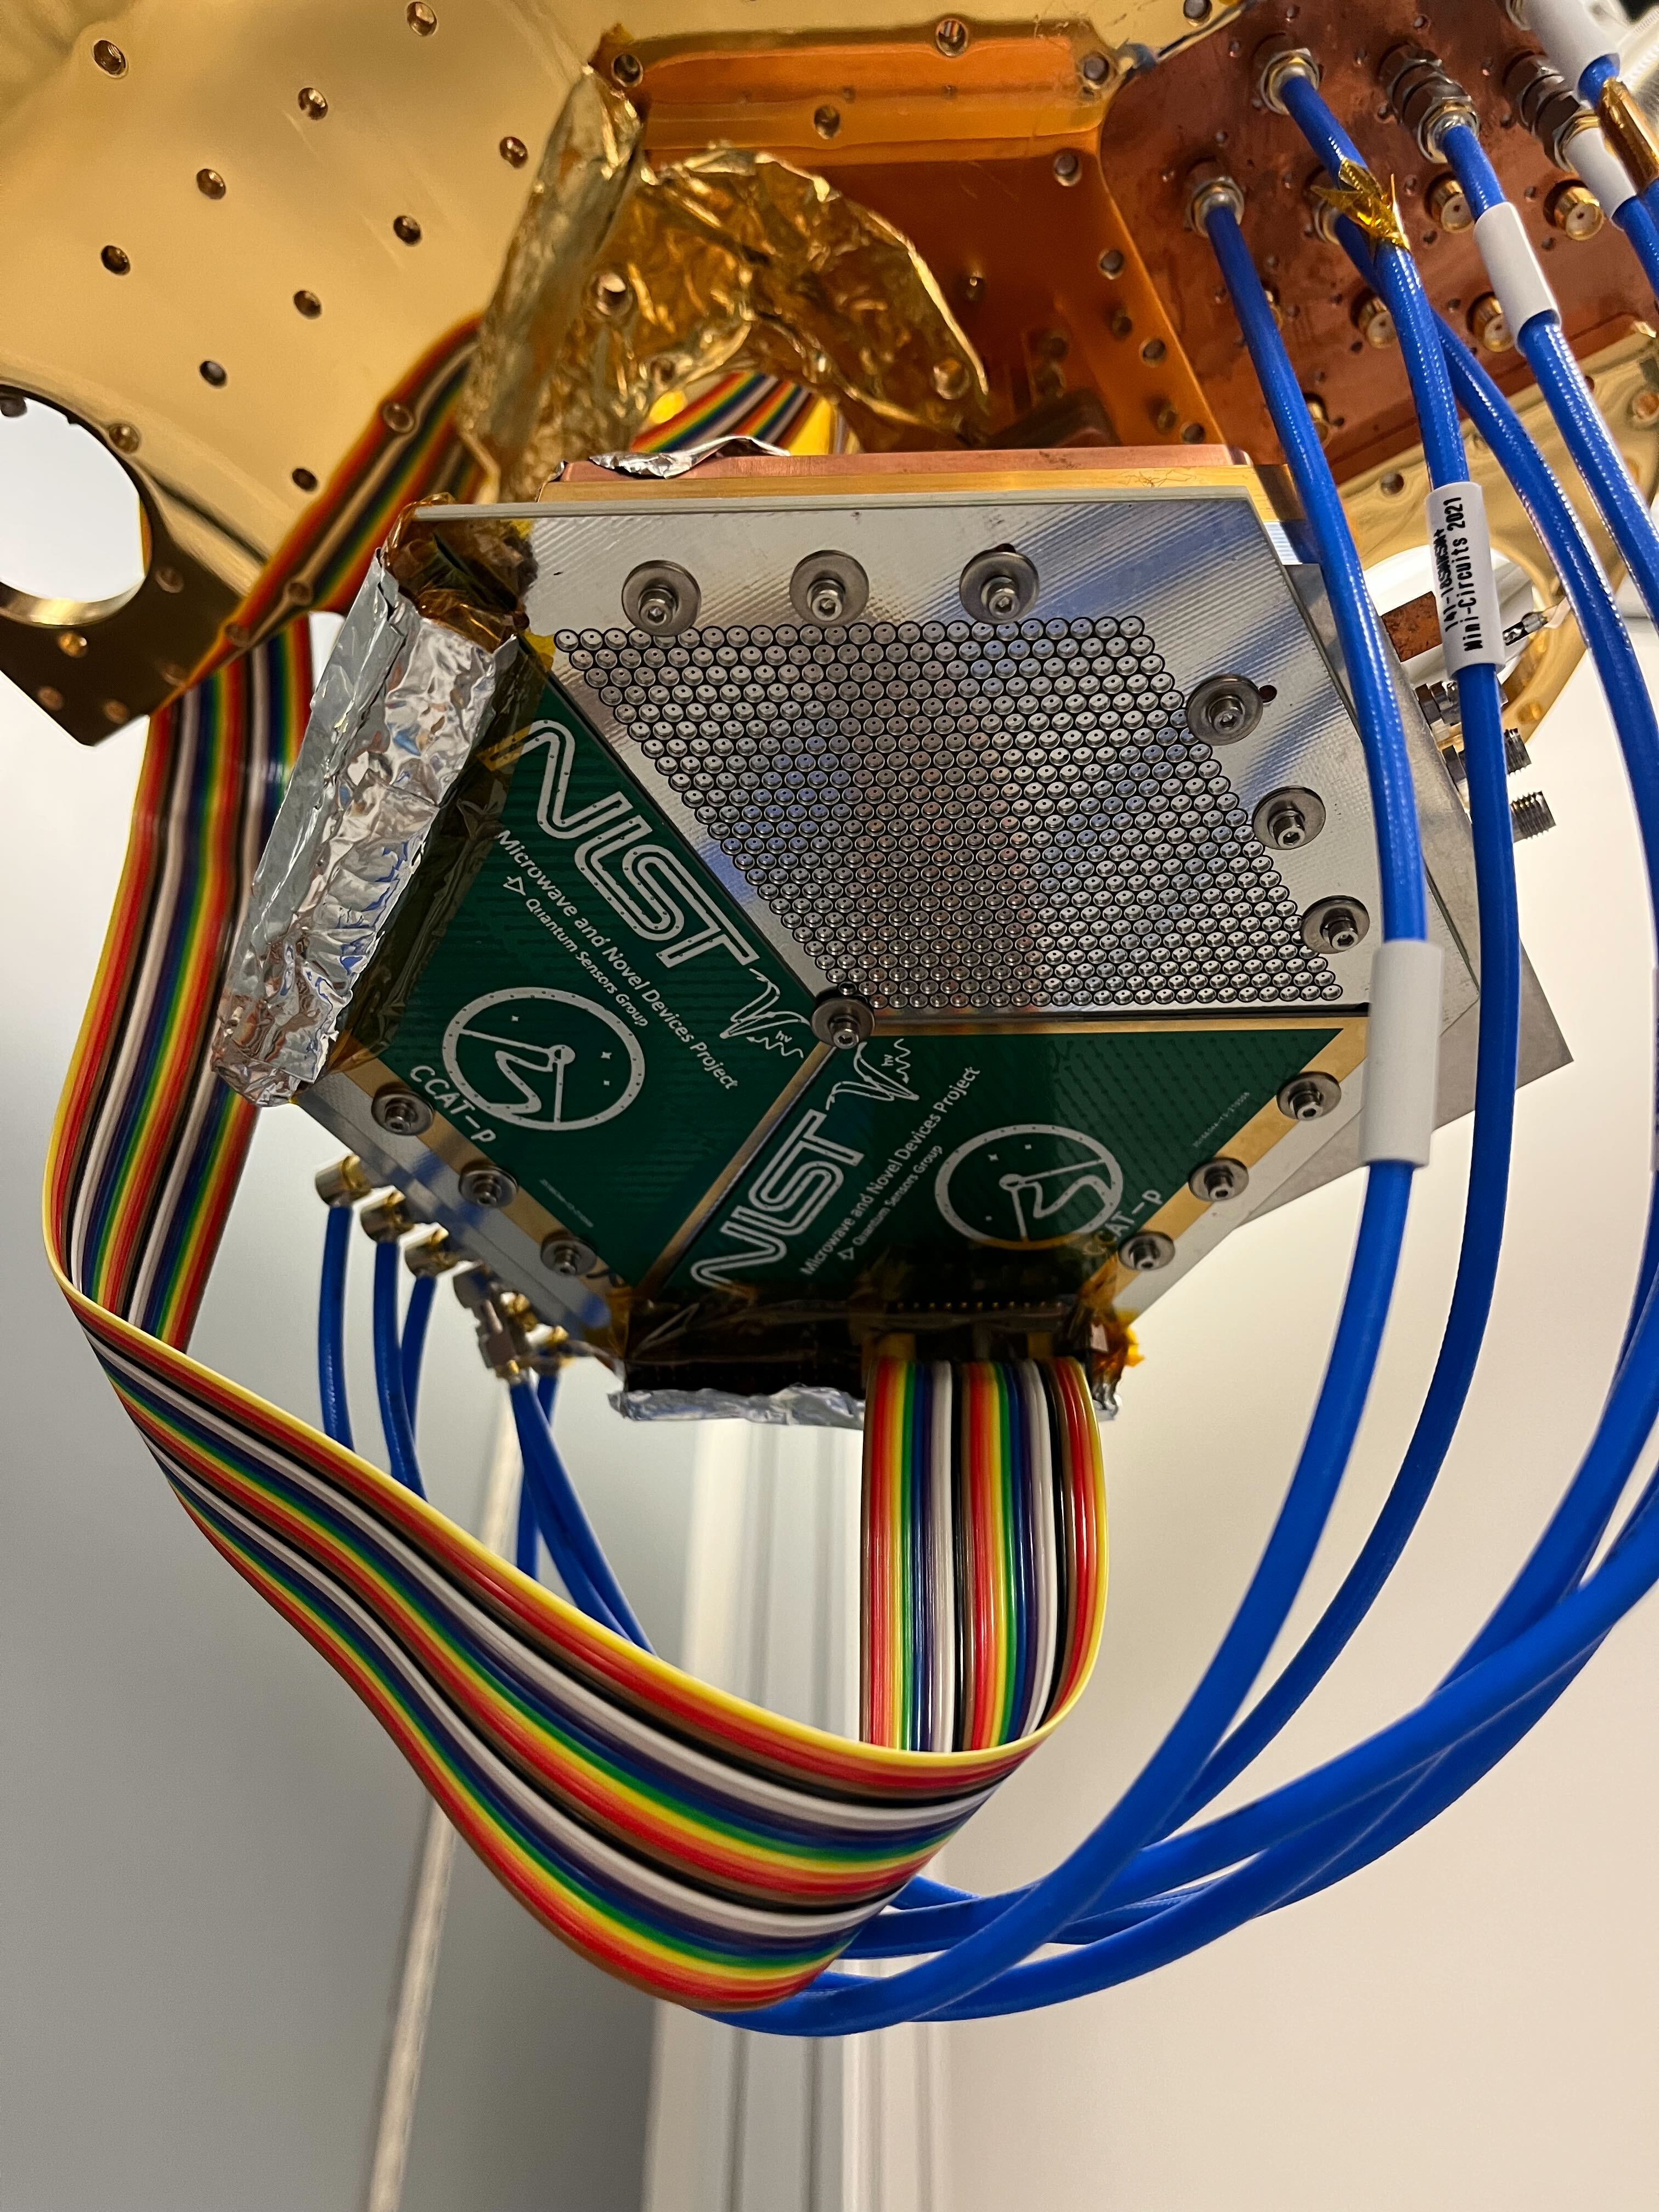
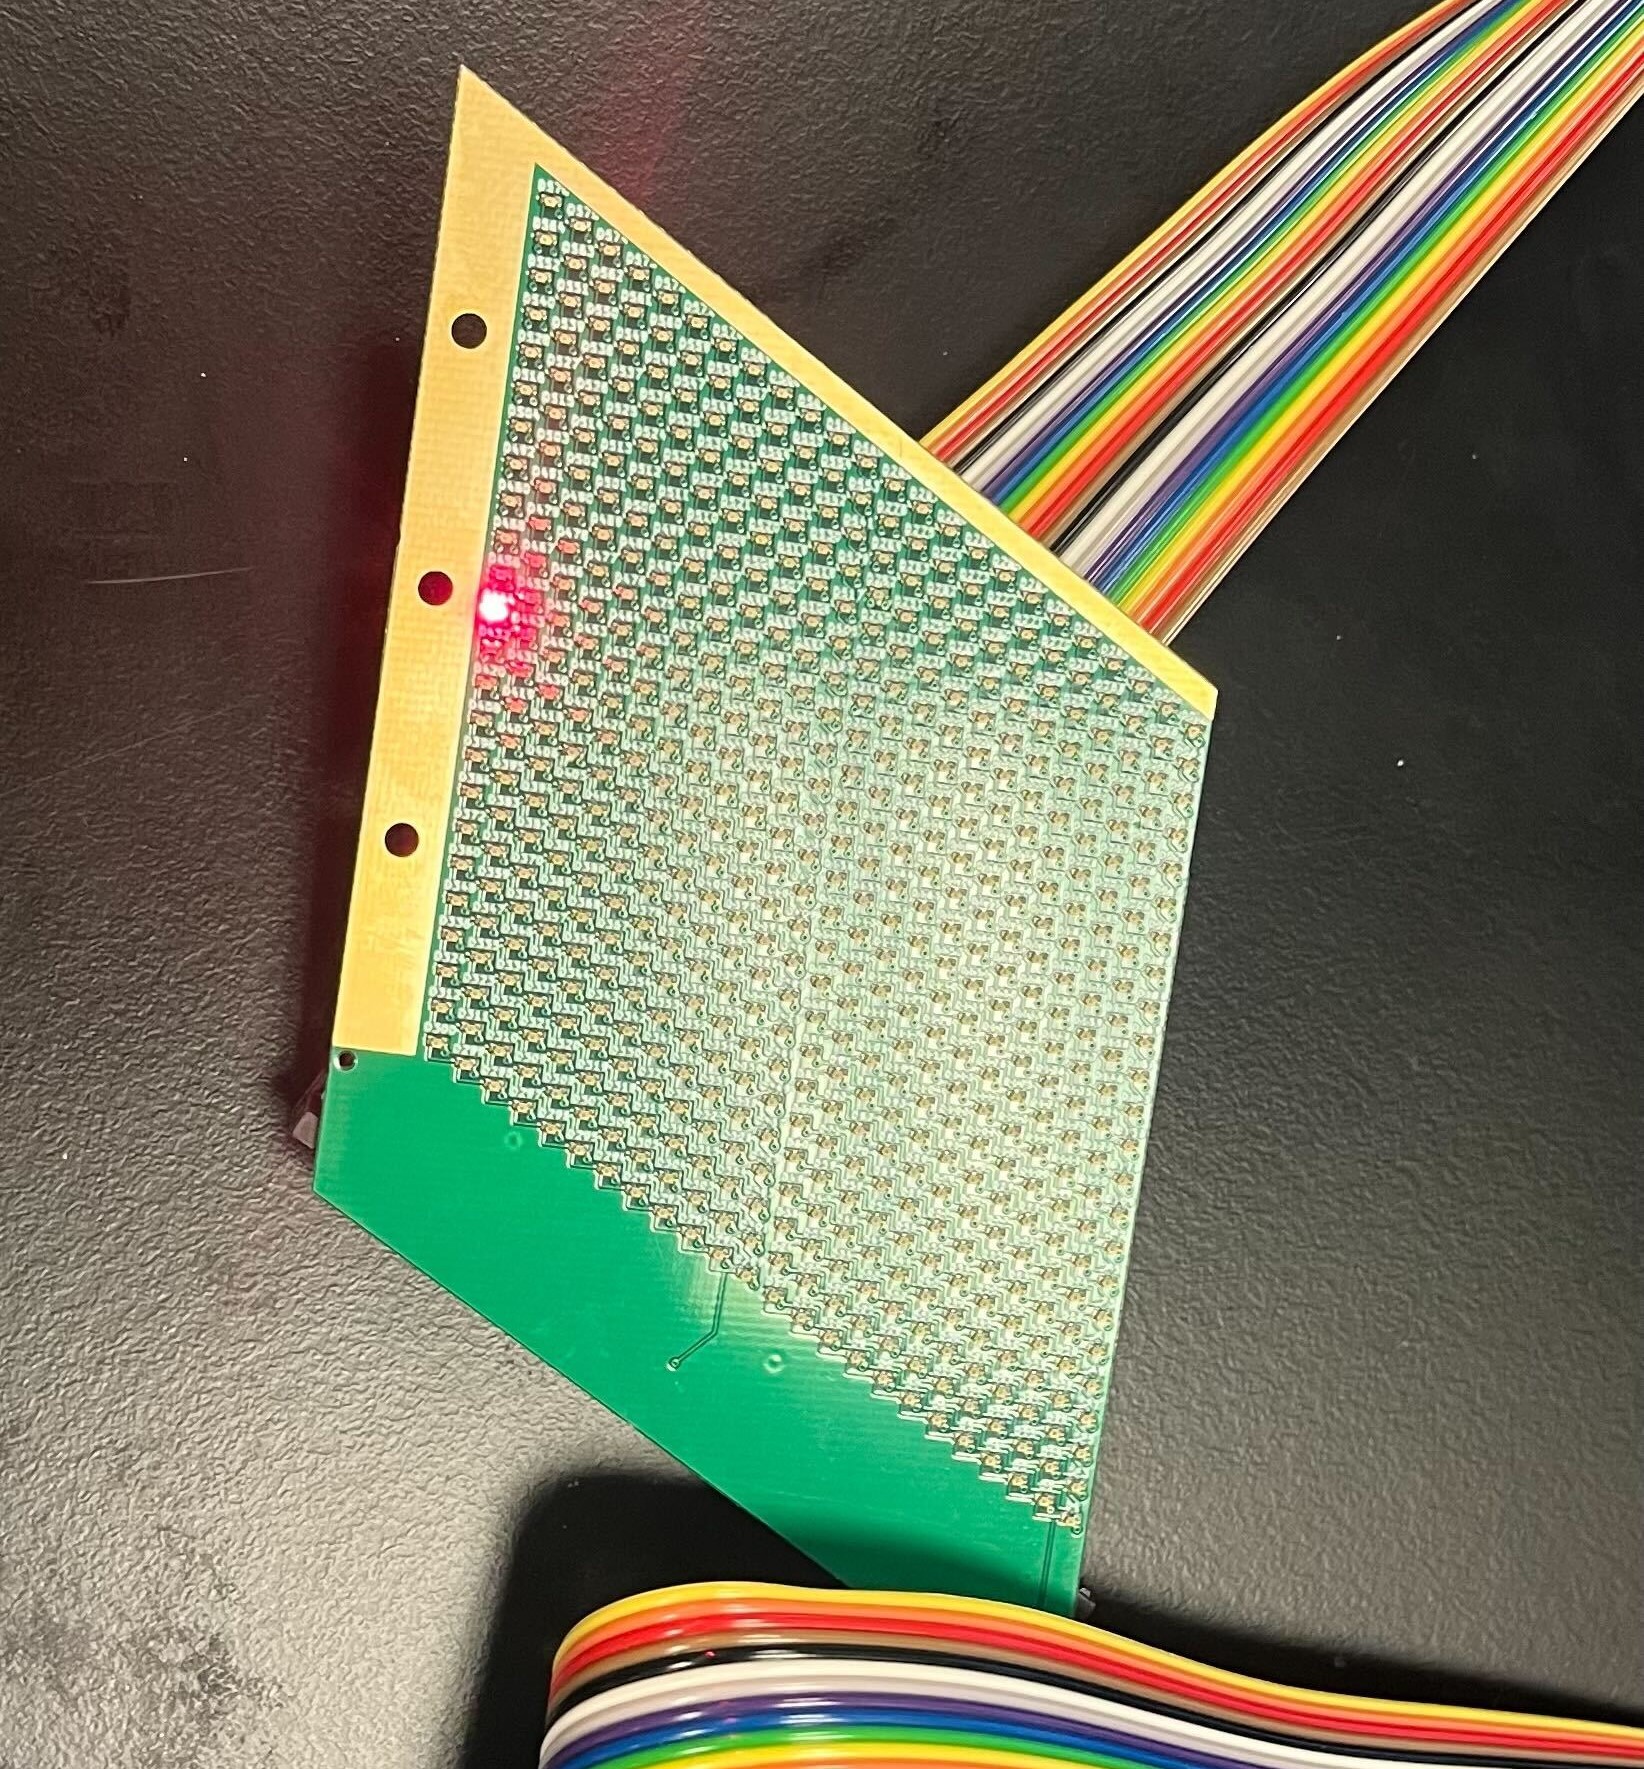
An LED mapper PCB, pictured in Figure 2, was fabricated to map the measured detector resonant frequencies to their physical locations on the 280 GHz TiN array. The LED mapper, which has a total of 576 surface-mounted device (SMD) LEDs of type 0402 (1005 metric), was designed to line up with each third of the array, with an LED positioned over the feedhorn for each pixel. It was coupled to the feedhorn array via an interface as shown in the top panel of Figure 2. The LED mapper is addressed using an Adafruit FT232H breakout board which enables the activation of an LED in any particular location for any length of time, and allows us to blink through the LEDs in any order while saving the timestamps of when the LED at each position is turned on.
Using the ROACH-2, we first conducted an sweep of a feedline to identify the resonant frequencies of each detector. We then recorded timestreams of the values of these resonators while sequentially activating the LEDs across the LED mapper, which results in sharp peaks in the timestreams when the LED corresponding to the physical location of a resonator is activated due to the aforementioned decrease in and . Lastly, we combined the timestream data of each detector with the timestamps of the LEDs to match the timestream peaks with the corresponding LED location. A visualization of this LED mapping process for one detector is presented in Figure 3.
III Results
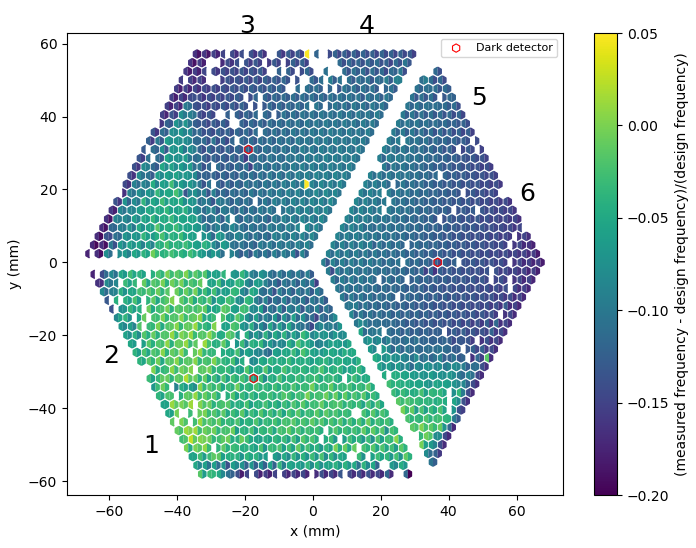
The results from the LED mapping process for the 280 GHz TiN array are shown in Figure 4. The plot shows the difference between the designed and measured resonant frequencies for each detector. The yield of the detectors on each feedline, which is the number of detectors found and mapped compared to the number of detectors designed, is given in Table I.
| Feedline | Detectors Mapped | Yield |
|---|---|---|
| 1 | 544 | 95 |
| 2 | 548 | 95 |
| 3 | 537 | 93 |
| 4 | 543 | 94 |
| 5 | 557 | 96 |
| 6 | 553 | 96 |
Between 93 and 96 of the designed detectors were found by the sweep and mapped for each feedline. As can be seen by the color scale in Figure 4, there is a spread of 20 in the variation of the measured frequencies from the designed frequencies. The detector locations that are white in the plot represent positions for which a resonator was not mapped. These detectors were not found by the sweep and are missing due to fabrication defects. Resonators that are collided in frequency space are included in the total yield of the array.
The post-LED mapping lithographic capacitor trimming process has already been completed at NIST on one of the Al KID arrays for the 280 GHz instrument module. Before trimming, the total yield of the Al array was found to be 97 and a spread of 20 from the designed resonant frequencies was observed, similar to that of this TiN array. The number of collided resonators, which is defined as the number of resonators within five linewidths of another resonator, was reduced by more than 30 after trimming. Laboratory measurements of the Al array performance, including LED mapping and capacitor trimming results, will be presented in an upcoming paper. Capacitor trimming of the TiN array based on the LED mapping results presented in this paper will be completed at NIST soon.
IV Conclusion
Using custom LED boards, we successfully mapped 3,282 resonator positions, which is 95 of the CCAT 280 GHz TiN KID array. This is one of the largest KID arrays to undergo LED mapping to date. This LED mapping work informs the post-editing process designed to reduce resonator collisions and represents a significant step in maximizing KID array yields.
Testing will continue for the 280 GHz instrument module in preparation for the deployment of the 280 GHz KID arrays in Mod-Cam with a first light target of early 2026. Deployment of the 280 GHz module in Prime-Cam, along with instrument modules operating at other frequencies, is planned for the following year.
V Acknowledgements
The CCAT project, FYST and Prime-Cam instrument have been supported by generous contributions from the Fred M. Young, Jr. Charitable Trust, Cornell University, and the Canada Foundation for Innovation and the Provinces of Ontario, Alberta, and British Columbia. The construction of the FYST telescope was supported by the Großgeräte-Programm of the German Science Foundation (Deutsche Forschungsgemeinschaft, DFG) under grant INST 216/733-1 FUGG, as well as funding from Universität zu Köln, Universität Bonn and the Max Planck Institut für Astrophysik, Garching.
References
- [1] CCAT-Prime Collaboration, et al., “CCAT-prime Collaboration: Science Goals and Forecasts with Prime-Cam on the Fred Young Submillimeter Telescope,” The Astrophysical Journal Supplement Series, vol. 267, pp. 39, Jan 2023.
- [2] S. K. Choi, et al., “Sensitivity of the Prime-Cam Instrument on the CCAT-Prime Telescope,” Journal of Low Temperature Physics, vol. 199, no. 3-4, pp. 1089-1097, Mar 2020.
- [3] E. M. Vavagiakis et al., “Prime-Cam: a first-light instrument for the CCAT-prime telescope,” Millimeter, Submillimeter, and Far-Infrared Detectors and Instrumentation for Astronomy IX, vol. 10708, 2018.
- [4] E. M. Vavagiakis, C. J. Duell, et al., “CCAT-prime: Design of the Mod-Cam receiver and 280 GHz MKID instrument module,” Proceedings of the SPIE, vol. 12190, 2022.
- [5] C. J. Duell, E. M. Vavagiakis, et al., “CCAT-prime: Designs and Status of the First Light 280 GHz MKID Array and Mod-Cam Receiver,” SPIE Astronomical Telescopes + Instrumentation, 2020.
- [6] S. K. Choi, C. J. Duell, et al., “CCAT-prime: Characterization of the First 280 GHz MKID Array for Prime-Cam,” Journal of Low Temperature Physics, 2022.
- [7] S. Gordon, B. Dober, A. Sinclair, S. Rowe, S. Bryan, P. Mauskopf, et al., “An Open Source, FPGA-based LeKID Readout for BLAST-TNG: Pre-flight Results,” Journal of Astronomical Instrumentation, vol. 5, no. 4, Dec 2016.
- [8] X. Liu, W. Guo, Y. Wang, M. Dai, L. F. Wei, B. Dober, et al., “Superconducting micro-resonator arrays with ideal frequency spacing,” Applied Physics Letters, vol. 111, no. 25, Dec 2017.