[table]capposition=top
Refining CART Models for Covariate Shift with Importance Weight
Abstract
Machine learning models often face challenges in medical applications due to covariate shifts, where discrepancies between training and target data distributions can decrease predictive accuracy. This paper introduces an adaptation of Classification and Regression Trees (CART) that incorporates importance weighting to address these distributional differences effectively. By assigning greater weight to training samples that closely represent the target distribution, our approach modifies the CART model to improve performance in the presence of covariate shift. We evaluate the effectiveness of this method through simulation studies and apply it to real-world medical data, showing significant improvements in predictive accuracy. The results indicate that this weighted CART approach can be valuable in medical and other fields where covariate shift poses challenges, enabling more reliable predictions across diverse data distributions.
1 Introduction
Machine learning models based on trees, such as such as classification and regression trees (CART) (Breiman, \APACyear2017), random forests (Breiman, \APACyear2001), gradient boosting machines (Ke \BOthers., \APACyear2017; Chen \BBA Guestrin, \APACyear2016), and Bayesian additive regression trees (Chipman \BOthers., \APACyear2010), are popular due to their good predictive performance and versatility across a range of tasks. These models partition the feature space into rectangular cells, effectively capturing complex, non-linear relationships. They can handle various data types without extensive preprocessing, including numerical, categorical, and ordinal variables. As a result, these models are widely used for classification, regression, feature selection, and anomaly detection, making them essential in modern machine-learning methodologies.
When training a tree-based model, the training and test datasets are expected to come from the same distribution and have similar joint probability distributions. However, tree-based models may have difficulty generalizing effectively if these distributions have significant differences. The distribution discrepancy can lead to inaccurate predictions, as the models may focus on noise or specific patterns in the training data rather than genuine relationships, resulting in reduced performance on new data.
In this paper, we present a domain adaptation framework for tree-based models. Our method is innovative in enhancing the predictive performance of tree-based models when there is a discrepancy in the distribution of covariates between the training and test sets, especially in scenarios such as narrower distribution oversampling and minor distribution shifts. We apply an importance weight approach, discussed in section 3, to address distribution discrepancy within tree-based models. Specifically, training samples that are more representative of the test set are assigned greater significance during model training, thereby improving overall prediction accuracy.
Domain adaptation is a particular technique of transfer learning (Pan \BBA Yang, \APACyear2009) that can help mitigate the side effect of data dependency in machine learning models (Farahani \BOthers., \APACyear2021; Kouw \BBA Loog, \APACyear2019; Weiss \BOthers., \APACyear2016; Zhuang \BOthers., \APACyear2020). The training and test sets are referred to as the source and target domains (or sets) in the domain adaptation setting. It involves using knowledge gained from one dataset (the source set) and applying it to a different dataset (the target set). Domain adaptation allows models to better adapt to new datasets with different source data. This approach improves generalization, enhances the performance of the model in new target sets, and reduces the sensitivity to the distribution of the source set, especially in situations with limited source data. Domain adaptation techniques can be a powerful tool for practitioners to improve the performance of their models. Various domain adaptation techniques have been developed, including unsupervised and supervised approaches. We focus on the former, and refer to (Duan \BOthers., \APACyear2009; Zhuang \BOthers., \APACyear2011; Tommasi \BBA Caputo, \APACyear2009) for examples of supervised domain adaptation, and to (Sun \BOthers., \APACyear2022; Segev \BOthers., \APACyear2016) for tree-specific supervised domain adaptation algorithms.
The issue of model generalization becomes complicated when the response variable is not observed in the target data. For example, collecting survival outcome data for patients receiving new cancer treatments in clinical analysis can be time-consuming. Predicting survival accurately becomes challenging when the characteristics of patients in the real-world setting differ significantly from those used to train tree-based prediction models in an experimental study. This mismatch in patient characteristics between the training and real-world datasets significantly undermines the model’s ability to predict survival accurately for new patients in the target. It is essential to understand the risks of these challenges.
Unsupervised domain adaptation refers to scenarios where the response variable is only available in the source domain. In such cases, the primary objective is to train the model in the source domain, which can be effectively generalized in the target domain. Feature-level adaptation techniques play a crucial role in unsupervised domain adaptation (Gopalan \BOthers., \APACyear2011; Gong \BOthers., \APACyear2012; Fernando \BOthers., \APACyear2013; Mourragui, \APACyear2023; Pan \BOthers., \APACyear2010; Long \BOthers., \APACyear2013; Jhuo \BOthers., \APACyear2012; Shao \BOthers., \APACyear2014). Methods, such as domain-invariant feature learning and distribution matching, are designed to align source data with target data by learning a transformation that extracts consistent feature representations across different domains. These techniques usually involve transforming the original features into a new feature space and then minimizing the differences between domains within this new representation space through an optimization process while preserving the underlying structure of the original data. Such feature-based adaptation is limited to classification. Moreover, it is challenging to interpret the model after transferring the feature space with dimension reduction techniques, as the feature space used for model building is different from the original. Deep neural networks are also widely employed in domain adaption or machine learning tasks such as image classification, sentiment analysis and object recognition (Long \BOthers., \APACyear2015; X. Zhang \BOthers., \APACyear2015; Glorot \BOthers., \APACyear2011; Ghifary \BOthers., \APACyear2016; Ganin \BBA Lempitsky, \APACyear2015; Tzeng \BOthers., \APACyear2015; Bousmalis \BOthers., \APACyear2017; Hoffman \BOthers., \APACyear2018). However, to our knowledge, unsupervised transfer learning has yet to be studied for tree-based models.
We explore using CART to investigate how importance weights affect the selection of optimal splits, thereby improving prediction accuracy. Using CART provides a clear understanding, visualization, and interpretation of how the proposed improvements impact prediction performance. This transparency ensures that any improvements are well-understood and validated, making them more likely to enhance the performance of ensemble trees, such as random forests. For exploratory purposes, we are also looking into bagged trees. Additionally, as demonstrated later, the importance weights could be applied to other tree-based models. The rest of our article is structured as follows: We provide an overview of CART in section 2, and in section 3, we demonstrate how differences in the distribution of predictor variables can affect the performance of CART. We then describe the importance weights method and how to incorporate it with CART. We present simulations in section 4 and provide an example of our method in an application to lymphoma patients in section 5. Finally, we conclude with a summary and discuss tree ensembles in section 6.
2 Classification and regression trees
2.1 Classification and regression trees
Classification and Regression Trees (CART) (Breiman, \APACyear2017) are an essential tool in machine learning and statistical modelling. CART offers interpretability, visual clarity, and the ability to capture complicated relationships between features and response variables. CART is a recursive algorithm that partitions the data space into homogeneous cells using binary splits. Within each cell, a mean prediction model is fitted. Let denotes the generic random variable used for splitting, and let be the set of all possible functions , piecewise constant in each cell. The aim is usually to construct an tree estimate minimizing the mean squared error
| (1) |
in the training set , and use it to make predictions in the test set . The response variables are not observed in practice, but to evaluate our method, we will use simulated data for which these outcomes are known.
The variable is determined by the CART split criterion. We define a split in a cell is a pair , where denotes the splitting variable and as the potential splitting values along the jth variable. We let be the number of the sample falling in cell . With covariates notation , for all possible in , the CART split criterion considers maximized homogeneity in two descendant nodes (Scornet \BOthers., \APACyear2015):
| (2) |
where and are the average of ’s in left and right descendant cells of : and respectively. The pair is selected by maximizing over all possible pairs in . To avoid ties in the optimization procedure, in the pair is selected in the middle of the consecutive sampling values of .
In practice, the CART-split criterion is implemented based on the concept of squared prediction error for regression and Gini impurity for classification (Hastie \BOthers., \APACyear2009; Therneau \BBA Atkinson, \APACyear2023). Entropy can serve as an alternative to classification trees (Hastie \BOthers., \APACyear2009). However, this criterion cannot be summarized by Eq. 2.
It is a common assumption that the training and test data used in tree-based learning algorithms like CART are drawn independently and identically (i.i.d) from the same distribution. However, if this assumption is violated, sample selection bias can occur in real-world scenarios. In such scenarios, we refer to the training and test sets as source and target sets. First, we explain why the CART model is sensitive to sample selection bias.
2.2 CART model under sample selection bias
Sample selection bias is a common problem frequently ignored in machine learning algorithms. This bias occurs when the data used for analysis does not represent the entire population due to non-random sampling. Consequently, models trained on this biased data may generate inaccurate and misleading predictions when applied to new, unseen data. This happens because the training data fails to accurately capture the actual underlying patterns or distributions in the population (Tripepi \BOthers., \APACyear2010; Cortes \BOthers., \APACyear2008).
For example, in a clinical trial to evaluate the effectiveness of a new drug for treating diabetes, patient recruitment is primarily focused on healthcare facilities and clinics. However, this recruitment strategy inherently biases the participant pool towards individuals who already have access to medical care or are receiving treatment for their condition. Consequently, the trial cohort is skewed towards individuals with mild or managed forms of diabetes while potentially excluding people with more severe or untreated manifestations.
This sample selection bias undermines the external validity of a trial by limiting its representativeness of the broader diabetic population. As a result, any conclusions drawn from the trial outcomes may not accurately generalize to the broader spectrum of diabetic patients, especially those who face difficulties in accessing healthcare or show more complicated disease presentations. Therefore, the predictive model may not be optimal, and this can compromise the reliability of subsequent clinical decisions and healthcare interventions based on the trial findings.
Let us consider a dichotomous variable that indicates the domain of the sample, where signifies that the unit belongs to the target domain, and indicates that the unit is in the training domain. We may address sample selection bias in classical regression models by including variables correlated with in the prediction model. When these variables are included, the outcome becomes independent of the sample selection index , ensuring that . This method effectively mitigates sample selection bias because regression directly models the conditional probability , remaining unaffected by the distribution of . This is analogous to the “Missing at Random” (MAR) assumption in missing data problem, where the probability of missingness depends only on the observed data (Little \BBA Rubin, \APACyear2019).
However, sample selection bias presents a different challenge when using tree-based models. CART, as well as other tree-based models, splits the data by selecting the most informative predictor at each node, conditioning only on one variable during each binary split, as shown in Eq. 2. Since the model relies on a single variable at each split, the loss function cannot simultaneously incorporate all the variables that influence the selection mechanism. Consequently, sample selection bias persists in the split of tree-based models , even when the target sample is a specific subgroup of the source sample. More specifically, the split criterion is sensitive to the distribution of . If the distribution of differs in source and target domains, indicator variables , , and in the Eq. 2 vary in the two domains so that and are different in source and target domains. All these factors ultimately influence the selection of the split in CART. In the appendix, we provide a simple example demonstrating how sample selection bias affects linear regression models and CART models differently.
In short, the distribution of split variables can affect how units are partitioned into two child nodes and the estimates in them (Zadrozny, \APACyear2004). This is true regardless of whether the support of target sample is broader or more restricted.
3 Domain adaptation with importance weighting
Since the data used for training machine learning models may not always accurately represent the underlying distribution of the target data, developing a predictor model that can accurately predict outcomes in the target domain is useful.
When faced with an unsupervised problem, sample weight methods can provide a practical solution. These methods involve assigning varying weights to instances in the source domain to adjust its distribution to match that of the target domain. By adjusting the influence of individual samples based on their similarity to the target domain, sample weight methods can reduce the impact of domain shift on model performance.
Suppose the source set consists of samples and follows a joint distribution . Analogously, the target set consists of samples and follow a different joint distribution: . To identify the importance weight, we assume and are given by:
| (3) | ||||
| (4) |
When only considering covariate shift, we assume that the conditional distribution remains the same in both the source and target domains: . Therefore, the domain shift can be captured by the distribution discrepancy of predictors:
| (5) |
In general, a machine learning method minimizes the expected loss in terms of parameters on the training set. The subscript implies the sample used for expected loss calculation follows the joint distribution . However, if the goal is to train a model on the source domain but minimize the loss function in the target domain, as we do not have for the target domain, we have:
| (6) | ||||
which suggest the following estimate based on samples from :
| (7) |
where implies that the sample used for loss function calculation follows the joint distribution .
Huang et al. (Huang \BOthers., \APACyear2006) proposed kernel mean matching for importance weighting estimation. Similarly, Sugiyama et al. (Sugiyama \BOthers., \APACyear2007) proposed the Kullback-Leibler Importance Estimation Procedure for importance weighting. These methods are based on kernel methods, which relieve the distribution assumption of covariates. However, when dealing with high-dimensional datasets containing mixed types of variables, kernel estimates encounter several challenges. The curse of dimensionality increases computational complexity, making kernel methods impractical due to longer computation time and greater memory requirements. Additionally, mixed-type data complicates the definition of suitable kernel functions, since standard kernels assume continuous feature spaces. Handling categorical or ordinal variables within kernel methods becomes problematic without additional assumptions or discretization steps. Selecting an appropriate kernel function can be non-trivial, with numerous variables and mixed types, potentially leading to suboptimal distance measures.
Propensity score weighting, the statistical technique we apply, is a valuable tool for adjusting confounding variables in observational studies (Guo \BBA Fraser, \APACyear2014; Carry \BOthers., \APACyear2021). We can effectively adjust for sample selection bias by estimating the probability of receiving a particular treatment based on observed covariates and deriving weights (propensity scores) from these estimates. These weights are then applied to each observation, upweighting or downweighting individuals based on their propensity score. In our case, we estimate the probability of being in the source and target domains. By reweighting the data in the source domain using propensity score weighting, we can assign more importance to units that are more likely to be in the target domain when determining the split.
Propensity score weighting is often used to draw inferences about populations. The weight assigned to each observation is based on the probability of being observed, typically represented as . However, if the objective is to make targeted inferences, it follows from Eq. 7 and Bayes’ Theorem that the importance weights need to be adjusted to , where constant does not depend on .
The final importance weights we applied result from normalizing :
| (8) |
which assumes the effective sample size remains the same . The normalization implies that constant is not relevant for our procedure.
Let and denote the support of in the target () and source () domain, respectively. We assume positivity of domain participation at the population level, that is . However, if a sample and , will be down-weighted to 0. A more delicate situation is that a simple and , which refer to extrapolation. In such a case, may be undefined (). To avoid unstable importance weights, we truncate to the interval and calcuate before normalization. The boundary of truncate interval could be tuned. Zhang and Shields (J. Zhang \BBA Shields, \APACyear2019) show that importance weight performs reasonably well when , or when shifts slightly in comparison to (minor extrapolation). We will come back to this point later in the simulation section.
4 Domain adaptive CART (DA-CART)
We propose the domain adaptive CART model, which comprises of three main steps:
-
1.
Select predictive variables in the outcome model.
-
2.
Fit the importance weight model using the variables selected in step 1.
-
3.
Construct the DA-CART using the importance weights from step 2.
The DA-CART is a weighted CART; we have named it a domain-adaptive CART since the importance weight is a term from domain adaptation.
We analyze the global importance of variables from the source domain to determine which ones should be incorporated into the importance weight model. Based on (Brookhart \BOthers., \APACyear2006), it is advantageous to include prediction-specific variables when building the importance weight model. These variables are not directly linked to the importance weight but are associated with the outcome prediction model. Their inclusion can improve the accuracy of estimating the probability of being in the target set without introducing bias. On the other hand, incorporating weight-specific variables, which are related to the importance weight but not the outcome model, can reduce the precision of the probability estimate of being in the target set without reducing bias. In smaller studies, including variables strongly associated with the importance weight but weakly related to the outcome model may lead to a more significant prediction error.
To select variables for the importance weight model, we start by creating a CART model on the source domain. We define the global importance for , and variables with larger are included in the weight importance model. The gain method is widely used as the basis for variable selection and applied in our studies. It measures the total reduction in prediction error or impurity resulting from all splits made for a given variable (Sandri \BBA Zuccolotto, \APACyear2008; Huynh-Thu \BOthers., \APACyear2010). Alternative methods include split count, increase in prediction error after permutation (Lundberg \BOthers., \APACyear2018), and SHAP values (Lundberg \BOthers., \APACyear2018, \APACyear2020). Variable selection methods are sensitive to sampling distribution to varying degrees. Applying multiple variable selection methods is advisable to get comprehensive insights into predictive variables.
Determining which variables to include in the importance weight model can be challenging. Even if we have information about the importance of variables for the outcome model, we still face the dilemma of whether moderately predictive variables should be included. We select variables whose combined importance is over 85% of the total. However, it is crucial to consider different strategies for selecting variables based on their global importance. Additionally, background information can be considered when determining the variables in the importance weight model. Using ensemble trees can provide a better estimation of the importance weight.
Suppose a set of predictive variables for the outcome model is selected for the importance weight model M2. To improve the estimation of the importance weight, we construct an ensemble trees model (ETM): , where represents the selected variables from the source domain and represents the same variables in the target domain. The variable indicates whether a sample is from the source or target domain and is defined in section 2.2. Once M2 is constructed, we estimate the probability of being in the target domain as and then calculate the importance weight as .
Once the importance weight is estimated, a weighted CART is constructed using the predictive variables in the source domain. The model is denoted as , with the weighted CART split criterion:
| (9) |
Overfitting are presented by pruning. Algorithm 1 depicts the pseudocode of DA-CART.
4.1 Consistency of the estimates on the target domain
The goal of CART is to predict a random response variable by estimating the mean function . In the context of domain adaptation, the objective is to use the data from the source domain to create an estimate for the function in the target domain. Later, we will only use the subscripts and to denote the predictors from the target or source domains, emphasizing the difference in covariate distribution. This is based on the assumption that the conditional distribution of the outcome remains the same. The DA-CART estimate in the source domain is consistent toward the target domain if as . Based on equation Eq.1, Eq.7, and the formula of , we can obtain , where:
| (10) | ||||
The equivalence implies that two models are expected to produce the same predictions, not the same tree structures. Here, represents an estimate of based on an imaginary data set with sample size in the target domain. In reality, could be treated as the effective sample size related to :
| (11) |
Theorem 1: Suppose , and , DA-CART is consistent toward the target domain, that is,
| (12) |
We will show the proof in the appendix, mainly based on the idea developed by (Nobel, \APACyear1996; Györfi \BOthers., \APACyear2002; Scornet \BOthers., \APACyear2015). In general, we connect the estimates in two domains by importance weights. The assumption in Theorem 1 implies that the depth of CART increases to infinity more slowly than the sample size . The bound of the prediction error of CART is sufficiently controlled by .
5 Simulation study
5.1 Setup
In our study, we conducted a series of simulation tests to evaluate the performance of DA-CART. We generated data from the following model:
| (13) |
where follows a standard normal distribution. We generated data for the entire population using five independent predictors: , , , , and , where and are noise variables. The sub-populations for the source and target domains are derived from this overall population through specific selection processes that will be described later. DA-CART was compared to a generalized linear model tree (GLM-tree), a model-based recursive partitioning algorithm (Rusch \BBA Zeileis, \APACyear2013; Zeileis \BOthers., \APACyear2008) and two CART models: one is built on the source domain (naive CART), while the other is built on the target domain (target CART). GLM-tree combines decision trees with generalized linear models (GLMs) to capture complex relationships within data by fitting GLMs in each leaf of the tree. The GLM-tree is used explicitly in the shifted distribution situation, as GLMs are expected to provide better extrapolation. We also developed the DA-GLM-tree to demonstrate the adaptability of our domain adaptation strategy to other single tree-based models. The naive CART is the default choice for practitioners, and the target CART serves as the benchmark, even though it may not be available in practical applications. We varied the following factors systematically:
-
1.
patterns of covariate shift: restricted range or shifted location.
-
2.
variables in the importance weight model: or and .
-
3.
sample size of the training set: .
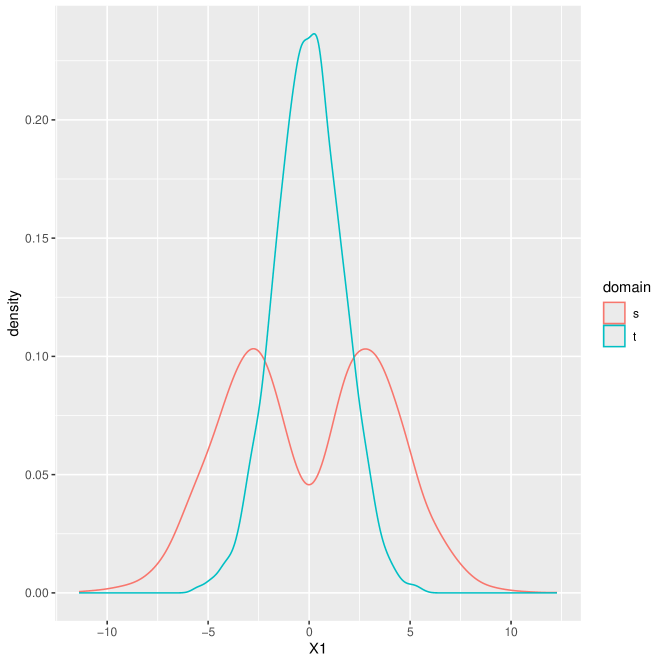
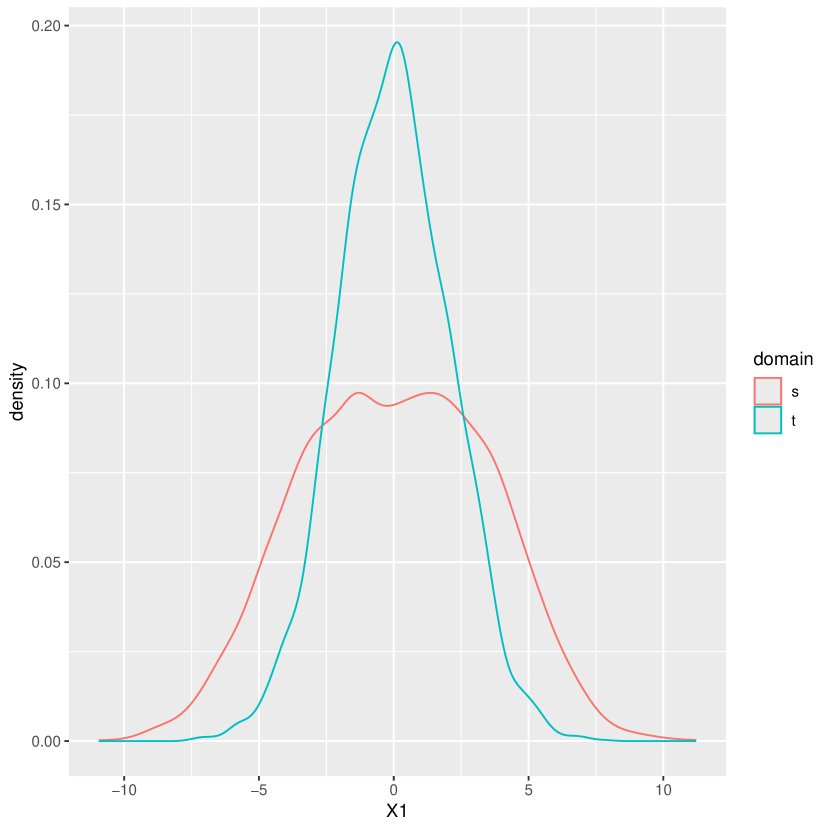
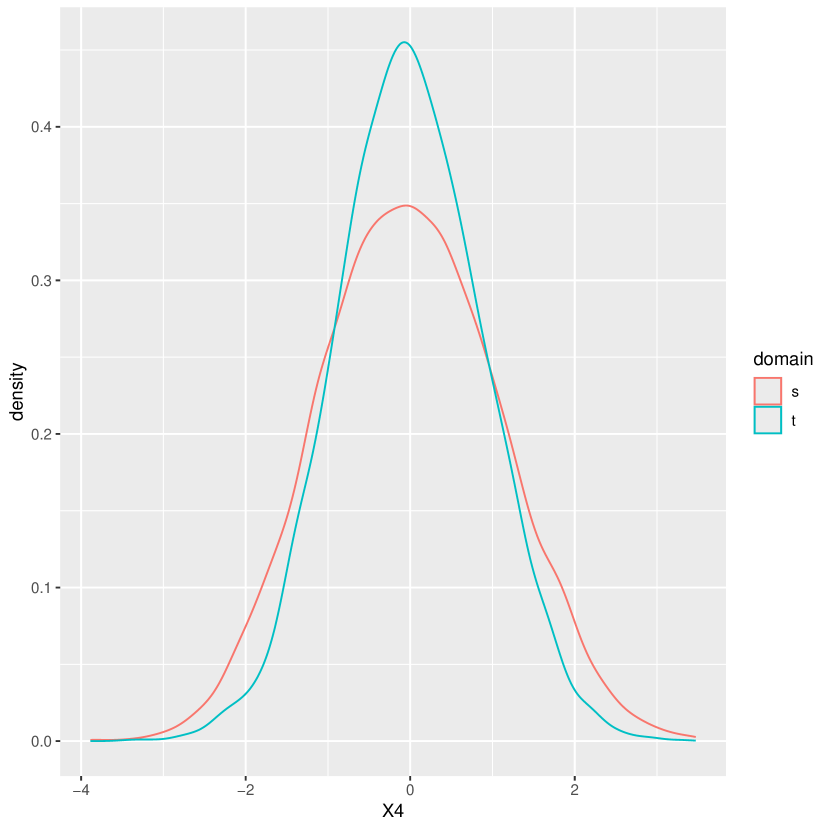
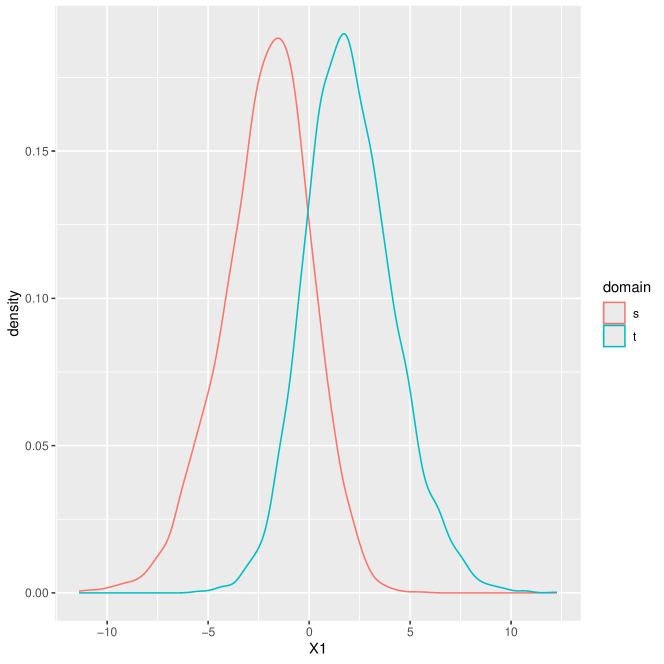
In the context of covariate shift patterns, the importance weight model for the restricted range is defined as . This indicates that units with scores closer to the centre are more likely to be sampled in the target domain. On the other hand, for shifted location, the importance weight model is specified as . In this instance, units with larger score values are more likely to be sampled in the target domain. A unit is assigned to the target domain if and to the source domain otherwise. The score is a linear combination of covariates (Schouten \BOthers., \APACyear2018). We compared two formulas for score: and . The distribution discrepancies of and under different scenarios are presented in the appendix.
We used a CART model and the gain method to select predictive variables from the outcome model. Variables are listed in descending order based on their information gain. We selected the top variables and stopped when the cumulative information gain exceeded 85%. The XGBoost model was used to calculate the importance weights. When , we estimated the importance weight by considering only in the model. When , we first estimated the importance weight using only and then performed an additional estimation by including both and in the XGBoost model111We refer to the importance weight estimated by as the estimated weight 1 (EW1) and by and as the estimated weight 2 (EW2).. In addition to EW1 and EW2, we also incorporated the Kullback-Leibler importance weight estimation (EW3) (Sugiyama \BOthers., \APACyear2007), which is a kernel-based importance weight estimation, and the ‘true’ weight (TW) for comparison. The sample size of the test set is fixed to 10000 in the target domain. The training set could be from the source or target domain.
5.2 Results
5.2.1 Performance under covariate shift
We examined the performance of DA-CART under restricted range and shifted location conditions. The prediction errors are shown in Fig 1. The top two rows show the results under the restricted range condition. DA-CART significantly outperforms the naive CART model when using EW1. When only variable is included in the importance weight model, both propensity-score (EW1) and kernel-based (EW3) weights show similar performance, indicating that either method is suitable for estimating importance weights when all variables predict the outcome.
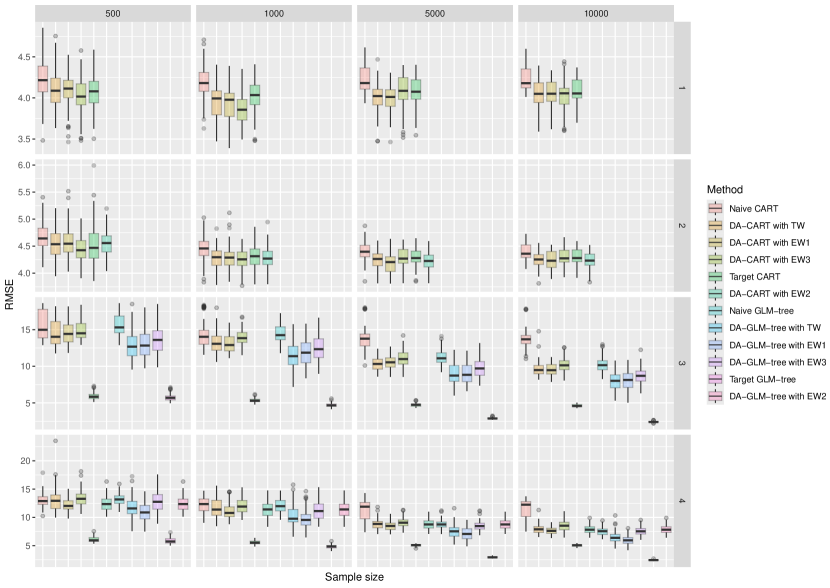
When both and are specified in the importance weight model, EW1 generally produces smaller prediction errors than EW2 and EW3, which incorporate weight-specific variables. Additionally, DA-CART using EW1 demonstrates performance comparable to DA-CART with the ‘true’ weight and target CART, suggesting that XGBoost can effectively estimate weights and supports the validity of Theorem 1.
We also assessed DA-CART’s performance under the shifted location condition, a scenario that challenges tree-based models and importance weight estimation, as noted by (J. Zhang \BBA Shields, \APACyear2019). Our findings indicate that DA-CART is less effective in this context than target CART, which represents optimal performance but is often difficult to achieve in practice. However, as the sample size increases, DA-CART’s performance approaches that of target CART due to the increased likelihood of having representative target domain units in the source domain.
We evaluated GLM-tree models with importance weights (DA-GLM-tree) which is expected to enhance extrapolation capabilities. The proposed domain adaptive framework significantly improves the predictive accuracy of the GLM-tree, demonstrating the potential broad applicability of our approach.
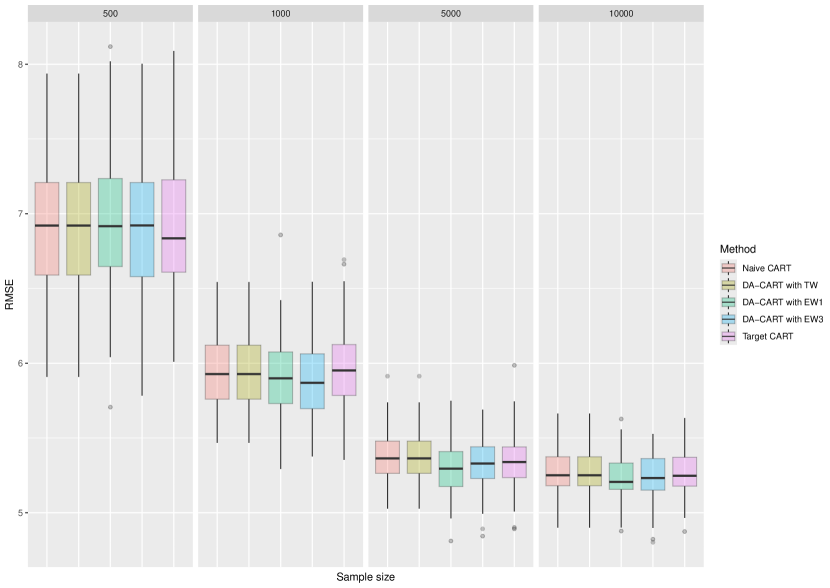
5.2.2 Performance in non-discrepancy scenarios
We also explore the performance of DA-CART when the training and testing sets are drawn from the same distribution, introduced in section 5.1. In this scenario, estimating the importance weight does not worsen prediction performance, as illustrated in Fig. 2.
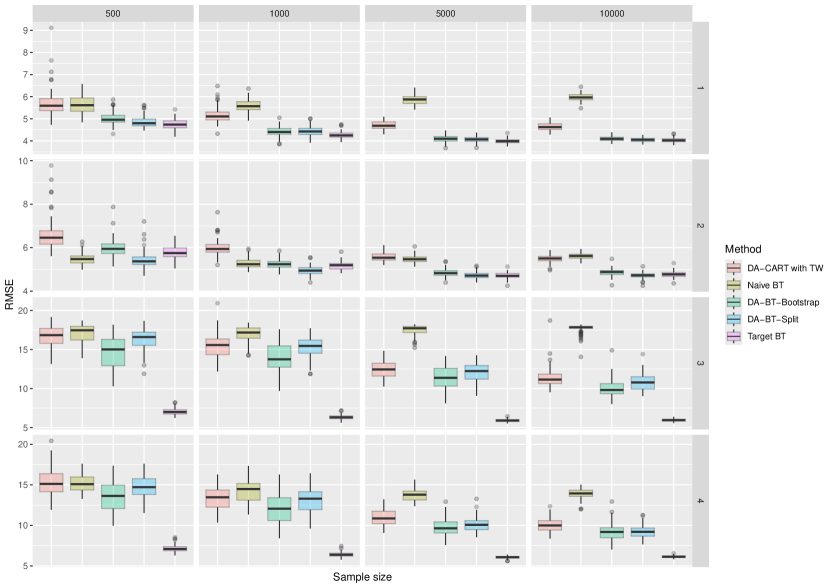
5.2.3 Preliminary investigation of importance weighting in bagged tree (BT) models
In this manuscript, we primarily focus on DA-CART. We also explore how domain adaptation techniques can be used with tree ensembles, specifically bagged trees. We study the performance of DA-BT, which is an extension of DA-CART and incorporates importance weighting into the bagged trees framework. Our analysis focuses on sampling uncertainty, while we do not consider variable selection uncertainty across multiple trees. It allows us to examine domain adaptation’s impact on model performance within tree ensembles.
The details of the simulation settings, such as the data-generating process, sample selection methods, variables used, and sample sizes, can be found in Section 5.1. The result is shown in Fig. 3. In these simulations, we compare DA-BT with various models, including DA-CART. The baseline model, naive bagged trees (BT), uses standard bootstrapping without considering domain shifts. The target BT model, trained only on target domain data, represents the ideal scenario where outcomes in the target domain are observed. DA-BT-Bootstrap incorporates importance weights into the bootstrapping process, adjusting sampling probabilities to align the source and target domains better. Similarly, DA-BT-Split applies importance weights during tree splitting to ensure that the splits accurately reflect the characteristics of the target domain.
Regarding performance, it has been observed that naive bagged trees consistently produce inferior results, especially as the sample sizes increase. This emphasizes the advantage of domain-adaptive models such as DA-CART when significant variations exist between the distributions of the source and target domains. In scenarios with restricted ranges, both DA-BT methods (DA-BT-Bootstrap and DA-BT-Split) perform similarly to the target BT as the sample sizes increase, showcasing their ability to adapt effectively to the target domain. However, this convergence is less common in scenarios with shifted locations, where the differences between the domains are more pronounced.
In comparing the two domain-adaptive bagged trees methods, it has been observed that DA-BT-Bootstrap generally outperforms DA-BT-Split, except in cases with restricted ranges and when the importance weight model is . However, since the uncertainty of variable selection across multiple trees is not considered, which domain-adaptive strategy is definitively superior still needs to be determined.
6 Application
We apply our method to prognosis of Diffuse large B-cell lymphoma (DLBCL) patients to show the performance of DA-CART for classification problem. DLBCL is a common non-Hodgkin lymphoma for which accurate prognosis is challenging because of the patient’s clinical and biological heterogeneity. Hence, the distributions of predictors vary in various medical institutions. Furthermore, since the days of overall survival (OS) and progression-free survival (PFS) often take several years to track, it is time-consuming for a medical institution to collect enough samples to build a prediction model. A reasonable strategy is to create the model on a well-collected training set with consideration of importance weight.
One widely recognised prognostic clinical covariate is the international prognostic index (IPI), which scores patients based on their age, the stage of the tumour, lactose dehydrogenase levels, a mobility measure, and the number of extranodal sites. However, the distributions of IPI are different among four cohorts: PETAL, Chapuy, HO130, and HO84. According to (Goedhart \BOthers., \APACyear2023), two groups of variables, namely copy number values and mutations, cannot be predicted for classification. Therefore, we only include clinical and translocation variables in the model. Additionally, instead of the aggregated international prognostic index, five variables that measure different aspects of IPI were used to allow more flexibility.
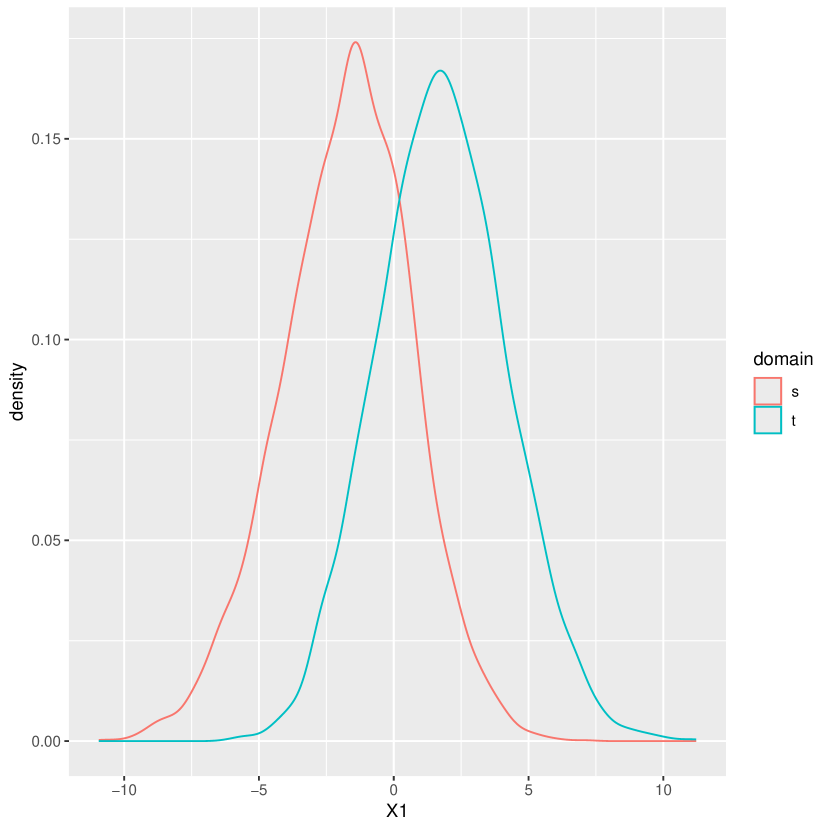
We fit a DA-CART model based on cohorts PETAL, Chapuy and HO130 with 415 patients to predict two-year progression-free survival in cohort HO84 with 190 patients. The data is partitioned to address the apparent distribution discrepancy between the source and target domains, see Fig 4. We treat the outcome as binary because two years is a clinically well-accepted cut-off, and censoring was absent within this period.


The importance weight model includes the variables ”Age”, IPI_LDH”, and ”transMYC”, which together account for 86.5% of the total variable importance. We conducted a comparison between DA-CART and naive CART. The AUC value for DA-CART is 0.655, whereas for naive CART, it is 0.612. The difference between the AUC values is moderately significant, as checked using a one-sided DeLong’s pair test (p = 0.059) (DeLong \BOthers., \APACyear1988). We also compared DA-CART and target CART, which trains and predicts with a 5-fold cross-validation. The AUC value for target CART is 0.66, which does not show significant improvement compared to DA-CART (p = 0.559).


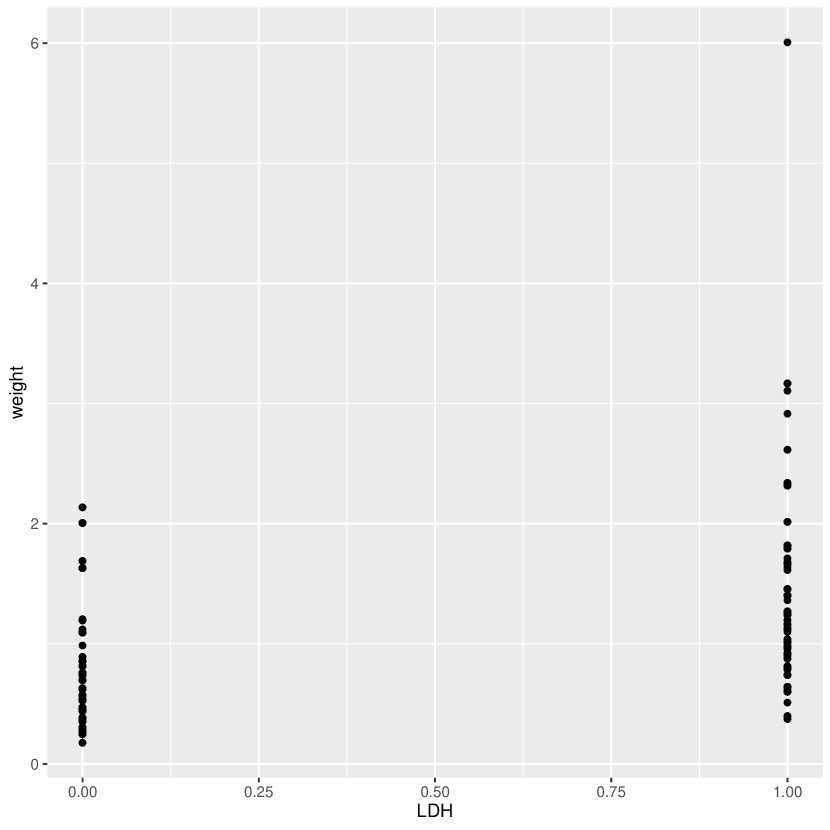
Fig. 5 illustrates how the importance weight affects the proportion estimates and splits. The split value remains constant for binary variables at 0.5, while the proportion changes in child nodes. The split in naive CART and in DA-CART reflects a shift in the mean towards the right (the mean of Age in the target domain is higher than in the source domain). Fig. 6 depicts how the importance weight reflects the distribution discrepancy. Since the variable Age mean shifts towards the right, the importance weights are larger with older patients. Similarly, if , the importance weights will be more significant with the index of .
7 Discussion
We developed a new method called DA-CART, which improves the accuracy of predictions when the strong predictive variables have different distributions between the training and test sets. This is achieved by incorporating importance weight into the CART algorithm. We have proven the consistency of DA-CART, which was also demonstrated in simulations. The method is particularly effective when the target dataset has a restricted range or a minor shifted location relative to the source dataset. However, when there is a larger shifted location between the distributions, the predictions can be degraded, and a larger training set is needed. In practice, it is generally reasonable to assume that the source and target domain share the same support. As the source sample size grows, the probability of samples from the target appearing in the source set increases despite potential differences in their covariate distributions.
This manuscript focuses on CART, a single-tree model essential to random forests. DA-CART can be extended to random forest by incorporating importance weight with bagging techniques, involving specifying sampling weight with importance weight for bootstrap and incorporating importance weight into the splitting criterion. However, adding importance weight to the splitting criterion could lead to the generalization of more tree models that do not use bagging. For gradient descent optimization algorithms, the general function (Ruder, \APACyear2016) to be minimized is given by the equation:
| (14) |
The Generalized Random Forests (Athey \BOthers., \APACyear2019) incorporates a tree-based weight in gradient-based splitting to implement the concept of local maximum likelihood. We conducted a simple simulation study to illustrate how weighted bagging and splitting criteria can enhance prediction performance in domain adaptation frameworks.
For future research, significant opportunities exist to explore the domain adaptation challenge for non-adaptive splitting tree models, for example, with Bayesian Additive Regression Trees. Unlike adaptive models, which use optimization-based criteria to determine informative splits, BART faces difficulties in effectively transferring knowledge across domains with differing data distributions. Investigating how to incorporate sample weights with BART and exploring the integration of importance weights for tree-based models within the Bayesian framework would be valuable. It remains to be seen whether these weights should be included in the likelihood or prior components, presenting an exciting avenue for investigation. There is still an open question about tuning hyperparameters of tree models using cross-validation when using importance weight. This problem arises because the separate validation set from the source may not have the same covariate distribution as the target set. This manuscript used the default hyperparameters provided in R packages for all models.
8 Appendix
8.1 Performance comparison under sample selection bias
In order to compare the performance of a linear regression model and a CART model with sample selection bias for the source and target domains, we conducted a simple example. The dataset included 2000 samples with three standard normally distributed covariates: . The outcome variable was created as a linear combination of the covariates , where represents standard normally distributed error terms. The probability of a sample being assigned to the source domain was determined using a logistic function based on : . Based on this probability, samples were then split into source and target domains. We fitted a linear regression and a CART model to the source domain and evaluated the Mean Squared Error on the target domain. The simulation was repeated 100 times, resulting in a mean MSE of 1.01 for the linear regression model and 5.55 for the CART model.
8.2 Proof
Notations: The partition derived from the data set is denoted by . We define as the number of cells among the partition . Given a dataset , denotes the number of distinct partitions of .
Let be a positive sequence, and define the truncated operator by
We further define and .
To prove Theorem 1, we need to first work out the Theorem 10.2 in (Györfi \BOthers., \APACyear2002) for DA-CART.
Theorem 2: Assume that:
-
1.
-
2.
-
3.
for all ,
Then
| (15) |
Proof:
Statement 1: let , then .
Statement 2: Let , where is an arbitrary point of the in cell . Because , and for large enough , , we have:
where is the cell of the DA-CART built in the source domain that contains , and is the variation of within cell :
Based on the proposition 2 in (Scornet \BOthers., \APACyear2015), for large enough , , which concludes statement 2.
Statement 3: fix ,Then for all large enough such that ,
Based on Eq. 10, it is reasonable to assume an imaginary data in the target domain where we can derive an estimate is the same as . In the following proof, the subscript of some notations will become , which have the same meaning but in terms of .
where as (Scornet \BOthers., \APACyear2015). Finally, since
for large enough ,
which concludes statement 3. Hence
For untruncated estimates:
Since ,
Because
and ’s are normal distributed with mean 0. For ,
This complete the proof of theorem 1.
8.3 The distribution discrepancies of and .
The two-sample Kolmogorov-Smirnov test for the distribution discrepancy under all selection mechanisms are significant (p 0).
References
- Athey \BOthers. (\APACyear2019) \APACinsertmetastarathey2019generalized{APACrefauthors}Athey, S., Tibshirani, J.\BCBL \BBA Wager, S. \APACrefYearMonthDay2019. \BBOQ\APACrefatitleGeneralized random forests Generalized random forests.\BBCQ \PrintBackRefs\CurrentBib
- Bousmalis \BOthers. (\APACyear2017) \APACinsertmetastarbousmalis2017unsupervised{APACrefauthors}Bousmalis, K., Silberman, N., Dohan, D., Erhan, D.\BCBL \BBA Krishnan, D. \APACrefYearMonthDay2017. \BBOQ\APACrefatitleUnsupervised pixel-level domain adaptation with generative adversarial networks Unsupervised pixel-level domain adaptation with generative adversarial networks.\BBCQ \BIn \APACrefbtitleProceedings of the IEEE conference on computer vision and pattern recognition Proceedings of the ieee conference on computer vision and pattern recognition (\BPGS 3722–3731). \PrintBackRefs\CurrentBib
- Breiman (\APACyear2001) \APACinsertmetastarbreiman2001random{APACrefauthors}Breiman, L. \APACrefYearMonthDay2001. \BBOQ\APACrefatitleRandom forests Random forests.\BBCQ \APACjournalVolNumPagesMachine learning455–32. \PrintBackRefs\CurrentBib
- Breiman (\APACyear2017) \APACinsertmetastarbreiman2017classification{APACrefauthors}Breiman, L. \APACrefYear2017. \APACrefbtitleClassification and regression trees Classification and regression trees. \APACaddressPublisherRoutledge. \PrintBackRefs\CurrentBib
- Brookhart \BOthers. (\APACyear2006) \APACinsertmetastarbrookhart2006variable{APACrefauthors}Brookhart, M\BPBIA., Schneeweiss, S., Rothman, K\BPBIJ., Glynn, R\BPBIJ., Avorn, J.\BCBL \BBA Stürmer, T. \APACrefYearMonthDay2006. \BBOQ\APACrefatitleVariable selection for propensity score models Variable selection for propensity score models.\BBCQ \APACjournalVolNumPagesAmerican journal of epidemiology163121149–1156. \PrintBackRefs\CurrentBib
- Carry \BOthers. (\APACyear2021) \APACinsertmetastarcarry2021inverse{APACrefauthors}Carry, P\BPBIM., Vanderlinden, L\BPBIA., Dong, F., Buckner, T., Litkowski, E., Vigers, T.\BDBLKechris, K. \APACrefYearMonthDay2021. \BBOQ\APACrefatitleInverse probability weighting is an effective method to address selection bias during the analysis of high dimensional data Inverse probability weighting is an effective method to address selection bias during the analysis of high dimensional data.\BBCQ \APACjournalVolNumPagesGenetic epidemiology456593–603. \PrintBackRefs\CurrentBib
- Chen \BBA Guestrin (\APACyear2016) \APACinsertmetastarchen2016xgboost{APACrefauthors}Chen, T.\BCBT \BBA Guestrin, C. \APACrefYearMonthDay2016. \BBOQ\APACrefatitleXgboost: A scalable tree boosting system Xgboost: A scalable tree boosting system.\BBCQ \BIn \APACrefbtitleProceedings of the 22nd acm sigkdd international conference on knowledge discovery and data mining Proceedings of the 22nd acm sigkdd international conference on knowledge discovery and data mining (\BPGS 785–794). \PrintBackRefs\CurrentBib
- Chipman \BOthers. (\APACyear2010) \APACinsertmetastarchipman2010bart{APACrefauthors}Chipman, H\BPBIA., George, E\BPBII.\BCBL \BBA McCulloch, R\BPBIE. \APACrefYearMonthDay2010. \BBOQ\APACrefatitleBART: Bayesian additive regression trees Bart: Bayesian additive regression trees.\BBCQ \PrintBackRefs\CurrentBib
- Cortes \BOthers. (\APACyear2008) \APACinsertmetastarcortes2008sample{APACrefauthors}Cortes, C., Mohri, M., Riley, M.\BCBL \BBA Rostamizadeh, A. \APACrefYearMonthDay2008. \BBOQ\APACrefatitleSample selection bias correction theory Sample selection bias correction theory.\BBCQ \BIn \APACrefbtitleInternational conference on algorithmic learning theory International conference on algorithmic learning theory (\BPGS 38–53). \PrintBackRefs\CurrentBib
- DeLong \BOthers. (\APACyear1988) \APACinsertmetastardelong1988comparing{APACrefauthors}DeLong, E\BPBIR., DeLong, D\BPBIM.\BCBL \BBA Clarke-Pearson, D\BPBIL. \APACrefYearMonthDay1988. \BBOQ\APACrefatitleComparing the areas under two or more correlated receiver operating characteristic curves: a nonparametric approach Comparing the areas under two or more correlated receiver operating characteristic curves: a nonparametric approach.\BBCQ \APACjournalVolNumPagesBiometrics837–845. \PrintBackRefs\CurrentBib
- Duan \BOthers. (\APACyear2009) \APACinsertmetastarduan2009domain{APACrefauthors}Duan, L., Tsang, I\BPBIW., Xu, D.\BCBL \BBA Chua, T\BHBIS. \APACrefYearMonthDay2009. \BBOQ\APACrefatitleDomain adaptation from multiple sources via auxiliary classifiers Domain adaptation from multiple sources via auxiliary classifiers.\BBCQ \BIn \APACrefbtitleProceedings of the 26th annual international conference on machine learning Proceedings of the 26th annual international conference on machine learning (\BPGS 289–296). \PrintBackRefs\CurrentBib
- Farahani \BOthers. (\APACyear2021) \APACinsertmetastarfarahani2021brief{APACrefauthors}Farahani, A., Voghoei, S., Rasheed, K.\BCBL \BBA Arabnia, H\BPBIR. \APACrefYearMonthDay2021. \BBOQ\APACrefatitleA brief review of domain adaptation A brief review of domain adaptation.\BBCQ \APACjournalVolNumPagesAdvances in data science and information engineering: proceedings from ICDATA 2020 and IKE 2020877–894. \PrintBackRefs\CurrentBib
- Fernando \BOthers. (\APACyear2013) \APACinsertmetastarfernando2013unsupervised{APACrefauthors}Fernando, B., Habrard, A., Sebban, M.\BCBL \BBA Tuytelaars, T. \APACrefYearMonthDay2013. \BBOQ\APACrefatitleUnsupervised visual domain adaptation using subspace alignment Unsupervised visual domain adaptation using subspace alignment.\BBCQ \BIn \APACrefbtitleProceedings of the IEEE international conference on computer vision Proceedings of the ieee international conference on computer vision (\BPGS 2960–2967). \PrintBackRefs\CurrentBib
- Ganin \BBA Lempitsky (\APACyear2015) \APACinsertmetastarganin2015unsupervised{APACrefauthors}Ganin, Y.\BCBT \BBA Lempitsky, V. \APACrefYearMonthDay2015. \BBOQ\APACrefatitleUnsupervised domain adaptation by backpropagation Unsupervised domain adaptation by backpropagation.\BBCQ \BIn \APACrefbtitleInternational conference on machine learning International conference on machine learning (\BPGS 1180–1189). \PrintBackRefs\CurrentBib
- Ghifary \BOthers. (\APACyear2016) \APACinsertmetastarghifary2016deep{APACrefauthors}Ghifary, M., Kleijn, W\BPBIB., Zhang, M., Balduzzi, D.\BCBL \BBA Li, W. \APACrefYearMonthDay2016. \BBOQ\APACrefatitleDeep reconstruction-classification networks for unsupervised domain adaptation Deep reconstruction-classification networks for unsupervised domain adaptation.\BBCQ \BIn \APACrefbtitleComputer Vision–ECCV 2016: 14th European Conference, Amsterdam, The Netherlands, October 11–14, 2016, Proceedings, Part IV 14 Computer vision–eccv 2016: 14th european conference, amsterdam, the netherlands, october 11–14, 2016, proceedings, part iv 14 (\BPGS 597–613). \PrintBackRefs\CurrentBib
- Glorot \BOthers. (\APACyear2011) \APACinsertmetastarglorot2011domain{APACrefauthors}Glorot, X., Bordes, A.\BCBL \BBA Bengio, Y. \APACrefYearMonthDay2011. \BBOQ\APACrefatitleDomain adaptation for large-scale sentiment classification: A deep learning approach Domain adaptation for large-scale sentiment classification: A deep learning approach.\BBCQ \BIn \APACrefbtitleProceedings of the 28th international conference on machine learning (ICML-11) Proceedings of the 28th international conference on machine learning (icml-11) (\BPGS 513–520). \PrintBackRefs\CurrentBib
- Goedhart \BOthers. (\APACyear2023) \APACinsertmetastargoedhart2023co{APACrefauthors}Goedhart, J\BPBIM., Klausch, T., Janssen, J.\BCBL \BBA van de Wiel, M\BPBIA. \APACrefYearMonthDay2023. \BBOQ\APACrefatitleCo-data Learning for Bayesian Additive Regression Trees Co-data learning for bayesian additive regression trees.\BBCQ \APACjournalVolNumPagesarXiv preprint arXiv:2311.09997. \PrintBackRefs\CurrentBib
- Gong \BOthers. (\APACyear2012) \APACinsertmetastargong2012geodesic{APACrefauthors}Gong, B., Shi, Y., Sha, F.\BCBL \BBA Grauman, K. \APACrefYearMonthDay2012. \BBOQ\APACrefatitleGeodesic flow kernel for unsupervised domain adaptation Geodesic flow kernel for unsupervised domain adaptation.\BBCQ \BIn \APACrefbtitle2012 IEEE conference on computer vision and pattern recognition 2012 ieee conference on computer vision and pattern recognition (\BPGS 2066–2073). \PrintBackRefs\CurrentBib
- Gopalan \BOthers. (\APACyear2011) \APACinsertmetastargopalan2011domain{APACrefauthors}Gopalan, R., Li, R.\BCBL \BBA Chellappa, R. \APACrefYearMonthDay2011. \BBOQ\APACrefatitleDomain adaptation for object recognition: An unsupervised approach Domain adaptation for object recognition: An unsupervised approach.\BBCQ \BIn \APACrefbtitle2011 international conference on computer vision 2011 international conference on computer vision (\BPGS 999–1006). \PrintBackRefs\CurrentBib
- Guo \BBA Fraser (\APACyear2014) \APACinsertmetastarguo2014propensity{APACrefauthors}Guo, S.\BCBT \BBA Fraser, M\BPBIW. \APACrefYear2014. \APACrefbtitlePropensity score analysis: Statistical methods and applications Propensity score analysis: Statistical methods and applications (\BVOL 11). \APACaddressPublisherSAGE publications. \PrintBackRefs\CurrentBib
- Györfi \BOthers. (\APACyear2002) \APACinsertmetastargyorfi2002distribution{APACrefauthors}Györfi, L., Kohler, M., Krzyzak, A., Walk, H.\BCBL \BOthersPeriod. \APACrefYear2002. \APACrefbtitleA distribution-free theory of nonparametric regression A distribution-free theory of nonparametric regression (\BVOL 1). \APACaddressPublisherSpringer. \PrintBackRefs\CurrentBib
- Hastie \BOthers. (\APACyear2009) \APACinsertmetastarhastie2009elements{APACrefauthors}Hastie, T., Tibshirani, R., Friedman, J\BPBIH.\BCBL \BBA Friedman, J\BPBIH. \APACrefYear2009. \APACrefbtitleThe elements of statistical learning: data mining, inference, and prediction The elements of statistical learning: data mining, inference, and prediction (\BVOL 2). \APACaddressPublisherSpringer. \PrintBackRefs\CurrentBib
- Hoffman \BOthers. (\APACyear2018) \APACinsertmetastarhoffman2018cycada{APACrefauthors}Hoffman, J., Tzeng, E., Park, T., Zhu, J\BHBIY., Isola, P., Saenko, K.\BDBLDarrell, T. \APACrefYearMonthDay2018. \BBOQ\APACrefatitleCycada: Cycle-consistent adversarial domain adaptation Cycada: Cycle-consistent adversarial domain adaptation.\BBCQ \BIn \APACrefbtitleInternational conference on machine learning International conference on machine learning (\BPGS 1989–1998). \PrintBackRefs\CurrentBib
- Huang \BOthers. (\APACyear2006) \APACinsertmetastarhuang2006correcting{APACrefauthors}Huang, J., Gretton, A., Borgwardt, K., Schölkopf, B.\BCBL \BBA Smola, A. \APACrefYearMonthDay2006. \BBOQ\APACrefatitleCorrecting sample selection bias by unlabeled data Correcting sample selection bias by unlabeled data.\BBCQ \APACjournalVolNumPagesAdvances in neural information processing systems19. \PrintBackRefs\CurrentBib
- Huynh-Thu \BOthers. (\APACyear2010) \APACinsertmetastarhuynh2010inferring{APACrefauthors}Huynh-Thu, V\BPBIA., Irrthum, A., Wehenkel, L.\BCBL \BBA Geurts, P. \APACrefYearMonthDay2010. \BBOQ\APACrefatitleInferring regulatory networks from expression data using tree-based methods Inferring regulatory networks from expression data using tree-based methods.\BBCQ \APACjournalVolNumPagesPloS one59e12776. \PrintBackRefs\CurrentBib
- Jhuo \BOthers. (\APACyear2012) \APACinsertmetastarjhuo2012robust{APACrefauthors}Jhuo, I\BHBIH., Liu, D., Lee, D.\BCBL \BBA Chang, S\BHBIF. \APACrefYearMonthDay2012. \BBOQ\APACrefatitleRobust visual domain adaptation with low-rank reconstruction Robust visual domain adaptation with low-rank reconstruction.\BBCQ \BIn \APACrefbtitle2012 IEEE conference on computer vision and pattern recognition 2012 ieee conference on computer vision and pattern recognition (\BPGS 2168–2175). \PrintBackRefs\CurrentBib
- Ke \BOthers. (\APACyear2017) \APACinsertmetastarke2017lightgbm{APACrefauthors}Ke, G., Meng, Q., Finley, T., Wang, T., Chen, W., Ma, W.\BDBLLiu, T\BHBIY. \APACrefYearMonthDay2017. \BBOQ\APACrefatitleLightgbm: A highly efficient gradient boosting decision tree Lightgbm: A highly efficient gradient boosting decision tree.\BBCQ \APACjournalVolNumPagesAdvances in neural information processing systems30. \PrintBackRefs\CurrentBib
- Kouw \BBA Loog (\APACyear2019) \APACinsertmetastarkouw2019review{APACrefauthors}Kouw, W\BPBIM.\BCBT \BBA Loog, M. \APACrefYearMonthDay2019. \BBOQ\APACrefatitleA review of domain adaptation without target labels A review of domain adaptation without target labels.\BBCQ \APACjournalVolNumPagesIEEE transactions on pattern analysis and machine intelligence433766–785. \PrintBackRefs\CurrentBib
- Little \BBA Rubin (\APACyear2019) \APACinsertmetastarlittle2019statistical{APACrefauthors}Little, R\BPBIJ.\BCBT \BBA Rubin, D\BPBIB. \APACrefYear2019. \APACrefbtitleStatistical analysis with missing data Statistical analysis with missing data (\BVOL 793). \APACaddressPublisherJohn Wiley & Sons. \PrintBackRefs\CurrentBib
- Long \BOthers. (\APACyear2015) \APACinsertmetastarlong2015learning{APACrefauthors}Long, M., Cao, Y., Wang, J.\BCBL \BBA Jordan, M. \APACrefYearMonthDay2015. \BBOQ\APACrefatitleLearning transferable features with deep adaptation networks Learning transferable features with deep adaptation networks.\BBCQ \BIn \APACrefbtitleInternational conference on machine learning International conference on machine learning (\BPGS 97–105). \PrintBackRefs\CurrentBib
- Long \BOthers. (\APACyear2013) \APACinsertmetastarlong2013transfer{APACrefauthors}Long, M., Wang, J., Ding, G., Sun, J.\BCBL \BBA Yu, P\BPBIS. \APACrefYearMonthDay2013. \BBOQ\APACrefatitleTransfer feature learning with joint distribution adaptation Transfer feature learning with joint distribution adaptation.\BBCQ \BIn \APACrefbtitleProceedings of the IEEE international conference on computer vision Proceedings of the ieee international conference on computer vision (\BPGS 2200–2207). \PrintBackRefs\CurrentBib
- Lundberg \BOthers. (\APACyear2020) \APACinsertmetastarlundberg2020local{APACrefauthors}Lundberg, S\BPBIM., Erion, G., Chen, H., DeGrave, A., Prutkin, J\BPBIM., Nair, B.\BDBLLee, S\BHBII. \APACrefYearMonthDay2020. \BBOQ\APACrefatitleFrom local explanations to global understanding with explainable AI for trees From local explanations to global understanding with explainable ai for trees.\BBCQ \APACjournalVolNumPagesNature machine intelligence2156–67. \PrintBackRefs\CurrentBib
- Lundberg \BOthers. (\APACyear2018) \APACinsertmetastarlundberg2018consistent{APACrefauthors}Lundberg, S\BPBIM., Erion, G\BPBIG.\BCBL \BBA Lee, S\BHBII. \APACrefYearMonthDay2018. \BBOQ\APACrefatitleConsistent individualized feature attribution for tree ensembles Consistent individualized feature attribution for tree ensembles.\BBCQ \APACjournalVolNumPagesarXiv preprint arXiv:1802.03888. \PrintBackRefs\CurrentBib
- Mourragui (\APACyear2023) \APACinsertmetastarmourragui2023computational{APACrefauthors}Mourragui, S\BPBIM\BPBIC. \APACrefYearMonthDay2023. \BBOQ\APACrefatitleComputational models for clinical drug response prediction: aligning transcriptomic data of patients and pre-clinical models Computational models for clinical drug response prediction: aligning transcriptomic data of patients and pre-clinical models.\BBCQ \PrintBackRefs\CurrentBib
- Nobel (\APACyear1996) \APACinsertmetastarnobel1996histogram{APACrefauthors}Nobel, A. \APACrefYearMonthDay1996. \BBOQ\APACrefatitleHistogram regression estimation using data-dependent partitions Histogram regression estimation using data-dependent partitions.\BBCQ \APACjournalVolNumPagesThe Annals of Statistics2431084–1105. \PrintBackRefs\CurrentBib
- Pan \BOthers. (\APACyear2010) \APACinsertmetastarpan2010domain{APACrefauthors}Pan, S\BPBIJ., Tsang, I\BPBIW., Kwok, J\BPBIT.\BCBL \BBA Yang, Q. \APACrefYearMonthDay2010. \BBOQ\APACrefatitleDomain adaptation via transfer component analysis Domain adaptation via transfer component analysis.\BBCQ \APACjournalVolNumPagesIEEE transactions on neural networks222199–210. \PrintBackRefs\CurrentBib
- Pan \BBA Yang (\APACyear2009) \APACinsertmetastarpan2009survey{APACrefauthors}Pan, S\BPBIJ.\BCBT \BBA Yang, Q. \APACrefYearMonthDay2009. \BBOQ\APACrefatitleA survey on transfer learning A survey on transfer learning.\BBCQ \APACjournalVolNumPagesIEEE Transactions on knowledge and data engineering22101345–1359. \PrintBackRefs\CurrentBib
- Ruder (\APACyear2016) \APACinsertmetastarruder2016overview{APACrefauthors}Ruder, S. \APACrefYearMonthDay2016. \BBOQ\APACrefatitleAn overview of gradient descent optimization algorithms An overview of gradient descent optimization algorithms.\BBCQ \APACjournalVolNumPagesarXiv preprint arXiv:1609.04747. \PrintBackRefs\CurrentBib
- Rusch \BBA Zeileis (\APACyear2013) \APACinsertmetastarrusch2013gaining{APACrefauthors}Rusch, T.\BCBT \BBA Zeileis, A. \APACrefYearMonthDay2013. \BBOQ\APACrefatitleGaining insight with recursive partitioning of generalized linear models Gaining insight with recursive partitioning of generalized linear models.\BBCQ \APACjournalVolNumPagesJournal of Statistical Computation and Simulation8371301–1315. \PrintBackRefs\CurrentBib
- Sandri \BBA Zuccolotto (\APACyear2008) \APACinsertmetastarsandri2008bias{APACrefauthors}Sandri, M.\BCBT \BBA Zuccolotto, P. \APACrefYearMonthDay2008. \BBOQ\APACrefatitleA bias correction algorithm for the Gini variable importance measure in classification trees A bias correction algorithm for the gini variable importance measure in classification trees.\BBCQ \APACjournalVolNumPagesJournal of Computational and Graphical Statistics173611–628. \PrintBackRefs\CurrentBib
- Schouten \BOthers. (\APACyear2018) \APACinsertmetastarschouten2018generating{APACrefauthors}Schouten, R\BPBIM., Lugtig, P.\BCBL \BBA Vink, G. \APACrefYearMonthDay2018. \BBOQ\APACrefatitleGenerating missing values for simulation purposes: a multivariate amputation procedure Generating missing values for simulation purposes: a multivariate amputation procedure.\BBCQ \APACjournalVolNumPagesJournal of Statistical Computation and Simulation88152909–2930. \PrintBackRefs\CurrentBib
- Scornet \BOthers. (\APACyear2015) \APACinsertmetastarscornet2015consistency{APACrefauthors}Scornet, E., Biau, G.\BCBL \BBA Vert, J\BHBIP. \APACrefYearMonthDay2015. \BBOQ\APACrefatitleConsistency of random forests Consistency of random forests.\BBCQ \PrintBackRefs\CurrentBib
- Segev \BOthers. (\APACyear2016) \APACinsertmetastarsegev2016learn{APACrefauthors}Segev, N., Harel, M., Mannor, S., Crammer, K.\BCBL \BBA El-Yaniv, R. \APACrefYearMonthDay2016. \BBOQ\APACrefatitleLearn on source, refine on target: A model transfer learning framework with random forests Learn on source, refine on target: A model transfer learning framework with random forests.\BBCQ \APACjournalVolNumPagesIEEE transactions on pattern analysis and machine intelligence3991811–1824. \PrintBackRefs\CurrentBib
- Shao \BOthers. (\APACyear2014) \APACinsertmetastarshao2014generalized{APACrefauthors}Shao, M., Kit, D.\BCBL \BBA Fu, Y. \APACrefYearMonthDay2014. \BBOQ\APACrefatitleGeneralized transfer subspace learning through low-rank constraint Generalized transfer subspace learning through low-rank constraint.\BBCQ \APACjournalVolNumPagesInternational Journal of Computer Vision109174–93. \PrintBackRefs\CurrentBib
- Sugiyama \BOthers. (\APACyear2007) \APACinsertmetastarsugiyama2007direct{APACrefauthors}Sugiyama, M., Nakajima, S., Kashima, H., Buenau, P.\BCBL \BBA Kawanabe, M. \APACrefYearMonthDay2007. \BBOQ\APACrefatitleDirect importance estimation with model selection and its application to covariate shift adaptation Direct importance estimation with model selection and its application to covariate shift adaptation.\BBCQ \APACjournalVolNumPagesAdvances in neural information processing systems20. \PrintBackRefs\CurrentBib
- Sun \BOthers. (\APACyear2022) \APACinsertmetastarsun2022transboost{APACrefauthors}Sun, Y., Lu, T., Wang, C., Li, Y., Fu, H., Dong, J.\BCBL \BBA Xu, Y. \APACrefYearMonthDay2022. \BBOQ\APACrefatitleTransboost: A boosting-tree kernel transfer learning algorithm for improving financial inclusion Transboost: A boosting-tree kernel transfer learning algorithm for improving financial inclusion.\BBCQ \BIn \APACrefbtitleProceedings of the AAAI Conference on Artificial Intelligence Proceedings of the aaai conference on artificial intelligence (\BVOL 36, \BPGS 12181–12190). \PrintBackRefs\CurrentBib
- Therneau \BBA Atkinson (\APACyear2023) \APACinsertmetastartherneau2023introduction{APACrefauthors}Therneau, T\BPBIM.\BCBT \BBA Atkinson, E\BPBIJ. \APACrefYearMonthDay2023. \BBOQ\APACrefatitleAn Introduction to Recursive Partitioning Using the RPART Routines An introduction to recursive partitioning using the rpart routines.\BBCQ \PrintBackRefs\CurrentBib
- Tommasi \BBA Caputo (\APACyear2009) \APACinsertmetastartommasi2009more{APACrefauthors}Tommasi, T.\BCBT \BBA Caputo, B. \APACrefYearMonthDay2009. \BBOQ\APACrefatitleThe more you know, the less you learn: from knowledge transfer to one-shot learning of object categories The more you know, the less you learn: from knowledge transfer to one-shot learning of object categories.\BBCQ \BIn \APACrefbtitleProceedings of the British Machine Vision Conference Proceedings of the british machine vision conference (\BPGS 80–1). \PrintBackRefs\CurrentBib
- Tripepi \BOthers. (\APACyear2010) \APACinsertmetastartripepi2010selection{APACrefauthors}Tripepi, G., Jager, K\BPBIJ., Dekker, F\BPBIW.\BCBL \BBA Zoccali, C. \APACrefYearMonthDay2010. \BBOQ\APACrefatitleSelection bias and information bias in clinical research Selection bias and information bias in clinical research.\BBCQ \APACjournalVolNumPagesNephron Clinical Practice1152c94–c99. \PrintBackRefs\CurrentBib
- Tzeng \BOthers. (\APACyear2015) \APACinsertmetastartzeng2015simultaneous{APACrefauthors}Tzeng, E., Hoffman, J., Darrell, T.\BCBL \BBA Saenko, K. \APACrefYearMonthDay2015. \BBOQ\APACrefatitleSimultaneous deep transfer across domains and tasks Simultaneous deep transfer across domains and tasks.\BBCQ \BIn \APACrefbtitleProceedings of the IEEE international conference on computer vision Proceedings of the ieee international conference on computer vision (\BPGS 4068–4076). \PrintBackRefs\CurrentBib
- Weiss \BOthers. (\APACyear2016) \APACinsertmetastarweiss2016survey{APACrefauthors}Weiss, K., Khoshgoftaar, T\BPBIM.\BCBL \BBA Wang, D. \APACrefYearMonthDay2016. \BBOQ\APACrefatitleA survey of transfer learning A survey of transfer learning.\BBCQ \APACjournalVolNumPagesJournal of Big data31–40. \PrintBackRefs\CurrentBib
- Zadrozny (\APACyear2004) \APACinsertmetastarzadrozny2004learning{APACrefauthors}Zadrozny, B. \APACrefYearMonthDay2004. \BBOQ\APACrefatitleLearning and evaluating classifiers under sample selection bias Learning and evaluating classifiers under sample selection bias.\BBCQ \BIn \APACrefbtitleProceedings of the twenty-first international conference on Machine learning Proceedings of the twenty-first international conference on machine learning (\BPG 114). \PrintBackRefs\CurrentBib
- Zeileis \BOthers. (\APACyear2008) \APACinsertmetastarzeileis2008model{APACrefauthors}Zeileis, A., Hothorn, T.\BCBL \BBA Hornik, K. \APACrefYearMonthDay2008. \BBOQ\APACrefatitleModel-based recursive partitioning Model-based recursive partitioning.\BBCQ \APACjournalVolNumPagesJournal of Computational and Graphical Statistics172492–514. \PrintBackRefs\CurrentBib
- J. Zhang \BBA Shields (\APACyear2019) \APACinsertmetastarzhang2019efficient{APACrefauthors}Zhang, J.\BCBT \BBA Shields, M\BPBID. \APACrefYearMonthDay2019. \BBOQ\APACrefatitleEfficient Monte Carlo resampling for probability measure changes from Bayesian updating Efficient monte carlo resampling for probability measure changes from bayesian updating.\BBCQ \APACjournalVolNumPagesProbabilistic Engineering Mechanics5554–66. \PrintBackRefs\CurrentBib
- X. Zhang \BOthers. (\APACyear2015) \APACinsertmetastarzhang2015deep{APACrefauthors}Zhang, X., Yu, F\BPBIX., Chang, S\BHBIF.\BCBL \BBA Wang, S. \APACrefYearMonthDay2015. \BBOQ\APACrefatitleDeep transfer network: Unsupervised domain adaptation Deep transfer network: Unsupervised domain adaptation.\BBCQ \APACjournalVolNumPagesarXiv preprint arXiv:1503.00591. \PrintBackRefs\CurrentBib
- Zhuang \BOthers. (\APACyear2011) \APACinsertmetastarzhuang2011exploiting{APACrefauthors}Zhuang, F., Luo, P., Xiong, H., He, Q., Xiong, Y.\BCBL \BBA Shi, Z. \APACrefYearMonthDay2011. \BBOQ\APACrefatitleExploiting associations between word clusters and document classes for cross-domain text categorization Exploiting associations between word clusters and document classes for cross-domain text categorization.\BBCQ \APACjournalVolNumPagesStatistical Analysis and Data Mining: The ASA Data Science Journal41100–114. \PrintBackRefs\CurrentBib
- Zhuang \BOthers. (\APACyear2020) \APACinsertmetastarzhuang2020comprehensive{APACrefauthors}Zhuang, F., Qi, Z., Duan, K., Xi, D., Zhu, Y., Zhu, H.\BDBLHe, Q. \APACrefYearMonthDay2020. \BBOQ\APACrefatitleA comprehensive survey on transfer learning A comprehensive survey on transfer learning.\BBCQ \APACjournalVolNumPagesProceedings of the IEEE109143–76. \PrintBackRefs\CurrentBib