Absence of Acoustic Phonon Anomaly in a Kagome Metal with Short-ranged Structural Modulation
Abstract
Kagome lattice V3Sb5 ( = K, Rb, and Cs) superconductors without magnetism from vanadium -electrons are intriguing because they have a novel charge density wave (CDW) order around 90 K and display superconductivity at 3 K that competes with the CDW order. Recently, CsCr3Sb5, isostructural to V3Sb5, was found to have concurrent structural and magnetic phase transition at 55 K that can be suppressed by pressure to induce superconductivity [Liu et al., Nature 632, 1032 (2024)]. Here, we use elastic and inelastic X-ray scattering to study the microscopic origin of the structural transition in CsCr3Sb5. Although our elastic measurements confirm the 411 superlattice order below , its underlying correlation is rather short-ranged. Moreover, our inelastic measurements at the superlattice wavevectors around (3, 0, 0) find no evidence of a significant acoustic phonon anomaly below , similar to the case of V3Sb5. The absence of acoustic phonon anomaly indicates a weak electron-phonon coupling in CsCr3Sb5, suggesting that the structural transition is likely associated with an unconventional CDW order.
Understanding the intertwined orders of charge-spin-lattice degrees of freedom in quantum materials forms the basis to unveil the microscopic origin of their exotic electronic properties [1, 2, 3, 4, 5]. For example, in copper-oxide superconductors, the interplay between charge density wave (CDW) and magnetism may mediate electron pairing for superconductivity [2, 3, 4], clearly different from the electron-phonon coupling (EPC) induced superconductivity in conventional Bardeen-Cooper-Schrieffer (BCS) superconductors [6].
Recently, kagome lattice metals have become an appealing platform to study the intertwined charge-spin-lattice order because they display flat electronic bands, Dirac points, Van Hove singularities, and can have interplay between CDW, magnetic order, and superconductivity [7, 8]. For weakly electron correlated kagome lattice superconductors V3Sb5 ( = K, Rb, and Cs), CDW order coexists and competes with superconductivity but without magnetism from vanadium -electrons [9]. Electron correlated kagome magnet FeGe, on the other hand, has coupled CDW and magnetic order but no superconductivity [10].
The newly synthesized electron correlated kagome metal CsCr3Sb5 was found to display a concurrent structural and magnetic phase transition below 55 K [11]. Figure 1(a) and (b) show the crystal structure of CsCr3Sb5. As a sister compound of V3Sb5 [9], it crystallizes into the space group (no. 191). Cr atoms form a kagome sublattice, which is coordinated by the adjacent Sb atoms and is further intercalated by the Cs triangular sublattices. Although structurally similar, the physical properties of CsCr3Sb5 show noteworthy distinctions from V3Sb5. It has a CDW-like structural modulation occurring at , which can be described by the wave vector (in hexagonal basis), and its equivalences and (-0.25, 0.25, 0) [Fig. 1(c)] due to the C6 symmetry of the lattice [11]. This structural modulation is found to be accompanied by an antiferromagnetic spin density wave (SDW) order [11]. Moreover, under moderately high pressures of 4-8 GPa, these density waves are suppressed, and unconventional superconductivity with a maximum transition temperature of 6.4 K emerges [11]. Since magnetic order in CsCr3Sb5 is most likely arising from the localized magnetic moments of Cr -electrons due to electron correlations [11], the system is clearly different from the nonmagnetic V3Sb5 with weak electron correlations [9].
Despite CsCr3Sb5 exhibits remarkably interesting properties, the origin of the transition at is far from clear [11]. If the structural lattice distortion below is associated with a conventional CDW order [11], one would expect to observe EPC through modifications of acoustic phonon modes across the underlying structural transition temperature [12, 13]. Inelastic X-ray scattering (IXS) can directly measure the dynamic structure factor of phonons [14], which is therefore an ideal experimental probe to study the origin of the structural distortion. For BCS superconductors, studying acoustic phonons across the superconducting temperature is useful, as superconductivity-induced phonon softening and phonon resonance via EPC can sometimes be observed [15, 16].
In this work, we present an IXS study on CsCr3Sb5 single crystals. On cooling across , our elastic X-ray scattering measurements find broad 411 superlattice peaks, suggesting short-ranged nature of the structural modulation. Using IXS, we mapped out low-energy phonon spectra below and above . The acoustic phonons around the superlattice wave vector are basically unchanged across . These results are similar to the behaviors of acoustic phonons in CDW ordered V3Sb5 [17, 18, 19] and FeGe [20, 21, 22], thus indicating that the EPC is quite weak and not the driving force for the CDW-like transition at in CsCr3Sb5.
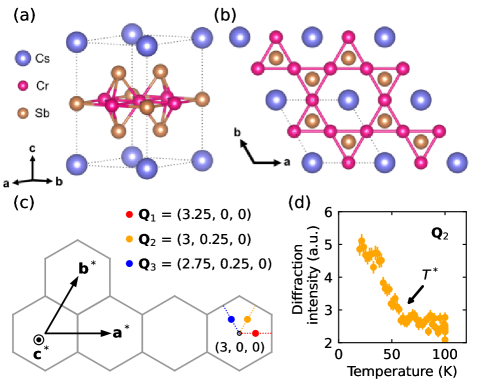
CsCr3Sb5 single crystals were grown with a flux method as reported earlier [11, 23]. A piece of CsCr3Sb5 single crystal ( mm3) was mounted on the tip of a copper sample holder in a transmission geometry [24]. The observed overall sample mosaic was about 0.3 degrees [24]. The IXS experiment was performed using the meV-resolution spectrometer at BL43LXU [25] of SPring-8, in Hyogo prefecture, Japan. This spectrometer provides world-leading flux with excellent energy resolution [25]. In our experiment, the Si(12,12,12) setup was used with a 4 7 array of analyzer crystals, allowing 28 momentum transfer positions to be measured simultaneously. The energy resolution was between 1.15 and 1.35 meV for most of the analyzers. The momentum transfer position is defined as = [Fig. 1(c)], where , , and , , are the lattice constants. The momentum transfer resolution was set using 30 30 mm2 slits at 9 m from the sample to be (0.035, 0.035, 0.015) reciprocal lattice units in most measurements. Typical data collection time is 90 minutes/spectrum, despite the low signal rate due to the very thin sample.
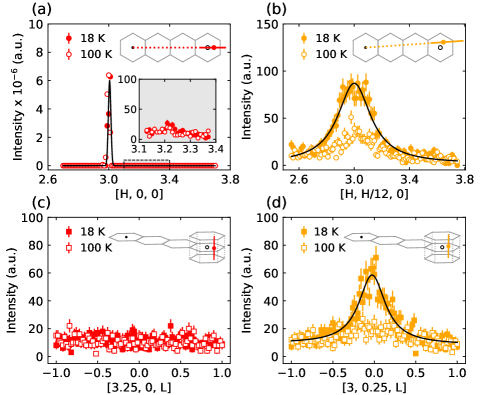
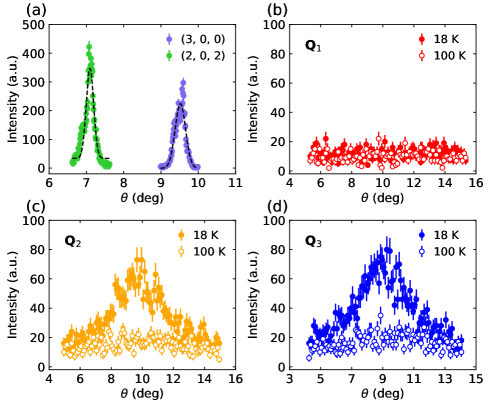
Fig. 1(d) shows the temperature dependence of diffraction intensity at the superlattice peak . The intensity abruptly increases below 55 K, which is consistent with the phase transition observed in previous resistivity, magnetization, and specific heat measurements [11]. To study the structural modulation, we performed -2 diffraction scans along the [, 0, 0] and [, /12, 0] directions, which go through two momentum transfer positions and . In Figure 2(a), we see the strong and sharp fundamental Bragg peak , which is temperature-independent. However, there is no observable peak at , as can be more clearly seen from the inset of Fig. 2(a). On the other hand, the scan through shows a peak at 18 K, which is 4 orders of magnitude weaker than the fundamental one, comparable to the case of V3Sb5 [17]. Some intensities remain but are much weakened at 100 K, probably due to leaked inelastic signal or residual critical scattering [26, 27, 28], as the transition at is second-order or weakly first-order [11]. We also confirm that there is a peak at below [24]. Such observation is consistent with the diffraction feature that four out of six superlattice peaks around are evident, which was previously found based on an in-house X-ray diffraction experiment [11]. If the observed structural modulation is induced by a CDW transition, we should expect the most pronounced acoustic phonon anomalies at the momentum transfer positions associated with the structural modulation regardless of the strength of EPC [29].
We further check the diffraction profiles along the -direction. Fig. 2(c) presents the data with the momentum transfer positions going through , which show the absence of a peak both at 18 K and 100 K. Along the direction, there is a peak centering at [Fig. 2(d)], consistent with the scan within the kagome plane. The peak at 18 K are broad along the [, /12, 0] and [3, 0.25, ] directions, indicating short-ranged correlations in both directions. We fit these peaks with a Lorentzian profile [Fig. 2(b) and (d)] and estimate the correlation lengths from the peak width. The resultant correlation lengths along and perpendicular to the kagome plane are Å () and Å (), respectively. These correlation lengths are much smaller than the one based on the structural Bragg peak (3, 0, 0) [Fig. 2(a)], which is 5.7(3) 102 Å () based on the fit with a Gaussian profile and roughly represents the instrumental momentum resolution.
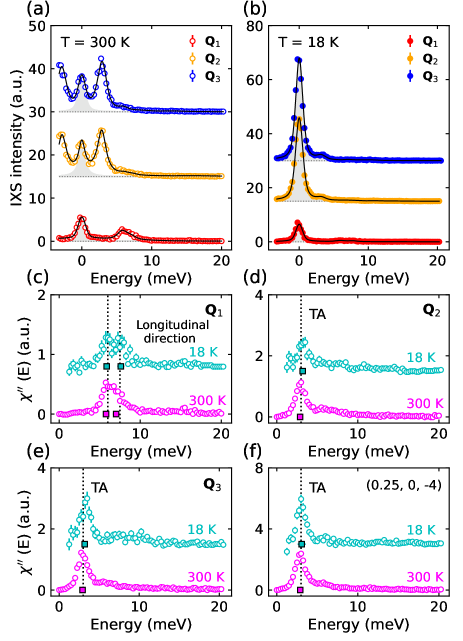
Next, we turn to the IXS-measured phonon spectra. We mainly took the data around the Brillouin zone centering at (3, 0, 0) [Fig. 1(c)], which has a strong X-ray scattering structure factor [11]. Figure 3(a) and (b) show the IXS spectra at , , and at 300 K and 18 K, respectively. While the elastic scattering ( = 0 meV) intensities at these three positions are comparable at 300 K, the intensities at and significantly increase at 18 K, and the scattering intensity at remains largely the same. Apart from the peaks located at meV, we can clearly discern one major peak between 0 and 10 meV for all three positions at 300 K [Fig. 3(a)], whose intensities are greatly reduced at 18 K [Fig. 3(b)]. We ascribe these peaks to acoustic phonon modes. In an IXS experiment, the measured intensity is proportional to the dynamic structure factor [14]. Following the standard procedure, we fit the measured with a sum of the signals from different phonon modes multiplied by the Bose factor and convoluted with the instrumental energy resolution function [30, 31, 17, 32, 33, 34]. The fitting results are shown with the solid curves in Fig. 3(a) and (b). More details of the fit can be found in [24].
After removing the elastic contribution [shaded parts in Fig. 3(a) and (b)], we get the measured imaginary part of the dynamic susceptibility [Fig. 3(c)-(f)], which reflects the intrinsic properties of the phonon. At 18 K, , in a purely longitudinal geometry, shows two resolvable peaks around 6 meV and 7.5 meV [Fig. 3(c)], which slightly merge at 300 K while the combined peak width is always significantly larger than the energy resolution. This peak doubling is probably due to the presence of a low-lying optical phonon mode, as is supported by recent calculations [35], that anti-crosses with the longitudinal acoustic (LA) phonon mode. Even so, the LA phonon dispersion is clear (see discussion below and Figure 4). Fig. 3(d) and (e) show and , respectively, which show the transverse acoustic (TA) phonon mode around 3 meV with almost resolution limited peak widths. For both the LA and TA modes, we notice that although their energies shift a bit with temperature, the changes are all within the error bar [Fig. 3(c)-(e)]. Moreover, we find that the data at 18 K almost overlap with those at 300 K, which therefore rules out a significant acoustic phonon anomaly across . This is confirmed by the measurement at (0.25, 0, -4) [Fig. 3(f)], which is an equivalent position with , but has a large -axis component so sees -axis polarized motion - this mode also shows essentially no change with temperature.
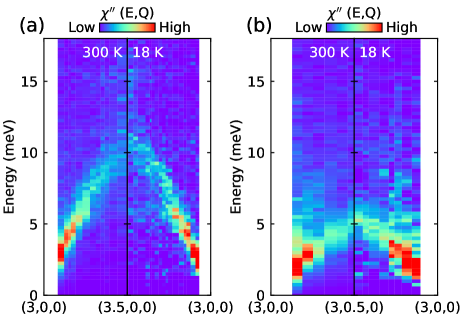
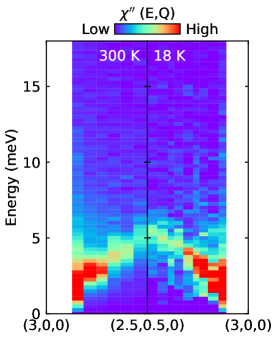
With more measurements at additional momentum transfer positions, we construct a color map of the imaginary part of the dynamic susceptibility from (3, 0, 0) to (3.5, 0, 0) and from (3, 0, 0) to (3, 0.5, 0), as shown in Fig. 4. These two trajectories pass through and , respectively [Fig. 1(c)]. The whole energy bandwidths are about 10 meV for the LA phonon and about 5 meV for the TA phonon. These phonon bandwidths are similar to those of CsV3Sb5 [18, 19] but slightly smaller than RbV3Sb5 [17]. We note that these non-collapsed acoustic phonons at ambient pressure are in line with a recent first-principle calculation, which is based on an antiferromagnetic ground state [35]. The similar phonon dispersions at 18 K and 300 K further corroborate the notion that there is no significant anomaly below for both LA and TA phonons. From the long-wavelength limit of the LA phonon, we can estimate the longitudinal sound velocity to be 3.2(1) 103 ms-1 along the kagome plane, which is close to the in-plane longitudinal sound velocity in CsV3Sb5 [3.6(2) 103 ms-1] [18] but significantly smaller than the one in FeGe [5.2(2) 103 ms-1] [21, 22]. These sound velocities along with the densities show that CsCr3Sb5 has the smallest Young’s modulus among the three kagome metals, and therefore is the softest and most flexible.
Having a CDW-like transition but without an acoustic phonon anomaly is quite unusual. For CsCr3Sb5, the correlation length of the CDW-like structural modulation is within 10 unit cells, which looks to be insufficient to impact the propagation of the lattice vibration. However, acoustic phonon anomaly across the CDW transition was actually not uncommon for materials with comparable CDW correlation lengths [36, 30, 37]. For example, in the nearly commensurate CDW state of 1-TaS2, where the structural modulation is spatially isolated Star-of-David clusters [38, 39], the acoustic phonon still shows an appreciable anomaly across CDW transition [37]. Since the acoustic phonon anomaly is generally induced through EPC, the absence of such anomaly in CsCr3Sb5 therefore excludes strong EPC and indicates its CDW-like transition is unconventional [12, 13, 17].
Interestingly, the absence of significant acoustic phonon anomaly was also found in nonmagnetic kagome metals V3Sb5 and magnetic FeGe [17, 18, 21, 19, 22], where the unconventional CDWs are competing with superconductivity and antiferromagnetism, respectively [40, 41, 42, 10]. However, the superlattice of CsCr3Sb5 is 411 type and shows short-ranged correlation [11], which differs from the 222 superlattice in both V3Sb5 and FeGe [41, 17, 10, 19, 20]. We note that recent angle-resolved photoemission spectroscopy studies on CsCr3Sb5 have revealed a Fermi wave vector [43, 23, 44]. For a Fermi surface nesting scenario, one expects an acoustic phonon anomaly at 2 with an accompanied structural modulation [12, 13], which is, however, not observed in our experiment. Therefore, we can rule out Fermi surface nesting as the major driving force for the CDW-like structural modulation in CsCr3Sb5 [44].
Although the current study focuses on acoustic phonons with dominant spectral weight, subtle phonon anomalies might still be present in CsCr3Sb5, particularly in the high-energy optical modes or other unexamined regions of the reciprocal space. Indeed, interesting optical phonon anomalies were observed in the CDW state of V3Sb5 [17, 18] and FeGe [22], even in the absence of a significant anomaly in the acoustic modes. Nevertheless, the short-ranged structural modulation and the absence of acoustic phonon anomaly across have two implications on the physical properties of CsCr3Sb5. First, the phase transition at is evident in resistivity and magnetization [11], but has minor effects on the lattice dynamics. Instead, the -transition may exert a more profound influence on magnetic order and spin dynamics, as seen in the CDW order of FeGe [22]. Second, the CDW-like order in CsCr3Sb5 is suppressed by applying pressure and finally gives way to the superconductivity [11]. As no significant acoustic phonon anomaly is observed at ambient pressure and the phase boundary continuously ends in the superconductivity dome, it would be reasonable to assume that EPC is also weak in the high-pressure superconducting state. This would imply that superconductivity in CsCr3Sb5 is not mediated by EPC but may arise from magnetism as in the case of cuprates and iron pnictides [2, 3, 4, 5]. This aspect is likely different from V3Sb5 without magnetism [9], where -wave superconductivity may be mediated by EPC under the conventional BCS mechanism [45, 46, 47] or by bond-order fluctuations [48, 49]. To address this point, it is necessary to determine the pairing symmetry in CsCr3Sb5 under high pressure.
In summary, by performing an IXS experiment on the single crystal of kagome metal CsCr3Sb5, we have successfully mapped out its acoustic phonon spectra along high-symmetric directions in the hexagonal Brillouin zone. We find that the CDW-like structural modulation below is short-ranged both along the kagome plane and perpendicular to it. However, this structural modulation does not induce a significant anomaly in the acoustic phonons. Our observations suggest an EPC-driven structural instability in CsCr3Sb5 is unlikely and points to an unconventional CDW-like structural modulation.
Acknowledgements.
The X-ray scattering work was supported by the U.S. Department of Energy, Office of Basic Energy Sciences, under award no. DE-SC0012311 (P.D.), and by Grant-in-Aid for Scientific Research (KAKENHI) (No. JP22H00105), Grant-in-Aid for Scientific Research on innovative areas “Quantum Liquid Crystals” (No. JP19H05824) and Grant-in-Aid for Scientific Research for Transformative Research Areas (A) “Condensed Conjugation” (No. JP20H05869) from Japan Society for the Promotion of Science (JSPS). The single-crystal growth efforts at Rice are supported by the Robert A. Welch Foundation Grant No. C-1839 (P.D.). The synchrotron X-ray experiment was performed at BL43LXU of the RIKEN SPring-8 Center under the proposal 2024A1108.References
- Keimer and Moore [2017] B. Keimer and J. E. Moore, Nature Physics 13, 1045 (2017).
- Keimer et al. [2015] B. Keimer, S. A. Kivelson, M. R. Norman, S. Uchida, and J. Zaanen, Nature 518, 179 (2015).
- Fradkin et al. [2015] E. Fradkin, S. A. Kivelson, and J. M. Tranquada, Rev. Mod. Phys. 87, 457 (2015).
- Tranquada [2015] J. M. Tranquada, Physica B: Condensed Matter 460, 136 (2015).
- Dai [2015] P. Dai, Rev. Mod. Phys. 87, 855 (2015).
- Bardeen et al. [1957] J. Bardeen, L. N. Cooper, and J. R. Schrieffer, Phys. Rev. 108, 1175 (1957).
- Yin et al. [2022] J.-X. Yin, B. Lian, and M. Z. Hasan, Nature 612, 647 (2022).
- Wang et al. [2023] Y. Wang, H. Wu, G. T. McCandless, J. Y. Chan, and M. N. Ali, Nature Reviews Physics 5, 635 (2023).
- Wilson and Ortiz [2024] S. D. Wilson and B. R. Ortiz, Nature Review Materials 9, 420 (2024).
- Teng et al. [2022] X. Teng, L. Chen, F. Ye, E. Rosenberg, Z. Liu, J.-X. Yin, Y.-X. Jiang, J. S. Oh, M. Z. Hasan, K. J. Neubauer, et al., Nature 609, 490 (2022).
- Liu et al. [2024] Y. Liu, Z.-Y. Liu, J.-K. Bao, P.-T. Yang, L.-W. Ji, S.-Q. Wu, Q.-X. Shen, J. Luo, J. Yang, J.-Y. Liu, C.-C. Xu, W.-Z. Yang, W.-L. Chai, J.-Y. Lu, C.-C. Liu, B.-S. Wang, H. Jiang, Q. Tao, Z. Ren, X.-F. Xu, C. Cao, Z.-A. Xu, R. Zhou, J.-G. Cheng, and G.-H. Cao, Nature 632, 1032 (2024).
- Zhu et al. [2015] X. Zhu, Y. Cao, J. Zhang, E. W. Plummer, and J. Guo, Proceedings of the National Academy of Sciences 112, 2367 (2015).
- Zhu et al. [2017] X. Zhu, J. Guo, J. Zhang, and E. W. Plummer, Advances in Physics: X 2, 622 (2017).
- Baron [2020] A. Q. R. Baron, “High-resolution inelastic x-ray scattering i and ii,” in Synchrotron Light Sources and Free-Electron Lasers: Accelerator Physics, Instrumentation and Science Applications, edited by E. J. Jaeschke, S. Khan, J. R. Schneider, and J. B. Hastings (Springer International Publishing, Cham, 2020) pp. 2131–2250, see also arXiv preprint arXiv:1504.01098 (2015).
- Axe and Shirane [1973] J. D. Axe and G. Shirane, Phys. Rev. B 8, 1965 (1973).
- Kawano et al. [1996] H. Kawano, H. Yoshizawa, H. Takeya, and K. Kadowaki, Phys. Rev. Lett. 77, 4628 (1996).
- Li et al. [2021] H. Li, T. T. Zhang, T. Yilmaz, Y. Y. Pai, C. E. Marvinney, A. Said, Q. W. Yin, C. S. Gong, Z. J. Tu, E. Vescovo, C. S. Nelson, R. G. Moore, S. Murakami, H. C. Lei, H. N. Lee, B. J. Lawrie, and H. Miao, Phys. Rev. X 11, 031050 (2021).
- Xie et al. [2022] Y. Xie, Y. Li, P. Bourges, A. Ivanov, Z. Ye, J.-X. Yin, M. Z. Hasan, A. Luo, Y. Yao, Z. Wang, G. Xu, and P. Dai, Phys. Rev. B 105, L140501 (2022).
- Subires et al. [2023] D. Subires, A. Korshunov, A. Said, L. Sánchez, B. R. Ortiz, S. D. Wilson, A. Bosak, and S. Blanco-Canosa, Nature Communications 14, 1015 (2023).
- Miao et al. [2023] H. Miao, T. Zhang, H. Li, G. Fabbris, A. Said, R. Tartaglia, T. Yilmaz, E. Vescovo, J.-X. Yin, S. Murakami, et al., Nature Communications 14, 6183 (2023).
- Teng et al. [2023] X. Teng, J. S. Oh, H. Tan, L. Chen, J. Huang, B. Gao, J.-X. Yin, J.-H. Chu, M. Hashimoto, D. Lu, et al., Nature Physics 19, 814 (2023).
- Teng et al. [2024] X. Teng, D. W. Tam, L. Chen, H. Tan, Y. Xie, B. Gao, G. E. Granroth, A. Ivanov, P. Bourges, B. Yan, M. Yi, and P. Dai, Phys. Rev. Lett. 133, 046502 (2024).
- Guo et al. [2024] Y. Guo, Z. Wang, F. Xie, Y. Huang, B. Gao, J. S. Oh, H. Wu, Z. Liu, Z. Ren, Y. Fang, et al., arXiv preprint arXiv:2406.05293 (2024).
- [24] See Supplemental Material at xxx for additional data and analyses.
- Baron [2010] A. Q. Baron, SPring-8 Inf. Newsl 15, 14 (2010).
- Birgeneau et al. [1971] R. J. Birgeneau, J. Skalyo, and G. Shirane, Phys. Rev. B 3, 1736 (1971).
- Shapiro et al. [1972] S. M. Shapiro, J. D. Axe, G. Shirane, and T. Riste, Phys. Rev. B 6, 4332 (1972).
- Moncton et al. [1977] D. E. Moncton, J. D. Axe, and F. J. DiSalvo, Phys. Rev. B 16, 801 (1977).
- Moncton et al. [1975] D. E. Moncton, J. D. Axe, and F. J. DiSalvo, Phys. Rev. Lett. 34, 734 (1975).
- Miao et al. [2018] H. Miao, D. Ishikawa, R. Heid, M. Le Tacon, G. Fabbris, D. Meyers, G. D. Gu, A. Q. R. Baron, and M. P. M. Dean, Phys. Rev. X 8, 011008 (2018).
- Dashwood et al. [2019] C. D. Dashwood, H. Miao, J. G. Vale, D. Ishikawa, D. A. Prishchenko, V. V. Mazurenko, V. G. Mazurenko, R. S. Perry, G. Cao, A. de la Torre, F. Baumberger, A. Q. R. Baron, D. F. McMorrow, and M. P. M. Dean, Phys. Rev. B 100, 085131 (2019).
- Cao et al. [2023] S. Cao, C. Xu, H. Fukui, T. Manjo, Y. Dong, M. Shi, Y. Liu, C. Cao, and Y. Song, Nature Communications 14, 7671 (2023).
- Korshunov et al. [2023] A. Korshunov, H. Hu, D. Subires, Y. Jiang, D. Călugăru, X. Feng, A. Rajapitamahuni, C. Yi, S. Roychowdhury, M. Vergniory, et al., Nature Communications 14, 6646 (2023).
- Song et al. [2023] Y. Song, S. Wu, X. Chen, Y. He, H. Uchiyama, B. Li, S. Cao, J. Guo, G. Cao, and R. Birgeneau, Phys. Rev. B 107, L041113 (2023).
- Xu et al. [2023] C. Xu, S. Wu, G.-X. Zhi, G. Cao, J. Dai, C. Cao, X. Wang, and H.-Q. Lin, arXiv preprint arXiv:2309.14812 (2023).
- Le Tacon et al. [2014] M. Le Tacon, A. Bosak, S. Souliou, G. Dellea, T. Loew, R. Heid, K. Bohnen, G. Ghiringhelli, M. Krisch, and B. Keimer, Nature Physics 10, 52 (2014).
- Ziebeck et al. [1977] K. R. A. Ziebeck, B. Dorner, W. G. Stirling, and R. Schollhorn, Journal of Physics F: Metal Physics 7, 1139 (1977).
- Wilson et al. [1975] J. Wilson, F. D. Salvo, and S. Mahajan, Advances in Physics 24, 117 (1975).
- Rossnagel [2011] K. Rossnagel, Journal of Physics: Condensed Matter 23, 213001 (2011).
- Ortiz et al. [2019] B. R. Ortiz, L. C. Gomes, J. R. Morey, M. Winiarski, M. Bordelon, J. S. Mangum, I. W. H. Oswald, J. A. Rodriguez-Rivera, J. R. Neilson, S. D. Wilson, E. Ertekin, T. M. McQueen, and E. S. Toberer, Phys. Rev. Mater. 3, 094407 (2019).
- Ortiz et al. [2020] B. R. Ortiz, S. M. L. Teicher, Y. Hu, J. L. Zuo, P. M. Sarte, E. C. Schueller, A. M. M. Abeykoon, M. J. Krogstad, S. Rosenkranz, R. Osborn, R. Seshadri, L. Balents, J. He, and S. D. Wilson, Phys. Rev. Lett. 125, 247002 (2020).
- Chen et al. [2021] K. Y. Chen, N. N. Wang, Q. W. Yin, Y. H. Gu, K. Jiang, Z. J. Tu, C. S. Gong, Y. Uwatoko, J. P. Sun, H. C. Lei, J. P. Hu, and J.-G. Cheng, Phys. Rev. Lett. 126, 247001 (2021).
- Li et al. [2024] Y. Li, Y. Liu, X. Du, S. Wu, W. Zhao, K. Zhai, Y. Hu, S. Zhang, H. Chen, J. Liu, Y. Yang, C. Peng, M. Hashimoto, D. Lu, Z. Liu, Y. Wang, Y. Chen, G. Cao, and L. Yang, arXiv preprint arXiv:2406.03740 (2024).
- Peng et al. [2024] S. Peng, Y. Han, Y. Li, J. Shen, Y. Miao, Y. Luo, L. Huai, Z. Ou, H. Li, Z. Xiang, Z. Liu, D. Shen, M. Hashimoto, D. Lu, Y. Yao, Z. Qiao, Z. Wang, and J. He, arXiv preprint arXiv:2406.17769 (2024).
- Mu et al. [2021] C. Mu, Q. Yin, Z. Tu, C. Gong, H. Lei, Z. Li, and J. Luo, Chinese Physics Letters 38, 077402 (2021).
- Zhong et al. [2023] Y. Zhong, S. Li, H. Liu, Y. Dong, K. Aido, Y. Arai, H. Li, W. Zhang, Y. Shi, Z. Wang, S. Shin, H. N. Lee, H. Miao, T. Kondo, and K. Okazaki, Nature Communications 14, 1945 (2023).
- Xie et al. [2024] Y. Xie, N. Chalus, Z. Wang, W. Yao, J. Liu, Y. Yao, J. S. White, L. M. DeBeer-Schmitt, J.-X. Yin, P. Dai, and M. R. Eskildsen, Nature Communications 15, 6467 (2024).
- Roppongi et al. [2023] M. Roppongi, K. Ishihara, Y. Tanaka, K. Ogawa, K. Okada, S. Liu, K. Mukasa, Y. Mizukami, Y. Uwatoko, R. Grasset, M. Konczykowski, B. R. Ortiz, S. D. Wilson, K. Hashimoto, and T. Shibauchi, Nature Communications 14, 667 (2023).
- Tazai et al. [2022] R. Tazai, Y. Yamakawa, S. Onari, and H. Kontani, Science Advances 8, eabl4108 (2022).
- Petříček et al. [2014] V. Petříček, M. Dušek, and L. Palatinus, Zeitschrift für Kristallographie - Crystalline Materials 229, 345 (2014).
- Shen et al. [2023] X. Shen, R. Heid, R. Hott, A.-A. Haghighirad, B. Salzmann, M. dos Reis Cantarino, C. Monney, A. H. Said, M. Frachet, B. Murphy, K. Rossnagel, S. Rosenkranz, and F. Weber, Nature Communications 14 (2023).
- Ishikawa and Baron [2021] D. Ishikawa and A. Q. R. Baron, Journal of Synchrotron Radiation 28, 804 (2021).
- Kittel and McEuen [2018] C. Kittel and P. McEuen, Introduction to solid state physics (John Wiley & Sons, 2018).
Supplemental Material for “Absence of Acoustic Phonon Anomaly in a Kagome Metal with Short-ranged Structural Modulation”
I CsCr3Sb5 single crystal sample
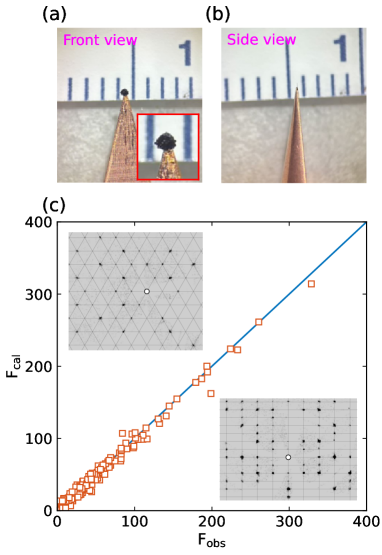
Fig. S5(a) and (b) show one piece of CsCr3Sb5 single crystal used in our inelastic X-ray scattering (IXS) experiment. The sample was attached to the tip of a copper sample holder with GE varnish.One notes that the extreme thinness of the sample (97.5 transmission) reduced scattering rates by about a factor of 20, or more, compared to what an optimal (120 m) thickness sample could have provided. Before doing the IXS measurements, the single crystal was checked with an in-house X-ray diffractometer (Rigaku Synergy-S). Crystal structure refinement was performed with the Jana2006 program [50]. The obtained space group is 6/, which is consistent with the previous report [11]. The comparison between the observed and calculated structure factors is presented in Fig. S5(c), where the insets show representative X-ray diffraction (XRD) patterns for the (, , 0) and (0, , ) planes. More crystallographic information can be found in Table 1 and Table 2. These results confirm the good quality of our CsCr3Sb5 single crystal.
II Additional elastic scattering data
-scans performed around (2, 0, 2) and (3, 0, 0) at 18 K are shown in Fig. S6(a). From the full-width-at-half-maximum (FWHM) of their Gaussian fits, we can estimate the overall sample mosaic spread to be 0.33(1)∘ and 0.23(1)∘ for (2, 0, 2) and (3, 0, 0), respectively.
Additional -scans performed around , , and are shown in Fig. S6(b), (c), and (d), respectively. The locations of these momentum transfer positions can be found in Fig. 1(c) of the main text. For , we can see that there is no peak regardless of 18 K and 100 K. However, for and , broad peaks emerge at 18 K, despite the absence of an evident peak at 100 K. These diffraction features are consistent with the results shown in the main text. We note that due to the short-ranged nature of the structural modulation, the peak widths of and at 18 K are much larger than those of fundamental structural Bragg peaks [Fig. S6(a)].
III Fitting of inelastic X-ray scattering spectra
At a specific momentum transfer position , the experimentally detected energy-dependent IXS intensity can be approximately decomposed into two parts [30, 31, 17, 34]
| (S1) |
where the first term is a sum of the dynamic structure factor of multiple phonons convoluted with the energy resolution function , and the second term is the elastic scattering contribution represented by the scaled energy resolution function. Since the detector background is generally negligible, a constant background term (e.g., used in [30]) is omitted here. For a phonon mode , its dynamic structure factor is related to the imaginary part of the dynamic susceptibility through the fluctuation-dissipation theorem
| (S2) |
can be expressed as the damped harmonic oscillator form
| (S3) |
where , , and are the amplitude, energy, and FWHM of the phonon mode . The energy resolution is modeled with a pseudo-Voigt function [36, 30, 31, 17, 20, 34, 32, 51]. We note that the pseudo-Voigt function is sufficient for the present data and analysis (see also [36, 30, 31, 17, 20, 34, 32, 51]), but a more careful data treatment could use the deconvolved response as described in [52].
We fitted the experimentally measured IXS spectra with equation (1). Fig. S7 shows a representative fitting on the IXS spectra of at both 300 K and 18 K, where two phonon modes are used. We can see that most major features are captured by our fitting. The obtained overall peak width of is around 1.2 meV, consistent with the energy resolution. The two phonon peak positions are shown in Fig. 3(c) of the main text. The measured imaginary part of the dynamic susceptibilities presented in the main text was calculated as
| (S4) |
Fig. S8 shows the color map of the imaginary part of the dynamic susceptibility from (3, 0, 0) to (2.5, 0.5, 0), which goes through [see Fig. 1(c) of the main text]. We can confirm that there is no substantial change in the acoustic phonons between 300 K and 18 K.

IV Estimation of longitudinal sound velocity
In the long-wavelength limit (with the wave vector ), the phonon energy is approximately linear to [53]
| (S5) |
where is a slope constant that can be determined from the experimentally measured phonon dispersion. Here, is in the unit of meV and is in the reciprocal lattice unit (r.l.u.) (see the definition of momentum transfer position in the main text). For the three kagome metals CsCr3Sb5, CsV3Sb5, and FeGe, the slope constants s can be obtained from their phonon dispersions close to the Brillouin zone center. To estimate the longitudinal sound velocities, we use the dispersions of their longitudinal acoustic (LA) phonon along direction [Fig. 1(c) of the main text]. The corresponding slope constants s in the long-wavelength limit are listed in Table 3. The errors arise from the uncertainties in determining the energy positions of the LA phonon modes. The sound velocity in ms-1 is directly related to through
| (S6) |
where is the in-plane lattice constant in Å. The calculated sound velocities for the three kagome metals are listed in Table 3. After knowing the longitudinal sound velocity, the Young’s modulus [53] can be further obtained according to
| (S7) |
where is the density. The obtained Young’s moduli are also listed in Table 3, from which we can see CsCr3Sb5 has the smallest Young’s modulus.
| Empirical formula | CsCr3Sb5 |
| Formula weight | 897.64 |
| Temperature | 298.23(11) K |
| Wavelength | 0.71073 Å |
| Crystal system | Hexagonal |
| Space group | 6/mmm |
| Unit cell dimensions | a = b = 5.4971(3) Å, c = 9.2882(7) Å |
| = = 90∘, = 120∘ | |
| Volume | 243.07(3)Å3 |
| Z | 1 |
| Density (calculated) | 6.132 gcm-3 |
| Absorption coefficient | 20.496 mm-1 |
| F(000) | 382 |
| Crystal size | 0.5 0.5 0.01 mm3 |
| Theta range for data collection | 4.2809∘ to 36.2766∘ |
| Index ranges | -8 8, -8 6, -15 13 |
| Reflections collected | 2157 |
| Independent reflections | 280 [R(int) = 0.0810] |
| Completeness to theta = 26.32∘ | 99.27 % |
| Refinement method | Full-matrix least-squares on F2 |
| Data / restraints / parameters | 280 / 0 / 6 |
| Goodness-of-fit on F2 | 3.78 |
| Final R indices [I 3sigma(I)] | R1 = 0.0818, wR2 = 0.0893 |
| R indices (all data) | R1 = 0.1037, wR2 = 0.0922 |
| Extinction coefficient | NA |
| Atom | Wyckoff. | Occ. | x | y | z | Ueq |
| Cs1 | 1 | 1 | 0 | 0 | 0 | 0.0311(8) |
| Cr1 | 3 | 1 | 0.5 | 0.5 | 0.5 | 0.0184(10) |
| Sb1 | 1 | 1 | 0 | 0 | 0.5 | 0.0219(7) |
| Sb2 | 4 | 1 | 0.3333 | 0.6667 | 0.2633(2) | 0.0209(5) |
| Kagome metal | (meVr.l.u.-1) | (Å) | (kgm-3) | (ms-1) | (Pa) |
| CsCr3Sb5 (this work) | 28(1) | 5.497 | 6.132103 | 3.2(1) 103 | 6.3(4) 1010 |
| CsV3Sb5 | 31(2) [18] | 5.495 [40] | 6.102103 [40] | 3.6(2) 103 | 7.9(9) 1010 |
| FeGe | 50(2) [21, 22] | 4.985 [10] | 7.344103 [10] | 5.2(2) 103 | 19(2) 1010 |