Lifetimes and Branching Ratios Apparatus (LIBRA)
Abstract
The Particle X-ray Coincidence Technique (PXCT) was originally developed to measure average lifetimes in the s range for proton-unbound states populated by electron capture (EC). We have designed and built the Lifetimes and Branching Ratios Apparatus (LIBRA) to be used in the stopped-beam area at the Facility for Rare Isotope Beams that extends PXCT to measure both lifetimes and decay branching ratios of resonances populated by EC/ decay. The first application of LIBRA aims to obtain essential nuclear data from 60Ga EC/ decay to constrain the thermonuclear rates of the 59CuZn and 59CuNi reactions, and in turn, the strength of the NiCu nucleosynthesis cycle, which is predicted to significantly impact the modeling of Type I X-ray burst light curves and the composition of the burst ashes. Detailed theoretical calculations, Monte Carlo simulations, and performance tests with radioactive sources have been conducted to validate the feasibility of employing LIBRA for the 60Ga experiment. The method introduced with LIBRA has the potential to measure nearly all essential ingredients for thermonuclear reaction rate calculations in a single experiment, in the absence of direct measurements, which are often impractical for radioactive reactants.
I Introduction
Direct measurements of charged-particle thermonuclear reaction rates are extremely challenging due to the small cross-section at stellar energies and technical issues associated with beam intensity limitations, target degradation under bombardment, and low signal-to-background ratios. Successful direct measurements at astrophysical energies have been achieved only in a few instances [1]. Consequently, direct measurements of thermonuclear reaction rates are often performed at higher energies and then extrapolated to stellar energies with the aid of nuclear theories. Alternatively, various indirect approaches, such as elastic scattering, transfer reactions, surrogate reactions, charge-exchange reactions, Coulomb dissociation, in-beam -ray spectroscopy, and -decay spectroscopy have also played a major role in a comprehensive understanding of thermonuclear reactions [2, 3, 4]. However, these methods typically yield only a fraction of the necessary nuclear data, and results from multiple experiments still need to be pieced together to infer the reaction rates of interest [5].
Thermonuclear charged-particle reactions are often dominated by narrow and isolated resonances if the level density of the compound nucleus in the Gamow window is not too high. The resonant reaction rate can be calculated using the well-known expression [6, 7]:
| (1) |
where denotes the Avogadro constant and is the velocity-averaged product of the cross-section and relative velocity. is the reduced mass in atomic mass units, with and as the mass numbers of the incoming particle and the target nucleus, respectively. is the resonance energy in the center-of-mass system in units of MeV. is the temperature in units of giga kelvin (GK), and is the resonance strength in units of MeV. For a resonance,
| (2) |
where is the spin of the resonance, is the spin of proton, and is the spin of the ground state of the target nucleus. The total decay width of the resonance is the sum of the partial widths for open decay channels, typically including proton width (), width (), and width (). Equivalently, the resonance strength can be constructed by combining the proton branching ratio , the -ray branching ratio , and the lifetime using the following expression:
| (3) |
where is the reduced Planck constant. These relations are also applicable to a resonance by replacing the terms and with and , respectively. Therefore, important quantities to determine the reaction rates include the resonance energies, the spins, the proton-, -, and -decay branching ratios, and the lifetimes of the resonances.
In cases where the level density of resonances in the compound nucleus is sufficiently high to justify a statistical treatment, the reaction cross section can be estimated within the Hauser-Feshbach statistical model framework:
| (4) |
where is the reduced mass, , , and are the energy, spin, and parity of the resonance in the compound nucleus, and are the spins of the proton and the state in the target nucleus, respectively. and are the transmission coefficients for the proton and channels, respectively, of a given resonance with at . represents the sum of the transmission coefficients over all possible decay channels of the resonance, including proton, , and channels. The statistical model assumes that a large number of resonances with all spins and parities are available at each energy, and therefore, Eq. (4) includes the summation over . Transmission coefficients are related to average decay widths through the number of resonances with per energy interval, i.e., the nuclear level density. Therefore, obtaining average resonance properties, including decay branching ratios and lifetimes (or total widths) of excited states in the compound nucleus, is valuable for calculating reaction rates within the statistical model [8, 9].
In this paper, we introduce the Lifetimes and Branching Ratios Apparatus (LIBRA) that applies and extends the Particle X-ray Coincidence Technique (PXCT) [10] to measure practically all essential parameters for thermonuclear reaction rate calculations in a single experiment, potentially improving the accuracy and consistency of nuclear inputs for astrophysical models. We provide a comprehensive description of the experimental setup and its performance tests, demonstrating the feasibility of employing LIBRA in a case study to address the NiCu cycle issue in Type I X-ray bursts (XRBs).
II Case Study: NiCu Cycle in XRBs
Type I XRBs are the most frequent type of thermonuclear stellar explosions in the Galaxy [11]. They are powered by thermonuclear runaways in hydrogen- and/or helium-rich material accreted onto the surface of a neutron star in a low-mass X-ray binary system. The main nuclear reaction flow in the XRB is driven towards the proton drip line and to higher masses via a series of particle-induced reactions and -decays. Accurate modeling of energy production and nucleosynthesis in XRBs requires precise nuclear physics inputs, including decay rates, nuclear masses, and nuclear reaction rates of proton-rich rare isotopes along the path of the rapid proton () capture process. Our understanding of XRBs has greatly expanded, yet many open questions still remain despite decades of work [12, 13].
As illustrated in Fig. 1, under XRB conditions, the -process beyond the waiting point 56Ni may be affected by several cycles, such as the NiCu cycle. A low 59CuZn rate or a high 59CuNi rate would lead to the formation of a NiCu cycle, returning the reaction flux to 56Ni, strongly impeding the synthesis of heavier nuclei and affecting the XRB observables [14]. Therefore, the strength of the NiCu cycle is determined by the ratio of the to reaction rates at 59Cu. Currently, both rates recommended by REACLIB [15] are calculated by the Hauser-Feshbach statistical model [8, 16]. The variations in these rates have been identified as having a significant impact on the modeling of XRB light curves and the composition of the burst ashes [17, 18, 19]. At higher temperatures (3 GK), the competition between 59CuZn and 59CuNi reactions is also found to significantly impact the -process nucleosynthesis in core-collapse supernovae [20, 21, 22].

It is not currently possible to directly measure these two reactions at astrophysical energies because the predicted cross sections are too small, and intense low-energy radioactive 59Cu beams are not available. A 59CuNi reaction measurement using a 59Cu beam with an intensity of particle per second (pps) on a cryogenic solid H2 target at an excitation energy of MeV found that 59Cu proceeds predominantly to 56Ni ground state, and standard statistical model calculations overestimate the cross section by a factor of 1.64 [23]. In a 58NiHeZn reaction measurement [24], the nuclear level density of 60Zn was extracted from the neutron evaporation spectrum. At an excitation energy of 6 MeV, the level density is estimated to be 18 MeV-1. Taking into account the spin and parity range relevant to proton captures (Table 1), the level density could be too low to accurately apply the Hauser-Feshbach statistical model. Kim et al. [25] evaluated available experimental data on 60Zn resonances, supplemented with theoretical calculations. They found the 59CuNi reaction rate to be lower than the REACLIB rate [15] at XRB temperatures, implying a weaker NiCu cycle strength than previously estimated [17, 18, 19].
There are many ongoing efforts to address this problem both directly and indirectly:
1) 56NiCu reaction cross section measurement using a 56Ni beam of pps on a He jet target at MeV with the Jet Experiments in Nuclear Structure and Astrophysics setup [26];
2) 59CuNi reaction cross section measurement using a 59Cu beam of pps on CH4 gas within the Multi-Sampling Ionization Chamber at MeV [27];
3) 59CuNi reaction cross section measurement using a 59Cu beam of pps on a CH2 target at MeV with circular double-sided silicon detectors [28];
4) 60Zn -ray spectroscopy via the 59CuZn transfer reaction using Gamma-Ray Energy Tracking In-beam Nuclear Array [29];
5) 58NiHeZn reaction using a 3He beam on a 58Ni target and measuring neutron angular distributions using liquid scintillators to determine the spins and parities of 60Zn states [30];
6) 59CuHeZn reaction using a 59Cu beam to populate 60Zn states and to measure the decay branching ratios [31];
7) 60Ga -delayed decay total absorption spectroscopy using the Summing NaI detector [32];
8) 60Ga decay using the Gaseous Detector with Germanium Tagging [33].
To this day, experimental constraints on the 59CuZn and 59CuNi are still scarce and preclude a robust understanding of their astrophysical impacts.
Table 1 summarizes the spins and parities of resonances in 60Zn. Only positive parity states associated with proton captures are accessible via allowed 60Ga transitions, also indicating that a lower density of levels populated in the decay than in the previous 58NiHeZn reaction measurement [24].
| Population | 60Zn states |
|---|---|
| on | , |
| on | , , , |
| on | , , , , |
| on | , |
| on | , , |
| on | , , |
| from | , , |
The Gamow energies and windows for the 59CuZn and 59CuNi reactions shown in Table 2 are calculated from a numerical study of the relevant energy ranges for astrophysical reaction rates [34]. Discussing these two reactions at temperatures below 0.5 GK is not relevant as the abundance flow cannot reach this mass region [14, 7]. Combined with the proton-separation energy of 60Zn Zn keV [35] and -separation energy of 60Zn Zn keV [35], 60Zn resonances of interest are energetically accessible in 60Ga decay owing to the large Ga keV [36, 37].
| 59CuZn | 59CuNi | |||||
|---|---|---|---|---|---|---|
| (GK) | (MeV) | (MeV) | (MeV) | (MeV) | (MeV) | (MeV) |
| 0.5 | 0.51 | 0.71 | 0.92 | 0.55 | 0.74 | 0.98 |
| 1.0 | 0.67 | 0.91 | 1.26 | 0.73 | 1.01 | 1.48 |
| 1.5 | 0.75 | 1.01 | 1.57 | 0.87 | 1.27 | 2.11 |
| 2.0 | 0.82 | 1.14 | 1.83 | 1.01 | 1.74 | 2.80 |
| 2.5 | 0.85 | 1.40 | 2.05 | 1.24 | 2.19 | 3.52 |
| 3.0 | 0.89 | 1.49 | 2.26 | 1.51 | 2.66 | 4.16 |
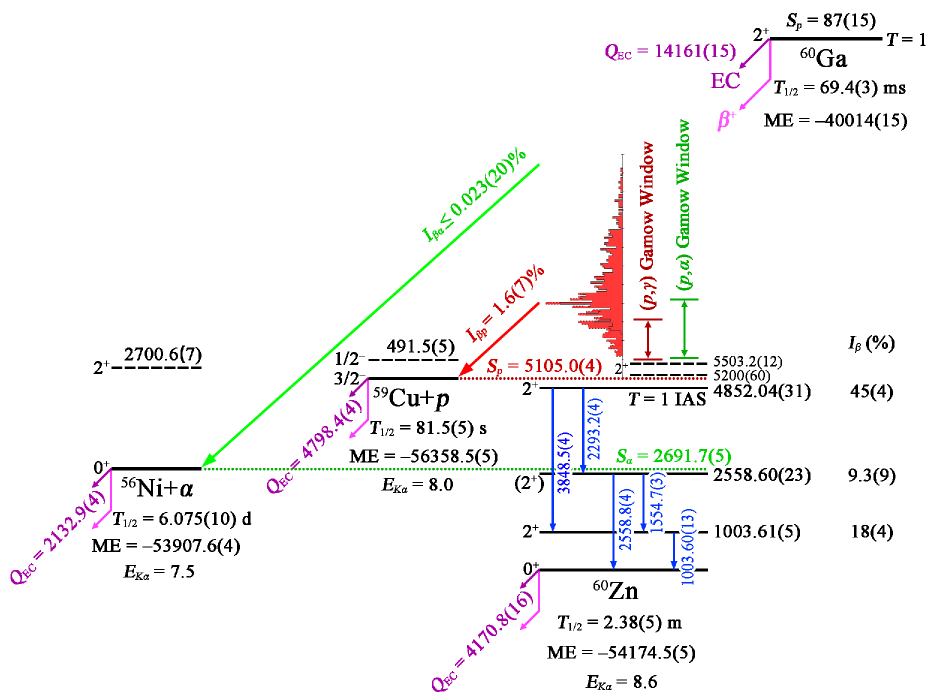
In the first 60Ga decay study, Mazzocchi et al. observed 802 protons and reported a total 60Ga intensity of % and an upper limit for intensity %. They also observed 5 60Ga transitions through 3 60Zn states [41]. Orrigo et al. [36] confirmed these 5 transitions and the 3 proton-bound states, and reported 24 new transitions that are correlated with 60Ga implants. However, these new transitions were not placed in the decay scheme, nor were -feeding intensities provided. Individual proton peaks were not resolved in either work [41, 36, 44]. If we adopt the weighted average of -feeding intensities based on the 5 intensities reported by both studies [36, 41], unplaced transitions likely account for 26% of -feeding intensities. A recent 60Ga total absorption spectroscopy experiment observed 15% of the -feeding intensity above the 60Zn proton separation energy [32], indicating the need for further measurements. The Evaluated Nuclear Structure Data File (ENSDF) for mass 60 is 12 years old, and we present an up-to-date 60Ga decay data evaluation in accordance with the ENSDF standards, facilitating an accurate understanding of the pertinent nuclear structure properties (Fig. 2).
High-statistics 60Ga decay measurements with proton, , -ray coincidences will allow for the construction of a more comprehensive decay scheme, including the proton/-emitting states in 60Zn to the ground and excited states of 59Cu/56Ni. This will provide crucial insights into the entrance and exit channels of the thermonuclear 59CuZn and 59CuNi reactions. Although -decay spectroscopy has proven to be a powerful method for obtaining decay branching ratios, it typically does not yield lifetimes or widths of resonances [49, 50]. Therefore, employing PXCT-enhanced -decay spectroscopy to obtain all essential information in a single experiment would be a significant advancement.
III Particle X-ray Coincidence Technique
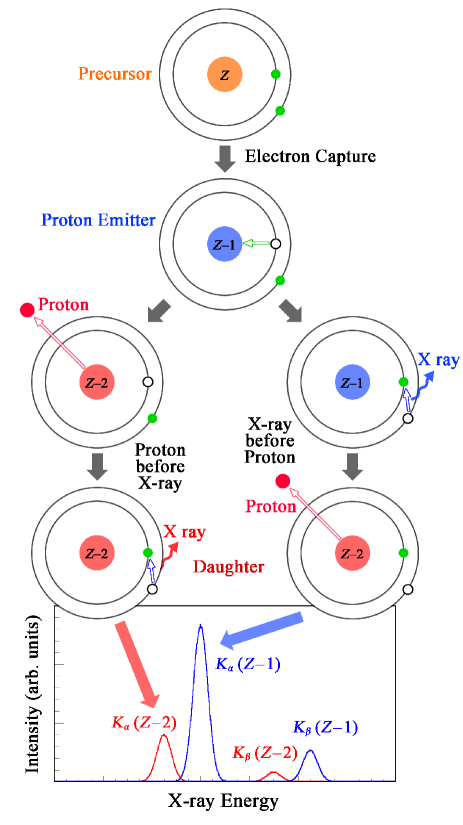
In the 1970s, PXCT was introduced and applied to measure the average lifetimes of proton-unbound states in 69As populated by the electron capture (EC) of 69Se [10]. The principle of PXCT is illustrated in Fig. 3. In the process of an EC-delayed proton emission, a proton-rich precursor with an atomic number of decays by EC to the proton emitter . Due to the EC, a proton-unbound nuclear state and an atomic shell vacancy are created simultaneously. The vacancy is primarily created in the shell. In the case of 60Ga EC, the fractional EC probability for the shell is 89% [51]. An electron from an outer shell fills the shell vacancy and may yield X-ray photons corresponding to the binding energy difference between the outer and the shells. The -shell fluorescence yield for Zn is 47%, with X rays contributing 89% of all X rays [52]. Meanwhile, the proton-unbound state with a comparable lifetime emits a proton to a state of the daughter . If the proton is emitted before the X-ray emission, then the X-ray energy will be characteristic of the daughter . If the proton is emitted after the X-ray emission, then the X-ray energy will be characteristic of the proton emitter . By measuring X rays in coincidence with protons, the relative intensities of the and X-ray peaks, , can be used to establish the relationship between the nuclear and atomic lifetimes:
| (5) |
where the level widths and are the equivalent of and , respectively, as they both follow the exponential decay law. The lifetimes of proton-emitting states can be determined by measuring X-ray intensity ratios combined with known atomic -shell vacancy lifetimes, ranging from s for C down to s for Fm [52, 53, 54, 55, 56]. This also defines the PXCT applicable lifetime range, where alternative approaches are limited [57, 58]. The preceding discussion is also generalizable to EC-delayed -particle emission, where the proton-decay daughter is replaced by -decay daughter . Another decay channel is EC-delayed -ray emission, which can occur either before or after the filling of atomic shell vacancies. However, the resulting X rays are always characteristic of and are therefore insensitive for determining nuclear lifetimes.
So far, PXCT has been applied in the decay studies of six nuclei, as summarized in Table 3. PXCT has also been applied in Sn [80, 81] and Cd [82] inelastic scattering measurements at 10- and 12-MeV proton incident energies. By measuring X-rays in coincidence with inelastically and elastically scattered protons, the lifetimes of compound nuclear states can be deduced. However, an uncertain factor in this reaction process is the ionization probability of the -shell during the incoming and outgoing parts of the collision [83, 84]. In the following discussion, we focus on the application of PXCT to EC decay.
In the previous PXCT studies, the proton energy distribution and the X-ray count ratios as a function of coincident proton energies are the most important observables. By reproducing the experimental observables with the statistical model, the model parameters, such as average proton partial widths (), average -ray partial widths (), and level densities (), can be constrained [63, 65, 71, 60].
The initial is typically estimated using the back-shifted Fermi gas model [85, 86]. The initial is calculated using -ray strength functions [87], which can be parameterized by Lorentzian fits to giant resonance cross-section data [88, 89]. The initial is calculated using
| (6) |
where is the transmission coefficient for protons with energy and angular momentum , and is the level density with spin and parity at excitation energy . is typically calculated using the optical model. The PXCT-experimentally constrained particle transmission coefficients will help benchmark the local optical model potentials in this mass region [90].
In all six cases studied using PXCT (Table 3), only the average lifetimes of proton-unbound states populated by EC were obtained. Individual proton-emitting states could not be fully resolved due to high level densities. Moreover, the applicability of this technique has not been explored in an astrophysical context. We have designed, built, and tested LIBRA to extend PXCT to measure all essential ingredients for calculating reaction rates with the Hauser-Feshbach statistical model Eq. (4) [8]. LIBRA may also be able to identify individual resonances, providing spins and parities, excitation/resonance energies, lifetimes, and decay branching ratios for calculating narrow resonance reaction rates using Eqs. (1) and (3).
| EC/-decay | (s) | (keV) [35] | (keV) [35] | (%) | (keV) [121] | (fs) [56] | (fs) |
|---|---|---|---|---|---|---|---|
| 65Ge65Ga | 30.9(5) [59] | 6179.3(23) | 3942.4(6) | 0.011(3) [60, 61, 62] | 8.6, 9.2 | 0.374 | 1.7 [63] |
| 69Se69As | 27.4(2) [64] | 6680(30) | 3420(30) | 0.052(10) [65, 66] | 9.9, 10.5 | 0.315 | 0.33.3 [10, 60, 65] |
| 73Kr73Br | 27.3(10) [67] | 7094(9) | 3067(7) | 0.47(22) [68, 69] | 11.2, 11.9 | 0.264 | 0.32.7 [60, 70, 71] |
| 77Sr77Rb | 9.0(2) [72] | 7027(8) | 3106(4) | 0.08(3) [60, 61] | 12.6, 13.4 | 0.222 | 1.5 [60] |
| 113Xe113I | 2.74(8) [73] | 8916(11) | 841(12) | 7(4) [74] | 27.5, 28.6 | 0.062 | 0.32.9 [74] |
| 117Ba117Cs | 1.75(7) [75] | 9040(260) | 740(60) | 16(3) [76] | 29.8, 31.0 | 0.054 | 4.7 [76] |
| 60Ga60Zn | 0.0694(3)111See Fig. 2 for evaluation details. | 14161(15)111See Fig. 2 for evaluation details. | 5105.0(4) | 1.6(7) [41] | 8.0, 8.6 | 0.406 | |
| 64As64Ge | 0.0690(14) [77] | 14606(110)222Deduced based on 64As mass [78] and 64Ge mass [35]. | 5057(4) | unreported [79] | 9.2, 9.9 | 0.343 |
IV Experimental Setup
IV.1 Beam delivery
For the future experiment case study under consideration, the Facility for Rare Isotope Beams (FRIB) linear accelerator [91] will accelerate 70Ge to 249 MeV/u with a beam power up to 400 kW. The reaction products from 70Ge impinging on a rotating carbon transmission target will be separated in-flight by the Advanced Rare Isotope Separator [92]. A cocktail fast beam containing 60Ga and some nearby isotones will be slowed down in metal degraders with momentum compression and thermalized in gas stoppers filled with helium [93, 94]. The thermalized 60Ga ions will be drifted by a combination of radio-frequency and direct-current fields towards a nozzle and exit into a radio-frequency quadrupole ion-guide system. The ions will be guided and accelerated to 30 keV before being delivered to the stopped beam area [95]. The intensity of the 60Ga stopped beam is estimated to be up to pps.
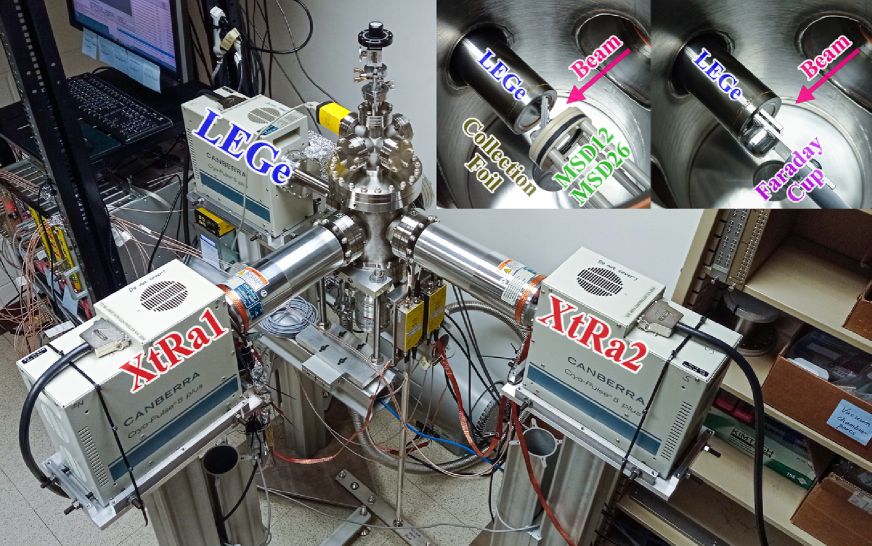
The mechanical design drawing and photograph of LIBRA are shown in Fig. 4. Prior to the experiment, a stable beam around the region will be tuned into the Faraday cup at the center of the vacuum chamber. After maximizing the beam current, the chamber will be vented and the Faraday cup will be replaced by a thin aluminized Mylar foil tilted at a 45∘ angle with respect to the beam direction. The 60Ga beam will then be directed into the center of the foil. A 30-keV 60Ga beam can be fully stopped by a Mylar foil as thin as 50 nm [96], in contrast to the 6.5 mm needed to stop the 130-MeV/u 60Ga fast beam, which would block the emitted X rays and charged particles.

IV.2 Detectors
The detection system is comprised of a planar germanium detector for X-ray detection, two large-volume coaxial germanium detectors for -ray detection, and a silicon telescope for charged-particle detection via energy-loss and residual energy (-).
For X-ray detection, we selected a disc-shaped Low Energy Germanium detector (LEGe), Mirion GL0510 [97]. The LEGe detector comprises a Ge crystal with a diameter of 25.0 mm and a thickness of 10.5 mm. LEGe is housed in a flanged-style cryostat with a diameter of 38.1 mm and a 0.13-mm thick Be entrance window. The endcap is inserted into the vacuum chamber with its entrance window 11.0 mm from the center of the chamber. The Ge crystal is positioned 5.6 mm from the entrance window, subtending 10.1% of the solid angle with respect to the center of the chamber. LEGe is fabricated with a thin contact on the front and side, and a rear contact that covers less than the full area, resulting in lower capacitance than a similar-sized planar device. Since preamplifier noise is a function of detector capacitance, the low capacitance feature makes LEGe ideally suited for X-ray spectroscopy down to 3 keV.
For -ray detection, we selected two Extended Range Coaxial Germanium Detectors (XtRa), Mirion GX10020 [98]. The active volume of XtRa1 has a diameter of 84.8 mm and a thickness of 65.2 mm, while XtRa2 has a diameter of 79.8 mm and a thickness of 80.0 mm. The Ge crystals are positioned 6.8 and 6.3 mm, respectively, from their 0.6-mm-thick carbon composite windows. XtRa detectors feature a thin window contact on the front surface and an contact on the periphery, providing a good low-energy response.
All three Ge detectors are equipped with the Cryo-Pulse 5 Plus electrically refrigerated cryostat [99, 100]. The detector housing is connected to a compact cold-head assembly containing a 5-watt pulse tube cooler. The assembly is powered by a bench-top controller, which contains the necessary logic to ensure the safe and reliable operation of the cryostat. During normal operations, the cold tip is maintained at the preset C. Additionally, a control panel application provides remote control, monitoring, and logging of cryostat status.
For the - charged-particle telescope, we selected two single-sided, single-area circular Si detectors manufactured by Micron Semiconductor Ltd. The active volume of MSD12 is 12 m in thickness and 12 mm in diameter [101], and MSD26 is 1000 m thick and 26 mm in diameter [102]. The junction side of both MSDs features a 50-nm thick boron-doped silicon dead layer and a 30-m wide peripheral metal band for wire bonding, leaving the majority of the active area without metal coverage. The Ohmic side of MSD12 has a thicker dead layer of 300 nm with no metal coverage. The Ohmic side of MSD26 has little impact on charged-particle signals, and thus, we opt for the standard 500-nm thick dead layer and 300-nm thick aluminum coverage. Both silicon chips are assembled onto an FR4 printed circuit board. MSD26 is positioned 15.7 mm from the center of the chamber and covers 11.5% of the 4 solid angle. MSD12 is 11.2 mm from the center and defines the solid angle coverage of the - telescope at 5.9% of 4.
IV.3 Electronics
All three Ge detectors are equipped with Intelligent Preamplifiers (iPA) [103], which incorporate a low-noise field-effect transistor (FET) input circuit optimized for the ultra-high source impedance of Ge detectors. The first stage of the iPA functions as an integrator, providing an output voltage proportional to the accumulated charge. The second stage of the iPA acts as an output buffer and offers four selectable gain settings. The output signal is split into two channels with termination impedances of 93 and 50 , respectively. The iPA memory stores detector leakage currents, temperatures, and preamplifier operating voltages. A control panel application allows for remote monitoring and logging of these parameters. Each iPA is equipped with two 100- Pt resistance temperature detectors thermally connected to the crystal holder (PRTD1) and the cold tip (PRTD2), respectively [104]. The PRTD1 reading represents the temperature of the Ge crystal when they are in thermal equilibrium. If either PRTD exceeds its preset threshold, it can trigger the high-voltage inhibit via the iPA. This mechanism operates independently of the inhibit function via the controller, providing enhanced protection for the detector.
Two ORTEC 660 Dual Bias Supply modules [105] are used to provide bias voltages to the three Ge detectors. We apply a negative bias to the contacts of LEGe and a positive bias to the contacts of XtRa. LEGe becomes fully depleted at 600 V and is recommended to be operated at 1100 V. XtRa1 and XtRa2 become fully depleted at a bias voltage of 4000 V and 2200 V, respectively, and both operate at 4500 V. The bias shutdown mode of the ORTEC 660 is set to TTL to be compatible with the iPA high-voltage inhibit mode. The typical leakage currents of the two XtRa detectors are below 20 pA and below 100 pA for LEGe. The tail pulses from iPA exhibit rise times of 150 ns (LEGe) and 250 ns (XtRa), with a 50 s decay constant.
A Mesytec MHV 4-channel bias supply module with remote control features provides the bias voltages to the two MSD Si detectors. We apply a negative bias to the contacts of both MSD detectors through MPR-1 charge-sensitive preamplifiers [106] and the contacts are grounded. MSD12 has a depletion voltage of 1.5 V and is operated at 3.0 V, and MSD26 has a 90 V depletion voltage and is operated at 130 V. MHV offers a ramp speed as low as 5 V/s to protect the circuits of preamplifiers [107]. MSD12 exhibits a leakage current of approximately 1 nA, while MSD26 exhibits a leakage current of approximately 60 nA. The energy and timing outputs of the MPR-1 are both terminated with 50 impedance. The tail pulses from MPR-1 exhibit rise times of 400 ns (MSD12) and 70 ns (MSD26), with a 120 s decay constant. All preamplifiers are powered by two Mesytec MNV-4 NIM power distribution and control modules [108].
IV.4 Data acquisition
All preamplifier signals are transmitted through double-shielded RG316 coaxial cables of equal length and then digitized by a 16-bit, 250 MHz Pixie-16 module manufactured by XIA LLC [109]. The input impedance of each channel in Pixie-16 is switchable between 50 and 1 k. The Digital Data Acquisition System (DDAS) [110, 111] is used for recording and processing data. Trapezoidal filtering algorithms are implemented in both the slow filter for pulse amplitude measurement and the fast filter for leading-edge triggering. The DDAS filter parameters are optimized based on Refs. [111, 112, 113, 114].
The system operates in an internally triggered mode: recording data on a channel-by-channel basis whenever the trigger filter crosses the user-defined threshold. Data from all channels are ordered in time and subsequently assembled into events in software based on a user-defined event window length. Each event is timestamped using a Constant Fraction Discriminator (CFD) algorithm based on the trigger filter response. The event timestamp is counted with 125 MHz clock ticks, i.e., 8 ns intervals.
The pulse amplitude is extracted from the energy filter amplitude at approximately rise time plus gap time after triggering. If a second trigger arrives within the rise time plus gap time window, both events will be flagged as pile-up. In the tests conducted in the next section, pile-up rejection is turned off in DDAS. As a result, the timestamp of the first event is preserved while the second is discarded for all the tests conducted in the next section. The amplitude of the second event is partially added to that of the first event, with the addition diminishing as the time interval between them increases. The count rate capacity of the detection system is primarily determined by the energy filter parameters selected for each detector.
To assess DDAS live time under our parameter setting, a DB-2 Random Pulser [115] is used to generate pulses with time intervals following a Poisson distribution. The recorded count rates are shown in Fig. 5, which are consistent with the pile-up rates defined by the energy filter settings [110]. Considering the achievable stopped beam rates at FRIB, decay intensities, and detection efficiencies, no detector is expected to process more than 1000 events per second in the 60Ga decay experiment, and therefore, the event loss due to pile-up for any detector will be less than 3%. Furthermore, DDAS can provide real-time spectra for identifying characteristic charged particles and rays from decay, aiding in the online identification of radioactive beams.

V Performance Tests
Table 4 lists the characteristics of all radioactive sources used in the LIBRA detector tests. An event-build window of s was set, and the count rate of each detector remained below 1500 events per second throughout all conducted tests, except for the LEGe efficiency test with the 152Eu source.
| No. | Nuclide | Decay | (Bq) | (%) | (mm) | (y) |
|---|---|---|---|---|---|---|
| 1 | 55Fe | EC | 111Unknown source activity uncertainties; not used for efficiency calibration. | 9.5 | 2.74 | |
| 2 | 60Co | 3 | 1 | 5.27 | ||
| 3 | 137Cs | 3 | 3 | 30.1 | ||
| 4 | 148Gd | 111Unknown source activity uncertainties; not used for efficiency calibration. | 5 | 71.1 | ||
| 5 | 152Eu | EC/ | 1.4 | 3 | 13.5 | |
| 6 | 241Am | 2.7 | 3 | 432.6 |
V.1 X-ray measurements
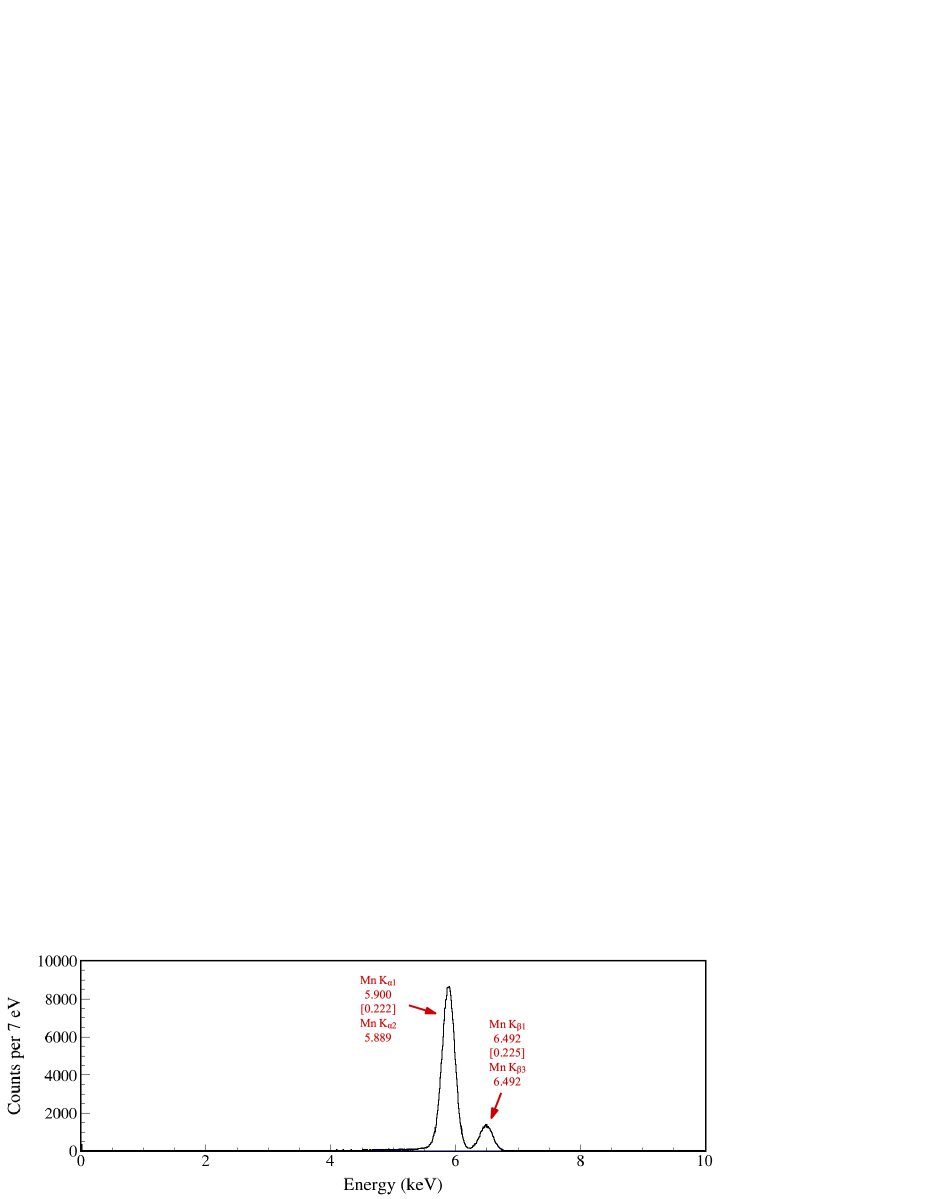
We evaluated the performance of LEGe using the 55Fe, 152Eu, and 241Am sources, as shown in Fig. 6. 55Fe EC decays to 55Mn ground state, and the subsequent filling of atomic shell vacancies results in X rays characteristic of Mn. Similarly, Sm X rays mainly result from 152Eu EC. 152Eu decay populates 152Sm/152Gd excited states, which can deexcite via internal conversion (IC), followed by filling of atomic shell vacancies and the emission of X rays characteristic of Sm/Gd. This explains why the observed Gd X rays are much weaker compared to Sm X rays that have two production mechanisms: EC and IC. For 241Am, decay populates 237Np excited states, where IC serves as the primary mechanism leading to Np X rays. A trace amount of X rays may also arise from inner-shell ionization and excitation caused by perturbations in the electron cloud during nuclear decays [116, 117, 118]. The 0.13-mm thick Be entrance window is sufficient to block electrons below 125 keV [119], rendering the LEGe detector insensitive to Auger electrons.
The overall energy resolution achieved by LEGe is characterized by fitting X-ray or -ray lines with an exponentially modified Gaussian (EMG) function [120] to account for incomplete charge collection at 5.90 keV (Mn ), 6.49 keV (Mn ), 11.89 keV (Np ), 13.76 keV (Np ), 13.95 keV (Np ), 26.34 keV (237Np ), 33.20 keV (237Np ), 39.52 keV (Sm ), 40.12 keV (Sm ), 45.29 keV (Sm ), 45.41 keV (Sm ), and 59.54 keV (237Np ). We then interpolated the full width at half maximum (FWHM) values at the energies of interest, 8.05 keV (Cu ) and 8.64 keV (Zn ), to be 0.238(8) and 0.241(7) keV, respectively, demonstrating sufficient resolution to distinguish between the key X rays of Zn and Cu.
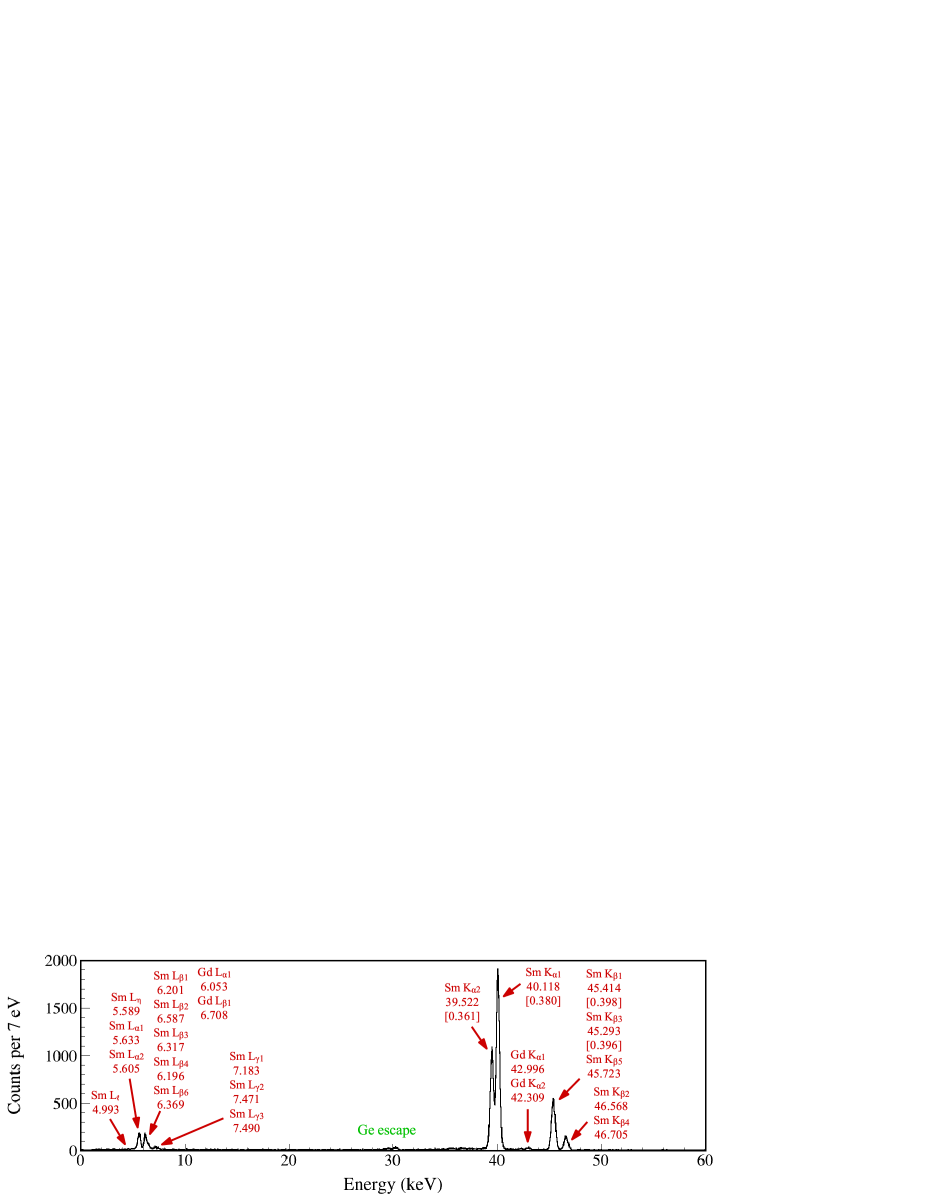
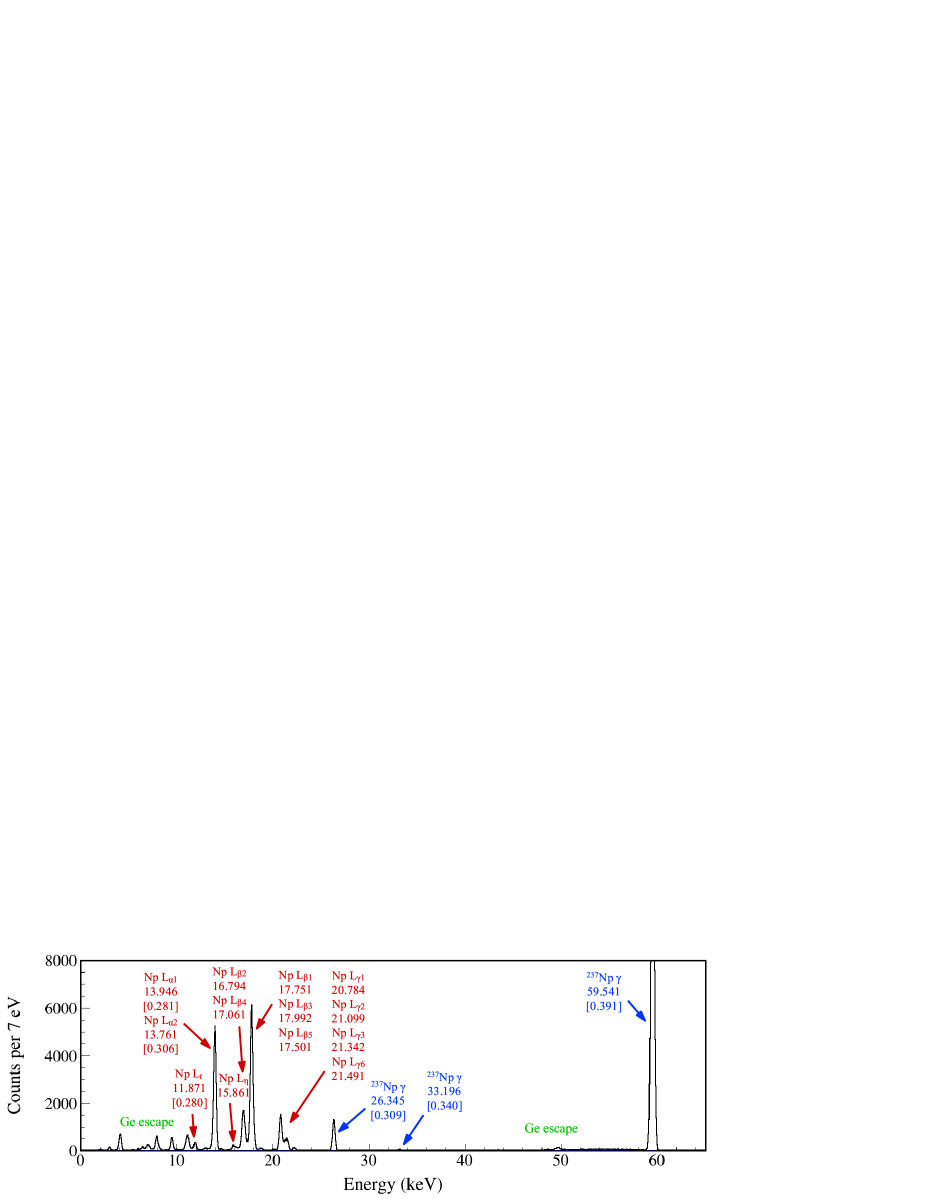
For photons below 100 keV interacting with Ge, the photoelectric effect is predominant, i.e., the photon is absorbed, and a photoelectron is ejected by the Ge atom. When the resulting atomic shell vacancy is filled, X rays characteristic of Ge may be created. A full-energy peak is still observed if these X rays are reabsorbed near the original interaction site. However, if the photoelectric interaction occurs near the surface of Ge, the X rays are more likely to escape, which results in peaks usually at 9.89 keV and 10.98 keV below the photopeaks, known as the Ge escape peaks (Fig. 6). These energy differences correspond to the characteristic and X-ray energies for Ge, respectively [121].
We evaluated the detection efficiency of LEGe using the X rays from the 152Eu source placed at the center of the chamber tilted at a 45∘ angle with respect to LEGe. 152Eu emits Sm X rays at 5.0 keV (), 5.6 keV (, ), 6.2 keV (), and 7.2 keV (). The Gd X rays are approximately half a keV higher but with two orders of magnitude lower intensities. We adopted the total X-ray emission probability from Ref. [123] and deduced the absolute intensities for each of the 4 groups of X rays based on the relative emission probabilities reported by Ref. [124]. The corresponding efficiencies are indicated by the 4 low-energy data points in Fig. 7. We also measured the X rays from the 241Am source placed at the center of the chamber. 241Am emits Np X rays at 11.9 keV (), 13.9 keV (), 15.9 keV (), and 17.0 keV () [125]. The corresponding efficiencies are indicated by the 4 high-energy data points in Fig. 7.
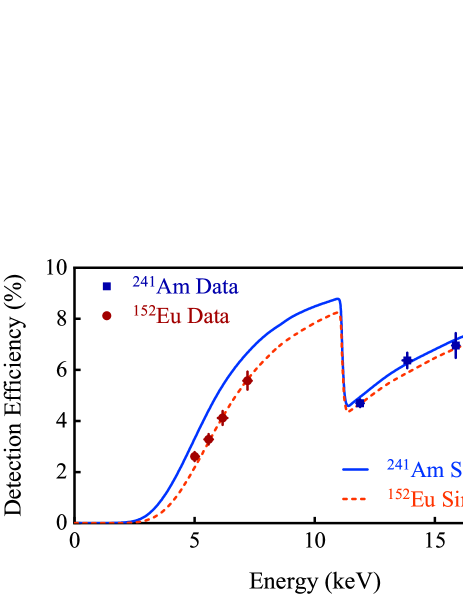
We simulated the X-ray detection efficiencies using geant4 [126, 127]. The simulation incorporates the geometric configuration of the setup and the LEGe detector response, which was characterized by fitting the measured X-ray lineshapes in Fig. 6 with the EMG function. Monoenergetic X rays are emitted isotropically from the source position and interact with the surrounding materials. The simulation outputs an energy spectrum, from which we obtain the detection efficiency by dividing the counts in the X-ray peak by the number of emitted X rays. This process was repeated at different energies to generate the efficiency curves shown in Fig. 7.
For photon energies just above the -shell binding energy of Ge, 11.1030(20) keV [121], the incident photon is strongly absorbed without deep penetration beyond the detector surface. The subsequent characteristic X rays of 9.711.1 keV tend to escape. However, for photons just below the Ge -shell binding energy, -shell absorption is no longer possible, and -shell interactions dominate. In this case, incident photons tend to penetrate somewhat deeper, and the chance of escape of the fluorescent Ge X rays of 1.01.4 keV is significantly lower. This phenomenon abruptly changes the full-energy detection efficiency of X rays near the -shell absorption edge [128]. The 241Am source used for this test is an open source, while the 152Eu source is encapsulated between two 60-m thick Mylar tapes. The Mylar layer attenuates low-energy X-rays, but its impact diminishes for X rays above 10 keV. Additionally, the LEGe count rate was 3000 pps during the 152Eu test but only 200 pps during the 241Am test, resulting in different DDAS live time (Fig. 5). Therefore, the 152Eu efficiency curve represents a lower limit, while the 241Am efficiency curve represents an ideal setting. The 60Ga experimental condition is expected to fall between these two scenarios, and we estimate the X-ray efficiencies at 8.0 and 8.6 keV to be 6.57.4% and 7.07.8%, respectively.
V.2 -ray measurements
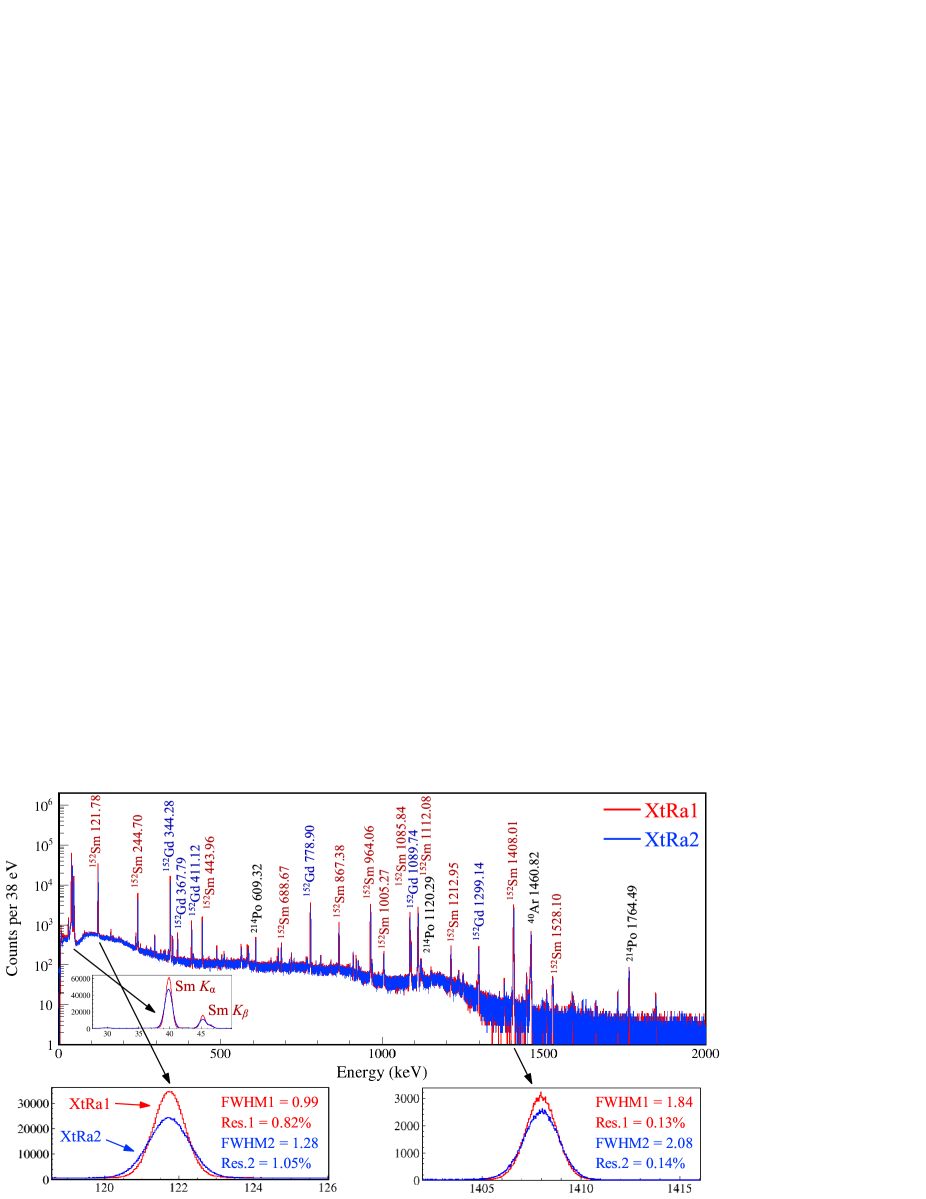
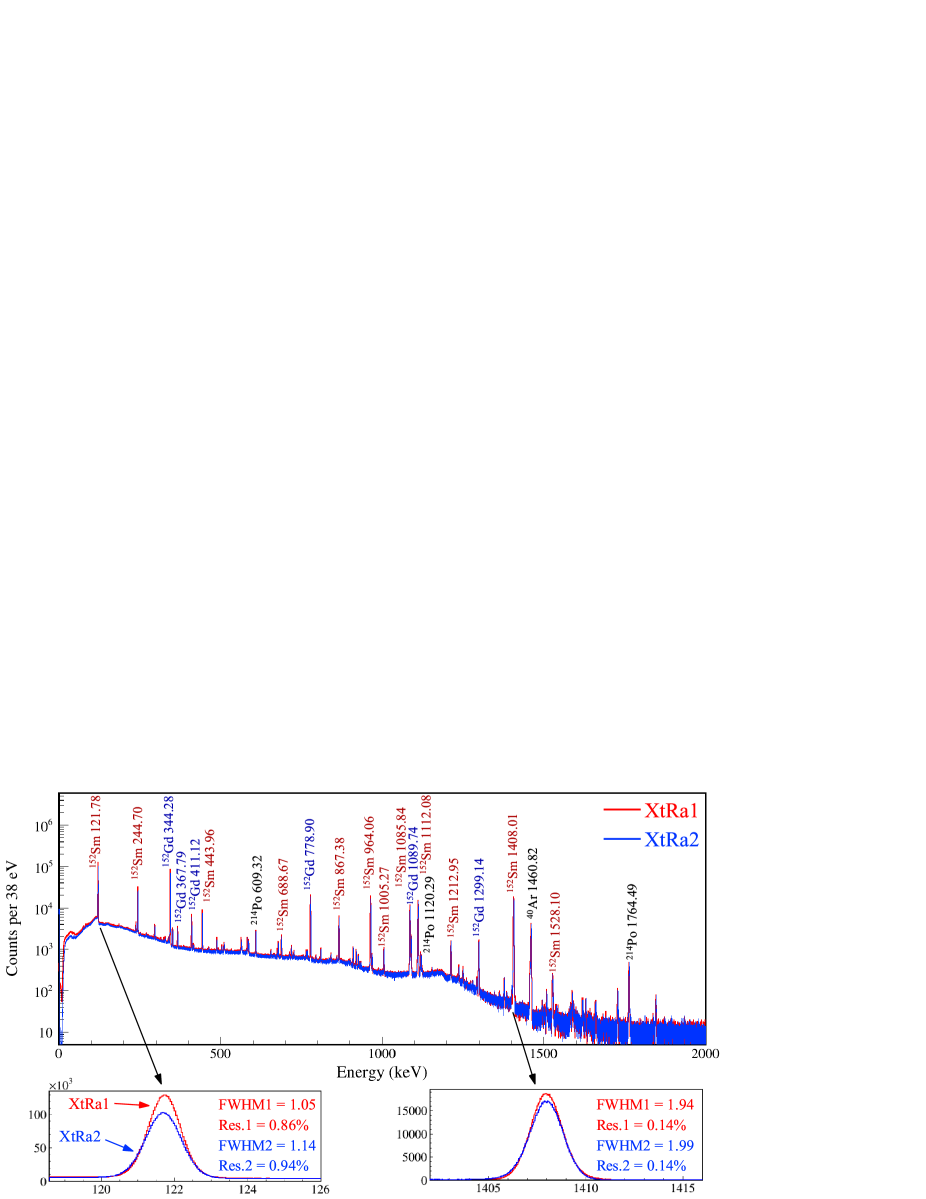
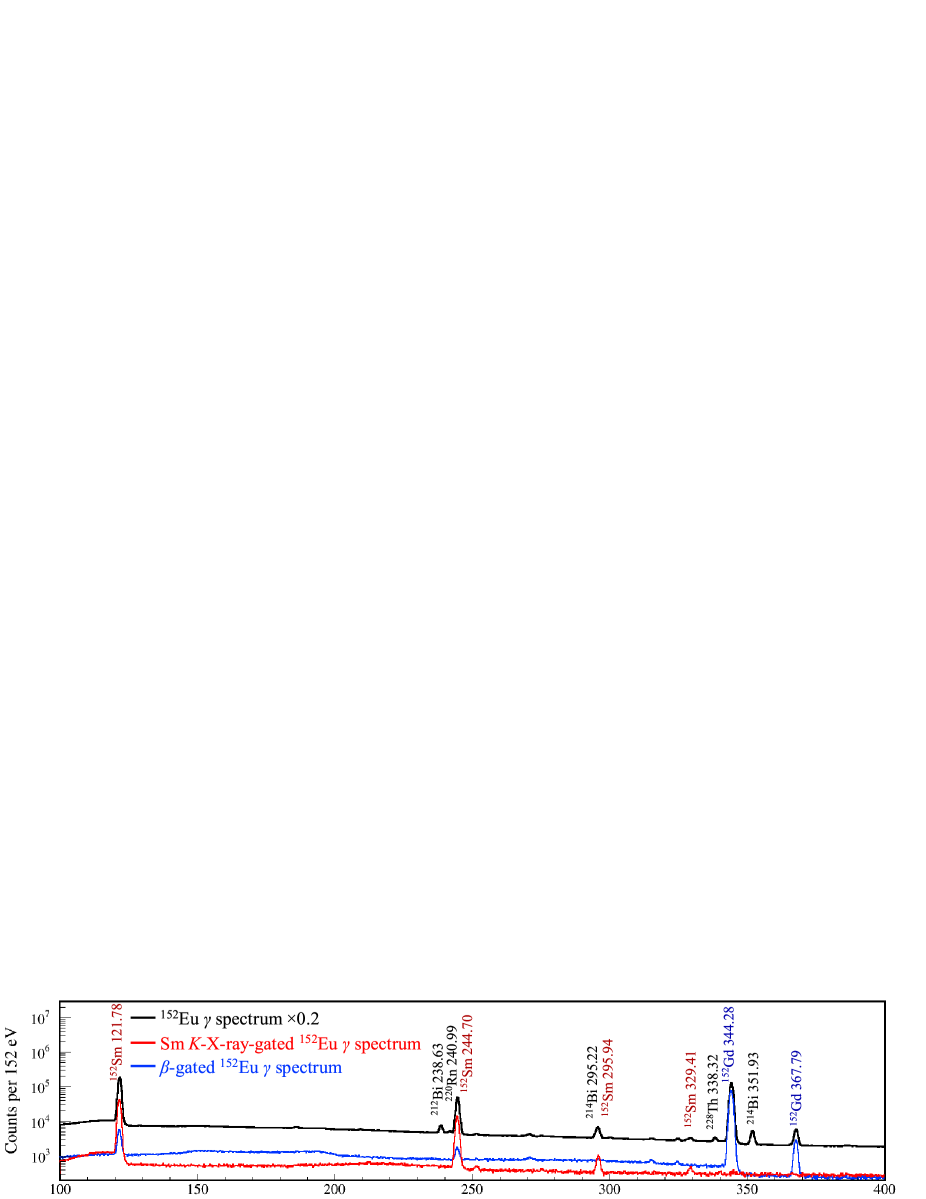
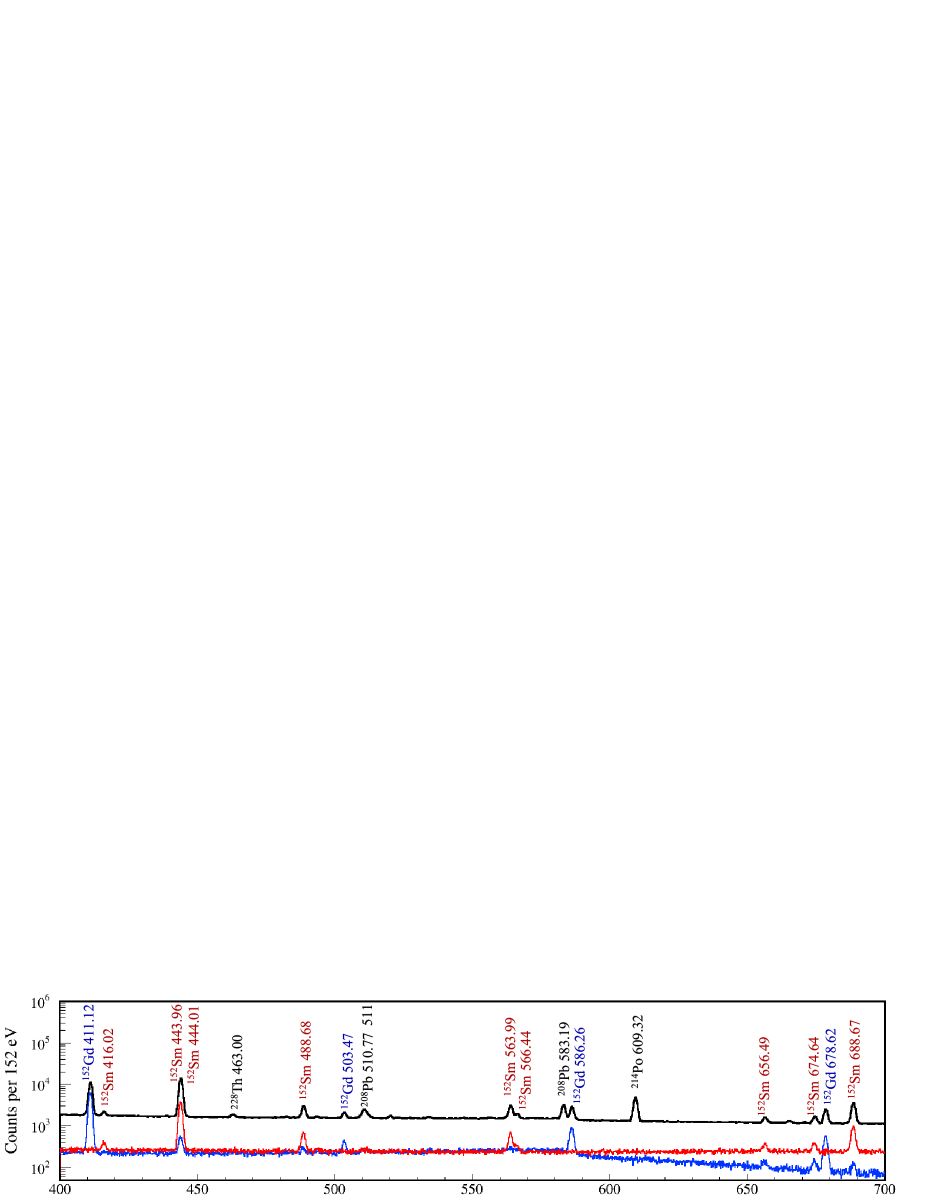
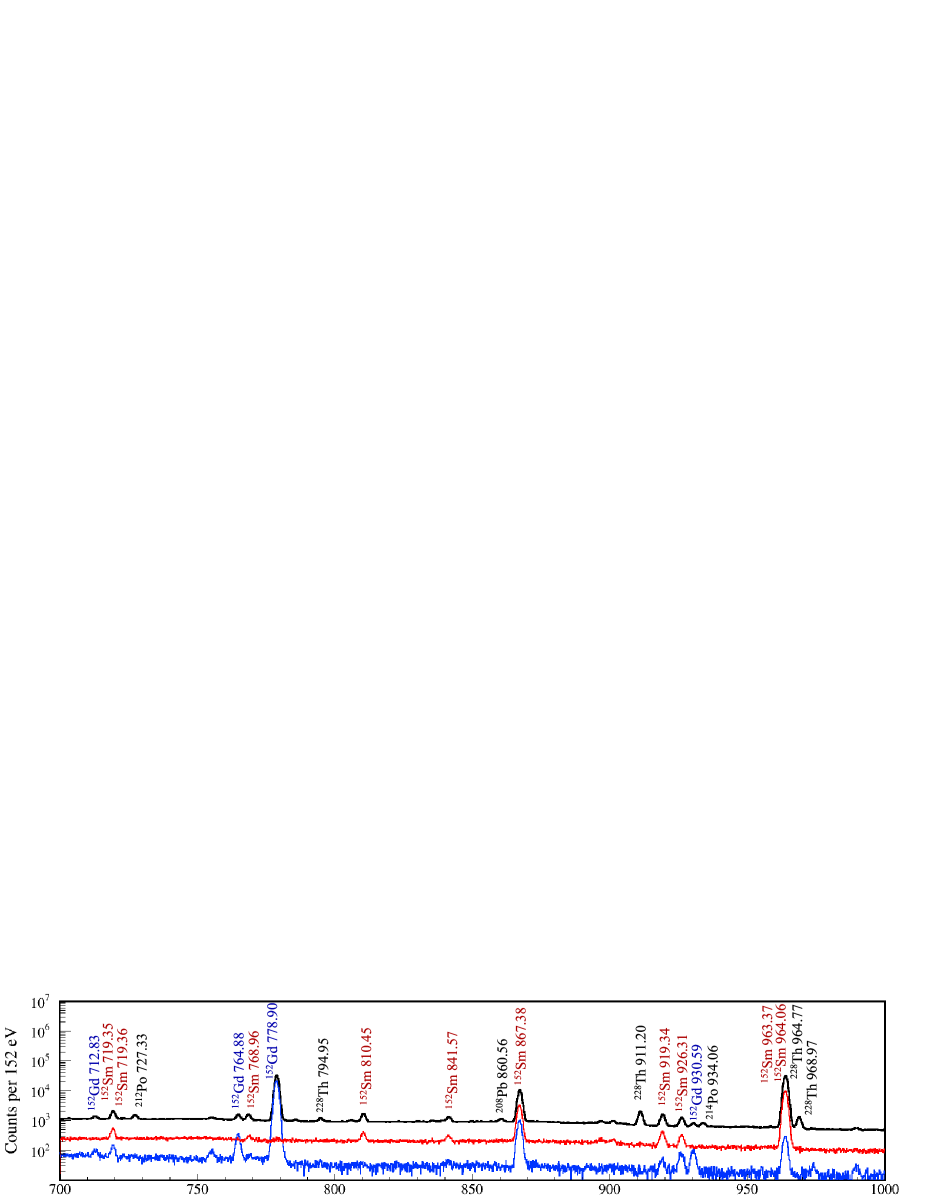
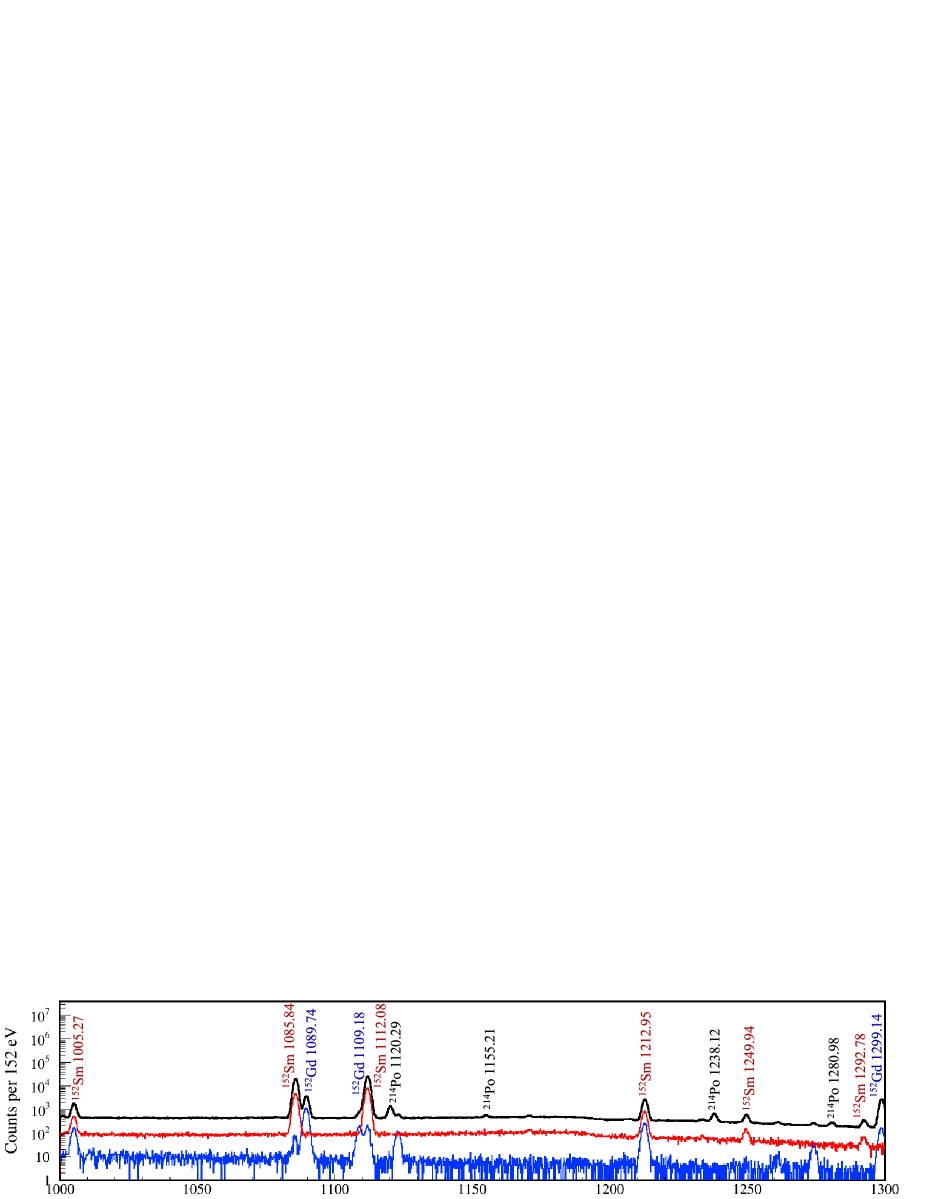
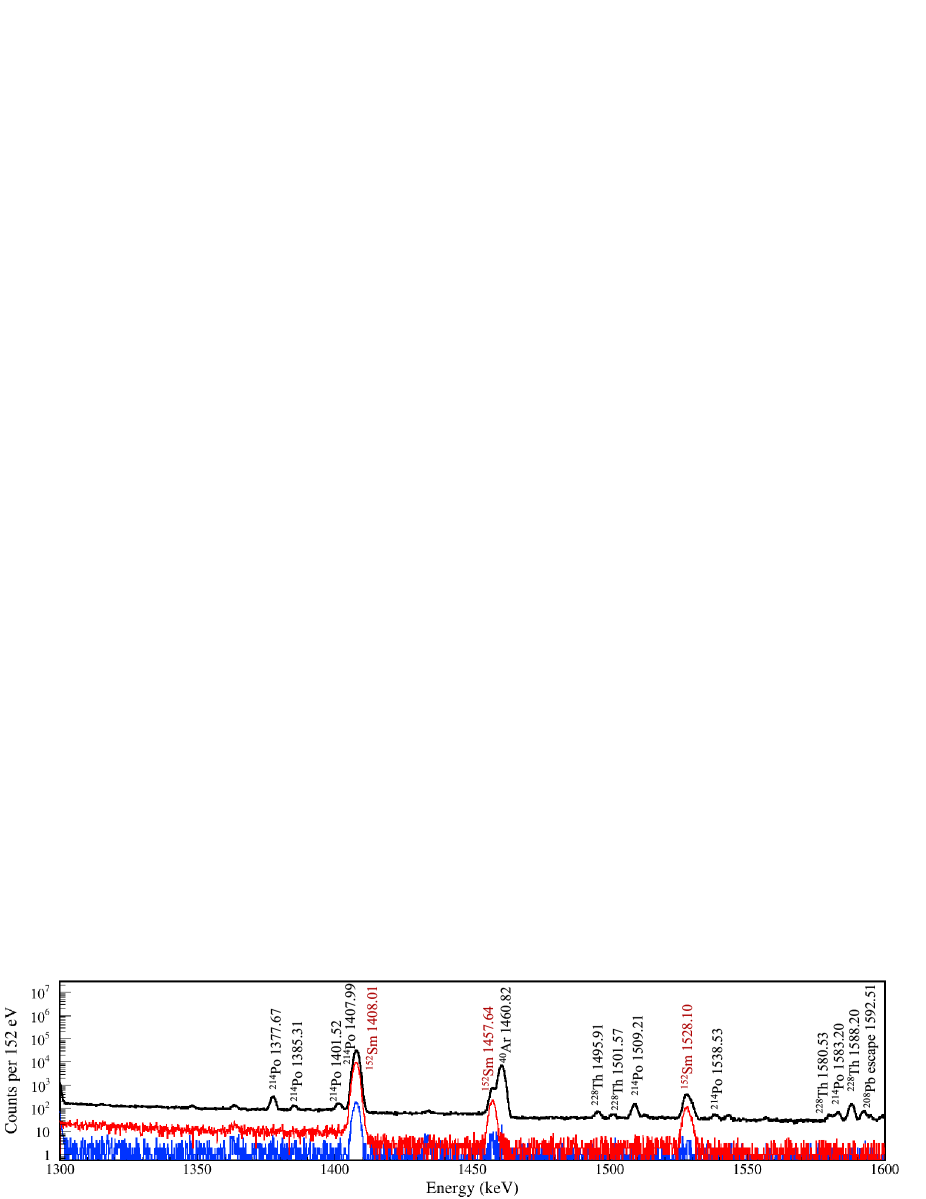
Figure 8 shows the -ray spectra measured by XtRa1 and XtRa2 using the 152Eu source. We first placed the source at the midpoint between the two XtRa detectors that were facing each other, with a distance of 28 cm between them. Both XtRa detectors exhibit good low-energy response to the 152Sm X rays at 40 keV. We then placed the source at the center of the vacuum chamber to determine the absolute -ray detection efficiencies. The two XtRa detectors were placed as close as possible to the two flanges (Fig. 4), with their entrance windows about 12 mm from the flange surface. XtRa1 Ge crystal has a slightly larger diameter than XtRa2. Both Ge crystals are 158.5 mm from the target center, covering 1.70% and 1.51% of the 4 solid angle, respectively. Both XtRa detectors record an average of 300 room background rays per second in our lab test environment. The manufacturer specifies FWHM values for XtRa1 and XtRa2 as 0.998 and 1.065 keV at 122 keV (57Co), and 1.879 and 1.926 keV at 1332 keV (60Co), respectively. The insets of Fig. 8 demonstrate that the observed energy resolution using the 152Eu source aligns with these specifications. The absence of X-ray peaks in the second test (lower panel of Fig. 8) is due to the 3.175-mm thick stainless steel flanges of the chamber effectively blocking the X rays.
We also measured the -ray detection efficiencies using the 60Co and 137Cs sources placed at the center of the chamber. MSD12 was not in place during these tests due to its fragility. MSD26 and the Si detector holders attenuated the rays from the source to XtRa2 but had little effect on XtRa1. Based on an exponential function that contains a polynomial of degree with the natural logarithm of the energy : [130] fit on all the data points, we obtain the photopeak efficiencies of 0.334(3)% and 0.286(3)% at 1 MeV, respectively, for XtRa1 and XtRa2. The error bars on the data points reflect the uncertainty of the -ray yields and the source activities, with an additional 2.5% uncertainty to account for the true coincidence summing effect [131, 132], which was estimated based on the observed 1173-1332-keV cascade from 60Co.
We have used geant4 simulation [126, 127] to extend the -ray detection efficiency curve to high energies (Fig. 9). The simulation takes into account the geometry of the setup and the detector response characterized by fitting the measured -ray lineshapes with the EMG function. Monoenergetic rays were emitted isotropically according to the source distribution and interacted with the surrounding materials. The photopeak efficiency was extracted from the output spectrum. We then fit the ratio of the simulated efficiency to the measured efficiency between 0.51.5 MeV and obtained energy-independent ratios of 0.875(10) and 0.837(10) for XtRa1 and XtRa2, respectively, which serve as the normalization factors to match the simulation with the experimental data. One of the factors that reduces the measured efficiency is the data acquisition event loss, which is estimated to be 3.3%, 0.7%, and 2.1% based on the count rates during the 60Co, 137Cs, and 152Eu tests, respectively (Fig. 5).

The mechanical design allows for the versatile combination of individual detectors for various experimental purposes. The two XtRa detectors have been coupled with a silicon cube [133, 134] and with a Time Projection Chamber [135]. We also have the option to engineer the integration of LEGe and the central chamber with larger germanium detector arrays, such as the DEcay Germanium Array initiator (DEGAi) and ultimately DEGA of the FRIB Decay Station [136], to achieve a higher -ray detection efficiency.
V.3 Charged-particle measurements
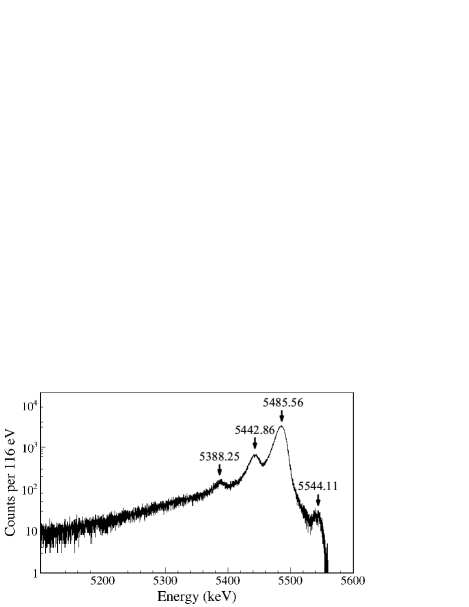
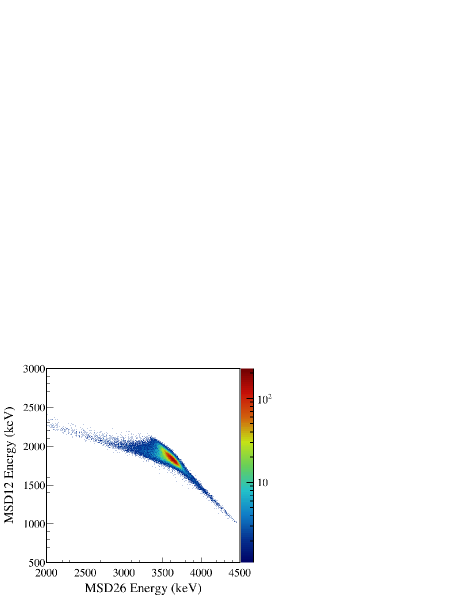
Figure 10 shows the spectrum measured by MSD26 alone using the 241Am source, with a 2-mm diameter aperture installed in front. An EMG fit of the main peak at 5485.56 keV yields a FWHM value of 17.0 keV, corresponding to an energy resolution of 0.31%. MSD12 alone is too thin to stop particles above 3 MeV, and we demonstrate the - spectra measured by the telescope formed by MSD12 and MSD26 in Fig. 11. An EMG fit of the energy-sum peak yields a FWHM value of 52.1 keV, corresponding to an energy resolution of 0.95%. This resolution is better than that of the Si telescopes used in the previous 60Ga experiment [41], where FWHM values for 148Gd ( keV [137]) were reported to be 100 and 90 keV for the and 50 and 60 keV for the detectors.

MSD26 was calibrated using the 148Gd and 241Am sources. We then measured the residual energy of 241Am particles in MSD26 with MSD12 installed in front of it. This allowed us to accurately determine the effective thickness of MSD12 to be 11.65(8) m after subtracting the 0.35-m dead layer thickness [96]. The total thickness of MSD12 is in agreement with the nominal value of 12 m specified in the Micron datasheet [101].
V.4 Electron measurements
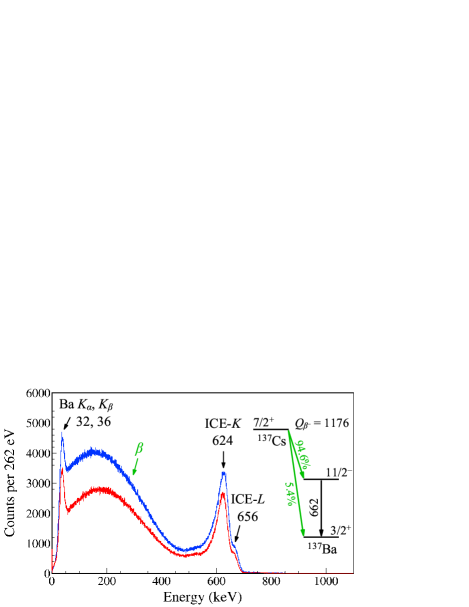
Figure 12 shows the electron spectra measured by MSD26 using the 137Cs source placed at the center of the chamber facing MSD26. The source is deposited on a 64.4-m thick aluminized Mylar disk and covered with a 6.3-m thick Kapton window. The spectrum exhibits a continuum of electrons from 137Cs decay, along with distinct electron peaks from IC. The main decay branch has an endpoint energy of 514 keV and the IC peaks are characterized by the energy differences between the 662-keV 137Ba isomeric transition and the Ba atomic shell binding energies. Using the total intensity of IC electrons of 9.56(14)% per 137Cs decay [138] and the source activity (Table 4), we estimate the detection efficiency of MSD26 alone to be 9.0(3)%.
V.5 Coincidence measurements
Figure 13 shows the - coincidence spectrum between the MSD telescope and LEGe with the 241Am source placed at the center of the chamber. The source faces the MSD, and its 127-m-thick Pt substrate attenuates most of the low-energy photons emitted towards LEGe, leaving mainly the 59.5-keV 237Np ray and its escape peaks observable.

We placed the 152Eu source at the center of the chamber. Figure 14 shows the XtRa1 spectra gated by the Sm X rays measured by LEGe and gated by the electrons measured by MSD26, respectively. By applying the characteristic X-ray coincidence condition, both the room background rays and the 152Gd rays are substantially suppressed. Conversely, the electron coincidence condition suppresses the room background and the 152Sm rays. Having the ability to detect electrons and positrons will help to clean up the spectrum in radioactive beam measurements, thereby facilitating the identification of ray origins.
V.6 Timing performance
The timing performance of the electronics was first tested using a Canberra Model 1407P Pulse Pair Generator [139]. The dual pulses were separately fed into two Pixie-16 channels. The FWHM resolution of the time-difference distribution is estimated to be 0.46 ns. Then, the primary pulse was split and fed to each test input of preamplifiers, and the resulting FWHM timing resolutions are 37.4 ns (MSD12), 4.4 ns (MSD26), 1.2 ns (XtRa1), and 1.8 ns (XtRa2).
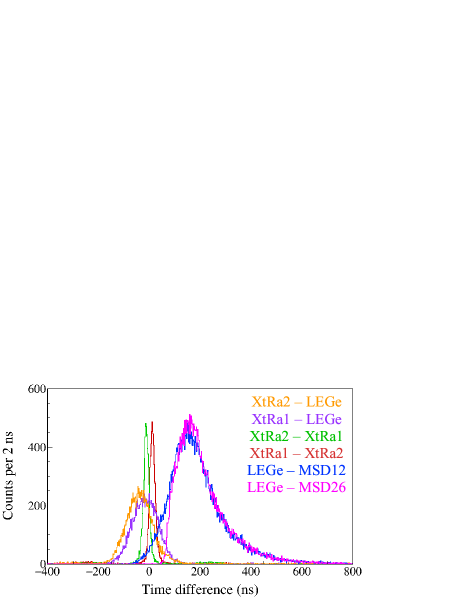
The timing performance of the detectors was studied using each of the 60Co, 152Eu, 241Am sources placed at the center of the chamber. 60Co provides - coincidences to test the two XtRa detectors, 152Eu provides X- coincidences to test LEGe and XtRa, and 241Am provides - coincidences to test MSD and LEGe. Figure 15 shows the time difference distributions between each coincidence. Based on these measurements, an event-build window of a few hundred ns can be defined to capture all prompt coincidences and some chance continuum for background subtraction in offline analysis. The asymmetric tail in both - time difference distributions is attributed to the relatively long-lived 59.5-keV excited state of 237Np.
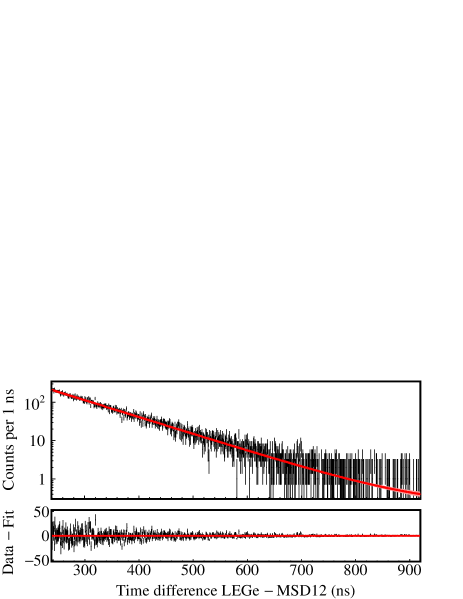
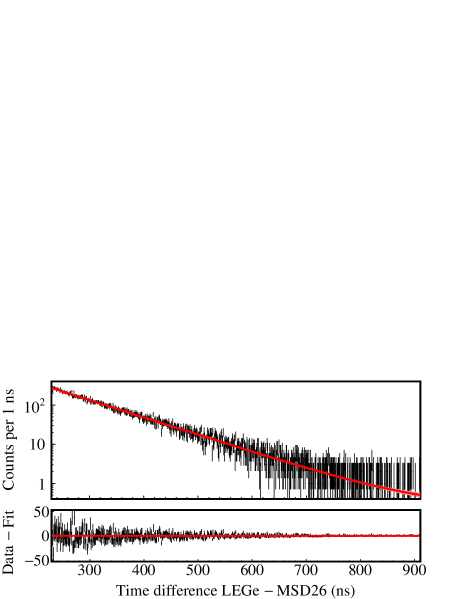
Figure 16 shows the - time difference distribution constructed by the start timestamps from 5486-keV measured by the two MSDs and the stop timestamps from the 59.5-keV ray deexciting the 59.5-keV state in 237Np measured by LEGe. By fitting the time spectra with a function
| (7) |
composed of the total number of decays (), the exponential decay half-life (), and a constant background (), we obtained the half-life of the 59.5-keV excited state in 237Np to be ns (MSD12) and ns (MSD26), respectively. The results obtained from both Si detectors are consistent with recent precision measurements of 67.86(9) ns [140] and 67.60(25) ns [141].
VI Calculations & Simulations
To assess the feasibility of the 60Ga decay measurement with LIBRA, we performed shell-model calculations in the truncated -shell model space with the GPFX1A Hamiltonian [142] using the NuShellX@MSU code [143]. The newly-evaluated 60Ga keV [36, 37] was incorporated into the calculation. We obtained 900 60Zn states populated by 60Ga decay up to MeV, with 300 states each for . A quenching factor for the matrix elements of the Gamow-Teller operator was used to calculate the feedings in 60Ga decay. We calculated the decay widths and for 128 resonances with up to MeV, corresponding to the upper end of the 59Cu Gamow window at 1.5 GK. We also calculated the average decay widths , , and using the statistical model code smaragd [144, 145]. We adopted the shell-model calculated and and the statistical-model calculated to calculate the 59CuZn and 59CuNi reaction rates by combining all 128 positive parity resonances. The fractional contributions of each resonance are shown in Fig. 17. The statistical model calculation indicates that the level densities for and states in 60Zn fall below 1 MeV-1 at excitation energies of 7.2 and 6.9 MeV, respectively. This suggests that resonances are less likely to be present within the Gamow window and to significantly contribute to the total reaction rate. Shell model calculations indicate that a limited number of -decay populated resonances lie within the Gamow window, which exhibit competing and proton decay widths. Table 5 summarizes the properties of the six most influential 59CuZn resonances. It should be noted that the uncertainties of the excitation/resonance energies are on the order of 200 keV. The resonances listed in Table 5 are not the specific resonances that our experiment aims to identify but rather represent a typical potential scenario that we may encounter. Any 60Zn resonances that we are able to identify through 60Ga decay may help constrain the 59CuZn and 59CuNi reaction rates.
A theoretical reaction rate calculation with principled uncertainty quantification will be discussed in a forthcoming paper [146], in which all the nuclear physics properties entering into the reaction rate calculation are randomly sampled according to appropriate probability density functions [147, 148, 149, 150, 151].
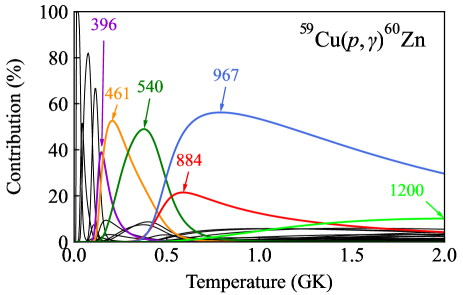
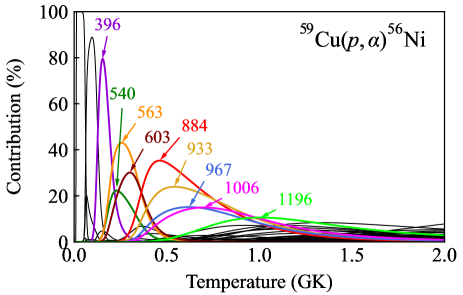
| (keV) | (keV) | (eV) | (eV) | (eV)111From the statistical model calculation. | (fs) | log | (%) | ||
|---|---|---|---|---|---|---|---|---|---|
| 5501 | 396 | 17.3 | 5.463 | 0.314 | |||||
| 5566 | 461 | 0 | 10.3 | 4.708 | 1.713 | ||||
| 5645 | 540 | 3.5 | 6.146 | 0.060 | |||||
| 5989 | 884 | 17.5 | 5.367 | 0.287 | |||||
| 6072 | 967 | 2.1 | 5.536 | 0.184 | |||||
| 6305 | 1200 | 1.6 | 7.035 | 0.005 |
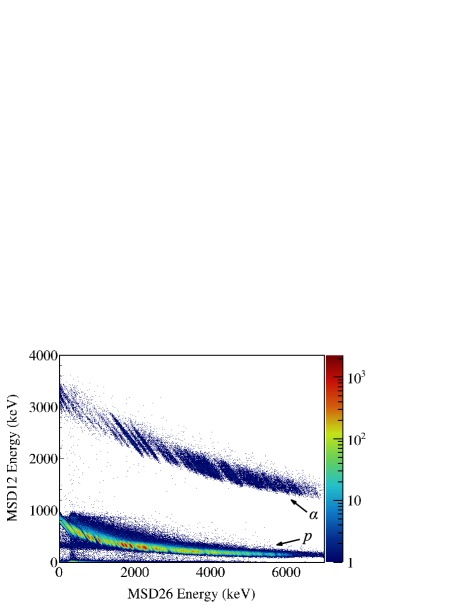
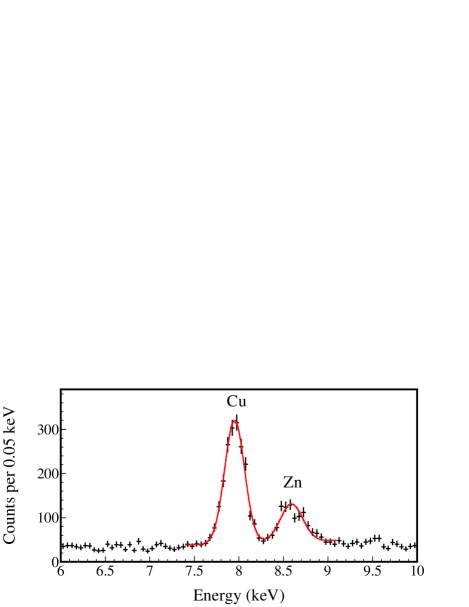
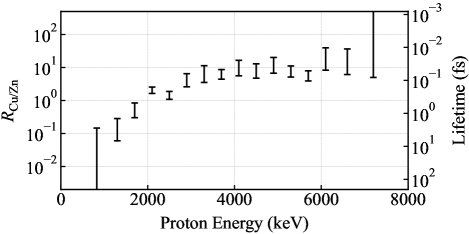
One of the key observables offered by LIBRA is the proton-X-ray coincidence. We conducted geant4 simulations incorporating the theoretical 60Ga decay scheme and the known decay schemes of the daughter nuclei [38, 39, 40], the detector responses characterized based on radioactive source tests, and the 60Ga projected statistics of . The resulting simulated proton and particle identification spectrum by the - telescope and the proton-gated X-ray spectrum by LEGe are shown in Fig. 18.
The Cu/Zn X-ray count ratio can be determined by integrating the 8.0- and 8.6-keV X-ray peaks observed in coincidence with protons. The Zn radiative transition probability is 41.7%, compared to 38.7% for Cu [52], and the LEGe detection efficiency for 8.6-keV photons is 7.8%, compared to 7.4% at 8.0 keV (Fig. 7). Consequently, we need to apply two correction factors of for fluorescence yields and for efficiencies when extracting the lifetime of the proton-emitting state in 60Zn from the observed Cu/Zn X-ray count ratio:
| (8) | ||||
| (9) |
Fig. 18 bottom panel shows the Cu/Zn X-ray count ratios as a function of coincident proton energy and the inferred lifetimes of 60Zn proton-emitting states. The total X-ray ratio of yields an average lifetime fs, where only the statistical uncertainty is taken into account. The main source of systematic uncertainty is the recommended Zn -shell vacancy width eV [56], adjusted based on the calculated eV from Ref. [52]. A resonant Raman scattering measurement reported eV [152], which is consistent with the recommended value, considering estimated uncertainty of 525% for atomic numbers below 30 [56].
VII Summary & Outlook
We present the design, construction, simulation, and radioactive source testing of LIBRA. The system is capable of detecting all types of charged particles and photons emitted in EC/ decay, which will enable us to measure the decay branching ratios for proton, , and rays, and the lifetimes of resonances. Proton/- coincidences provide information on the proton/-emitting states in the compound nucleus and the ground and excited states of daughter nuclei, pertinent to both the entrance and exit channels for particle-induced reactions. LIBRA data can also provide nuclear level densities and transmission coefficients needed for calculating reaction rates using the Hauser-Feshbach statistical model.
Utilizing LIBRA for 60Ga EC/ decay offers the unique advantage of obtaining all necessary quantities required for calculating the 59CuZn and 59CuNi thermonuclear reaction rates in a single experiment. This approach eliminates the need for separate indirect measurements of different quantities, thereby enhancing the accuracy and consistency of astrophysically relevant nuclear data.
LIBRA holds great potential for studying other important reaction rates in the -process. As shown in Fig. 1, 64Ge plays an analogous role in the ZnGa cycle to that of 60Zn in the NiCu cycle [18, 19, 153]. A notable difference is that the allowed transitions of the 64As ground state populate the and states in 64Ge [77]. Given the comparable , half-lives, proton/-separation energies, and key X-ray energies (Table 3), it is technically feasible to utilize LIBRA for the 64As EC/ decay experiment to address the competition between the 63GaGe and 63GaZn reactions.
VIII Acknowledgments
We gratefully acknowledge Stephen Gillespie, Aaron Chester, Giordano Cerizza, Craig Snow, and the FRIB Mechanical Engineering Department for their technical assistance. We would like to thank Tibor Kibédi for the helpful discussions. This work was supported by the U.S. National Science Foundation under Grants Nos. PHY-1913554, PHY-2110365, and PHY-2209429, and the U.S. Department of Energy, Office of Science, under Awards Nos. DE-SC0016052 and DE-SC0023529.
References
- [1] M. Aliotta, R. Buompane, M. Couder, A. Couture, R. J. deBoer, A. Formicola, L. Gialanella, J. Glorius, G. Imbriani, M. Junker, J. Phys. G: Nucl. Part. Phys. 49, 010501 (2022).
- [2] R. E. Tribble, C. A. Bertulani, M. La Cognata, A. M. Mukhamedzhanov, and C. Spitaleri, Rep. Prog. Phys. 77, 106901 (2014).
- [3] C. R. Brune and B. Davids, Annu. Rev. Nucl. Part. Sci. 65, 87 (2015).
- [4] Faïrouz Hammache and Nicolas de Séréville, Front. Phys. 8, 602920 (2021).
- [5] C. Angulo, M. Arnould, M. Rayet, P. Descouvemont, D. Baye, C. Leclercq-Willain, A. Coc, S. Barhoumi, P. Aguer, C. Rolfs, R. Kunz, J. W. Hammer, A. Mayer, T. Paradellis, S. Kossionides, C. Chronidou, K. Spyrou, S. Degl'Innocenti, G. Fiorentini, B. Ricci, S. Zavatarelli, C. Providencia, H. Wolters, J. Soares, C. Grama, J. Rahighi, A. Shotter, and M. Lamehi Rachti, Nucl. Phys. A 656, 3 (1999).
- [6] C. E. Rolfs and W. S. Rodney, Cauldrons in the Cosmos, University of Chicago Press, Chicago, USA (1988).
- [7] C. Iliadis, Nuclear Physics of Stars, Wiley-VCH, Verlag, Wenheim, Germany (2015).
- [8] T. Rauscher and F. K. Thielemann, At. Data Nucl. Data Tables 75, 1 (2000).
- [9] T. Rauscher, Essentials of Nucleosynthesis and Theoretical Nuclear Astrophysics, IOP Publishing, Bristol, UK (2020).
- [10] J. C. Hardy, J. A. Macdonald, H. Schmeing, H. R. Andrews, J. S. Geiger, R. L. Graham, T. Faestermann, E. T. H. Clifford, and K. P. Jackson, Phys. Rev. Lett. 37, 133 (1976).
- [11] J. José, Stellar Explosions: Hydrodynamics and Nucleosynthesis, CRC Press, Boca Raton, USA (2016).
- [12] H. Schatz and K. E. Rehm, Nucl. Phys. A 777, 601 (2006).
- [13] A. Parikh, J. José, G. Sala, and C. Iliadis, Prog. Part. Nucl. Phys. 69, 225 (2013).
- [14] L. van Wormer, J. Görres, C. Iliadis, M. Wiescher, and F.-K. Thielemann, Astrophys. J. 432, 326 (1994).
- [15] Richard H. Cyburt, A. Matthew Amthor, Ryan Ferguson, Zach Meisel, Karl Smith, Scott Warren, Alexander Heger, R. D. Hoffman, Thomas Rauscher, Alexander Sakharuk, Hendrik Schatz, F. K. Thielemann, Michael Wiescher, Astrophys. J. Suppl. Ser. 189, 240 (2010).
- [16] T. Rauscher and F. K. Thielemann, At. Data Nucl. Data Tables 79, 47 (2001).
- [17] A. Parikh, J. José, F. Moreno, and C. Iliadis, Astrophys. J. Suppl. Ser. 178, 110 (2008).
- [18] R. H. Cyburt, A. M. Amthor, A. Heger, E. Johnson, L. Keek, Z. Meisel, H. Schatz, and K. Smith, Astrophys. J. 830, 55 (2016).
- [19] Zach Meisel, Grant Merz, and Sophia Medvid, Astrophys. J. 872, 84 (2019).
- [20] C. Fröhlich, G. Martínez-Pinedo, M. Liebendörfer, F.-K. Thielemann, E. Bravo, W. R. Hix, K. Langanke, and N. T. Zinner, Phys. Rev. Lett. 96, 142502 (2006).
- [21] A. Arcones, C. Fröhlich, and G. Martínez-Pinedo, Astrophys. J. 750, 18 (2012).
- [22] Kirby Hermansen, Sean M. Couch, Luke F. Roberts, Hendrik Schatz, MacKenzie L. Warren, Astrophys. J. 901, 77 (2020).
- [23] J. S. Randhawa, R. Kanungo, J. Refsgaard, P. Mohr, T. Ahn, M. Alcorta, C. Andreoiu, S. S. Bhattacharjee, B. Davids, G. Christian, A. A. Chen, R. Coleman, P. E. Garrett, G. F. Grinyer, E. Gyabeng Fuakye, G. Hackman, J. Hollett, R. Jain, K. Kapoor, R. Krücken, A. Laffoley, A. Lennarz, J. Liang, Z. Meisel, B. Nikhil, A. Psaltis, A. Radich, M. Rocchini, N. Saei, M. Saxena, M. Singh, C. Svensson, P. Subramaniam, A. Talebitaher, S. Upadhyayula, C. Waterfield, J. Williams, and M. Williams, Phys. Rev. C 104, L042801 (2021).
- [24] D. Soltesz, M. A. A. Mamun, A. V. Voinov, Z. Meisel, B. A. Brown, C. R. Brune, S. M. Grimes, H. Hadizadeh, M. Hornish, T. N. Massey, J. E. O'Donnell, and W. E. Ormand, Phys. Rev. C 103, 015802 (2021).
- [25] Chanhee Kim, Kyungyuk Chae, Soomi Cha, Kyujin Kwak, Gwangeon Seong, and Michael Smith, Astrophys. J. 929, 96 (2022).
- [26] Konrad Schmidt, NSCL Experiment 18039.
- [27] Melina Avila, FRIB Experiment 21026.
- [28] C. Lederer, M. Aliotta, T. Davinson, D. Doherty, A. Estrade, C. Griffin, T. Kemp, M. Kowalska, S.J. Lonsdale, V. Margerin, A. Murphy, C. Weiß, F. Wenander, P.J. Woods, and L. Zhang, CERN-INTC-2015-036.
- [29] Gavin Lotay, FRIB Experiment 21014.
- [30] Takumi Okamura, Graduation Thesis, Osaka University, Osaka, Japan, 2024.
- [31] Tatsuya Furuno, private communication.
- [32] Zach Meisel, NSCL Experiment 17009.
- [33] Chris Wrede, FRIB Experiment 23035.
- [34] T. Rauscher, Phys. Rev. C 81, 045807 (2010).
- [35] M. Wang, W. J. Huang, F. G. Kondev, G. Audi, S. Naimi, Chin. Phys. C 45, 030003 (2021).
- [36] S. E. A. Orrigo, B. Rubio, W. Gelletly, P. Aguilera, A. Algora, A. I. Morales, J. Agramunt, D. S. Ahn, P. Ascher, B. Blank, C. Borcea, A. Boso, R. B. Cakirli, J. Chiba, G. de Angelis, G. de France, F. Diel, P. Doornenbal, Y. Fujita, N. Fukuda, E. Ganioğlu, M. Gerbaux, J. Giovinazzo, S. Go, T. Goigoux, S. Grévy, V. Guadilla, N. Inabe, G. G. Kiss, T. Kubo, S. Kubono, T. Kurtukian-Nieto, D. Lubos, C. Magron, F. Molina, A. Montaner-Pizá, D. Napoli, D. Nishimura, S. Nishimura, H. Oikawa, V. H. Phong, H. Sakurai, Y. Shimizu, C. Sidong, P.-A. Söderström, T. Sumikama, H. Suzuki, H. Takeda, Y. Takei, M. Tanaka, J. Wu, and S. Yagi, Phys. Rev. C 103, 014324 (2021).
- [37] S. F. Paul, J. Bergmann, J. D. Cardona, K. A. Dietrich, E. Dunling, Z. Hockenbery, C. Hornung, C. Izzo, A. Jacobs, A. Javaji, B. Kootte, Y. Lan, E. Leistenschneider, E. M. Lykiardopoulou, I. Mukul, T. Murböck, W. S. Porter, R. Silwal, M. B. Smith, J. Ringuette, T. Brunner, T. Dickel, I. Dillmann, G. Gwinner, M. MacCormick, M. P. Reiter, H. Schatz, N. A. Smirnova, J. Dilling, and A. A. Kwiatkowski, Phys. Rev. C 104, 065803 (2021).
- [38] Huo Junde, Huo Su, Yang Dong, Nucl. Data Sheets 112, 1513 (2011).
- [39] M. Shamsuzzoha Basunia, Nucl. Data Sheets 151, 1 (2018).
- [40] E. Browne and J. K. Tuli, Nucl. Data Sheets 114, 1849 (2013).
- [41] C. Mazzocchi, Z. Janas, J. Döring, M. Axiotis, L. Batist, R. Borcea, D. Cano-Ott, E. Caurier, G. de Angelis, E. Farnea, A. Faßbender, A. Gadea, H. Grawe, A. Jungclaus, M. Kapica, R. Kirchner, J. Kurcewicz, S.M. Lenzi, T. Martínez, I. Mukha, E. Nácher, D. R. Napoli, E. Roeckl, B. Rubio, R. Schwengner, J. L. Tain, and C. A. Ur, Eur. Phys. J. A 12, 269 (2001).
- [42] M. J. López Jiménez, B. Blank, M. Chartier, S. Czajkowski, P. Dessagne, G. de France, J. Giovinazzo, D. Karamanis, M. Lewitowicz, V. Maslov, C. Miehé, P. H. Regan, M. Stanoiu, and M. Wiescher, Phys. Rev. C 66, 025803 (2002).
- [43] L. Kucuk, S. E. A. Orrigo, A. Montaner-Pizá, B. Rubio, Y. Fujita, W. Gelletly, B. Blank, Y. Oktem, T. Adachi, A. Algora, P. Ascher, R. B. Cakirli, G. de France, H. Fujita, E. Ganioğlu, J. Giovinazzo, S. Grévy, F. M. Marqués, F. Molina, F. de Oliveira Santos, L. Perrot, R. Raabe, P. C. Srivastava, G. Susoy, A. Tamii, J. C Thomas, Eur. Phys. J. A 53, 134 (2017).
- [44] Thomas Goigoux, Ph.D. Thesis, Université de Bordeaux, Gradignan, France, 2017.
- [45] J. Giovinazzo, T. Goigoux, B. Blank, P. Ascher, M. Gerbaux, S. Grévy, T. Kurtukian-Nieto, C. Magron, P. Doornenbal, N. Fukuda, N. Inabe, G.G. Kiss, T. Kubo, S. Kubono, S. Nishimura, H. Sakurai, Y. Shimizu, C. Sidong, P.-A. Söderström, T. Sumikama, H. Suzuki, H. Takeda, P. Vi, J. Wu, D.S. Ahn, J. Agramunt, A. Algora, V. Guadilla, A. Montaner-Piza, A.I. Morales, S.E.A. Orrigo, B. Rubio, Y. Fujita, M. Tanaka, W. Gelletly, P. Aguilera, F. Molina, F. Diel, D. Lubos, G. de Angelis, D. Napoli, C. Borcea, A. Boso, R.B. Cakirli, E. Ganioglu, J. Chiba, D. Nishimura, H. Oikawa, Y. Takei, S. Yagi, K. Wimmer, G. de France, S. Go, B.A. Brown, Acta Phys. Pol. B 51, 577 (2020).
- [46] J. Chen, ENSDF Analysis and Utility Programs, Gamma to Level Scheme Computation.
- [47] R. Kamermans, H. W. Jongsma, J. van der Spek, and H. Verheul, Phys. Rev. C 10, 620 (1974).
- [48] Carl Svensson, Ph.D. Thesis, McMaster University, Ontario, Canada, 1998.
- [49] T. Budner, M. Friedman, C. Wrede, B. A. Brown, J. José, D. Pérez-Loureiro, L. J. Sun, J. Surbrook, Y. Ayyad, D. Bardayan, K. Chae, A. Chen, K. Chipps, M. Cortesi, B. Glassman, M. R. Hall, M. Janasik, J. Liang, P. O'Malley, E. Pollacco, A. Psaltis, J. Stomps, and T. Wheeler, Phys. Rev. Lett. 128, 182701 (2022).
- [50] L. J. Sun, X. X. Xu, C. J. Lin, J. Lee, S. Q. Hou, C. X. Yuan, Z. H. Li, J. José, J. J. He, J. S. Wang, D. X. Wang, H. Y. Wu, P. F. Liang, Y. Y. Yang, Y. H. Lam, P. Ma, F. F. Duan, Z. H. Gao, Q. Hu, Z. Bai, J. B. Ma, J. G. Wang, F. P. Zhong, C. G. Wu, D. W. Luo, Y. Jiang, Y. Liu, D. S. Hou, R. Li, N. R. Ma, W. H. Ma, G. Z. Shi, G. M. Yu, D. Patel, S. Y. Jin, Y. F. Wang, Y. C. Yu, Q. W. Zhou, P. Wang, L. Y. Hu, X. Wang, H. L. Zang, P. J. Li, Q. Q. Zhao, L. Yang, P. W. Wen, F. Yang, H. M. Jia, G. L. Zhang, M. Pan, X. Y. Wang, H. H. Sun, Z. G. Hu, R. F. Chen, M. L. Liu, W. Q. Yang, Y. M. Zhao, and H. Q. Zhang, Phys. Rev. C 99, 064312 (2019).
- [51] J. Chen, ENSDF Analysis and Utility Programs, Radiation Report.
- [52] S. T. Perkins, D. E. Cullen, M.-H. Chen, J. H. Hubbell, J. Rathkopf, and J. H. Scofield, LLNL Evaluated Atomic Data Library (EADL), Tech. Rep. UCRL-50400 30 (1991).
- [53] W. Bambynek, B. Crasemann, R. W. Fink, H. U. Freund, H. Mark, C. D. Swift, R. E. Price, and P. Venugopala Rao, Rev. Mod. Phys. 44, 716 (1972).
- [54] J. H. Scofield, Chap. 6 Radiative Transitions in Atomic Inner-Shell Processes, B. Crasemann ed., Academic Press: New York, USA, 1975).
- [55] Karol Kozioł, Phys. Rev. A 89, 022515 (2014).
- [56] J. L. Campbell and T. Papp, At. Data Nucl. Data Tables 77, 1 (2001).
- [57] P. J. Nolan and J. F. Sharpey-Schafer, Rep. Prog. Phys. 42, 1 (1979).
- [58] I. Massa and G. Vannini, Riv. Nuovo Cim. 5, 1 (1982).
- [59] E. Browne, J.K. Tuli, Nucl. Data Sheets 111, 2425 (2010).
- [60] J. Giovinazzo, Ph. Dessagne, and Ch. Miehé, Nucl. Phys. A 674, 394 (2000).
- [61] J.C. Hardy, J.A. MacDonald, H. Schmeing, T. Faestermann, H.R. Andrews, J.S. Geiger, R.L. Graham, K.P. Jackson, Phys. Lett. B 63, 27 (1976).
- [62] K. Vierinen, Nucl. Phys. A 463, 605 (1987).
- [63] J.C. Hardy, T. Faestermann, H. Schmeing, J.A. Macdonald, H.R. Andrews, J.S. Geiger, R.L. Graham, and K.P. Jackson, Nucl. Phys. A 371, 349 (1981).
- [64] C.D. Nesaraja, Nucl. Data Sheets 115, 1 (2014).
- [65] J. A. Macdonald, J. C. Hardy, H. Schmeing, T. Faestermann, H. R. Andrews, J. S. Geiger, R. L. Graham, and K. P. Jackson, Nucl. Phys. A 288, 1 (1977).
- [66] Ph. Dessagne, Ch. Miehé, P. Baumann, A. Huck, G. Klotz, M. Ramdane, G. Walter, and J. M. Maison, Phys. Rev. C 37, 2687 (1988).
- [67] B. Singh and J. Chen, Nucl. Data Sheets 158, 1 (2019).
- [68] P. Hornshøj, K.Wilsky, P.G.Hansen, and B.Jonson, Nucl. Phys. A 187, 637 (1972).
- [69] Ch. Miehé, Ph. Dessagne, Ch. Pujol, G. Walter, B. Jonson, and M. Lindroos, Eur. Phys. J. A 5, 143 (1999).
- [70] P. Asboe-Hansen, E. Hagberg, P. G. Hansen, J. C. Hardy, P. Hornshøj, B. Jonson, S. Mattsson, P. Tidemand-Petersson, Phys. Lett. B 77, 363 (1978).
- [71] P. Asboe-Hansen, E. Hagberg, P. G. Hansen, J. C. Hardy, B. Jonson, and S. Mattsson, Nucl. Phys. A 361, 23 (1981).
- [72] B. Singh and N. Nica, Nucl. Data Sheets 113, 1115 (2012).
- [73] Jean Blachot, Nucl. Data Sheets 111, 1471 (2010).
- [74] Z. Janas, L. Batist, R. Borcea, J. Döring, M. Gierlik, M. Karny, R. Kirchner, M. La Commara, S. Mandal, C. Mazzocchi, F. Moroz, S. Orlov, A. Płochocki, E. Roeckl, and J. Żylicz, Eur. Phys. J. A 24, 205 (2005).
- [75] Jean Blachot, Nucl. Data Sheets 95, 679 (2002).
- [76] Z. Janas, L. Batist, J. Döring, M. Gierlik, R. Kirchner, J. Kurcewicz, H. Mahmud, C. Mazzocchi, A. Płochocki, E. Roeckl, K. Schmidt, P. J. Woods, and J. Żylicz, Eur. Phys. J. A 23, 401 (2005).
- [77] Balraj Singh and Jun Chen, Nucl. Data Sheets 178, 41 (2021).
- [78] X. Zhou, M. Wang, Y. H. Zhang, Yu. A. Litvinov, Z. Meisel, K. Blaum, X. H. Zhou, S. Q. Hou, K. A. Li, H. S. Xu, R. J. Chen, H. Y. Deng, C. Y. Fu, W. W. Ge, J. J. He, W. J. Huang, H. Y. Jiao, H. F. Li, J. G. Li, T. Liao, A. Litvinov, M. L. Liu, Y. F. Niu, P. Shuai, J. Y. Shi, Y. N. Song, M. Z. Sun, Q. Wang, Y. M. Xing, X. Xu, F. R. Xu, X. L. Yan, J. C. Yang, Y. Yu, Q. Yuan, Y. J. Yuan, Q. Zeng, M. Zhang, and S. Zhang, Nat. Phys. 19, 1091 (2023).
- [79] B. Rubio, P. Aguilera, F. Molina, J. Agramunt, A. Algora, V. Guadilla, A. Montaner-Pizá, A. I. Morales, S. E. A. Orrigo, W. Gelletly, B. Blank, P. Asher, M. Gerbaux, J. Giovinazzo, S. Grevy, T. Kurtukian, C. Magron, J. Chiba, D. Nishimura, H. Oikawa, Y. Takei, S. Yang, D. S. Ahn, P. Doornenbal, N. Fukuda, N. Inabe, G. Kiss, T. Kubo, S. Kubono, S. Nishimura, Y. Shimizu, C. Sidong, P.-A. Söderström, T. Sumikama, H. Suzuki, H. Takeda, P. Vi, J. Wu, Y. Fujita, M. Tanaka, F. Diel, D. Lubos, G. de Angelis, D. Napoli, C. Borcea, A. Boso, R. B. Cakirli, E. Ganioglu, G. de France, S. Go, J. Phys.: Conf. Ser. 1308, 012018 (2019).
- [80] S. Röhl, S. Hoppenau, and M. Dost, Phys. Rev. Lett. 43, 1300 (1979).
- [81] S. Röhl, S. Hoppenau, and M. Dost, Nucl. Phys. A 369, 301 (1981).
- [82] J. F. Chemin, S. Andriamonje, J. Roturier, and B. Saboya, Nucl. Phys. A 331, 407 (1979).
- [83] Per Amund Amundsen and Martin Dost, Phys. Rev. C 33, 1079 (1986).
- [84] U. Heinz, Rep. Prog. Phys. 50, 145 (1987).
- [85] A. Gilbert and A. G. W. Cameron, Can. J. Phys. 43, 1446 (1965).
- [86] W. Dilg, W. Schantl, H. Vonach, and M. Uhl, Nucl. Phys. A 217, 269 (1973).
- [87] J. C. Hardy, Phys. Lett. B 109, 242 (1982).
- [88] B. L. Berman and S. C. Fultz, Rev. Mod. Phys. 47, 713 (1975).
- [89] C. H. Johnson, Phys. Rev. C 16, 2238 (1977).
- [90] V. Avrigeanu and M. Avrigeanu, Phys. Rev. C 106, 024615 (2022).
- [91] J. Wei, H. Ao, B. Arend, S. Beher, G. Bollen, N. Bultman, F. Casagrande, W. Chang, Y. Choi, S. Cogan, C. Compton, M. Cortesi, J. Curtin, K. Davidson, X. Du, K. Elliott, B. Ewert, A. Facco, A. Fila, K. Fukushima, V. Ganni, A. Ganshyn, J. Gao, T. Glasmacher, J. Guo, Y. Hao, W. Hartung, N. Hasan, M. Hausmann, K. Holland, H. C. Hseuh, M. Ikegami, D. Jager, S. Jones, N. Joseph, T. Kanemura, S.-H. Kim, P. Knudsen, B. Kortum, E. Kwan, T. Larter, R. E. Laxdal, M. Larmann, K. Laturkar, J. LeTourneau, Z.-Y. Li, S. Lidia, G. Machicoane, C. Magsig, P. Manwiller, F. Marti, T. Maruta, A. McCartney, E. Metzgar, S. Miller, Y. Momozaki, D. Morris, M. Mugerian, I. Nesterenko, C. Nguyen, W. O'Brien, K. Openlander, P. N. Ostroumov, M. Patil, A. S. Plastun, J. Popielarski, L. Popielarski, M. Portillo, J. Priller, X. Rao, M. Reaume, H. Ren, K. Saito, M. Smith, M. Steiner, A. Stolz, O. B. Tarasov, B. Tousignant, R. Walker, X. Wang, J. Wenstrom, G. West, K. Witgen, M. Wright, T. Xu, Y. Xu, Y. Yamazaki, T. Zhang, Q. Zhao, S. Zhao, K. Dixon, M. Wiseman, M. Kelly, K. Hosoyama, and S. Prestemon, Mod. Phys. Lett. A 37, 2230006 (2022).
- [92] M. Portillo, B.M. Sherrill, Y. Choi, M. Cortesi, K. Fukushima, M. Hausmann, E. Kwan, S. Lidia, P.N. Ostroumov, R. Ringle, M.K. Smith, M. Steiner, O.B. Tarasov, A.C.C. Villari, and T. Zhang, Nucl. Instrum. Methods Phys. Res. B 540, 151 (2023).
- [93] C.S. Sumithrarachchi, D.J. Morrissey, S. Schwarz, K. Lund, G. Bollen, R. Ringle, G. Savard, and A.C.C. Villari, Nucl. Instrum. Methods Phys. Res. B 463, 305 (2020).
- [94] K.R. Lund, G. Bollen, D. Lawton, D.J. Morrissey, J. Ottarson, R. Ringle, S. Schwarz, C.S. Sumithrarachchi, A.C.C. Villari, and J. Yurkon, Nucl. Instrum. Methods Phys. Res. B 463, 378 (2020).
- [95] A.C.C. Villari, G. Bollen, A. Henriques, A. Lapierre, S. Nash, R. Ringle, S. Schwarz, C.S. Sumithrarachchi, Nucl. Instrum. Methods Phys. Res. B 541, 350 (2023).
- [96] J. F. Ziegler, M. D.Ziegler, and J. P. Biersack, Nucl. Instrum. Methods Phys. Res. B 268, 1818 (2010).
- [97] MIRION Low Energy Germanium Detector.
- [98] MIRION Extended Range Coaxial Germanium Detector.
- [99] MIRION Cryo-Pulse 5 PLUS Electrically Refrigerated Cryostat.
- [100] D. Willems, R. Arts, B.V.-J. Douwen, MIRION Technical Paper (2015).
- [101] MIRCON MSD12 Circular Silicon Detector.
- [102] MIRCON MSD26 Circular Silicon Detector.
- [103] MIRION Intelligent Preamplifier.
- [104] J. Eberth, H. Hess, P. Reiter, S. Bertoldo, C. Carraro, G. Maggioni, D. R. Napoli, W. Raniero, and D. De Salvador, Eur. Phys. J. A 59, 179 (2023).
- [105] ORTEC 660 Dual 5-kV Bias Supply.
- [106] Mesytec MPR-1 Charge Integrating Preamplifier.
- [107] Mesytec MHV-4 High Voltage Supply.
- [108] Mesytec MNV-4 NIM Power Supply.
- [109] XIA Pixie-16 Digitizer.
- [110] K. Starosta, C. Vaman, D. Miller, P. Voss, D. Bazin, T. Glasmacher, H. Crawford, P. Mantica, H. Tan, W. Hennig, M. Walby, A. Fallu-Labruyere, J. Harris, D. Breus, P. Grudberg, W.K. Warburton, Nucl. Instrum. Methods Phys. Res. A 610, 700 (2009).
- [111] C.J. Prokop, S.N. Liddick, B.L. Abromeit, A.T. Chemey, N.R. Larson, S. Suchyta, J.R. Tompkins, Nucl. Instrum. Methods Phys. Res. A 741, 163 (2014).
- [112] XIA Pixie-16 Digitizer User Manual.
- [113] H.Y. Wu, Z.H. Li, H. Tan, H. Hua, J. Li, W. Hennig, W.K. Warburton, D.W. Luo, X. Wang, X.Q. Li, S.Q. Zhang, C. Xu, Z.Q. Chen, C.G. Wu, Y. Jin, J. Lin, D.X. Jiang, Y.L. Ye, Nucl. Instrum. Methods Phys. Res. A 975, 164200 (2020).
- [114] D. Weisshaar, D. Bazin, P.C. Bender, C.M. Campbell, F. Recchia, V. Bader, T. Baugher, J. Belarge, M.P. Carpenter, H.L. Crawford, M. Cromaz, B. Elman, P. Fallon, A. Forney, A. Gade, J. Harker, N. Kobayashi, C. Langer, T. Lauritsen, I.Y. Lee, A. Lemasson, B. Longfellow, E. Lunderberg, A.O. Macchiavelli, K. Miki, S. Momiyama, S. Noji, D.C. Radford, M. Scott, J. Sethi, S.R. Stroberg, C. Sullivan, R. Titus, A. Wiens, S. Williams, K. Wimmer, S. Zhu, Nucl. Instrum. Methods Phys. Res. A 847, 187 (2017).
- [115] BNC Model DB-2 NIM Random Pulse Generator.
- [116] Y. Isozumi, Nucl. Instrum. Methods Phys. Res. A 280, 151 (1989).
- [117] M. S. Freedman, Annu. Rev. Nucl. Part. Sci. 24, 209 (1974).
- [118] B. Crasemann, Atomic Inner-Shell Processes, Academic Press, New York, USA (1975).
- [119] Juhani Kantele, Handbook of Nuclear Spectrometry, Academic Press, London (1995).
- [120] L. J. Sun, M. Friedman, T. Budner, D. Pérez-Loureiro, E. Pollacco, C. Wrede, B. A. Brown, M. Cortesi, C. Fry, B. E. Glassman, J. Heideman, M. Janasik, A. Kruskie, A. Magilligan, M. Roosa, J. Stomps, J. Surbrook, and P. Tiwari, Phys. Rev. C 103, 014322 (2021).
- [121] Matt Newville, easyXAFS, Matteo Levantino, Christian Schlepuetz, Damian Günzing, Max Rakitin, Sang-Woo Kim, and kalvdans, xraypy/XrayDB: (4.5.1). Zenodo (2023).
- [122] M. Basunia, Nucl. Data Sheets 107, 2323 (2006).
- [123] M.-M. Bé, V. Chisté, C. Dulieu, X. Mougeot, E. Browne, V. Chechev, N. Kuzmenko, F. Kondev, A. Luca, M. Galán, A.L. Nichols, A. Arinc, and X. Huang, Mono. BIPM-5 - Table of Radionuclides, Vol.2 (2004).
- [124] Devinder Mehta, M.L. Garg, Jasbir Singh, Nirmal Singh, T.S. Cheema, P.N. Trehan, Nucl. Instrum. Methods Phys. Res. A 245, 447 (1986).
- [125] M.-M. Bé, V. Chisté, C. Dulieu, X. Mougeot, E. Browne, V. Chechev, N. Kuzmenko, F. Kondev, A. Luca, M. Galán, A.L. Nichols, A. Arinc, and X. Huang, Mono. BIPM-5 - Table of Radionuclides, Vol.5 (2010).
- [126] S. Agostinelli, J. Allison, K. Amako, J. Apostolakis, H. Araujo, P. Arce, M. Asai, D. Axen, S. Banerjee, G. Barrand, F. Behner, L. Bellagamba, J. Boudreau, L. Broglia, A. Brunengo, H. Burkhardt, S. Chauvie, J. Chuma, R. Chytracek, G. Cooperman, G. Cosmo, P. Degtyarenko, A. Dell'Acqua, G. Depaola, D. Dietrich, R. Enami, A. Feliciello, C. Ferguson, H. Fesefeldt, G. Folger, F. Foppiano, A. Forti, S. Garelli, S. Giani, R. Giannitrapani, D. Gibin, J. J. Gómez Cadenas, I. González, G. Gracia Abril, G. Greeniaus, W. Greiner, V. Grichine, A. Grossheim, S. Guatelli, P. Gumplinger, R. Hamatsu, K. Hashimoto, H. Hasui, A. Heikkinen, A. Howard, V. Ivanchenko, A. Johnson, F. W. Jones, J. Kallenbach, N. Kanaya, M. Kawabata, Y. Kawabata, M. Kawaguti, S. Kelner, P. Kent, A. Kimura, T. Kodama, R. Kokoulin, M. Kossov, H. Kurashige, E. Lamanna, T. Lampén, V. Lara, V. Lefebure, F. Lei, M. Liendl, W. Lockman, F. Longo, S. Magni, M. Maire, E. Medernach, K. Minamimoto, P. Mora de Freitas, Y. Morita, K. Murakami, M. Nagamatu, R. Nartallo, P. Nieminen, T. Nishimura, K. Ohtsubo, M. Okamura, S. O'Neale, Y. Oohata, K. Paech, J. Perl, A. Pfeiffer, M. G. Pia, F. Ranjard, A. Rybin, S. Sadilov, E. Di Salvo, G. Santin, T. Sasaki, N. Savvas, Y. Sawada, S. Scherer, S. Sei, V. Sirotenko, D. Smith, N. Starkov, H. Stoecker, J. Sulkimo, M. Takahata, S. Tanaka, E. Tcherniaev, E. Safai Tehrani, M. Tropeano, P. Truscott, H. Uno, L. Urban, P. Urban, M. Verderi, A. Walkden, W. Wander, H. Weber, J. P. Wellisch, T. Wenaus, D. C. Williams, D. Wright, T. Yamada, H. Yoshida, and D. Zschiesche, Nucl. Instrum. Methods Phys. Res. A 506, 250 (2003).
- [127] J. Allison, K. Amako, J. Apostolakis, P. Arce, M. Asai, T. Aso, E. Bagli, A. Bagulya, S. Banerjee, G. Barrand, B.R. Beck, A.G. Bogdanov, D. Brandt, J.M.C. Brown, H. Burkhardt, Ph. Canal, D. Cano-Ott, S. Chauvie, K. Cho, G.A.P. Cirrone, G. Cooperman, M.A. Cortés-Giraldo, G. Cosmo, G. Cuttone, G. Depaola, L. Desorgher, X. Dong, A. Dotti, V.D. Elvira, G. Folger, Z. Francis, A. Galoyan, L. Garnier, M. Gayer, K.L. Genser, V.M. Grichine, S. Guatelli, P. Guèye, P. Gumplinger, A.S. Howard, I. Hřivnáčová, S. Hwang, S. Incerti, A. Ivanchenko, V.N. Ivanchenko, F.W. Jones, S.Y. Jun, P. Kaitaniemi, N. Karakatsanis, M. Karamitros, M. Kelsey, A. Kimura, T. Koi, H. Kurashige, A. Lechner, S.B. Lee, F. Longo, M. Maire, D. Mancusi, A. Mantero, E. Mendoza, B. Morgan, K. Murakami, T. Nikitina, L. Pandola, P. Paprocki, J. Perl, I. Petrović, M.G. Pia, W. Pokorski, J.M. Quesada, M. Raine, M.A. Reis, A. Ribon, A. Ristić Fira, F. Romano, G. Russo, G. Santin, T. Sasaki, D. Sawkey, J.I. Shin, I.I. Strakovsky, A. Taborda, S. Tanaka, B. Tomé, T. Toshito, H.N. Tran, P.R. Truscott, L. Urban, V. Uzhinsky, J.M. Verbeke, M. Verderi, B.L. Wendt, H. Wenzel, D.H. Wright, D.M. Wright, T. Yamashita, J. Yarba, H. Yoshida, Nucl. Instrum. Methods Phys. Res. A 835, 186 (2016).
- [128] Glenn F. Knoll, Radiation Detection and Measurement, John Wiley & Sons (2010).
- [129] M. J. Martin, Nucl. Data Sheets 114, 1497 (2013).
- [130] B. E. Glassman, D. Pérez-Loureiro, C. Wrede, J. Allen, D. W. Bardayan, M. B. Bennett, K. A. Chipps, M. Febbraro, M. Friedman, C. Fry, M. R. Hall, O. Hall, S. N. Liddick, P. O'Malley, W. -J. Ong, S. D. Pain, S. B. Schwartz, P. Shidling, H. Sims, L. J. Sun, P. Thompson, and H. Zhang, Phys. Rev. C 99, 065801 (2019).
- [131] Gordon R. Gilmore, Practical Gamma-ray Spectroscopy, John Wiley & Sons (2008).
- [132] T. Palazzo, A. J. Mitchell, G. J. Lane, A. E. Stuchbery, B. A. Brown, M. W. Reed, A. Akber, B. J. Coombes, J. T. H. Dowie, T. K. Eriksen, M. S. M. Gerathy, T. Kibédi, T. Tornyi, and M. O. de Vries, Phys. Rev. Lett. 130, 122503 (2023).
- [133] Erik Jensen, Ph.D. Thesis, Aarhus University, Aarhus, Denmark, 2024.
- [134] Justus Eder, Master Thesis, Aarhus University, Aarhus, Denmark, 2024.
- [135] R. Mahajan, T. Wheeler, E. Pollacco, C. Wrede, A. Adams, H. Alvarez-Pol, A. Andalib, A. Anthony, Y. Ayyad, D. Bazin, T. Budner, M. Cortesi, J. Dopfer, M. Friedman, B. Jain, A. Jaros, D. Pérez-Loureiro, B. Mehl, R. De Oliveira, S. Ravishankar, L. J. Sun, and J. Surbrook, Phys. Rev. C 110, 035807 (2024).
- [136] FRIB Decay Station White Paper.
- [137] Y.A. Akovali, Nucl. Data Sheets 84, 1 (1998).
- [138] Mono. BIPM-5 - Table of Radionuclides, Vol.9 (to be published).
- [139] Canberra Model 1407P Pulse Pair Generator.
- [140] Marcell P. Takács, Karsten Kossert, Appl. Radiat. Isot. 176, 109858 (2021).
- [141] Chavdar Dutsov, Benoît Sabot, Philippe Cassette, Krasimir Mitev, Appl. Radiat. Isot. 176, 109845 (2021).
- [142] M. Honma, T. Otsuka, B. A. Brown, and T. Mizusaki, Phys. Rev. C 69, 034335 (2004).
- [143] B. A. Brown and W. D. M. Rae, Nucl. Data Sheets 120, 115 (2014).
- [144] T. Rauscher, Int. J. Mod. Phys. E 20, 1071 (2011).
- [145] T. Rauscher, code SMARAGD, version v0.10.2 (2014).
- [146] A. Adams, C. Wrede, B. A. Brown, R. Longland, L. J. Sun, J. Dopfer, C. Marshall et al., in preparation.
- [147] R. Longland, C. Iliadis, A. E. Champagne, J. R. Newton, C. Ugalde, A. Coc, and R. Fitzgerald, Nucl. Phys. A 841, 1 (2010).
- [148] C. Iliadis, R. Longland, A. E. Champagne, A. Coc, and R. Fitzgerald, Nucl. Phys. A 841, 31 (2010).
- [149] C. Iliadis, R. Longland, A. E. Champagne, and A. Coc, Nucl. Phys. A 841, 251 (2010).
- [150] P. Mohr, R. Longland, and C. Iliadis, Phys. Rev. C 90, 065806 (2014).
- [151] C. Iliadis, R. Longland, A. Coc, F. X. Timmes, and A. E. Champagne, J. Phys. G: Nucl. Part. Phys. 42, 034007 (2015).
- [152] K. Hämäläinen, S. Manninen, P. Suortti, S. P. Collins, M. J. Cooper, and D. Laundy, J. Phys.: Condens. Matter 1, 5955 (1989).
- [153] Ning Lu, Yi Hua Lam, Alexander Heger, Zi Xin Liu, and Hidetoshi Yamaguchi, arXiv:2406.14624.