The Value-added Catalog of OB Stars in LAMOST DR7
Abstract
In this work, we update the catalog of OB stars based on the Large Sky Area Multi-Object Fiber Spectroscopic Telescope (LAMOST) data release 7 and modified the OB stars selection criterion in spectral line indices’ space. The new catalog includes 37,778 spectra of 27,643 OB stars, of which 3827 OB stars are newly identified. The spectral subclasses of 27,643 OB stars are obtained using the automatic classification code MKCLASS. We find that the modified OB star selection criteria can better improve the completeness of late B-type stars by analyzing their spectral classification results given by MKCLASS. We also identify 3006 Be-type stars or candidates by examining the Balmer lines in their spectra and find that the frequency of our Be-type stars (10.9%) is consistent with previous results. The spatial distribution of OB stars indicates that they are mainly located in the Galactic disk. This new catalog of OB stars will provide valuable data for studying the structure and evolution of the Milky Way.
1 Introduction
Massive stars have a significant impact on the chemical composition and evolution of host galaxies via their powerful winds, radiation fields, and supernova explosions (Heger et al., 2003; Evans et al., 2005, 2011; Gray & Corbally, 2009). OB stars, which refer to any type of O and B stars in this work, are young stars with high effective temperatures and luminosities(Morgan & Keenan, 1973; Xiang et al., 2022, hereafter Xiang2022). These characteristics make them suitable tracers for exploring the spiral arm structure, star-forming region, chemical evolution, and present-day cosmic abundances in the Milky Way (Morgan et al., 1953; Nieva & Przybilla, 2012; Xu et al., 2021).
In the last few decades, a series of large-scale survey projects have been implemented and gathered thousands of OB stars. For instance, to study the effects of mass loss, metallicity, rotation, and binary on the evolution of massive stars, the Very Large Telescope (VLT)-Fibre Large Array Multi-Element Spectrograph (FLAMES) survey has obtained the high-resolution spectra of over 700 massive OB stars111Here, massive OB stars refer to O and early B-type stars (formally B2 or earlier for dwarfs, B5 or earlier for giants, and all B subtypes for supergiants).in the Galaxy and Magellanic Clouds(Evans et al., 2005, 2006), and the multi-epoch optical spectroscopy of over 800 massive stars in the 30 Doradus region of the Large Magellanic Cloud (Evans et al., 2011). Maíz Apellániz et al. (2011) presented spectra of over 1000 Galactic O-type stars with high signal-to-noise ratio and intermediate resolution (R 2500), based on the Galactic O-Star Spectroscopic Survey (GOSSS). Subsequently, Sota et al. (2011, 2014) and Maíz Apellániz et al. (2016) completed their spectral classification and improved the classification criteria for O-type stars. The IACOB spectroscopic database has compiled a homogeneous set of high-quality, high-resolution spectra of Galactic O- and early-B type stars using the high-resolution Fibre-fed Echelle Spectrograph(Simón-Díaz et al., 2011a, b; de Burgos et al., 2023, FIES). Liu et al. (2019, hereafter Paper I) selected about 16,000 OB stars from the LAMOST DR5 low-resolution spectra using the line-indices method.
The large sample of OB stars with spectra data is important for the study of their stellar parameters and chemical composition. The projected rotational velocities ( sin ) of B-type stars in the cluster are systematically larger than those in the field by studying the distribution of sin of a large sample of OB stars (Dufton et al., 2006; Wolff et al., 2008). Simón-Díaz & Herrero (2014) further confirmed that macroturbulent broadening is common in the domain of massive stars by studying the distribution of sin of about 200 Galactic O- and early B-type stars. The study of the chemical composition of about 285 early B-type stars in the Galaxy and Magellanic Clouds indicates that nitrogen abundances can be used as a suitable indicator to investigate the rotational mixing of massive stars (Hunter et al., 2009). Recently, de Burgos et al. (2024) has completed the large-scale quantitative spectroscopic analysis of 527 Galactic supergiants with spectral types from O9 to B5, and found that the relative numbers of stars and the numbers of rapid rotating stars decreased significantly when the stellar effective temperature was below 21000 K.
Furthermore, the large sample of OB stars can also be used to study the structures of the Galactic disk and the distribution of Galactic spiral arms. Carraro et al. (2015) indicated that the flare of the Galactic thin disk can also be revealed using their OB star samples. Subsequently, Li et al. (2019) used 250,000 OB stars from the Gaia Data Release2 (Gaia DR2) (Gaia Collaboration et al., 2016) and the Two Micron All-Sky Survey (2MASS) (Skrutskie et al., 2006) photometric catalogs to obtain the scale length of the Galactic disk, and found that the disk scale height increases with Galactic radius. Using the LAMOST DR5 13,534 OB stars with Galactocentric distance ranging from 8 to 14 kpc, Yu et al. (2021) found that the flaring structure is symmetrical about the Galactic plane. Chen et al. (2019) found that the Galactic spiral structure shows flocculent patterns, based on 14,880 O and early B-type stars and the kinematics parameters in the Gaia DR2. Xu et al. (2021) further investigated the local spiral structure using the Gaia EDR3 9750 O-B2 stars with parallax accuracy better than 10%, and their results revealed a clear sketch of nearby spiral arms in the Galaxy, especially in the third and fourth quadrants that absent the maser parallax data.
| Name | Index Bandpass | Pseudocontinua |
|---|---|---|
| (Å) | (Å) | |
| Ca II K | 3927.700–3939.700 | 3903.0003923.000 4000.0004020.000 |
| Hγ | 4319.750–4363.500 | 4283.500–4319.750 4367.250–4419.750 |
| Fe4383 | 4370.375–4421.625 | 4360.375–4371.625 4444.125–4456.625 |
| Fe4531 | 4515.500–4560.500 | 4505.500–4515.500 4561.750–4580.500 |
| Fe4668 | 4635.250–4721.500 | 4612.750–4631.500 4744.000–4757.750 |
| Fe5015 | 4977.750–5054.000 | 4946.500–4977.750 5054.000–5065.250 |
| Fe5270 | 5245.650–5285.650 | 5233.150–5248.150 5285.650–5318.150 |
| Fe5335 | 5312.125–5352.125 | 5304.625–5315.875 5353.375–5363.375 |
| Fe5406 | 5387.500–5415.000 | 5376.250–5387.500 5415.000–5425.000 |
| Fe5709 | 5698.375–5722.125 | 5674.625–5698.375 5724.625–5738.375 |
| Fe5782 | 5778.375–5798.375 | 5767.125–5777.125 5799.625–5813.375 |
More OB stars with spectra are crucial for studying massive star evolution, Galactic spiral arms, star-forming regions, etc. In this work, we aim to update the catalog of spectroscopic OB stars based on LAMOST DR7 data. The paper is organized as follows: In Section 2, we describe the LAMSOT DR7 data and the method used to select OB stars. The results and discussion are shown in Section 3. A summary is presented in Section 4.
2 Data and Method
2.1 LAMOST Data
LAMOST is a 4 m, quasi-meridian, reflecting Schmidt telescope, which includes 4000 fibers in a field of view of 20 square degrees in the sky (Cui et al., 2012; Deng et al., 2012; Zhao et al., 2012). LAMOST DR7 has collected more than 10 million low-resolution spectra with a wavelength range from 3690 to 9100 Å, including more than 9 million stellar spectra.
2.2 Line Indices
The line indices in terms of equivalent width (EW) are defined by the following equation (Worthey et al., 1994; Liu et al., 2015):
| (1) |
where Fλ and FC are the fluxes of the spectral line and pseudo-continuum, respectively. FC is estimated via linear interpolation of the fluxes located in the “shoulder” region on either side of the line bandpass. The unit of the line index under this definition is in Å.
As shown in Paper I, the OB stars can be selected based on distributions in the spectral line indices’ space. Therefore, we calculate the EW of Ca II K (3933 Å), Hγ (4340 Å), and Fe line (EWFe). Here, we denote EWFe as the mean value of Fe lines 4383, 4531, 4668, 5015, 5270, 5335, 5406, 5709, and 5782 Å. The definition of the line indices is listed in Table 1.
2.3 Method
In Paper I, we identified 22,901 OB spectra of 16,032 stars in LAMOST DR5 using spectral-line-indices method and final manual inspection, based on the LAMOST DR5 low-resolution spectra with signal-to-noise ratio larger than 15 at band (S/Ng). However, the completeness of the OB spectra is only about 5716 for the stars with spectral types later than B7. Xiang2022 compiled 1,163,410 spectra of 844,790 hot-star candidates in LAMOST DR6 by combing the candidate OBA stars from Zari et al. (2021), OB stars from Paper I, and OBA-type stars classified by LAMOST pipeline. They estimated the stellar parameters of about 330,000 OBA-type stars using the spectral fitting tool PAYNE.
In this work, our goal is to identify the “normal” OB stars in LAMOST DR7222Here, we define the “normal” OB stars that don’t the some low-mass OB stars, such as hot subdwarfs, white dwarfs (WDs), blue horizontal-branch (BHB) stars, post-asymptotic giant branch (post-AGB) stars, etc.. The 330,000 OBA-type stars of Xiang2022 include OB stars, A-type stars, hot subdwarfs, white dwarfs, and so on. In order to better mark the distribution of known OB stars of Xiang2022 in the spectral index space, we use the following steps to select OB stars from the 330,000 known OBA-type stars
-
(i)
Removing the 22,901 OB spectra in Paper I.
-
(ii)
To facilitate manual inspection, we select the stars with spectral (S/N)g 15.
-
(iii)
Taking account of the uncertainties of the effective temperature and the effective-temperature range of OB stars, we select the stars with 9000 K. The stellar is from Xiang2022.
After following the above steps, we identify 96,223 OB star spectra. We inspect the above spectra and identify 10,123 “normal” OB star spectra corresponding to 8085 OB stars. We also inspect 22901 OB spectra from Paper I and obtain 21,669 “normal” OB star spectra corresponding to 16,138 OB stars. In addition, some stars have been observed multiple times and contribute several spectra. Considering the difference in EW given by different S/N spectra of the same star, we don’t remove multiple spectra of the same stars for both the 10,123 and 21,669 OB spectra samples.
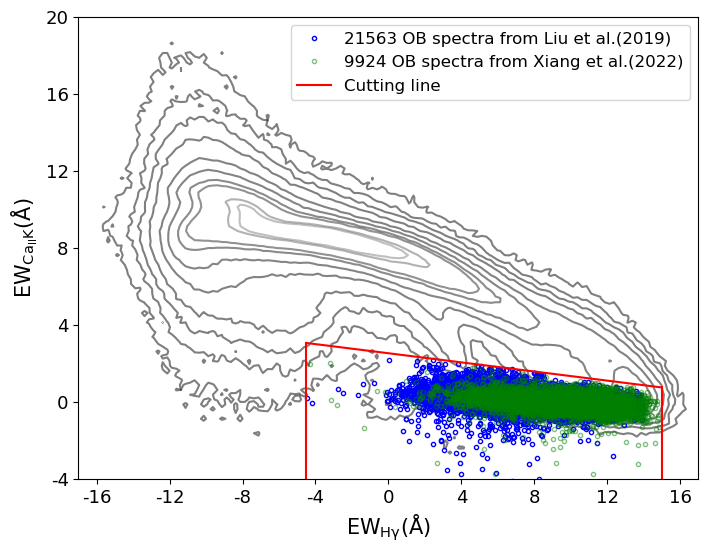
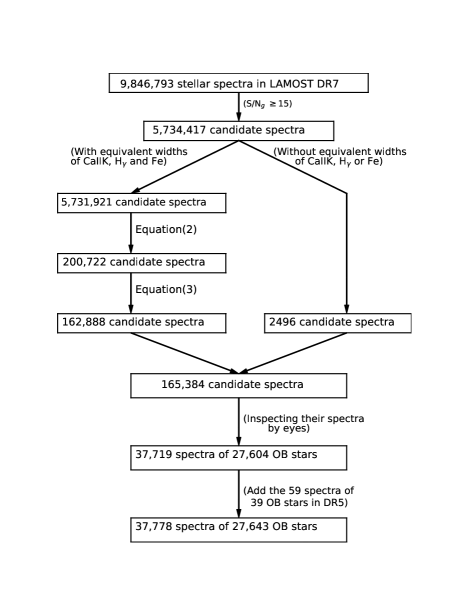
In Figure 1, we map the 9924 of 10,123 OB spectra in Xiang2022, the 21,563 of 21,669 OB spectra in Paper I333The 199 of 10,123 OB spectra don’t have the Ca II K, Hγ or Fe measurements due to the bad fluxes in the relevant wavelength regions, and the 106 of 21,669 OB spectra don’t have the Ca II K, Hγ or Fe measurements due to the bad fluxes in the relevant wavelength regions., and the 5,731,921 spectra with SNg 15 from LAMOST DR7 in the EWHγ vs. EWCaK plane, and find that our previous method of selecting OB stars in spectral line indices’ space underestimates the equivalent width of Hγ. Therefore, we adopt the following empirical criteria to identify more OB stars in LAMOST DR7.
| (2) | |||
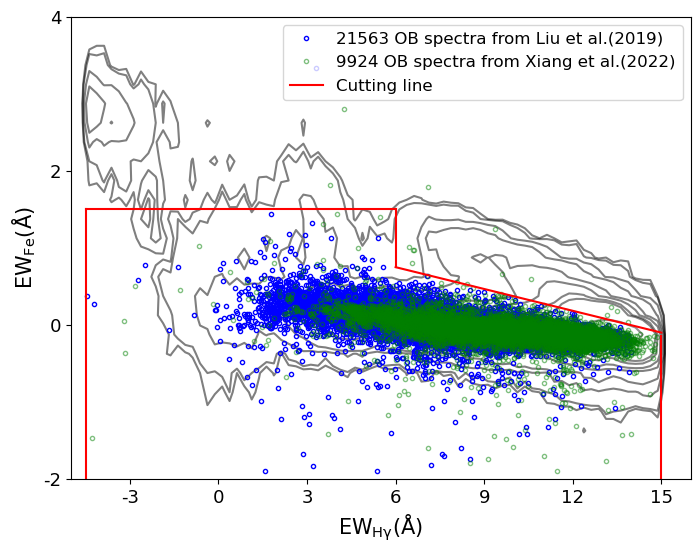
The 200,722 OB star candidates have been selected using the criteria described in the empirical equation 2. As described in Paper I, the distribution of OB stars in the Fe versus Hγ plane can be utilized to remove most of the late-type stars. In Figure 2, we present the distribution of the 9924 OB star spectra from Xiang2022, 21,563 OB star spectra from Paper I, and 200,722 spectra of OB star candidates in the EWHγ vs. EWFe plane, and it is seen that most of the OB stars in Xiang2022 are located in the region with larger EWHγ. We adopt the following empirical criteria in the EWHγ vs. EWFe plane, so that most of the OB star candidates are included.
| (3) | |||
After applying the criteria 3, the number of OB star spectra is reduced to 162,888. Additionally, there are 2496 spectra without Ca II K, Hγ or Fe measurements because these spectra have bad fluxes in the relevant wavelength regions. We inspect the spectra of 165,384 (16,2882496) OB candidates and identify 37,719 OB spectra.
In addition, we also find that 59 OB spectra don’t be included in our OB stars samples by cross-matching 37,719 OB spectra in LAMOST DR7 and 21,669 OB spectra from Paper I. This is because the LAMOST DR7 survey data does not fully include the DR5 survey data. Finally, the final sample of OB stars contains 37,778 (37,719 in DR7 +59 in DR5) spectra of 27,643 OB stars. The steps of identifying OB stars are summarized in Figure 3.
By cross-matching the above 27,643 OB stars with 16,138 “normal” OB stars from Paper I and 8085 “normal” OB stars selected from Xiang2022444Here, we don’t remove the common stars between 16,138 OB stars from Paper I and 8085 OB stars selected from Xiang2022., Our 27,643 OB stars are described below:
(i) There are 16,138 common OB stars with Paper I.
(ii) There are 7678 common OB stars selected from Xiang2022.
(iii) 3827 OB stars are newly identified.
3 Results and Discussion
3.1 spectral classification
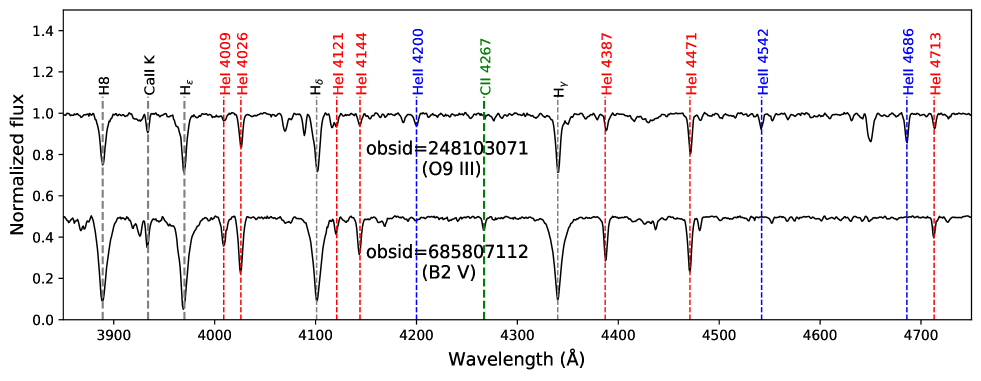
Stellar classification plays an important role in studying the stellar parameters (Walborn & Fitzpatrick, 1990; Gray & Corbally, 2009; Sota et al., 2011). For example, the effective temperature and surface gravity of a star can be initially estimated from its spectral type and luminosity type, respectively. The main character of OB stars is the presence of absorption lines of He II (O-type stars) and He I (B-type stars) at their blueviolet spectra.
In Figure 4, we show the blue spectra of one O9 III O-type and one B2 V B-type star in LAMOST DR7. Based on the spectral characters of OB stars and LAMOST low-resolution spectra, we check the 37,778 spectra of 27,643 OB stars and classify them as 279 spectra of 228 O-type stars and 37,499 spectra of 27,415 B-type stars. In addition, the 3827 newly identified OB stars include 27 O-type stars and 3800 B-type stars. The results are listed in Table 2.
3.1.1 Sub-classification of OB stars with MKCLASS
The MKCLASS code, developed by Gray & Corbally (2014), is designed to classify blueviolet spectra in the MK spectral classification system by comparing the spectra of the program stars and MK standard stars (Morgan et al., 1943). MKCLASS can provide spectral types for stars and assess its performance of classification using ’excellent’, ’verygood’, ’good’, ’fair’, and ’poor’, based on the between the program one and the best-matched one of the standard star. There are two standard libraries in MKCLASS: (i) : the library includes MK standard star spectra with rectified blueviolet (38005600 Å) spectra of a resolving power R 1100, obtained with the Dark Sky Observatory. (ii) : the library is constructed based on flux-calibrated spectra covering 38004600 Å with a resolving power R2200.

Because the resolution of the LAMOST low-resolution spectra is about 1800 corresponding to a full wave at half maximum (FWHM) of 2.8 Å, we reduce the resolution of the library from 1.8 to 2.8 Å and denote the new library as 18. The research results in Paper I indicate that MKCLASS can give a reliable classification for normal stars, based on the 18 library and LAMOST low-resolution spectra. Consequently, we submitted the 37,778 spectra of 27,643 OB stars to MKCLASS and obtained their spectral types. To facilitate the analysis of the MKCLASS results of 27,643 OB stars, the spectral types are obtained by using the highest signal-to-noise ratio spectra for the stars with multiple visits.
3.1.2 MKCLASS Classification Results
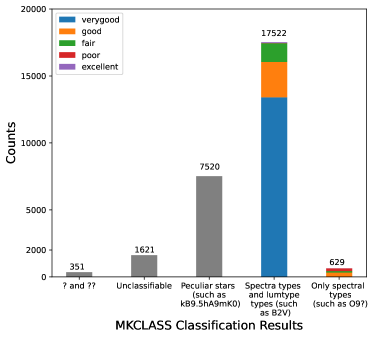
Figure 5 shows the distribution of MKCLASS classification results for 27,643 OB stars. It is seen that only 1972 stars (7.1%) cannot be classified by MKCLASS because their spectra have low S/N or emission lines after checking those spectra, and we also show sample spectra in Figure 6. For 7520 stars (27.2%), MKCLASS cannot give a unique type based on their different characteristic lines, but discrepant classifications instead, such as: ”kB9.5hA8mG2 Eu” which means that the K-line determined spectral type is B9.5, the hydrogen-line determined type is A8, the metallic-line classified type is G2, and this star may show strong Eu lines (see the fourth spectrum in Figure 6). It also implies that LAMOST survey data contains many peculiar early-type stars (Xiang2022). There are 18,151 stars (65.7%) given spectral types by MKCLASS with different performance of classification.
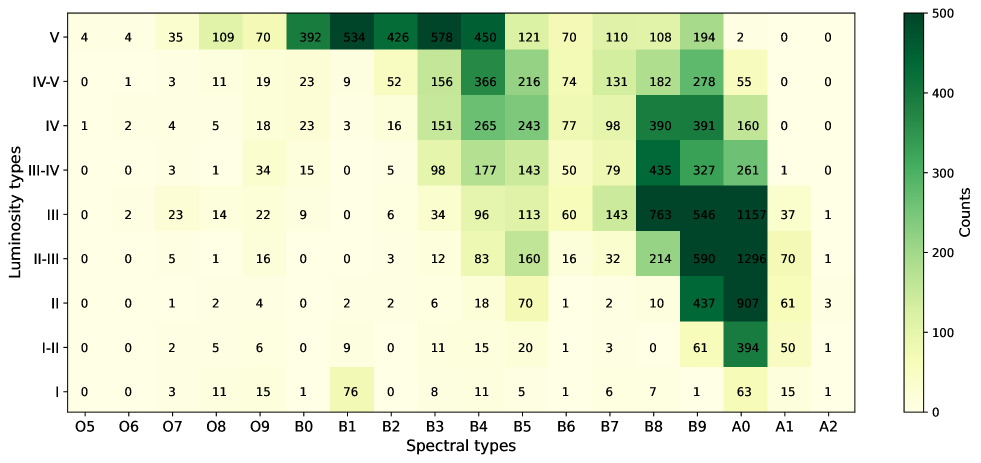
In Figure 7, we show the distribution of 16,110 OB stars with the MKCLASS quality evaluation better than ”good” and including ”good” in spectral types versus the luminosity class plane. It is seen that the stars with a spectral type earlier than B6 are mostly main-sequence stars (luminosity classes IV-V and V), and most of the stars with a spectral type between B8 and A1 are giants (II-III). The distributions of OB stars in the spectral types versus luminosity class plane also suggest that the OB stars in the LAMOST survey are mainly late-type B dwarfs, which may be due to the observational selection effect. In addition, the distribution of supergiant stars (I-II and I) of different spectral types shows two peaks between spectral types B1 and B9-A0. The former peak may be due to the ”blue loops” in massive stars (Fitzpatrick & Garmany, 1990; Schaller et al., 1992; Ekström et al., 2012; Wagle et al., 2019), while the later peak is probably due to sample selection effects.
3.2 Comparison with other works
3.2.1 Cross-match with Li (2021)
Li (2021) have presented the spectral classification of 209 O-type, based on the LAMOST low-resolution spectral data between 2011 and 2018 using the spectral classification criteria for O-type stars summarized from Sota et al. (2011, 2014); Maíz Apellániz et al. (2016). We cross-match the O-type star catalog of Li (2021) with the LAMOST DR7 catalog, and get 102 common O-type stars. The reason that the remaining 107 O-type stars of Li (2021) are not included in the LAMOST DR7 catalog as follows: most of the O-type stars in Li (2021) are collected from the LAMOST test sky and not released ((Li, 2021, private communication) ). We cross-match the 102 O-type stars with our OB star catalog, and find they are included in our OB star samples.

3.2.2 Cross-match with Zari et al.(2021)
Zari et al. (2021) constructed an all-sky sample of 988,202 OBA-type stars, based on Gaia EDR3 astrometry and 2MASS photometry. We cross-matched the above catalog with the LAMOST DR7 catalog and obtained 49,114 common stars. As shown in Figure 8, 12,332 of the them common stars are OB stars, and 36,782 are not OB stars. 74.89% of the common stars are not OB stars because the catalog of Zari et al. (2021) mainly contains A-type stars. It is also seen that 137 of the 12,332 OB stars are not included in our samples by cross-matching with our 27,643 OB stars. The reasons why we lost these 137 OB stars are as follows: (i)among them, 124 OB stars with spectral S/Ng 15 are removed due to our identification criterion, as the spectra of OB stars with S/Ng 15 are difficult to identify by the human inspect. (ii) 13 OB stars are missed due to the mistake Ca II K, Hγ or Fe measurements obtained by their bad spectra.
3.2.3 Comparison with Paper I
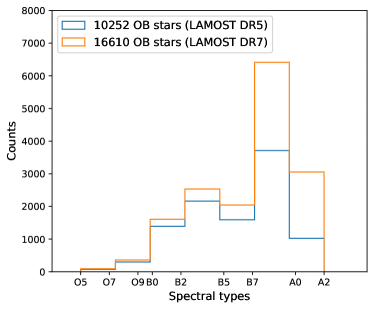
As described in Section 3.1.2, the spectral types of 16,610 of 27,643 OB stars are obtained using the MKCLASS with a quality evaluation better than “good” and including “good.” After cross-matching 16,610 OB stars with the OB stars of Paper I, we get 10,252 common OB stars. Figure 9 shows the distribution of 16,610 OB stars in LAMOST DR7 and 10,252 OB stars in LAMOST DR5 in the spectral types plane. It is seen that OB stars identified in LAMOST DR7 include more late B-type stars and early A-type stars compared to those in LAMOST DR5. Meanwhile, Paper I suggested that there is 1 subtype difference between the manual and MKCLASS classification results. Therefore, the stars with spectral types of A1 or A0 given by MKCLASS are actually B-type stars. Compared with the OB star identification method in Paper I, we set higher equivalent widths for Hγ and Fe in the modified method, which will improves the completeness of late B-type stars.
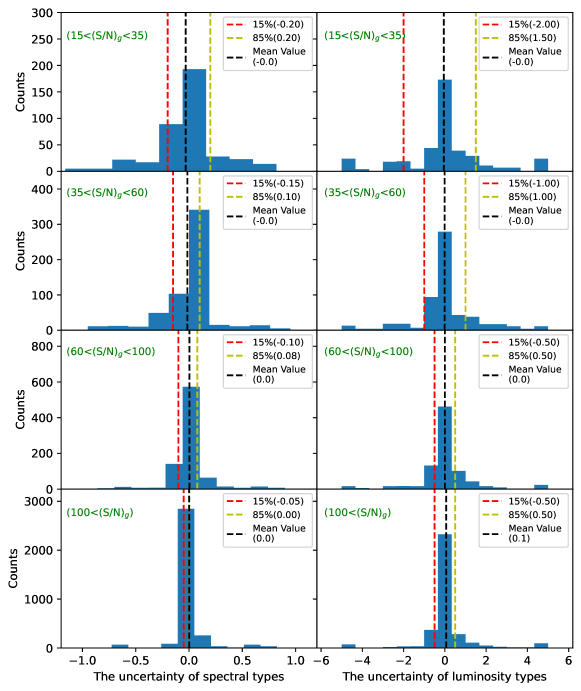
Given the (S/N)g and low-resolution of the LAMOST spectra, we estimate the uncertainty in the provided spectral and luminosity class for the multiply observed OB stars and show in Figure 10. For convenience, we use the numbers to represent the spectral subtype and luminosity subtype, 0.1-0.9 corresponding to O1-O9, 1.0-1.9 corresponding to B0-B1, and 1-5 corresponding to I-V, such as spectral type=1.95 and luminosity=5 for the B9.5V. The spectral type uncertainty of the multiply observed OB stars is obtained using the spectral type obtained by their highest (S/N)g spectra as a criterion. For example, a star with three different (S/N)g spectra ((S/N)g=20, (S/N)g=50, and (S/N)g=130), for the stars with spectral (S/N)g=20 and (S/N)g=50, the uncertainties are 0.1 and 0.0 for spectral types and 1 and 0 for luminosity types. As shown in Figure 10, the uncertainties of spectral types are about 2, 1.5, and 1 subtype for the stars with spectral (S/N)g35, 35(S/N)g60, and 60(S/N)g, respectively. while the uncertainties of luminosity types are about 2, 1, and 0.5 subtypes for the stars with spectral (S/N)g35, 35(S/N)g60, and 60(S/N)g, respectively.
3.3 Be-type stars
Be-type stars, which are fast-rotating B-type main-sequence stars, display one or more Balmer emission lines in their spectra because they present an equatorial, circumstellar, accretion disk (Collins, 1987; Porter & Rivinius, 2003a; Rivinius et al., 2013). The frequency of Be-type stars will increase with decreased metallicity. Variety studies indicate that approximately 1020 percent of the B-type stars in our Galaxy are Be-type stars (11 percent in Jaschek & Jaschek (1983); 17 percent in Zorec & Briot (1997) ). There is a higher percentage of Be-type stars in the Large Magellanic Cloud (17-22%) and the Small Magellanic Cloud (26-40%)(Martayan et al., 2006; Schootemeijer et al., 2022; Martayan et al., 2007). We inspect the 37,499 spectra of 27,415 B-type stars and identify 3932 spectra of 3006 Be-type stars or candidates. The frequency of our Be-type stars is about 10.96. The reasons for the lower frequency of our Be-type stars are as follows: (i) most of our Be-type stars are field stars, and clusters have a higher ratio of Be-type stars than that of the field stars (Keller et al., 2001; Yu et al., 2018). (ii) there is a lower fraction of Be-type stars in late-type B stars than in early-type B stars (Zorec & Briot, 1997; Porter & Rivinius, 2003b). As shown in Figure 7, our B-type sample candidates are mainly late-type B stars. The large number of late B-type stars in the current sample makes the percentage of our Be-type star lower.
3.4 Spatial distribution of OB stars
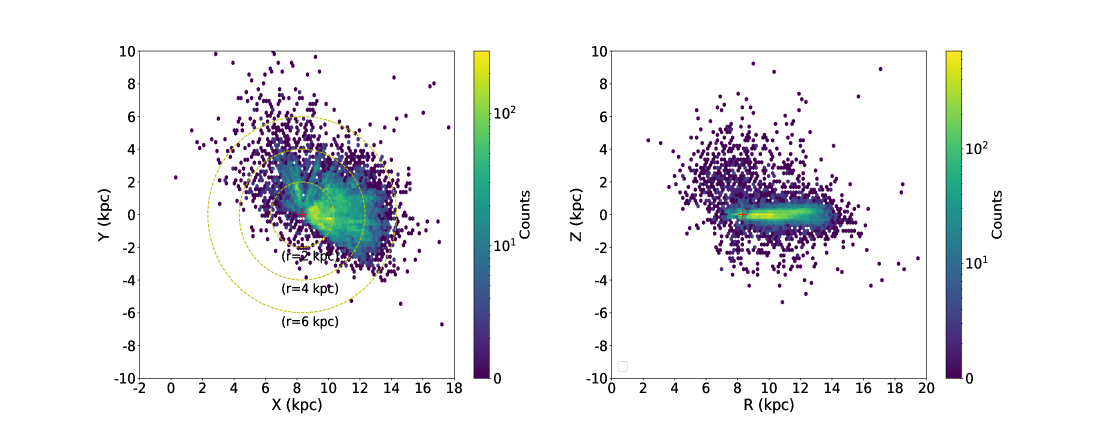
With Gaia EDR3 data (Gaia Collaboration et al., 2023), we select 20,581 OB stars satisfying RUWE1.4 and /30%, and calculate their Galactocentric coordinates (X,Y,Z) by using the photogeometric distances from Bailer-Jones et al. (2021) and the solar position from Reid et al. (2014) (R0=8.34 kpc).
Figure 11 shows the Galactocentric spatial distribution for our 20,581 OB stars. From the left panel of Figure 11, it is seen that the OB stars are mainly located in the 6 kpc range of the Sun on the Galactic anti-center. From the right panel of Figure 11, it is seen that OB stars are mainly located in the Galactic disk. In addition, there are a small number of OB stars located in the Galactic plane with larger vertical distances (Z). These OB stars with larger Z, which may include some runaway OB stars, are very valuable for us to investigate the origins of runaway OB stars (Hoogerwerf et al., 2001; Martin, 2004, 2006; Bhat et al., 2022; Liu et al., 2023).
4 Summary
In this work, we employ the modified spectral-line-indices method to update the catalog of OB stars based on the LAMOST DR7 data. The main results are summarized below:
(1) Based on the OB stars selected from Xiang2022, we modify the OB selection criteria in spectral line indices’ space. Using the revised selection criteria, we identify 37,778 spectra of 27,643 OB stars from the LAMOST DR7 low-resolution spectra. 3827 of them are newly identified.
(2) We apply MKCLASS to classify the 27,643 OB stars, and find they are mainly B-type main-sequences with spectral types later than B2. It is found that the improved method can better identify OB stars in LAMOST survey data, especially for the late-B-type stars.
(3) There are 3932 spectra of 3006 Be-type stars or candidates identified by examining the Balmer emission lines in LAMOST spectra of B-type star sample, and the frequency (10.9%) of our Be-type stars is consistent with previous results.
(4) The spatial distribution of OB stars suggests that most of them are located in the Galactic disk, which will provide important data support for investigating the Galactic structure in future work. In addition, there are some OB stars with large vertical distances in our samples, and the study of their origin provides a possibility to explore the formation mechanism of runaway OB stars (Martin, 2004; McEvoy et al., 2017).
Acknowledgments
. We thank the anonymous referee for the helpful suggestions to help improve this manuscript. This study is supported by the National Natural Science Foundation of China under grants No. 12173013, 12090044, 12003045, and 12403034; the National Key Basic RD Program of China No. 2019YFA0405500; the project of Hebei provincial department of science and technology under the grant No. 226Z7604G, the Hebei NSFC (Nos. A2021205006), the project of Hebei Natural Science Foundation (No. A2024205031), and Science Foundation of Hebei Normal University(No. L2024B54, L2024B55, and L2024B56). The Guoshoujing Telescope (the Large Sky Area Multi-Object Fiber Spectroscopic Telescope LAMOST) is a National Major Scientific Project built by the Chinese Academy of Sciences. LAMOST is operated and managed by the National Astronomical Observatories, Chinese Academy of Sciences. This work has made use of data from the European Space Agency (ESA) mission Gaia (https://www.cosmos.esa.int/gaia), processed by the Gaia Data Processing and Analysis Consortium (DPAC, https://www.cosmos.esa.int/web/gaia/dpac/consortium). Funding for the DPAC has been provided by national institutions, in particular the institutions participating in the Gaia Multilateral Agreement. This research has made use of the SIMBAD database, operated at CDS, Strasbourg, France.
| Obsid | Designation | S/N | MKCLASS | SIMBAD | Manualb | Source ID | Parallax | Distancesc |
| (LAMOST) | Gaia EDR3 | (pc) | ||||||
| 100001177 | J045557.58+211459.1 | 164.3 | kA0hF1mG2 | B | 3412127903494703616 | 0.87060.0297 | 1090.62 | |
| 100002184 | J044623.33+221203.5 | 198.01 | A0 II | OB | B | 3413030778636383232 | 0.4715 0.0301 | 1857.13 |
| 100005136 | J045336.02+221209.6 | 70.75 | B9.5 IVn | B | 3412423981361441152 | 1592.16 | ||
| 100005210 | J044946.51+215704.8 | 52.75 | A7 mA0 V metal-weak | B | 3412777268193287552 | 2560.87 | ||
| 100007030 | J045604.80+213831.3 | 197.16 | A0 II | B | 3412331622383534720 | 0.55860.0255 | 1632.9 | |
| 100007094 | J050147.68+214621.4 | 258.28 | kB9hA5mG8 Eu | A5 | B | 3412196455470112384 | 1.11130.0204 | 876.25 |
| 100008008 | J045630.77+223527.7 | 342.53 | A3 mA0 V Lam Boo | A0 | B | 3412540259011937408 | 1.37170.0195 | 711.09 |
| 100008050 | J045716.85+230328.4 | 77.47 | A0 II-III | B | 3412592760691790592 | 2579.57 | ||
| 100008248 | J045605.71+224956.5 | 208.05 | A1 IV | A2 | B | 3412564482627163776 | 0.991 0.0389 | 957.69 |
| 100013039 | J050338.55+234349.5 | 223.35 | A6 mB7 V Lam Boo | B | 3418682062245934336 | 687.01 | ||
| 100013047 | J050415.97+234142.2 | 175.9 | A3 mA0 V Lam Boo | A | B | 3418670822315071744 | 1.3519 0.0184 | 716.65 |
| 100013076 | J050210.96+233018.1 | 335.43 | B6 V | A0 | B | 3418580632297530624 | 1.4397 0.0187 | 679.11 |
| 100013198 | J050338.41+240655.7 | 279.33 | A5 mB0 V Lam Boo | B9 | B | 3418764869215028992 | 1.3879 0.0184 | 704.52 |
| 100014014 | J044413.65+241445.4 | 136.45 | B9 II-III | B9/A0: | B | 147219079337102976 | 0.6444 0.03 | 1464.54 |
| 100014051 | J044655.69+233304.9 | 175.02 | Unclassifiable | F5 | B | 146937363842973952 | 1.2331 0.0227 | 784.07 |
| 100101061 | J045116.61+213003.7 | 375.32 | B9 V | A0 | B | 3411998229842267264 | 1.6296 0.0206 | 601.61 |
| 100105073 | J045106.60+223320.6 | 48.19 | B9.5 IV-V | B | 3413242950020426240 | 0.5508 0.0174 | 1690.26 | |
| 100106018 | J050048.28+222400.3 | 42.73 | B8 V | B | 3412313484738734208 | 1764.18 | ||
| 100106169 | J050321.11+224232.3 | 106.12 | B9 II-III | B | 3418315443837401856 | 0.2978 0.0202 | 2687.67 | |
| 100106190 | J050103.07+223638.7 | 152.1 | B9 IVn | A0 | B | 3412319978729250560 | 1.4726 0.0269 | 656.07 |
| … | … | … | … | … | … | … | … | … |
| (a)The signal to noise at the g band. | ||||||||
| (b)The spectral type (O or B) identified by eye in this work. | ||||||||
| (c)The distances of OB stars are from Bailer-Jones et al. (2021) | ||||||||
| (This table is available in its entirety in machine-readable form.) | ||||||||
References
- Bailer-Jones et al. (2021) Bailer-Jones, C. A. L., Rybizki, J., Fouesneau, M., Demleitner, M., & Andrae, R. 2021, AJ, 161, 147, doi: 10.3847/1538-3881/abd806
- Bhat et al. (2022) Bhat, A., Irrgang, A., & Heber, U. 2022, A&A, 663, A39, doi: 10.1051/0004-6361/202142993
- Carraro et al. (2015) Carraro, G., Vázquez, R. A., Costa, E., Ahumada, J. A., & Giorgi, E. E. 2015, AJ, 149, 12, doi: 10.1088/0004-6256/149/1/12
- Chen et al. (2019) Chen, B. Q., Huang, Y., Hou, L. G., et al. 2019, MNRAS, 487, 1400, doi: 10.1093/mnras/stz1357
- Collins (1987) Collins, George W., I. 1987, in IAU Colloq. 92: Physics of Be Stars, ed. A. Slettebak & T. P. Snow, 3
- Cui et al. (2012) Cui, X.-Q., Zhao, Y.-H., Chu, Y.-Q., et al. 2012, Research in Astronomy and Astrophysics, 12, 1197, doi: 10.1088/1674-4527/12/9/003
- de Burgos et al. (2023) de Burgos, A., Simón-Díaz, S., Urbaneja, M. A., & Negueruela, I. 2023, A&A, 674, A212, doi: 10.1051/0004-6361/202346179
- de Burgos et al. (2024) de Burgos, A., Simón-Díaz, S., Urbaneja, M. A., & Puls, J. 2024, A&A, 687, A228, doi: 10.1051/0004-6361/202348808
- Deng et al. (2012) Deng, L.-C., Newberg, H. J., Liu, C., et al. 2012, Research in Astronomy and Astrophysics, 12, 735, doi: 10.1088/1674-4527/12/7/003
- Dufton et al. (2006) Dufton, P. L., Smartt, S. J., Lee, J. K., et al. 2006, A&A, 457, 265, doi: 10.1051/0004-6361:20065392
- Ekström et al. (2012) Ekström, S., Georgy, C., Eggenberger, P., et al. 2012, A&A, 537, A146, doi: 10.1051/0004-6361/201117751
- Evans et al. (2006) Evans, C. J., Lennon, D. J., Smartt, S. J., & Trundle, C. 2006, A&A, 456, 623, doi: 10.1051/0004-6361:20064988
- Evans et al. (2005) Evans, C. J., Smartt, S. J., Lee, J. K., et al. 2005, A&A, 437, 467, doi: 10.1051/0004-6361:20042446
- Evans et al. (2011) Evans, C. J., Taylor, W. D., Hénault-Brunet, V., et al. 2011, A&A, 530, A108, doi: 10.1051/0004-6361/201116782
- Fitzpatrick & Garmany (1990) Fitzpatrick, E. L., & Garmany, C. D. 1990, ApJ, 363, 119, doi: 10.1086/169322
- Gaia Collaboration et al. (2016) Gaia Collaboration, Brown, A. G. A., Vallenari, A., et al. 2016, A&A, 595, A2, doi: 10.1051/0004-6361/201629512
- Gaia Collaboration et al. (2023) Gaia Collaboration, Vallenari, A., Brown, A. G. A., et al. 2023, A&A, 674, A1, doi: 10.1051/0004-6361/202243940
- Gray & Corbally (2014) Gray, R. O., & Corbally, C. J. 2014, AJ, 147, 80, doi: 10.1088/0004-6256/147/4/80
- Gray & Corbally (2009) Gray, R. O., & Corbally, Christopher, J. 2009, Stellar Spectral Classification
- Heger et al. (2003) Heger, A., Fryer, C. L., Woosley, S. E., Langer, N., & Hartmann, D. H. 2003, ApJ, 591, 288, doi: 10.1086/375341
- Hoogerwerf et al. (2001) Hoogerwerf, R., de Bruijne, J. H. J., & de Zeeuw, P. T. 2001, A&A, 365, 49, doi: 10.1051/0004-6361:20000014
- Hunter et al. (2009) Hunter, I., Brott, I., Langer, N., et al. 2009, A&A, 496, 841, doi: 10.1051/0004-6361/200809925
- Jaschek & Jaschek (1983) Jaschek, C., & Jaschek, M. 1983, A&A, 117, 357
- Keller et al. (2001) Keller, S. C., Grebel, E. K., Miller, G. J., & Yoss, K. M. 2001, AJ, 122, 248, doi: 10.1086/321139
- Li et al. (2019) Li, C., Zhao, G., Jia, Y., et al. 2019, ApJ, 871, 208, doi: 10.3847/1538-4357/aafa17
- Li (2021) Li, G.-W. 2021, ApJS, 253, 54, doi: 10.3847/1538-4365/abe716
- Liu et al. (2015) Liu, C., Cui, W.-Y., Zhang, B., et al. 2015, Research in Astronomy and Astrophysics, 15, 1137, doi: 10.1088/1674-4527/15/8/004
- Liu et al. (2019) Liu, Z., Cui, W., Liu, C., et al. 2019, ApJS, 241, 32, doi: 10.3847/1538-4365/ab0a0d
- Liu et al. (2023) Liu, Z., Cui, W., Zhao, G., et al. 2023, MNRAS, 519, 995, doi: 10.1093/mnras/stac3562
- Maíz Apellániz et al. (2011) Maíz Apellániz, J., Sota, A., Walborn, N. R., et al. 2011, in Highlights of Spanish Astrophysics VI, ed. M. R. Zapatero Osorio, J. Gorgas, J. Maíz Apellániz, J. R. Pardo, & A. Gil de Paz, 467–472, doi: 10.48550/arXiv.1010.5680
- Maíz Apellániz et al. (2016) Maíz Apellániz, J., Sota, A., Arias, J. I., et al. 2016, ApJS, 224, 4, doi: 10.3847/0067-0049/224/1/4
- Martayan et al. (2007) Martayan, C., Floquet, M., Hubert, A. M., et al. 2007, A&A, 472, 577, doi: 10.1051/0004-6361:20077390
- Martayan et al. (2006) Martayan, C., Hubert, A. M., Floquet, M., et al. 2006, A&A, 445, 931, doi: 10.1051/0004-6361:20052760
- Martin (2004) Martin, J. C. 2004, AJ, 128, 2474, doi: 10.1086/425045
- Martin (2006) —. 2006, AJ, 131, 3047, doi: 10.1086/504079
- McEvoy et al. (2017) McEvoy, C. M., Dufton, P. L., Smoker, J. V., et al. 2017, ApJ, 842, 32, doi: 10.3847/1538-4357/aa745a
- Morgan & Keenan (1973) Morgan, W. W., & Keenan, P. C. 1973, ARA&A, 11, 29, doi: 10.1146/annurev.aa.11.090173.000333
- Morgan et al. (1943) Morgan, W. W., Keenan, P. C., & Kellman, E. 1943, An atlas of stellar spectra, with an outline of spectral classification
- Morgan et al. (1953) Morgan, W. W., Whitford, A. E., & Code, A. D. 1953, ApJ, 118, 318, doi: 10.1086/145754
- Nieva & Przybilla (2012) Nieva, M. F., & Przybilla, N. 2012, A&A, 539, A143, doi: 10.1051/0004-6361/201118158
- Porter & Rivinius (2003a) Porter, J. M., & Rivinius, T. 2003a, PASP, 115, 1153, doi: 10.1086/378307
- Porter & Rivinius (2003b) —. 2003b, PASP, 115, 1153, doi: 10.1086/378307
- Reid et al. (2014) Reid, M. J., Menten, K. M., Brunthaler, A., et al. 2014, ApJ, 783, 130, doi: 10.1088/0004-637X/783/2/130
- Rivinius et al. (2013) Rivinius, T., Carciofi, A. C., & Martayan, C. 2013, A&A Rev., 21, 69, doi: 10.1007/s00159-013-0069-0
- Schaller et al. (1992) Schaller, G., Schaerer, D., Meynet, G., & Maeder, A. 1992, A&AS, 96, 269
- Schootemeijer et al. (2022) Schootemeijer, A., Lennon, D. J., Garcia, M., et al. 2022, A&A, 667, A100, doi: 10.1051/0004-6361/202244730
- Simón-Díaz et al. (2011a) Simón-Díaz, S., Castro, N., Garcia, M., Herrero, A., & Markova, N. 2011a, Bulletin de la Societe Royale des Sciences de Liege, 80, 514, doi: 10.48550/arXiv.1009.5824
- Simón-Díaz et al. (2011b) Simón-Díaz, S., Garcia, M., Herrero, A., Maíz Apellániz, J., & Negueruela, I. 2011b, in Stellar Clusters & Associations: A RIA Workshop on Gaia, 255–259, doi: 10.48550/arXiv.1109.2665
- Simón-Díaz & Herrero (2014) Simón-Díaz, S., & Herrero, A. 2014, A&A, 562, A135, doi: 10.1051/0004-6361/201322758
- Skrutskie et al. (2006) Skrutskie, M. F., Cutri, R. M., Stiening, R., et al. 2006, AJ, 131, 1163, doi: 10.1086/498708
- Sota et al. (2014) Sota, A., Maíz Apellániz, J., Morrell, N. I., et al. 2014, ApJS, 211, 10, doi: 10.1088/0067-0049/211/1/10
- Sota et al. (2011) Sota, A., Maíz Apellániz, J., Walborn, N. R., et al. 2011, ApJS, 193, 24, doi: 10.1088/0067-0049/193/2/24
- Taylor (2005) Taylor, M. B. 2005, in Astronomical Society of the Pacific Conference Series, Vol. 347, Astronomical Data Analysis Software and Systems XIV, ed. P. Shopbell, M. Britton, & R. Ebert, 29
- Wagle et al. (2019) Wagle, G. A., Ray, A., Dev, A., & Raghu, A. 2019, ApJ, 886, 27, doi: 10.3847/1538-4357/ab4a19
- Walborn & Fitzpatrick (1990) Walborn, N. R., & Fitzpatrick, E. L. 1990, PASP, 102, 379, doi: 10.1086/132646
- Wolff et al. (2008) Wolff, S. C., Strom, S. E., Cunha, K., et al. 2008, AJ, 136, 1049, doi: 10.1088/0004-6256/136/3/1049
- Worthey et al. (1994) Worthey, G., Faber, S. M., Gonzalez, J. J., & Burstein, D. 1994, ApJS, 94, 687, doi: 10.1086/192087
- Xiang et al. (2022) Xiang, M., Rix, H.-W., Ting, Y.-S., et al. 2022, A&A, 662, A66, doi: 10.1051/0004-6361/202141570
- Xu et al. (2021) Xu, Y., Hou, L. G., Bian, S. B., et al. 2021, A&A, 645, L8, doi: 10.1051/0004-6361/202040103
- Yu et al. (2018) Yu, P.-C., Yu, C.-H., Lee, C.-D., et al. 2018, AJ, 155, 91, doi: 10.3847/1538-3881/aaa45b
- Yu et al. (2021) Yu, Y., Wang, H.-F., Cui, W.-Y., et al. 2021, ApJ, 922, 80, doi: 10.3847/1538-4357/ac1e91
- Zari et al. (2021) Zari, E., Rix, H. W., Frankel, N., et al. 2021, A&A, 650, A112, doi: 10.1051/0004-6361/202039726
- Zhang et al. (2020) Zhang, B., Liu, C., & Deng, L.-C. 2020, ApJS, 246, 9, doi: 10.3847/1538-4365/ab55ef
- Zhang et al. (2021) Zhang, B., Li, J., Yang, F., et al. 2021, ApJS, 256, 14, doi: 10.3847/1538-4365/ac0834
- Zhao et al. (2012) Zhao, G., Zhao, Y.-H., Chu, Y.-Q., Jing, Y.-P., & Deng, L.-C. 2012, Research in Astronomy and Astrophysics, 12, 723, doi: 10.1088/1674-4527/12/7/002
- Zorec & Briot (1997) Zorec, J., & Briot, D. 1997, A&A, 318, 443