Particle Acceleration Time due to Turbulent-Induced Magnetic Reconnection
Abstract
In this work, we numerically investigate a crucial parameter for understanding particle acceleration theory via turbulence-induced magnetic reconnection: the particle acceleration time. Employing recent numerical simulations of magnetically dominated turbulent relativistic jets, we examine particles accelerated either during the jet’s dynamic evolution or in a post-processing, nearly stationary regime. We derive the particle acceleration time and compare it with theoretical predictions for both the Fermi and drift regimes identified in the simulations. In the Fermi regime, the acceleration time is expected to be independent of the particles’ energy, for constant reconnection velocity, as energy increases exponentially with time. Conversely, we expect the reconnection acceleration time to depend on the current sheet’s thickness and the reconnection velocity, a dependence recently revisited by Xu & Lazarian (2023). They identified three conditions for within the reconnection layer, based on the reconnection velocity and the angle between the reconnecting and background guide fields. We tested these relations using statistical distributions of the current sheets’ thickness and reconnection velocities in the turbulent jet over time. The resulting average value of was found to be nearly constant with particle energy, as anticipated. Additionally, we compared this acceleration time with the average acceleration time derived directly from 50,000 particles accelerated in situ in the same relativistic jet. Our results show excellent agreement between the two independent evaluations, particularly for the fastest reconnection acceleration condition. When considering a longer time interval for particle acceleration in a nearly stationary snapshot of the turbulent jet, we find that the acceleration time during the Fermi regime remains nearly independent of particle energy and aligns with the acceleration time theoretical relations up to the threshold energy, attained when the particles Larmor radius becomes as large as the thickness of the largest current sheets. Beyond this threshold, the acceleration regime shifts to the slower drift regime, showing strong energy dependence, as predicted. The results also indicate a clear dominance of the Fermi regime of acceleration.
1 Introduction
Recent advancements in high-energy astrophysics have underscored the crucial role of magnetic reconnection in accelerating energetic particles beyond the framework of solar system. Magnetic reconnection is now recognized as a strong candidate in the generation of very and ultra-high-energy cosmic rays (UHECRs) as well as the very high-energy (VHE) flares produced by them within magnetically dominated regions of sources like accretion flows and relativistic jets around black holes and compact sources, pulsar wind nebulae, and GRBs (e.g. de Gouveia Dal Pino & Lazarian, 2005; Giannios et al., 2009; de Gouveia Dal Pino et al., 2010b, a; Zhang & Yan, 2011; McKinney & Uzdensky, 2012; Arons, 2013; Kadowaki et al., 2015; Singh et al., 2015; Zhang & Li, 2015; Zhang et al., 2018; Cerutti et al., 2013; Yuan et al., 2016; Lyutikov et al., 2018; Petropoulou et al., 2016; Christie et al., 2019; Medina-Torrejón et al., 2021; Murase et al., 2022; Medina-Torrejón et al., 2023; Zhang et al., 2021, 2023a).
The understanding of particle acceleration driven by magnetic reconnection has significantly advanced, benefiting from both particle-in-cell (PIC) simulations, primarily conducted in two-dimensional (2D) settings (e.g., Zenitani & Hoshino, 2001; Drake et al., 2006; Zenitani & Hoshino, 2007, 2008; Lyubarsky & Liverts, 2008; Drake et al., 2010; Clausen-Brown & Lyutikov, 2012; Cerutti et al., 2012, 2014; Li et al., 2015; Werner et al., 2018, 2019; Lyutikov et al., 2017; Sironi & Spitkovsky, 2014; Guo et al., 2015, 2016, 2020; Sironi et al., 2015; Ball et al., 2018; Comisso & Sironi, 2018; Guo et al., 2019; Kilian et al., 2020; Comisso & Sironi, 2021; Zhang et al., 2021, 2023a; Guo et al., 2023), and magnetohydrodynamic (MHD) simulations, mainly performed in three dimensions (3D) (e.g., Kowal et al., 2011, 2012; de Gouveia Dal Pino & Kowal, 2015; Lazarian et al., 2012; del Valle et al., 2016; Beresnyak & Li, 2016; Ripperda et al., 2017; Kadowaki et al., 2021; Medina-Torrejón et al., 2021, 2023).
The main results found from these studies can be succinctly summarized as follows.
PIC simulations explore scales of the order of 100-1000 times the plasma inertial length (, where is the light speed and is the plasma frequency), representing microscopic scales several orders of magnitude smaller than astrophysical source scales (typically, around and times smaller than solar and relativistic jet scales, respectively). In these simulations, fast reconnection is primarily driven by the tearing mode instability. In two-dimensions this leads to the formation of plasmoids (magnetic islands) which are actually confined to 2D space geometry (Vicentin et al., 2024). The reconnection velocity () in this case depends on the plasma resistivity () and particle acceleration can reach energies of up to a few times the particle rest mass energy () only. The dominant electric field responsible for particle acceleration is resistive, associated with the current density ().
On the other hand, magnetohydrodynamic (MHD) simulations with the injection of test particles, are designed to explore the macroscopic astrophysical scales of the process. In this regime, fast reconnection is predominantly driven by the ubiquitous 3D turbulence in these environments, as a direct consequence of magnetic flux violation (Lazarian & Vishniac, 1999; Kowal et al., 2009; Eyink et al., 2013; Takamoto et al., 2015; de Gouveia Dal Pino & Kowal, 2015; Santos-Lima et al., 2010; Jafari et al., 2018; Santos-Lima et al., 2020; Lazarian et al., 2020; Vicentin et al., 2024). Turbulence can be induced by instabilities like Kelvin-Helmholtz (Kowal et al., 2020), magnetorotational (MRI) (Kadowaki et al., 2018), current-driven kink (CDKI) (Singh et al., 2016; Bromberg & Tchekhovskoy, 2016; Kadowaki et al., 2021; Medina-Torrejón et al., 2021, 2023), and even tearing mode (e.g. Huang & Bhattacharjee, 2016; Beg et al., 2022; Vicentin et al., 2024). Unlike in PIC scales, the reconnection velocity in MHD turbulent flows is independent of resistivity. Instead, it depends on the scale and velocity of turbulence at the injection 111The meandering of the magnetic field lines in the turbulent flow facilitates numerous simultaneous events of reconnection and the enlargement of the outflow regions, expelling the reconnected flux very efficiently. These two effects contribute to a reconnection rate that is a significant fraction of the Alfvén speed irrespective of the magnetic resistivity (i.e., independent of the Lundquist number) and solely reliant on the parameters of the turbulence).. Accelerated particles in this case can achieve energies up to approximately times the particle rest mass energy (), e.g. in relativistic jets of blazars with background magnetic fields G (Medina-Torrejón et al., 2021). The dominant electric field responsible for particle acceleration is non-resistive, given by the () term of the turbulent magnetic fluctuations of the background flow coming into the reconnection layers.
The MHD (and several PIC) simulations along with theoretical framework have demonstrated that particles are mainly accelerated at reconnection sites through a Fermi mechanism in the ideal electric fields (de Gouveia Dal Pino & Lazarian, 2005; Drake et al., 2006; Kowal et al., 2012; Guo et al., 2019). In these sites, particles undergo multiple crossings in the converging magnetic fluxes of opposite polarity, gaining energy from interactions with background magnetic irregularities. The 3D simulations demonstrate the formation of these reconnecting layers throughout the turbulence’s inertial range (i.e., from the small dissipation scale to the injection scale of the turbulent eddies), allowing for particle acceleration up to large scales and very high energies as remarked above (Kowal et al., 2012; de Gouveia Dal Pino & Kowal, 2015; del Valle et al., 2016; Medina-Torrejón et al., 2021; Kadowaki et al., 2021; Medina-Torrejón et al., 2023). The inherent 3D nature of turbulent reconnection and the resulting particle acceleration in 3D reconnecting flux tubes render the process more efficient compared to acceleration within 2D shrinking plasmoids and X-points typically induced by tearing mode instability in PIC (e.g. Hoshino & Lyubarsky, 2012; Drake et al., 2006; Sironi & Spitkovsky, 2014) and laminar resistive magnetohydrodynamic (MHD) simulations (e.g. Kowal et al., 2011; Puzzoni et al., 2022).
In the Fermi regime particles are accelerated in time up to a threshold energy which is attained when the particle’s Larmor radius reaches the injection size of the turbulence (which also determines the thickness of the largest reconnection layers). Beyond the threshold, particles experience additional acceleration to energies up to 100 times greater, albeit at a reduced rate, due to drifting in large-scale non-reconnecting fields. The energy spectrum of accelerated particles exhibits a high-energy tail with a power-law index of approximately -1 to -2 which is influenced by both the Fermi and drift mechanisms (Kowal et al., 2012; Lazarian et al., 2012; de Gouveia Dal Pino & Kowal, 2015; del Valle et al., 2016; Medina-Torrejón et al., 2021, 2023). 222Interestingly, a recent study by Zhang et al. (2023b) have replicated the simulation and analysis of test particle acceleration in a current sheet with self-driven turbulent reconnection and obtained results very much similar to those reported by Kowal et al. (2012); del Valle et al. (2016). However, they did not address the significant similarities, which successfully confirmed those earlier findings on reconnection acceleration as well.
In contrast, recent 3D PIC simulations propose that drift acceleration predominantly shapes the particle spectrum over Fermi acceleration (Sironi, 2022; Zhang et al., 2021, 2023a), although consensus on this matter regarding PIC simulations remains elusive (e.g. Guo et al., 2019, 2023). Moreover, considering that drift acceleration, which is strongly dependent on the particle’s energy, is much less efficient at large energies than Fermi acceleration in reaching the observed very and ultra-high energies (del Valle et al., 2016), it seems unlikely that this process could emerge as the only one dominant at large astrophysical scales. Hence, it is crucial to exercise caution when extrapolating results from kinetic PIC scales to larger scales of real systems. Still, both PIC and MHD regimes complement each other. PIC simulations have successfully investigated particle acceleration from energies below their rest mass to several hundred times this value, addressing the injection problem mostly for electron-positron pair plasmas (e.g. Sironi, 2022; Guo et al., 2023). Meanwhile, MHD simulations have explored particle acceleration of protons up to the highest observed values at the macroscopic injection scales of turbulence, clearly probing the threshold (or saturation) regime described above (Kowal et al., 2012; de Gouveia Dal Pino & Kowal, 2015; del Valle et al., 2016; Medina-Torrejón et al., 2021, 2023).
Another crucial quantity for characterizing reconnection acceleration, in addition to the particle power spectrum, is the acceleration time. According to the Fermi mechanism, for a constant reconnection rate, there is an exponential energy growth over time, regardless of the energy (e.g. de Gouveia Dal Pino & Lazarian, 2005; de Gouveia Dal Pino & Kowal, 2015). 3D MHD simulations of turbulence-induced reconnection in relativistic and non-reativistic flows have shown nearly exponential growth over time, with a very weak dependence on energy, implying acceleration times approximately of in current sheets with nearly relativistic reconnection velocities (del Valle et al., 2016) and in relativistic jets (Medina-Torrejón et al., 2021, 2023), confirming the predictions for the Fermi regime. The slight departure from zero-dependence is attributed to the fact that in such flows, the reconnection velocity is not constant (with average values varying between , where is the Alfvén speed). The 3D MHD simulations have also revealed a strong dependence of the particle acceleration time on the reconnection velocity (del Valle et al., 2016), which is also consistent with the theory (de Gouveia Dal Pino & Lazarian, 2005). As emphasized earlier, the Fermi regime continues until the particles reach a threshold energy at which their Larmor radius equals the thickness of the largest reconnection layers. Beyond this energy, these simulations show that particles transition to slower acceleration, drifting in non-reconnecting magnetic fields.
In a recent study, Xu & Lazarian (2023) (hereafter XL23, ) revisited the earlier work by de Gouveia Dal Pino & Lazarian (2005), who initially proposed the Fermi process as the primary mechanism for reconnection acceleration (see also the review in de Gouveia Dal Pino & Kowal, 2015). XL23 assessed the particle acceleration time in the Fermi regime within a turbulence-induced magnetic reconnection layer, delineating three distinct conditions depending on the thickness of the reconnection layer, the reconnection velocity and the angle between the reconnection and the guide fields.
In this work, we will investigate the theoretical predictions for particle acceleration time both in the Fermi and drift regimes, through a detailed statistical analysis of both the reconnection sites and the accelerated particles obtained from 3D MHD-PIC simulations of turbulent relativistic jets.
In Medina-Torrejón et al. (2021) (hereafter MGK+21, ), and Kadowaki et al. (2021), it was investigated particle acceleration within 3D relativistic magnetically dominated jets with magnetization parameter , subject to current-driven-kink instability (CDKI). This induces turbulence and rapid magnetic reconnection within the jet flow, leading to the disruption of the initial helical magnetic field configuration and the formation of numerous sites of fast reconnection. Test protons introduced into nearly stationary turbulent snapshots of the jet undergo exponential acceleration over time, primarily along the local magnetic field lines, reaching the aforementioned very and ultra-high energies even before exiting the reconnection layers. Accelerated particles show a clear association with regions of fast reconnection and high current density. In the subsequent work by Medina-Torrejón et al. (2023) (hereafter MGK23, ), 3D MHD-PIC simulations of the same system were performed (considering also ), in order to scrutinize the early stages of particle acceleration simultaneously with the growth of turbulence by CDKI in the jet. Instead of injecting particles in the nearly steady state snapshots of the simulated turbulent jet, they were injected from the beginning into the system, allowing them to evolve with the jet. These simulations corroborated the prior findings, illustrating the significant potential of magnetic reconnection driven by turbulence to propel relativistic particles to exceedingly high energies within magnetically dominant flows.
In this work we will employ the MGK+21 and MGK23 simulations of the jet to probe the reconnection acceleration time predictions outlined by XL23 for the Fermi regime, and then compare them with the acceleration times derived independently from the accelerated particles in MGK+21 and MGK23. We will also probe the theoretical predictions for the subsequent drift regime which occurs when particles reach the threshold energy of the Fermi regime.
The plan of the paper is as follows. In Section 2, we summarize the theoretical predictions for the reconnection acceleration time, in section 3 we describe the numerical method and setup of the simulations, in Section 4, we present the results and in Section 5 we discuss the results and draw our conclusions.
2 Theoretical Predictions for reconnection Acceleration Time
The acceleration time resulting from magnetic reconnection is ultimately constrained by the size of the acceleration region divided by the reconnection velocity (). In the case of turbulence-induced reconnection, is a substantial fraction of the Alfvén speed (Lazarian & Vishniac, 1999; Kowal et al., 2009; del Valle et al., 2016; Kadowaki et al., 2021; Vicentin et al., 2024).
As noted in Section 1, during the Fermi regime of particle acceleration through reconnection, it is expected that particles will experience exponential growth in energy over time (e.g. de Gouveia Dal Pino & Lazarian, 2005). MHD simulations with test particles support this expectation, showing a reconnection acceleration time with a very weak dependence on particle energy (e.g. del Valle et al., 2016; Liu et al., 2017), and ( \al@Medina-Torrejón_2021, Medina-Torrejón_2023; \al@Medina-Torrejón_2021, Medina-Torrejón_2023, ).
In recent study, XL23 revisited the earlier work by de Gouveia Dal Pino & Lazarian (2005) and derived the following conditions for the acceleration time in the Fermi regime within a turbulence-induced magnetic reconnection layer:
| (1) | |||||
| (2) | |||||
| (3) |
where is the thickness of the reconnection layer, is the inflow or reconnection speed in units of the light speed , is the angle between the reconnecting magnetic field and the guide field, and:
| (4) |
being and the light speed.
In the subsequent drift regime, that occurs after particles attain the threshold energy () and exit the reconnection site, or in other words, when their Larmor radius (Kowal et al., 2012; Lazarian et al., 2012), the energy growth with time becomes strongly dependent on the energy. The acceleration time in this regime is approximately described by (de Gouveia Dal Pino & Kowal, 2015; del Valle et al., 2016; Zhang et al., 2021, 2023a):
| (5) |
where is the particle energy, B the magnetic field, and the charge particle. All of those parameters are given in cgs units.
3D MHD numerical simulations with test particles have confirmed that the extended acceleration time observed in the drift regime is attained only for (Kowal et al., 2012; del Valle et al., 2016), ( MGK+21, ). This regime has been also detected recently in 3D PIC simulations (Zhang et al., 2021, 2023a).
3 Numerical method and setup
| Model | Jet time | L [pc] | Particles evolution time |
|---|---|---|---|
| RMHD-PIC | 0 - 60 L/c | hr. | |
| RMHD-GACCEL | 45 L/c | hr. |
For the present analysis we employ the same relativistic jet simulation described in MGK23. That simulation utilized the relativistic MHD-PIC version of the PLUTO code (Mignone et al., 2018), with a resolution in a box of where is the length scale unit. An initial helical magnetic field configuration with maximum intensity code unit (c.u.) at the central axis is assumed. The initial density, pressure, and magnetization parameter at the jet axis (at the plasma frame) are c.u., c.u., and , respectively, where is the Lorentz factor and is the specific enthalpy (with and at the axis). The code unit for density is 1, for velocity is the light speed , for time is , for magnetic field is , and for pressure is . An initial perturbation is applied to allow the growth of the CDKI and turbulence. The simulation is run up to t= 60 L/c.
50,000 particles were injected in this domain at t=0, with a charge to mass ratio given by 20,000 (which relates to the physical ratio as ). This corresponds to a physical length unit for the system pc, for a jet density unit (or 1 particle/) (see MGK23, for more details). In Table 1 this test-particle model is referred as RMHD-PIC. The table gives the dynamical time evolution of the jet, its physical size unit, and the corresponding evolution time of the particles in this system.
In addition, in our analysis below we also consider a post-processing test particle simulation taken from MGK23 (see also MGK+21, ). In this case, one thousand test-particles were injected in a fully developed turbulent snapshot of the same jet system (at t=45 L/c), and allowed to accelerate for much longer time333We note that in the case of post-processing test-particle simulations, the number of injected particles can be much smaller than in the RMHD-PIC model. This has been thoroughly tested in MGK+21 who found no major improvement in the statistical analyses by increasing the injected particles’ number by factors of 10 to 20.. As in MGK+21 and MGK23, the adopted physical length scale of the system in this model was pc, and test particle acceleration was performed with the GACCEL code (Kowal et al., 2012)444https://gitlab.com/gkowal/gaccel. This model is referred as RMHD-GACCEL in Table 1, which also gives the single dynamical jet snapshot considered in this case, the corresponding physical unit length scale and the total evolution time of the particles.
In order to probe the regimes of particle acceleration in a reconnection site as described by eqs. 1 to 3, we use the magnetic reconnection search algorithm developed in Kadowaki et al. (2021) (see also Kadowaki et al., 2018), which allows to identify the reconnection layers as well as quantify their properties including the thickness and the reconnection velocity.
where is the average reconnection velocity in the simulated turbulent jet in units of . In units of the Alfvén speed this is of the order of (MGK23).
To compute in eqs. 1 to 3, we consider the angle between the local reconnection field and the local background mean field approximately given by the initial helical configuration. The values of and of the several reconnection sites that arise once turbulence develops are obtained directly with the reconnection search algorithm at each snapshot.
4 Results
Figure 1, shows 3D views of different snapshots of the jet. Each snapshot presents the particles being accelerated in the RMHD-PIC model, superimposed on the magnetic field lines (left diagrams) and the magnetic reconnection sites for the three conditions identified with the Kadowaki et al. (2021) reconnection search algorithm (right diagrams). The top snapshot on the left shows the system when the CDKI starts to grow and the jet column is deformed in zigzags driving an initial particle acceleration dominated by curvature drift, as shown in MGK23 (see also Alves et al., 2018) and (MGK+21). In this phase, we detect only very few incidental reconnection sites with intermediate acceleration values as shown on the right diagram. According to the results in MGK23, turbulence driven by the CDKI develops in the system only after L/c. The middle and bottom snapshots, at and L/c, respectively, highlight the appearance of several particles being accelerated in the exponential regime (see the histogram of the particles energy distribution evolution with time in the upper panel of Figure 6 in MGK23). They coincide with the emergence of several reconnection sites induced by fully developed turbulence in these snapshots. We can see a good correlation between the accelerated particles, specially with the fast reconnection sites associated to condition III in both snapshots. We also see connections with a few events of condition II, particularly at snapshot L/c, when more particles start to accelerate in outer radii (see also Figure 1 from MGK23).
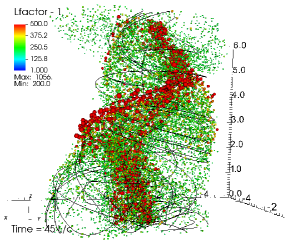
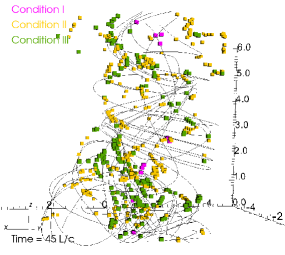
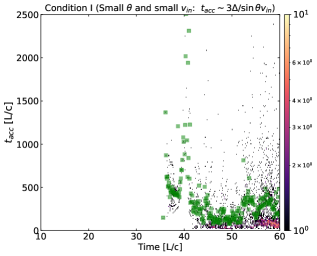
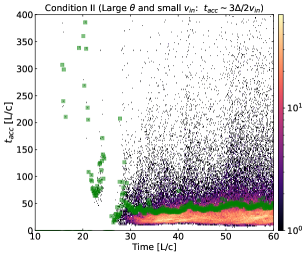
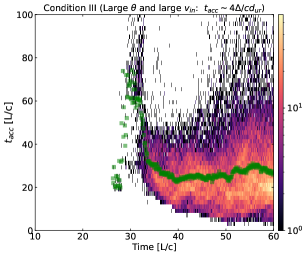
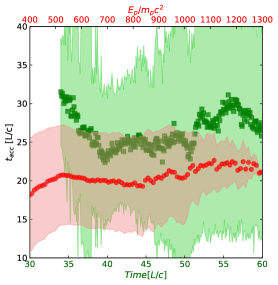
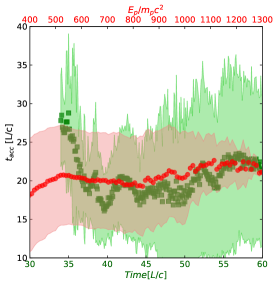
Figure 2 shows histograms of the acceleration time, , as a function of the evolution of the system, calculated for all identified reconnection sites in the jet for the three conditions (eqs. 1, 2 and 3) in units of L/c. The green line (formed by square symbols) corresponds to the average acceleration time evolution. Before , i.e., before the development of turbulence induced by the CDKI, there are almost no reconnection layers. The exception are a very few events detected in the middle panel. The associated acceleration time, as inferred from condition II in this panel, is very large due to the very small reconnection velocities in such epochs (see Figure 4 in MGK23). Interestingly, they occur around , where acceleraton is mainly due to curvature drift in the wiggling magnetic field at the jet spine (see MGK23, ). In the condition I (top panel), at small , the magnetic field of the reconnection sites has small deviation from the original guide field. We see in this regime the longest acceleration time values especially between dynamical times 35 and 45 L/c. After t= 45 L/c the average acceleration time is L/c. In condition II (middle panel), there is a decrease of the acceleration time, as expected, to an average L/c between dynamical t= 30 to 60 L/c. We find that most of the fast reconnection events lie in the condition III (bottom panel), having large and large , with an average acceleration time L/c. We expect that particle acceleration will be predominantly influenced by these reconnection sites.
In Figure 3, top diagram, we compare the acceleration time calculated from the reconnection sites with the condition III, given by the green squares (the same as in Figure 2, bottom panel), with that calculated directly from the particles accelerated during the jet dynamical times between and 60 . Within this time interval, particles undergo exponential acceleration in the turbulent jet (figure 6 top in MGK23, ). The average values of the acceleration time are given by the red circles in this case. The shaded regions correspond to the standard deviations from the average of each evaluation. The acceleration time of the particles was calculated as in MGK23, based on the average time per energy interval that particles take to reach a certain energy (see also MGK+21 for more details). We began measuring the acceleration time of the test particles from when reconnection regions start to form in the relativistic jet, at . We see that in condition III, the average value is consistent with the average acceleration time calculated from the test particles, . These two analyses were conducted independently from each other and evidence an excellent agreement between the theoretical prediction (eq. 3) and that derived directly from the numerical simulation of the acceleration of test particles in the magnetic reconnection layers driven by the turbulence in the jet. The bottom diagram, shows the same comparison, but now, considering only the fastest reconnection events in condition III, namely, those with (instead of , as in eq. 7). In this case the average value given by the green curve is , which clearly aligns quite well with the the average acceleration time calculated from the test particles.
The results above were obtained from the RMHD-PIC simulation where particles were accelerated during a small time interval within the evolving jet. For the physical parameters employed in the simulation pc, the total time elapsed in the jet evolution and the acceleration of the particles corresponds to hr only (see Table 1 and also MGK23, ).
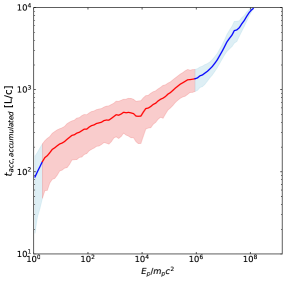
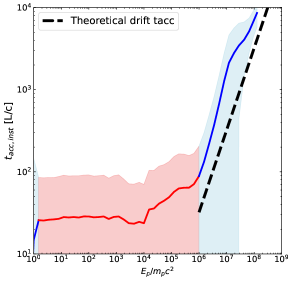
We can compare the particle acceleration time obtained in this small time interval, which reflects a nearly instantaneous acceleration, with that obtained from test particles accelerated in one of the nearly stationary fully turbulent snapshots of the simulated jet for a much longer time. Figure 4 depicts diagrams of the acceleration time in this case, obtained from test particles injected in the jet at the turbulent snapshot L/c, using the GACCEL code (model RMHD-GACCEL in Table 1; see also figure 5 in MGK23). The top diagram shows the ”accumulated” acceleration time as a function of the particles energy. This is calculated from the accelerated particles as in MGK+21 and MGK23, based on the average time per energy interval that particles take to reach a certain energy. However, this evaluation considers the total particle energy increase from the beginning until each energy. The bottom panel of the same figure, on the other hand, provides the ”instantaneous” acceleration time, i.e., , as a function of time. We see that this is comparable to the one obtained in the short time interval of Figure 3. Figure 3 actually corresponds to the tiny portion around in the bottom panel of Figure 4.
Both diagrams in Figure 4 show similar shape and trend, starting with a regime of nearly constant corresponding to Fermi acceleration within the reconnection layers (which has approximate exponential growth of the kinetic energy in time) (red zone; see also Figure 5 in MGK23), followed by a drift regime of acceleration (blue zone) beyond the threshold energy of the Fermi regime, with a much stronger dependence on the energy. The transition to the drift regime occurs when the particles Larmor radius exceeds the maximum thickness of the current sheets (e.g. Kowal et al., 2012; del Valle et al., 2016; Zhang et al., 2023a), ( \al@Medina-Torrejón_2021, Medina-Torrejón_2023; \al@Medina-Torrejón_2021, Medina-Torrejón_2023, ). This maximum thickness is of the order of the injection scale of the turbulence. In the jet this corresponds approximately to the jet diameter ( \al@Medina-Torrejón_2021, Medina-Torrejón_2023; \al@Medina-Torrejón_2021, Medina-Torrejón_2023, ).
Looking at the bottom panel of Figure 4 in more detail, we see that until , the numerical value of matches nicely with the theoretical prediction of fastest reconnection given by condition III (eq. 3, bottom panel of Figure 2, and Figure 3), while between and , there is slight increase in which matches better with the condition II (eq. 2, and middle panel of Figure 2), and finally with condition I (eq. 1, and top panel of Figure 2, indicating slight changes in the reconnection rate to intermediate and smaller values. Both intervals are still in the Fermi regime of particle acceleration within the reconnection sites.
The dashed line in the bottom diagram of Figure 4 shows the theoretical approximation for the acceleration time in the drift regime (eq. 5). It was calculated employing the average values in the simulation G and . We note that there is a good agreement between the theoretical prediction and the numerical simulation also for this regime of acceleration.
5 Discussion and Conclusions
In this work we have investigated numerically a crucial parameter for the comprehension of particle acceleration theory by magnetic reconnection, namely, the particle acceleration time (or rate).
Employing recent numerical simulations of magnetically dominated relativistic jets with particles being accelerated either during the dynamical time evolution of the jet ( MGK23, ), or accelerated in a post-processing, nearly stationary regime of the jet ( \al@Medina-Torrejón_2021, Medina-Torrejón_2023; \al@Medina-Torrejón_2021, Medina-Torrejón_2023, ), we have derived the particle acceleration time and compared with theoretical predictions for both acceleration regimes identified in the simulations, the Fermi regime of magnetic reconnection acceleration and the drift regime which follows.
In the Fermi regime, the acceleration time is expected to be nearly independent of the particles energy, for a constant reconnection velocity, since this energy increases exponentially with time (de Gouveia Dal Pino & Lazarian, 2005; Drake et al., 2006; Kowal et al., 2012; de Gouveia Dal Pino & Kowal, 2015; Guo et al., 2019), ( \al@Medina-Torrejón_2021, Medina-Torrejón_2023; \al@Medina-Torrejón_2021, Medina-Torrejón_2023, ). On the other hand, we expect a dependence of the reconnection acceleration time with the thickness of the current sheet and the reconnection velocity. This dependence has been recently revisited by XL23. They identified three different conditions for within the reconnection layer, depending on the reconnection velocity and the angle between the reconnecting field and the background guide field. We tested their relations using the statistical distributions of the thickness and reconnection velocities of the current sheets detected in the turbulent jet along time. The resulting average value of was found to be nearly constant with the particles energy, as expected.
Moreover, this acceleration time has been compared with the acceleration time evaluated directly from the 50,000 particles accelerated in situ in the same relativistic jet (Figure 3). Our results have evidenced an excellent agreement between the two independent evaluations, especially for the fastest reconnection acceleration condition (III) given by eq. 3.
The analysis in Figure 3 was performed with particles being accelerated while the relativistic jet was dynamically evolving (in a RMHD-PIC simulation, Table 1). This allowed us to compare both derivations of the acceleration time, but in a small time and energy interval.
When we take the much larger time interval for particles acceleration injecting them in a nearly stationary snapshot of the same turbulent jet (RMHD-GACCEL model in Table 1), we find that the instantaneous acceleration time during the Fermi regime is nearly independent of the particles energy and also comparable to the acceleration time relations derived by XL23 until the threshold energy . Beyond this, the acceleration regime changes to the slower drift regime with strong dependence on the particles energy (in agreement with eq. 5).
The results above demonstrate the robustness and consistency between both the theoretical predictions and the numerical simulations, particularly regarding the Fermi mechanism operating within the magnetic reconnection layers up to a threshold energy. This threshold is reached when the Larmor radius of the particles reach the thickness of the largest reconnection layers, which is determined by the injection scale of the turbulence. For the jet, this scale is on the order of the jet diameter ( \al@Medina-Torrejón_2021, Medina-Torrejón_2023; \al@Medina-Torrejón_2021, Medina-Torrejón_2023, ), but similar results have been observed previously in 3D MHD simulations of single turbulent current sheets (e.g. Kowal et al., 2012; del Valle et al., 2016). Beyond these scales, particles undergo further acceleration by drift in non-reconnected fields, albeit at a slower rate. Since particles achieve very high energies within the Fermi regime and continue to gain energy, albeit more slowly, in the drift regime, both regimes are crucial in shaping the particle spectrum at high and very high energies, with the Fermi regime being dominant. This is supported by the 3D MHD large-scale simulations presented above where particles are accelerated to very high and ultra-high energies within the Fermi regime ( \al@Medina-Torrejón_2021, Medina-Torrejón_2023; \al@Medina-Torrejón_2021, Medina-Torrejón_2023, ). This contrasts with recent conclusions based on kinetic simulations that claim that the particle spectrum is predominantly shaped by drift acceleration (Zhang et al., 2021, 2023a), highlighting the need for caution when extrapolating kinetic results to very large macroscopic scales. Furthermore, considering the non-thermal radiative losses that particles may undergo within systems like blazars, they might lose a substantial part of their energy even before reaching the threshold of the Fermi regime and thus, the transition to the drift regime (e.g. de Gouveia Dal Pino et al., 2024).
Data Availability
The data of this article will be available upon request to the authors.
References
- Alves et al. (2018) Alves, E. P., Zrake, J., & Fiuza, F. 2018, Phys. Rev. Lett., 121, 245101
- Arons (2013) Arons, J. 2013, in Particle Acceleration in Cosmic Plasmas. Series: Space Sciences Series of ISSI, ed. A. Balogh, A. Bykov, R. P. Lin, J. Raymond, & M. Scholer, Vol. 45, 341–367
- Ball et al. (2018) Ball, D., Sironi, L., & Özel, F. 2018, ApJ, 862, 80
- Beg et al. (2022) Beg, R., Russell, A. J., & Hornig, G. 2022, The Astrophysical Journal, 940, 94
- Beresnyak & Li (2016) Beresnyak, A., & Li, H. 2016, ApJ, 819, 90
- Bromberg & Tchekhovskoy (2016) Bromberg, O., & Tchekhovskoy, A. 2016, MNRAS, 456, 1739
- Cerutti et al. (2012) Cerutti, B., Uzdensky, D. A., & Begelman, M. C. 2012, ApJ, 746, 148
- Cerutti et al. (2013) Cerutti, B., Werner, G. R., Uzdensky, D. A., & Begelman, M. C. 2013, ApJ, 770, 147
- Cerutti et al. (2014) —. 2014, Physics of Plasmas, 21, 056501
- Childs et al. (2012) Childs, H., Brugger, E., Whitlock, B., et al. 2012, in High Performance Visualization–Enabling Extreme-Scale Scientific Insight, 357–372
- Christie et al. (2019) Christie, I. M., Petropoulou, M., Sironi, L., & Giannios, D. 2019, MNRAS, 482, 65
- Clausen-Brown & Lyutikov (2012) Clausen-Brown, E., & Lyutikov, M. 2012, MNRAS, 426, 1374
- Comisso & Sironi (2018) Comisso, L., & Sironi, L. 2018, Phys. Rev. Lett., 121, 255101
- Comisso & Sironi (2021) —. 2021, Phys. Rev. Lett., 127, 255102
- de Gouveia Dal Pino & Kowal (2015) de Gouveia Dal Pino, E. M., & Kowal, G. 2015, Astrophysics and Space Science Library, Vol. 407, Particle Acceleration by Magnetic Reconnection, ed. A. Lazarian, E. M. de Gouveia Dal Pino, & C. Melioli (Springer Berlin Heidelberg), 373
- de Gouveia Dal Pino et al. (2010a) de Gouveia Dal Pino, E. M., Kowal, G., Kadowaki, L. H. S., Piovezan, P., & Lazarian, A. 2010a, International Journal of Modern Physics D, 19, 729
- de Gouveia Dal Pino & Lazarian (2005) de Gouveia Dal Pino, E. M., & Lazarian, A. 2005, A&A, 441, 845
- de Gouveia Dal Pino et al. (2010b) de Gouveia Dal Pino, E. M., Piovezan, P. P., & Kadowaki, L. H. S. 2010b, A&A, 518, 5
- de Gouveia Dal Pino et al. (2024) de Gouveia Dal Pino, E. M., Rodriguez-Ramirez, J. C., & del Valle, M. V. 2024, in prep.
- del Valle et al. (2016) del Valle, M. V., de Gouveia Dal Pino, E. M., & Kowal, G. 2016, MNRAS, 463, 4331
- Drake et al. (2010) Drake, J. F., Opher, M., Swisdak, M., & Chamoun, J. N. 2010, ApJ, 709, 963
- Drake et al. (2006) Drake, J. F., Swisdak, M., Che, H., & Shay, M. A. 2006, Nature, 443, 553
- Eyink et al. (2013) Eyink, G., Vishniac, E., Lalescu, C., et al. 2013, Nature, 497, 466
- Giannios et al. (2009) Giannios, D., Uzdensky, D. A., & Begelman, M. C. 2009, MNRAS, 395, L29
- Guo et al. (2016) Guo, F., Li, H., Daughton, W., Li, X., & Liu, Y.-H. 2016, Physics of Plasmas, 23, 055708
- Guo et al. (2019) Guo, F., Li, X., Daughton, W., et al. 2019, ApJ, 879, L23
- Guo et al. (2015) Guo, F., Liu, Y.-H., Daughton, W., & Li, H. 2015, ApJ, 806, 167
- Guo et al. (2020) Guo, F., Liu, Y.-H., Li, X., et al. 2020, Physics of Plasmas, 27, 080501
- Guo et al. (2023) Guo, F., Li, X., French, O., et al. 2023, Phys. Rev. Lett., 130, 189501
- Hoshino & Lyubarsky (2012) Hoshino, M., & Lyubarsky, Y. 2012, Space Sci. Rev., 173, 521
- Huang & Bhattacharjee (2016) Huang, Y.-M., & Bhattacharjee, A. 2016, The Astrophysical Journal, 818, 20. https://dx.doi.org/10.3847/0004-637X/818/1/20
- Jafari et al. (2018) Jafari, A., Vishniac, E. T., Kowal, G., & Lazarian, A. 2018, ApJ, 860, 52
- Kadowaki et al. (2021) Kadowaki, L. H. S., de Gouveia Dal Pino, E. M., Medina-Torrejón, T. E., Mizuno, Y., & Kushwaha, P. 2021, ApJ, 912, 109
- Kadowaki et al. (2015) Kadowaki, L. H. S., de Gouveia Dal Pino, E. M., & Singh, C. B. 2015, ApJ, 802, 113
- Kadowaki et al. (2018) Kadowaki, L. H. S., de Gouveia Dal Pino, E. M., & Stone, J. M. 2018, The Astrophysical Journal, 864, 52. https://dx.doi.org/10.3847/1538-4357/aad4ff
- Kilian et al. (2020) Kilian, P., Li, X., Guo, F., & Li, H. 2020, ApJ, 899, 151
- Kowal et al. (2011) Kowal, G., de Gouveia Dal Pino, E. M., & Lazarian, A. 2011, ApJ, 735, 102
- Kowal et al. (2012) —. 2012, Phys. Rev. Lett., 108, 241102
- Kowal et al. (2020) Kowal, G., Falceta-Gonçalves, D. A., Lazarian, A., & Vishniac, E. T. 2020, ApJ, 892, 50
- Kowal et al. (2009) Kowal, G., Lazarian, A., Vishniac, E. T., & Otmianowska-Mazur, K. 2009, ApJ, 700, 63
- Lazarian et al. (2020) Lazarian, A., Eyink, G. L., Jafari, A., et al. 2020, Physics of Plasmas, 27, 012305
- Lazarian & Vishniac (1999) Lazarian, A., & Vishniac, E. T. 1999, ApJ, 517, 700
- Lazarian et al. (2012) Lazarian, A., Vlahos, L., Kowal, G., et al. 2012, Space Sci. Rev., 173, 557
- Li et al. (2015) Li, X., Guo, F., Li, H., & Li, G. 2015, ApJ, 811, L24
- Liu et al. (2017) Liu, Y.-H., Hesse, M., Guo, F., et al. 2017, Phys. Rev. Lett., 118, 085101
- Lyubarsky & Liverts (2008) Lyubarsky, Y., & Liverts, M. 2008, ApJ, 682, 1436
- Lyutikov et al. (2018) Lyutikov, M., Komissarov, S., Sironi, L., & Porth, O. 2018, Journal of Plasma Physics, 84, 635840201
- Lyutikov et al. (2017) Lyutikov, M., Sironi, L., Komissarov, S. S., & Porth, O. 2017, Journal of Plasma Physics, 83, 635830602
- McKinney & Uzdensky (2012) McKinney, J. C., & Uzdensky, D. A. 2012, MNRAS, 419, 573
- Medina-Torrejón et al. (2021) Medina-Torrejón, T. E., de Gouveia Dal Pino, E. M., Kadowaki, L. H. S., et al. 2021, ApJ, 908, 193
- Medina-Torrejón et al. (2023) Medina-Torrejón, T. E., de Gouveia Dal Pino, E. M., & Kowal, G. 2023, ApJ, 952, 168
- Mignone et al. (2018) Mignone, A., Bodo, G., Vaidya, B., & Mattia, G. 2018, ApJ, 859, 13
- Murase et al. (2022) Murase, K., Mukhopadhyay, M., Kheirandish, A., Kimura, S. S., & Fang, K. 2022, ApJ, 941, L10
- Petropoulou et al. (2016) Petropoulou, M., Giannios, D., & Sironi, L. 2016, MNRAS, 462, 3325
- Puzzoni et al. (2022) Puzzoni, E., Mignone, A., & Bodo, G. 2022, MNRAS, 517, 1452
- Ripperda et al. (2017) Ripperda, B., Porth, O., Xia, C., & Keppens, R. 2017, MNRAS, 471, 3465
- Santos-Lima et al. (2020) Santos-Lima, R., Guerrero, G., de Gouveia Dal Pino, E. M., & Lazarian, A. 2020, arXiv e-prints, arXiv:2005.07775
- Santos-Lima et al. (2010) Santos-Lima, R., Lazarian, A., de Gouveia Dal Pino, E. M., & Cho, J. 2010, ApJ, 714, 442
- Singh et al. (2015) Singh, C. B., de Gouveia Dal Pino, E. M., & Kadowaki, L. H. S. 2015, ApJ, 799, L20
- Singh et al. (2016) Singh, C. B., Mizuno, Y., & de Gouveia Dal Pino, E. M. 2016, ApJ, 824, 48
- Sironi (2022) Sironi, L. 2022, Phys. Rev. Lett., 128, 145102
- Sironi et al. (2015) Sironi, L., Petropoulou, M., & Giannios, D. 2015, MNRAS, 450, 183
- Sironi & Spitkovsky (2014) Sironi, L., & Spitkovsky, A. 2014, ApJ, 783, L21
- Takamoto et al. (2015) Takamoto, M., Inoue, T., & Lazarian, A. 2015, ApJ, 815, 16
- Van Rossum & Drake (2009) Van Rossum, G., & Drake, F. L. 2009, Python 3 Reference Manual (Scotts Valley, CA: CreateSpace)
- Vicentin et al. (2024) Vicentin, G. H., Kowal, G., de Gouveia Dal Pino, E. M., & Lazarian, A. 2024, arXiv e-prints, arXiv:2405.15909
- Werner et al. (2019) Werner, G. R., Philippov, A. A., & Uzdensky, D. A. 2019, MNRAS, 482, L60
- Werner et al. (2018) Werner, G. R., Uzdensky, D. A., Begelman, M. C., Cerutti, B., & Nalewajko, K. 2018, MNRAS, 473, 4840
- Xu & Lazarian (2023) Xu, S., & Lazarian, A. 2023, ApJ, 942, 21
- Yuan et al. (2016) Yuan, Y., Nalewajko, K., Zrake, J., East, W. E., & Blandford, R. D. 2016, ApJ, 828, 92
- Zenitani & Hoshino (2001) Zenitani, S., & Hoshino, M. 2001, Apjl, 562, L63
- Zenitani & Hoshino (2007) —. 2007, ApJ, 670, 702
- Zenitani & Hoshino (2008) —. 2008, ApJ, 677, 530
- Zhang & Yan (2011) Zhang, B., & Yan, H. 2011, ApJ, 726, 90
- Zhang et al. (2018) Zhang, H., Li, X., Guo, F., & Giannios, D. 2018, ApJ, 862, L25
- Zhang et al. (2021) Zhang, H., Sironi, L., & Giannios, D. 2021, ApJ, 922, 261
- Zhang et al. (2023a) Zhang, H., Sironi, L., Giannios, D., & Petropoulou, M. 2023a, ApJ, 956, L36
- Zhang & Li (2015) Zhang, J., & Li, T. 2015, arXiv e-prints, arXiv:1512.06501
- Zhang et al. (2023b) Zhang, J.-F., Xu, S., Lazarian, A., & Kowal, G. 2023b, Journal of High Energy Astrophysics, 40, 1