Can sparse autoencoders make sense of latent representations?
Viktoria Schuster
Department of Computer Science University of Copenhagen
Abstract
Sparse autoencoders (SAEs) have lately been used to uncover interpretable latent features in large language models. Here, we explore their potential for decomposing latent representations in complex and high-dimensional biological data, where the underlying variables are often unknown. On simulated data we show that generative hidden variables can be captured in learned representations in the form of superpositions. The degree to which they are learned depends on the completeness of the representations. Superpositions, however, are not identifiable if these generative variables are unknown. SAEs can to some extent recover these variables, yielding interpretable features. Applied to single-cell multi-omics data, we show that an SAE can uncover key biological processes such as carbon dioxide transport and ion homeostasis, which are crucial for red blood cell differentiation and immune function. Our findings highlight how SAEs can be used in advancing interpretability in biological and other scientific domains.
1 Introduction
Neural networks have proven to be powerful tools for analyzing complex data, yet they often lack inherent interpretability from a human perspective. This limitation poses a significant challenge, especially when these models are employed to understand intricate datasets for tasks such as prediction or data generation (Rudin,, 2019). While various approaches have shown some success in improving model interpretability (Marcinkevičs and Vogt,, 2023; Räuker et al.,, 2023), they fall short of providing a comprehensive understanding of all learned features within a model (Rudin et al.,, 2022). Recent research has revealed that features in neural networks are often learned in a state of superposition (Elhage et al.,, 2022), where individual neurons encode multiple features (termed ”polysemanticity”), and single features are distributed across multiple neurons. This phenomenon is heavily dependent on the underlying data structure (Elhage et al.,, 2022). In light of this complexity, sparse autoencoders (SAEs) (Olshausen and Field,, 1997) have emerged as a promising tool for enhancing the interpretability of entire neural network layers (Sharkey et al.,, 2022; Bricken et al.,, 2023; Huben et al.,, 2023; Gao et al.,, 2024). The application of SAEs to large language model layers has demonstrated remarkable success in reducing polysemanticity, effectively translating language model activation superpositions into singular, monosemantic features within the SAE’s hidden space (Sharkey et al.,, 2022; Bricken et al.,, 2023; Huben et al.,, 2023; Gao et al.,, 2024). However, it is crucial to note that these findings have primarily been limited to language models and transformer architectures. Given that superpositions are strongly influenced by data structure (Elhage et al.,, 2022), there is a pressing need to extend this approach to different types of hidden streams and data domains.
One relevant and complex data domain is that of biology and health. This field presents a wealth of complex data and machine learning applications (Senders et al.,, 2018; Lima et al.,, 2021; Zhang et al.,, 2022; Corti et al.,, 2023; Pun et al.,, 2023; Habineza et al.,, 2023). Improved understanding of the data could significantly enhance our ability to address diseases and other biological challenges. Moreover, interpretability is very important in biological and medical applications, where trustworthiness is essential for prediction and intervention (Azodi et al.,, 2020; Farrell et al.,, 2022; Conard et al.,, 2023). Machine learning applications in these fields often focus on outcome prediction (Corti et al.,, 2023) or representation learning (Kopf and Claassen,, 2021). In both scenarios, it is critical to understand what the model has learned from the data, how it makes decisions, and whether the complexity reduction truly aids in meaningful analysis or merely facilitates visualization for sample comparison.
In this work, we investigate the potential of recovering hidden information about generative variables in biological data using SAEs. We begin by examining a small simulated dataset inspired by gene regulatory networks. Subsequently, we demonstrate a real-world application on latent representations derived from high-dimensional single-cell data. In summary, this work represents an important step towards improving the usability and trustworthiness of artificial intelligence (AI) in biology and health through the lens of interpretability. By demonstrating that meaningful features can be learned and applied to the analysis of biological processes, we open new avenues for leveraging machine learning techniques in the life sciences without compromising on interpretability.
2 Related work
The application of SAEs and dictionary learning in general has attracted significant attention in the field of natural language processing (Sharkey et al.,, 2022; Bricken et al.,, 2023; Huben et al.,, 2023; Gao et al.,, 2024). Recent research has demonstrated the efficacy of these methods in uncovering fine-grained features within language models, such as identifying hierarchical semantic structures (Yun et al.,, 2021), specific scriptures (Bricken et al.,, 2023), and causal features of object identification (Huben et al.,, 2023). Others have presented improvements in the tradeoff between sparsity and reconstruction, reduced the occurrence of dead neurons, and developed metrics for evaluating feature quality based on hypothesized features (Gao et al.,, 2024). While much of the focus has been on language models, efforts to enhance interpretability have extended to other architectural domains. Bau et al., (2017) developed a method for scoring convolutional activations based on pre-defined visual concepts, thereby enhancing our understanding of learned visual features. Esser et al., (2020) proposed a technique for translating representations onto pre-defined semantic concepts applicable to various architectures. However, this approach necessitates learning semantic features by creating paired training examples to determine similarity (Esser et al.,, 2020). Taking a different approach, Crabbe et al., (2021) explored the decomposition of latent representations as mixtures of representations from a defined corpus.
In contrast to these advancements, the application of SAEs to the field of biology has been limited. To the best of our knowledge, dictionary learning has primarily been employed as a direct method for learning sparser representations (Rams and Conrad,, 2022; Lopez et al.,, 2023; Hao et al.,, 2024) or aligning representations more closely with specific biological concepts, such as pathways (Karagiannaki et al.,, 2023). More commonly, efforts to enhance the interpretability of biological representations have focused on disentanglement. Disentanglement is often applied to separate technical bias from biological signal through approaches such as adversarial training (Guo et al.,, 2022), sparsity-inducing priors (Lopez et al.,, 2023), overcomplete autoencoders (Zhang et al.,, 2022), or architectural modularity (Piran et al.,, 2024).
This highlights a significant gap in the application of advanced interpretability techniques to biological data. While these methods have shown great promise in language models and other domains, their potential for uncovering meaningful features in biological representations remains largely unexplored. Our work aims to address this gap by presenting a first step in applying and adapting these techniques to the unique challenges presented by biological datasets. We present an evaluation of different SAE setups on simulated data and demonstrate the extraction of useful features in the context of single-cell data analysis.
3 Sparse autoencoders
In representation learning, data is generally assumed to exist on a lower-dimensional manifold due to dependencies between features (Bengio et al.,, 2013). Reducing the dimensionality into a latent representation through unsupervised learning can help reveal underlying structure. With a different constraint than dimensionality, data structure can also be revealed in a higher-dimensional setting, by employing sparsity constraints on the latent representation (Olshausen and Field,, 1997). This has lately been exploited to disentangle the polysemanticity of hidden layers in large language models (Sharkey et al.,, 2022; Bricken et al.,, 2023; Huben et al.,, 2023; Gao et al.,, 2024).
3.1 Vanilla SAE
The simplest SAE maps an input to a higher-dimensional hidden activation vector and back, with an additional objective to promote sparsity in the activation space. The encoder is defined as
| (1) |
and the decoder as
| (2) |
with and indicating encoder and decoder parameter sets, respectively. The difference in this simple SAE is that there is no pre-network bias compared to Bricken et al., (2023).
The loss is given by
| (3) |
where the first term is the mean squared error (MSE) loss for reconstruction, and the second term is the sparsity penalty in the form of an loss weighed by hyperparameter , which we will refer to as the weight.
3.2 Other SAE setups
A widely used version of the SAE uses an additional pre-network bias term applied to before encoding (Bricken et al.,, 2023), which has shown to improve performance (Elhage et al.,, 2022).
| (4) |
k-sparse autoencoders additionally use a different activation function (TopK) to directly control the number of active neurons (removing the need for the L1 loss) (Makhzani and Frey,, 2014).
| (5) |
The latest advance in SAE research has been to reduce the number of dead hidden neurons by initializing encoder and decoder as transposes of each other and including dead neurons in an auxiliary loss (Gao et al.,, 2024).
4 Single-cell data
Single-cell data is of particular interest to the biological research community due to its potential to provide valuable insights into cellular functions and malfunctions within the human body. However, the high dimensionality and noise inherent in this data present significant analytical challenges (Kharchenko,, 2021; Lähnemann et al.,, 2020; Heumos et al.,, 2023). Single-cell data referenced in this work is derived from measurements of two important processes in the cell (Ogbeide et al.,, 2022): gene expression (Aldridge and Teichmann,, 2020) and chromatin accessibility (Buenrostro et al.,, 2013). Chromatin accessibility, although not addressed in the analysis of the model here, provides important information about whether chromatin is open and thus accessible to the transcription machinery and regulatory molecules. Gene expression is a central process of cellular function. It describes the process of DNA being transcribed into RNA, which can then be translated into proteins. Both gene expression and chromatin accessibility are measured in a cell and result in count matrices of genes and chromatin regions, respectively (Ogbeide et al.,, 2022). Several generative models have been suggested to model this data and produce lower-dimensional representations for analysis (Heumos et al.,, 2023; Argelaguet et al.,, 2021; Xu et al.,, 2021; Lopez et al.,, 2018; Ashuach et al.,, 2023; Lin et al.,, 2022; Stark et al.,, 2020; Yang et al.,, 2021; Zuo and Chen,, 2021; Zuo et al.,, 2021; Minoura et al.,, 2021). In this work, we focus on a pre-trained model with structured representations of this data from human bone marrow (Schuster et al.,, 2023).
5 Experiments
5.1 Simulation
5.1.1 Data generation
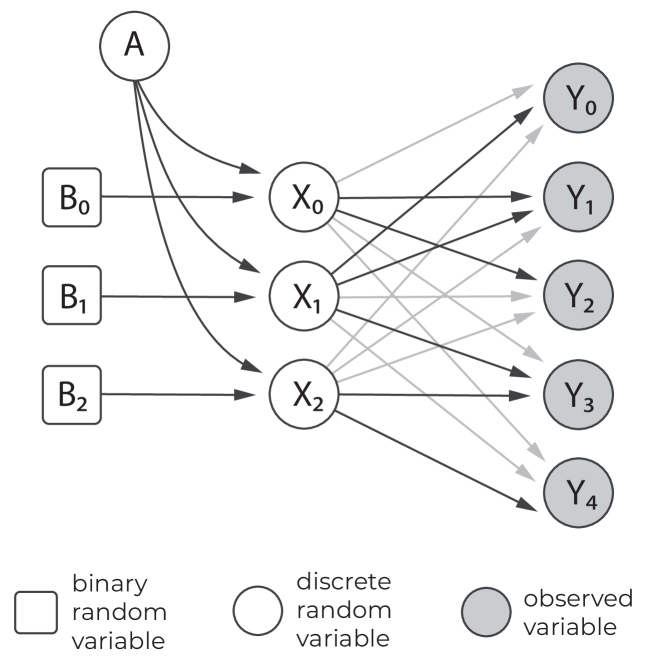
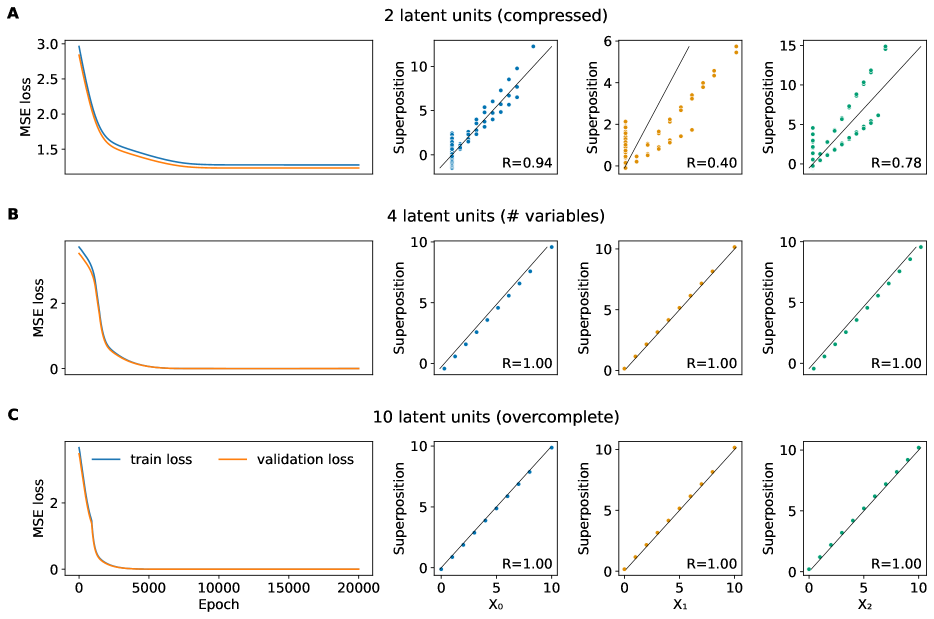
For an analytical assessment of SAEs for the interpretability of biological neural networks (NNs) and in particular latent representations, we simulated data inspired by gene regulatory networks. As shown in Figure 1, the observed data are generated by random variables and a binary matrix . The three hidden random variables are dependent on three Bernoulli variables with probabilities , respectively, and a Poisson variable with a lambda of determining the ”activity” in a sample. The binary regulatory matrix is realistically depicted in Figure 1. We sampled 10000 train and 2000 validation samples.
5.1.2 Learning representations
In order to learn latent representations encoding data information in superpositions, we trained a single-layer autoencoder on . The autoencoder has an input size of and a latent dimension of , no activation on the latent and a ReLU activation on the output. We trained for 20000 epochs using the Adam optimizer (Kingma and Ba,, 2014) with a learning rate of and MSE loss. We extracted the latent representations for analysis and computed the superpositions of the generative variables in this (theoretically) complete space through linear regression. We also under- and overcomplete autoencoders with two layers to evaluate the learning of data variables in superposition.
5.1.3 Sparse autoencoder architectures
We investigated three different sparse autoencoders in this work: ”Vanilla”, the SAE from Bricken et al., (2023) that is referred to as ”ReLU”, and ”TopK” (Gao et al.,, 2024).
The ”Vanilla” SAE presents the simplest version of an SAE as described in Section 3.1. It is similar to the SAE from Bricken et al., (2023) without the pre-network bias and with standard initialization of the biases. It consists of a linear layer mapping from latent to a larger hidden space including ReLU activation to ensure positive activations, and a mapping back into latent space. The loss term consisted of MSE loss and a weighted norm on the encodings (Bricken et al.,, 2023).
5.1.4 SAE hyperparameter evaluation
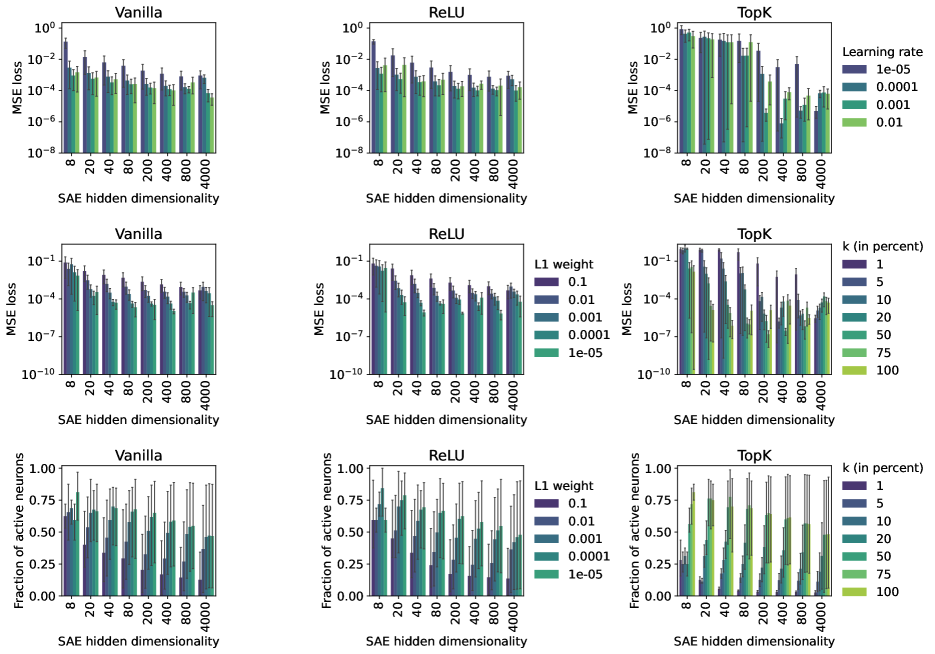
We trained the different SAE architectures on varying hidden dimensionalities (latent size multiplied with a hidden sparsity factor ), learning rates , and weights for 500 epochs. In the case of TopK SAEs, the sparsity is controlled by , which we tested as percentages of the hidden dimension. For each instance, we computed the following metrics:
-
–
number of active hidden neurons (activity determined by activations of )
-
–
number of redundant hidden neurons (neurons that fire with other neurons with a Pearson correlation )
-
–
average number of neurons firing per sample
-
–
average number of neurons corresponding to a given data variable (determined by Pearson correlation )
-
–
highest Pearson correlation between a neuron and a given data variable
5.2 Example: Finding features in a single-cell model
5.2.1 Extracting representations
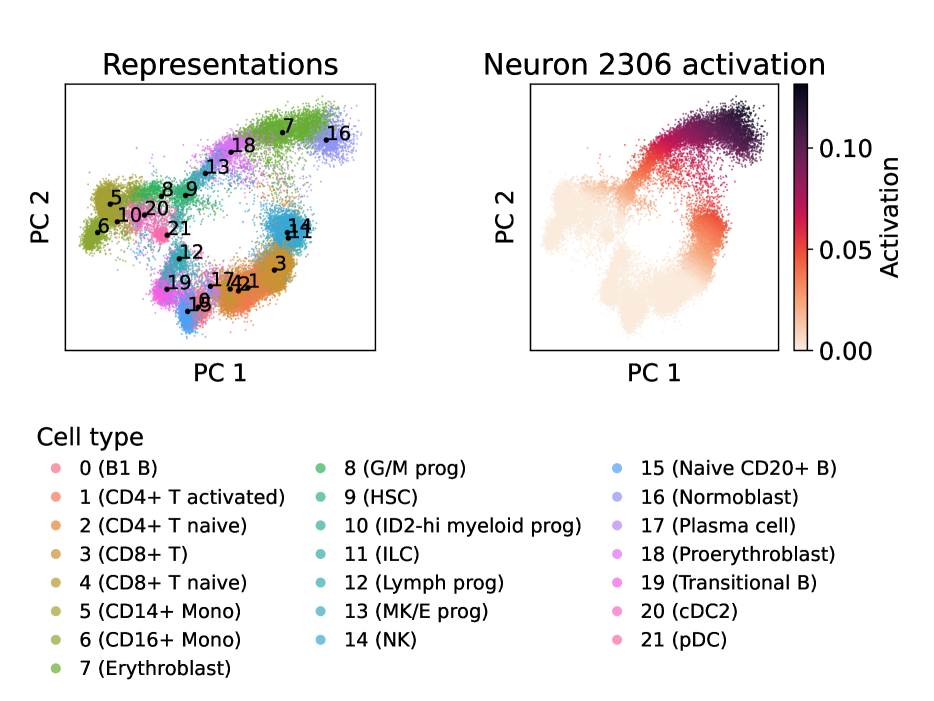
Representations were extracted from a model with well-structured latent representations (Schuster et al.,, 2023) trained on single-cell multi-omics data from human bone marrow (Luecken et al.,, 2021). The data consists of cells with genes and accessibility peaks and the latent dimensionality of the model is . The paper presenting this model highlighted the structure of the latent space, especially with regard to the clear trajectory of differentiation from stem cells to red blood cells (erythrocytes) (Schuster et al.,, 2023). The pre-trained model and data were downloaded as instructed by Schuster et al., (2023).
5.2.2 SAE training
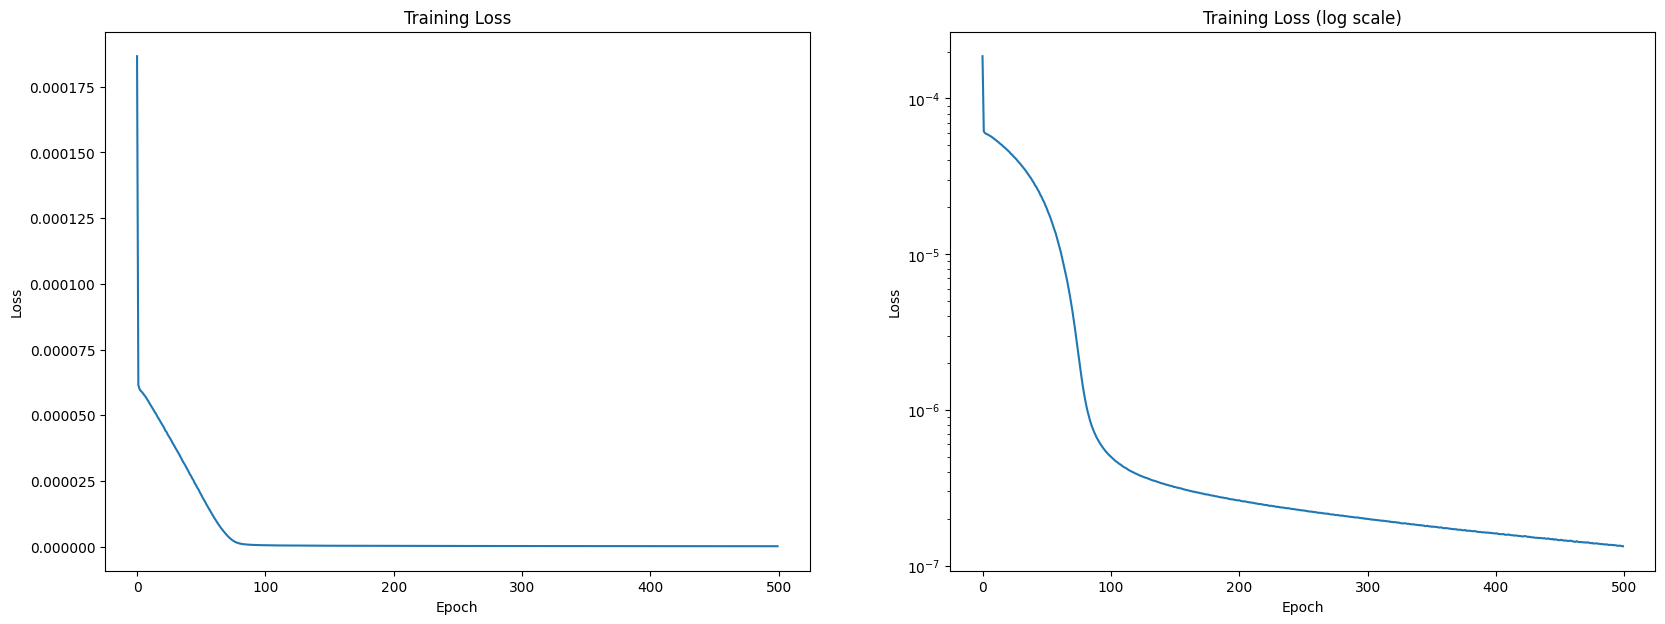
We chose to increase the hidden dimension of the SAE to 500-fold (10000 neurons) based on our insights from the simulation experiments, favoring redundant features over a lack of sensitivity. We trained a vanilla SAE for 500 epochs with a learning rate of and an weight of (see loss curves in Supplementary Figure 9).
5.2.3 Feature identification
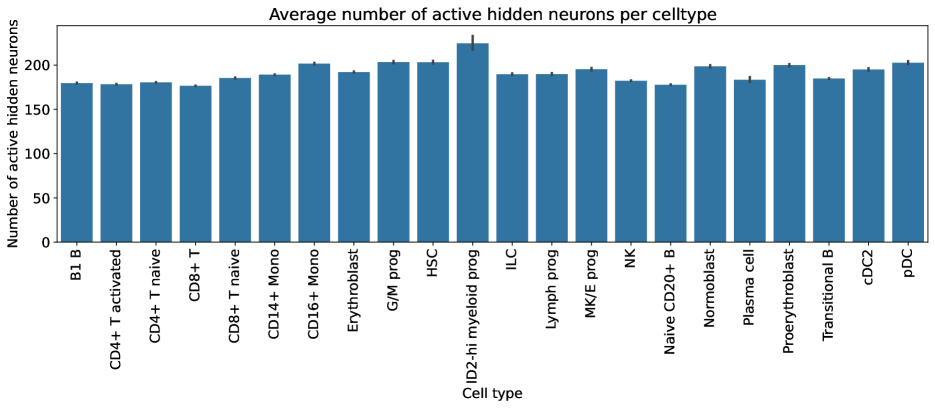
Out of the 10000 hidden neurons, 5318 were active (activation threshold ) and 185.7 neurons fired on average per sample (cell). We computed the average activation per active neuron over cell types (annotation available in the data) and created a rule set to identify potential features of red blood cell differentiation:
-
1.
The average activation must be higher in the red blood cell line than in other cell types.
-
2.
Average activations must consistently increase from the stem cells to the final differentiation stage of red blood cells.
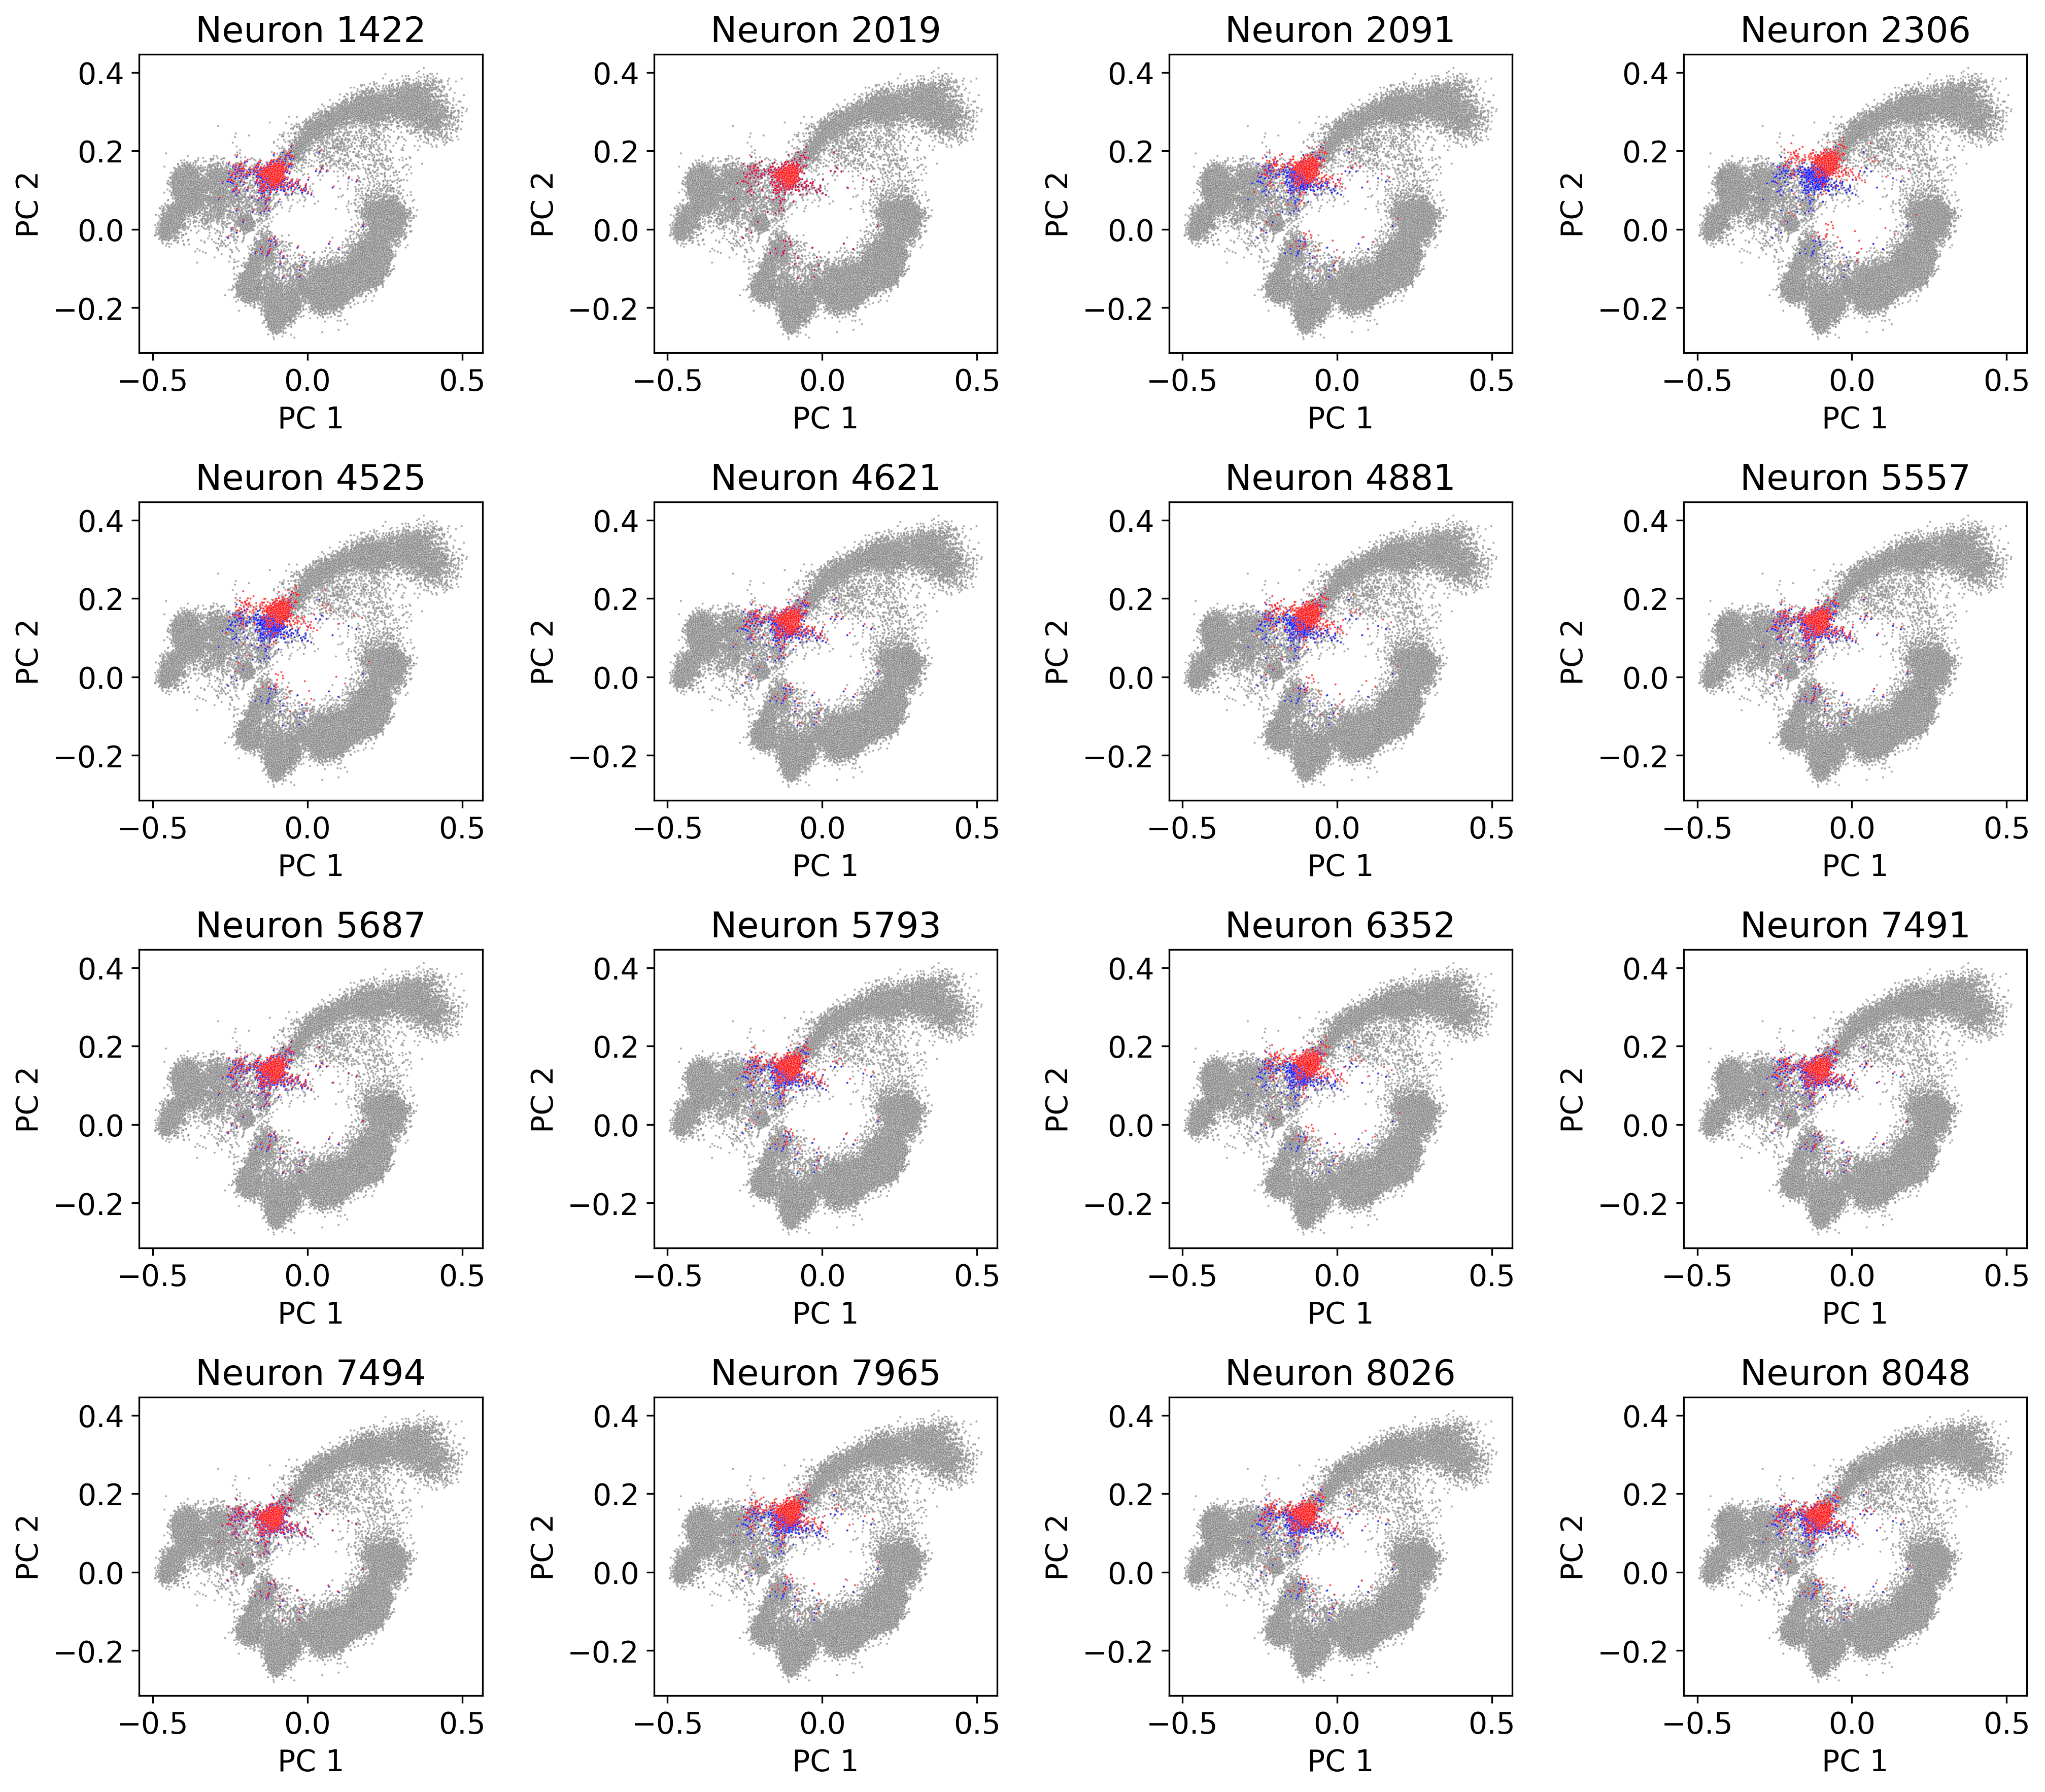
Applying this rule set provided neurons as potential features. We inspected these neurons visually in terms of cell-wise activations and tested which ones would result in the largest shift in latent space towards differentiated cells when maximizing the neuron’s activations in stem cells (Supplementary Figure 13). See the next section for details on perturbations. This gave us neuron as the most promising candidate feature.
5.2.4 Perturbations and group identification
After identifying a candidate feature for red blood cell differentiation, we wanted to go deeper into its meaning. Cellular differentiation consists of many biological processes and is very broad. If SAEs could narrow down the exact biological processes underlying cellular changes, this could be extremely useful for biological research and analysis of the vastly growing data.
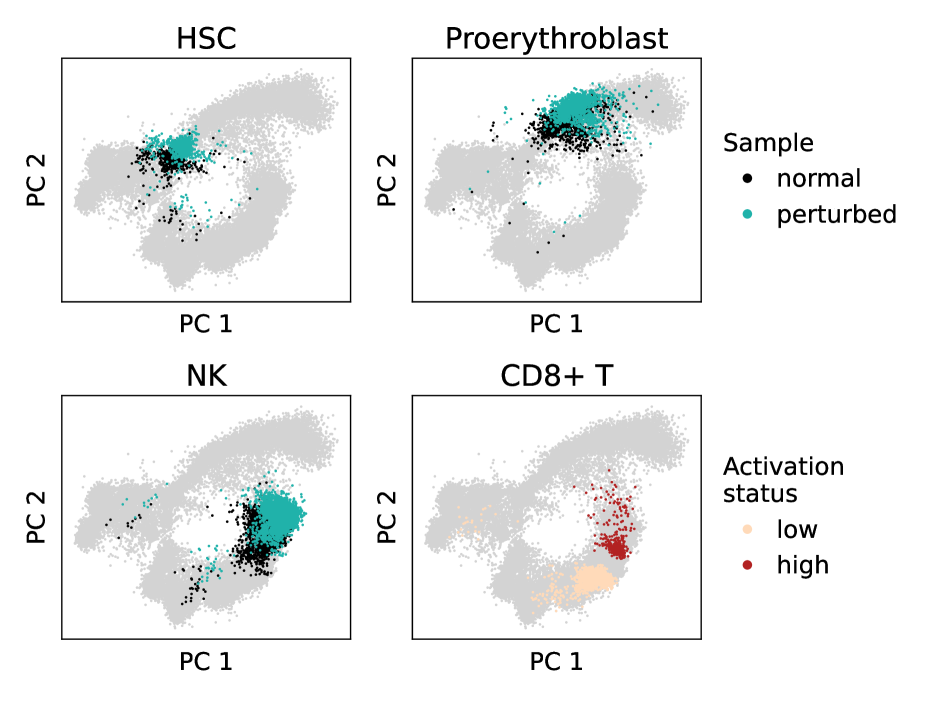
We therefore performed perturbation experiments on the SAE activations. Perturbations were achieved by computing a representation’s SAE activations, maximizing the activation of the feature of interest, and predicting the perturbed representations. We did this for all representations from hematopoietic stem cells (HSC), proerythroblasts, and natural killer (NK) cells as the feature was moderately active in these as well. Activity of feature was quite heterogeneous in CD8+ T cells We thus computed the and percentiles of the CD8+ T activations to group the cells into ”low” and ”high” activation.
This resulted in four groups to investigate in terms of the effects of feature from different cell types and locations in the representations. We describe them either as ”perturbed-vs-normal” (for HSC, proerythroblast, and NK cells) or ”high-vs-low” (for CD8+ T cells).
5.2.5 DEG and GO term analysis
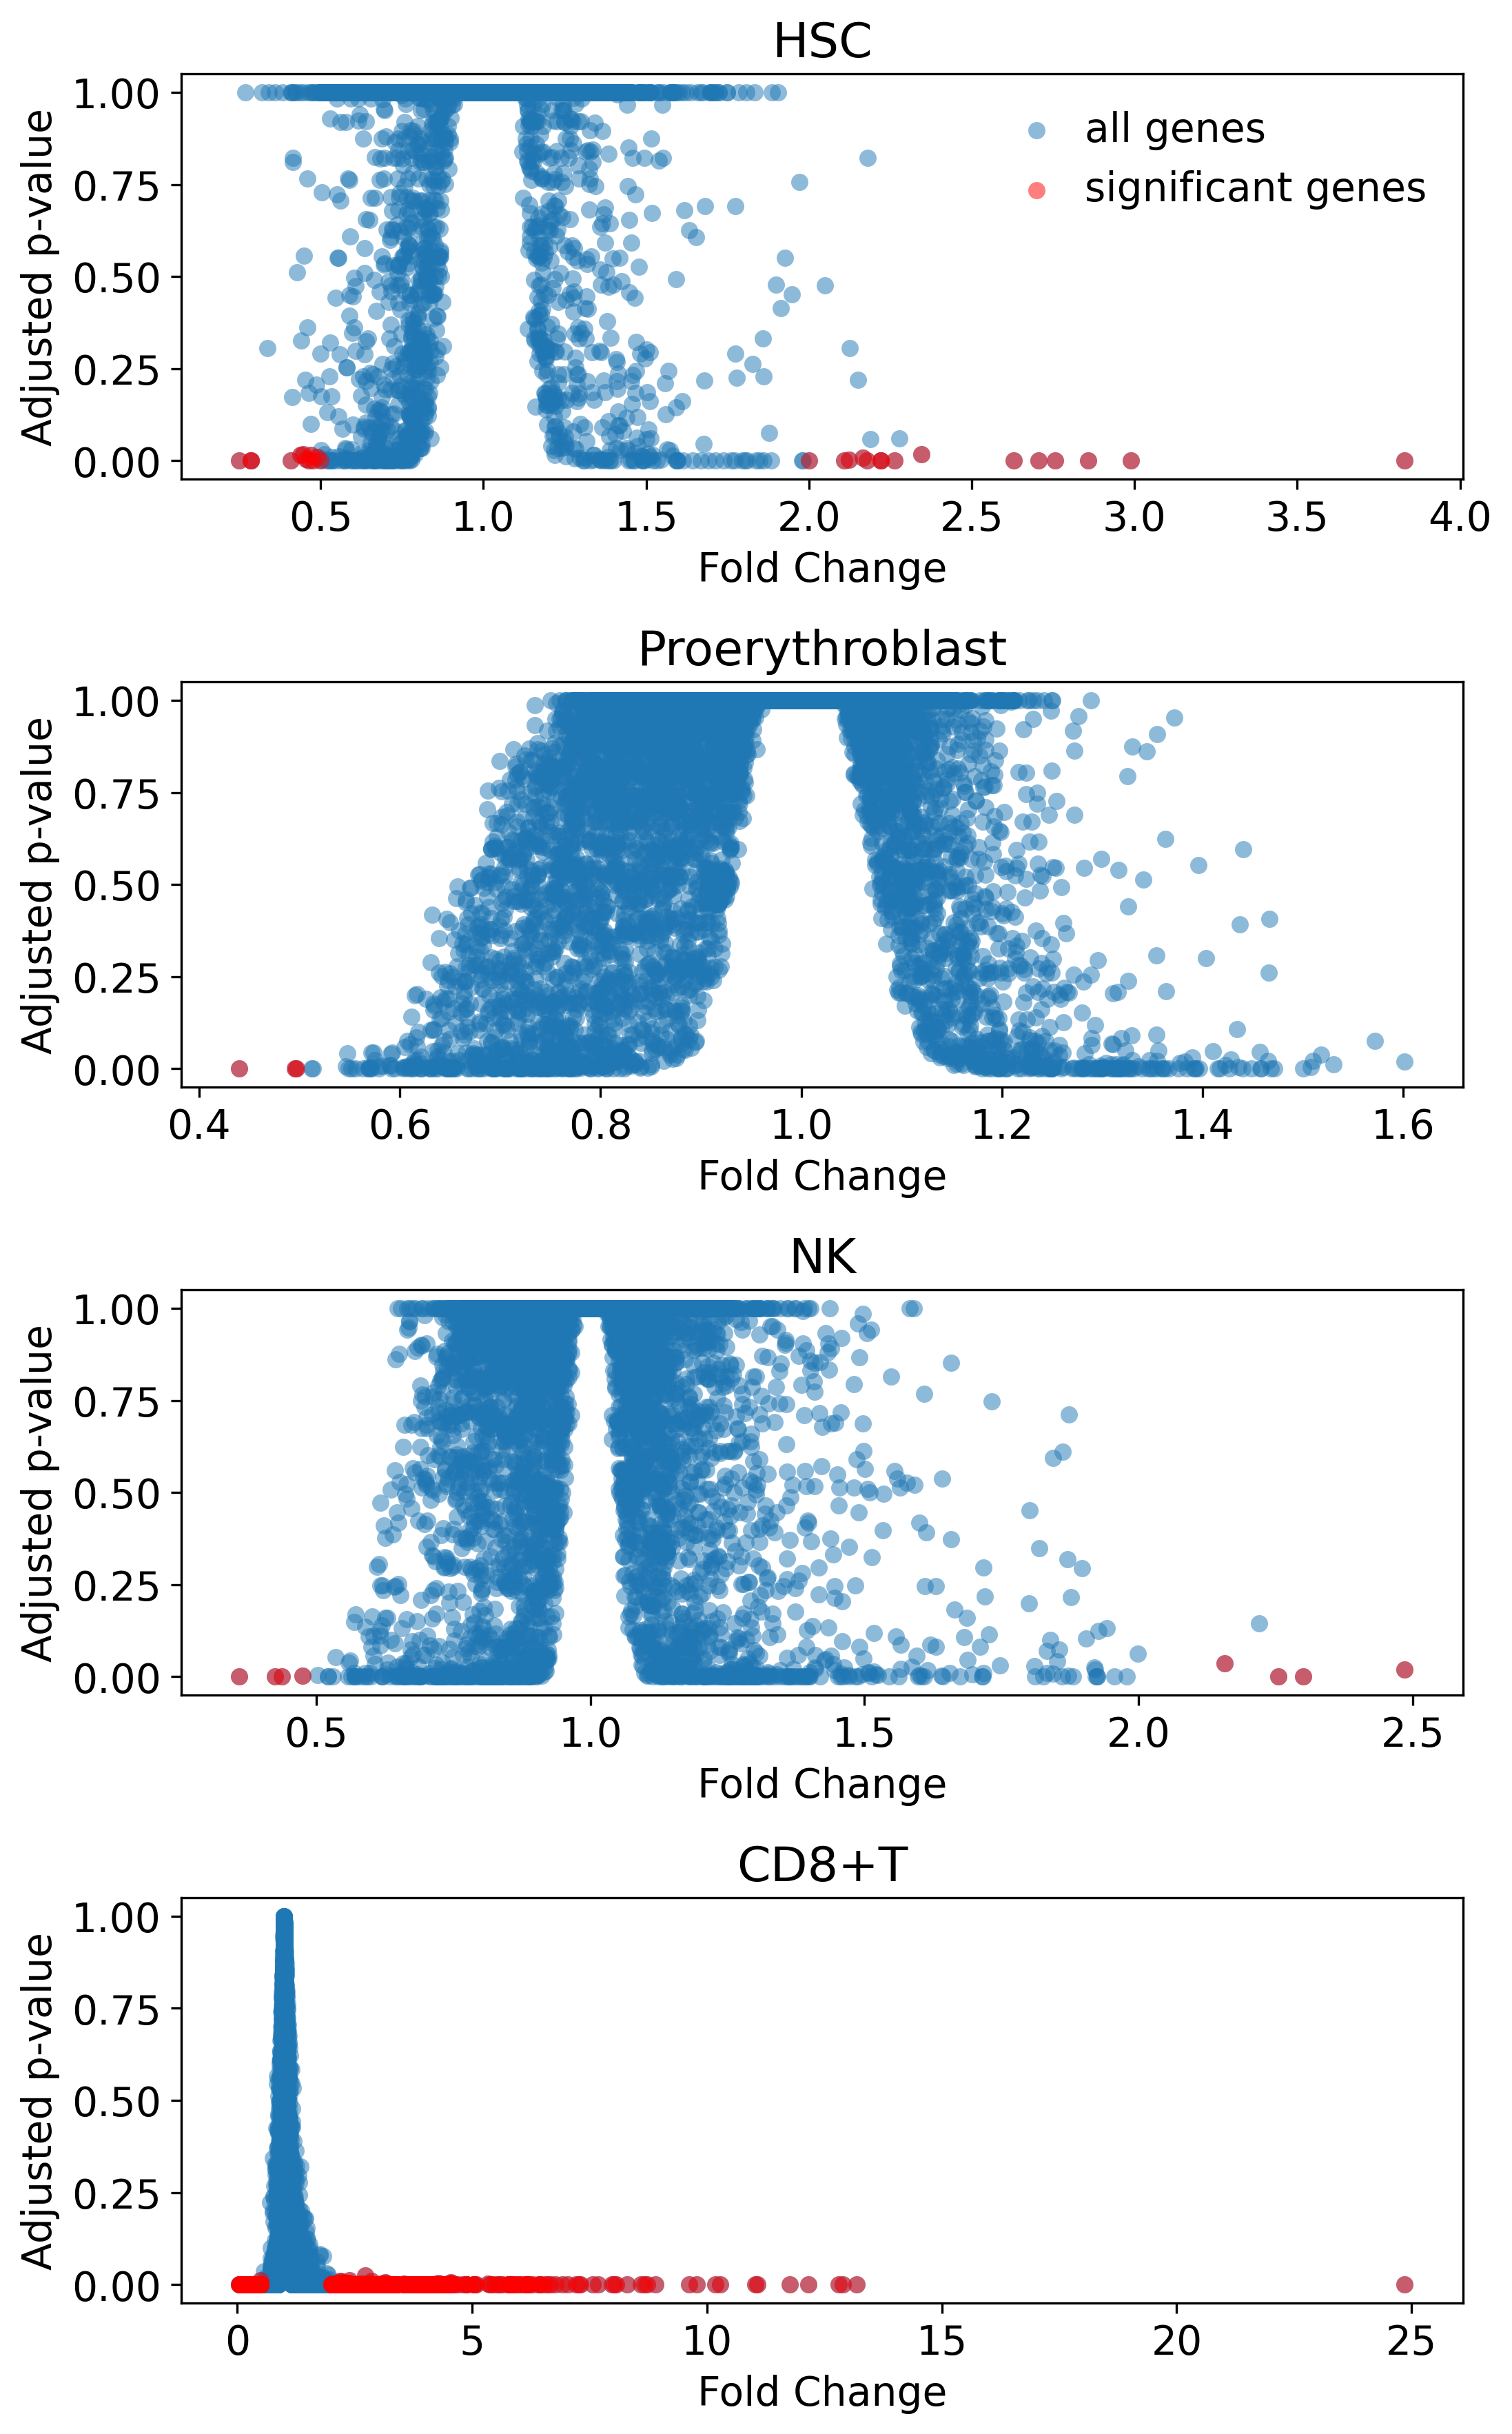
We investigated the four groups in terms of relevant changes to gene expression through differential gene expression analysis (DEG). In the case of our ”perturbed-vs-normal” paired samples, this was done with negative binomial generalized linear models as is common in biological data analysis (Anders and Huber,, 2010; Love et al.,, 2014). We report the resulting p-values and fold changes from the models. For the unpaired ”high-vs-low” comparison, we performed t-tests between the groups for each gene and calculated the fold change based on mean expression. We computed corrected p-values based on multi-test correction with Benjamini/Hochberg correction for non-negative values (Benjamini and Hochberg,, 1995) for all experiments.
In order to identify biological processes related to the differentially expressed genes, we filtered the genes by adjusted p-values (threshold ) and in the case of CD8+ T cells also fold change (10-fold and inverse) to get as highly specific processes as possible. Biological processes related to the resulting gene sets were identified through gene ontology (GO) term analysis (Ashburner et al.,, 2000; The Gene Ontology Consortium et al.,, 2023).
5.3 Compute infrastructure
All computations were performed using Python on CPU and one of the NVIDIA A30 GPUs of an institution server.
6 Results
6.1 Simulation
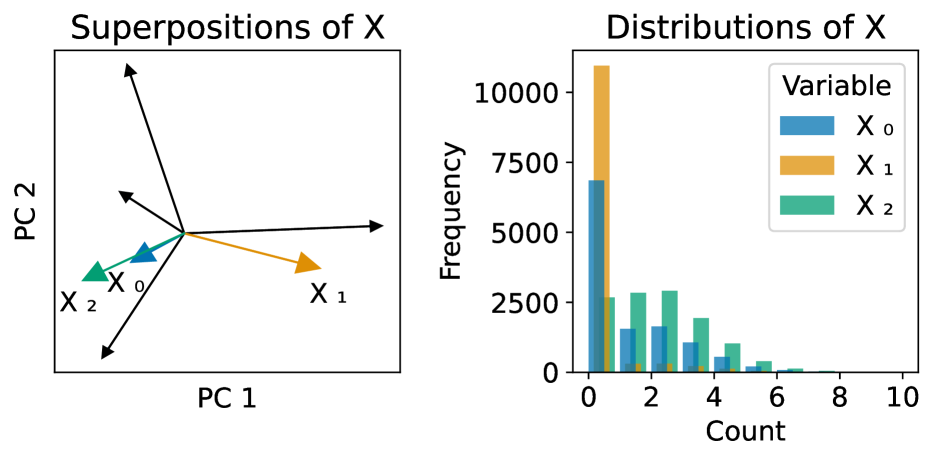
(Over)complete autoencoders can learn perfect reconstructions of the data as well as the underlying random variables. However, these are often hidden in superposition (see Figure 2). A bottleneck smaller than the number of generative variables can lead to interference and thus no perfectly correlating superpositions (Supplementary Figure 1). If these generative variables are unknown, as is typically the case in biological settings, they cannot be identified in the model. As recent use cases of SAEs are mainly limited to the activations of large language models, we present an analysis of some common SAEs in a simulated setting, where the underlying variables are known. We here investigate ”Vanilla”, ”ReLU” (Bricken et al.,, 2023), and ”TopK” (Gao et al.,, 2024) SAE architectures.
6.1.1 Performance comparison
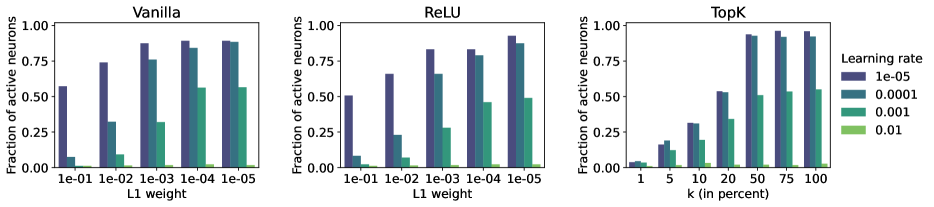
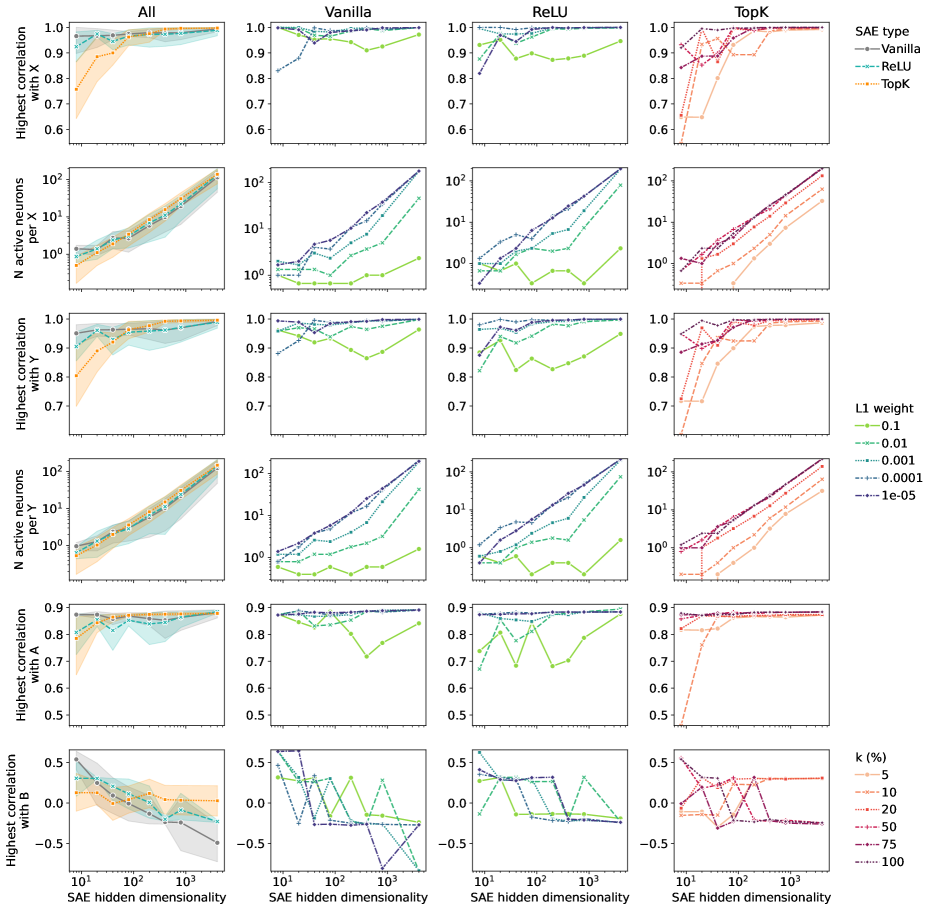
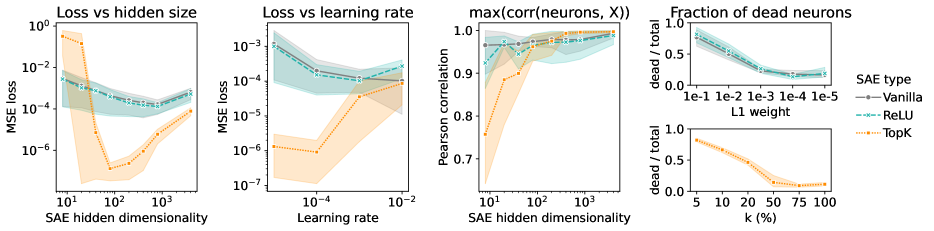
We first investigated the effect of the number of hidden neurons and sparsity penalties on the quantity and quality of learned features. The reconstruction losses of Vanilla and ReLU SAEs were more robust compared to TopK activation with respect to hidden dimensionality and learning rate. However, for larger hidden dimensions and small learning rates, TopK outperformed the other SAEs on reconstruction (Figure 3). Similar behaviors were found regarding the performance over sparsity. The TopK models seemed to perform best when was set to % of the hidden dimensionality (Supplementary Figure 2). Regarding the fraction of dead neurons in the SAE hidden space, weights above and a below % resulted in strong increases in dead neurons (Figure 3). However, we also found the sparsity and fraction of dead/active neurons to strongly depend on the learning rate (Supplementary Figure 3), and thus continued with the overall best-performing learning rate of .
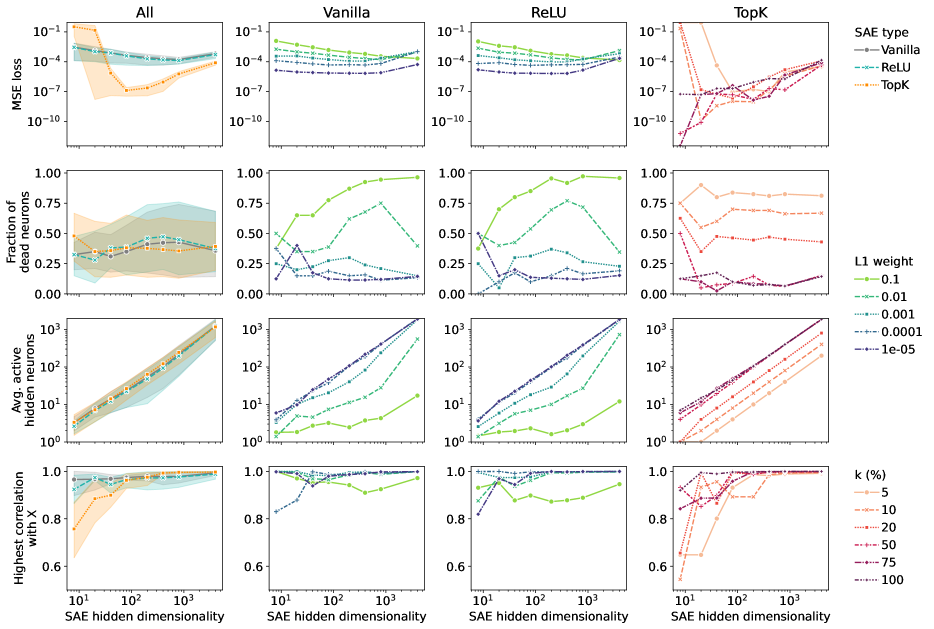
As we saw with the loss, a small hidden size can be detrimental to the performance and interpretability of TopK models. This was also the case for recovering hidden variables of the data among the SAE neurons (Figure 3, Supplementary Figure 5). In terms of high correlation with little redundancy for variables and , the Vanilla model showed the best tradeoff and TopK the worst (Supplementary Figures 6,7). Very small and large weights did not contribute to the highest-ranking models. The best performing Vanilla models used weights of ( for ReLU) with hidden dimensionalities of times the size of the latent space (for highest correlations and 1-5 neurons per variable). TopK models did best in this setting with between and % of the hidden size and a hidden dimensionality of times the latent size.
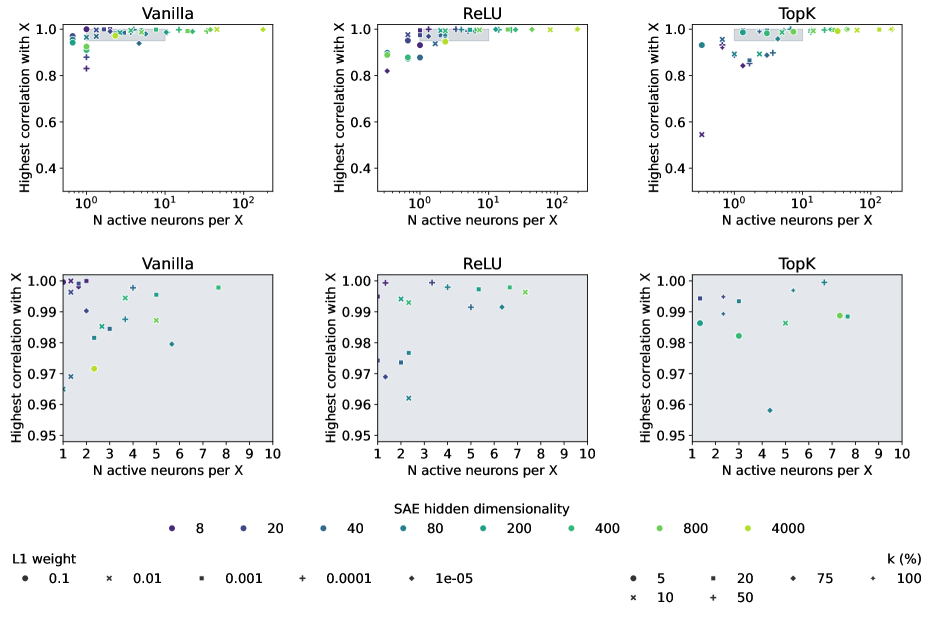
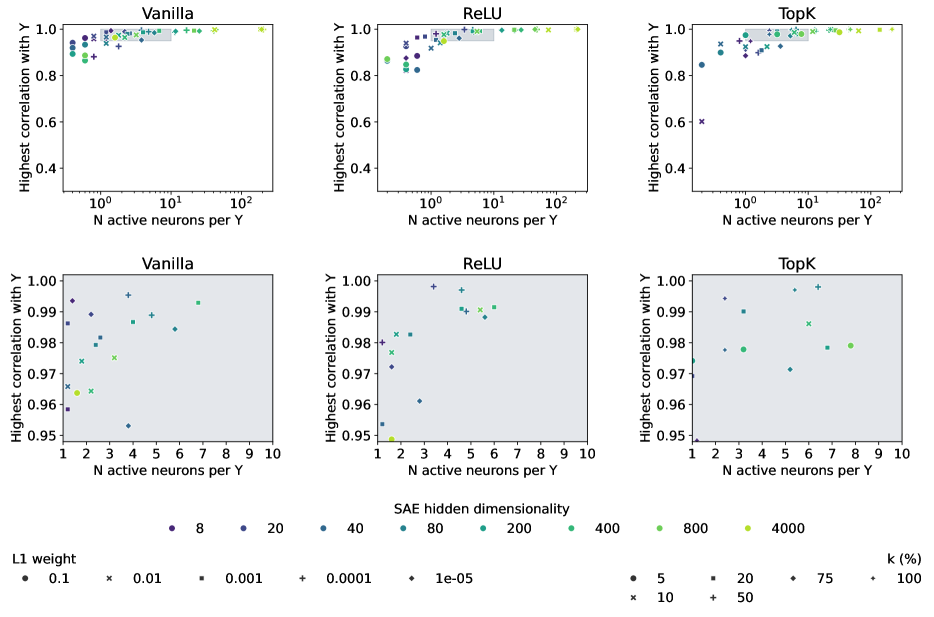
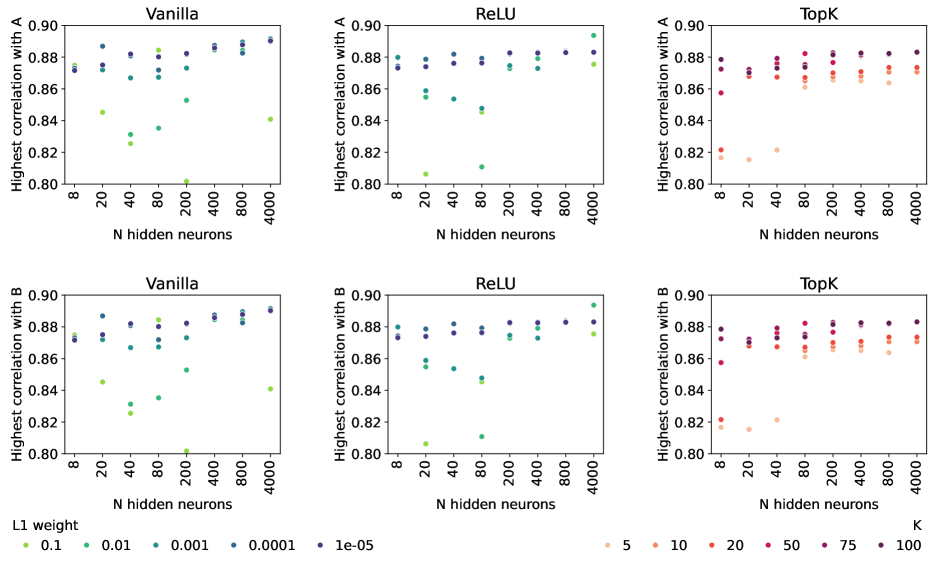
6.1.2 Variable recovery
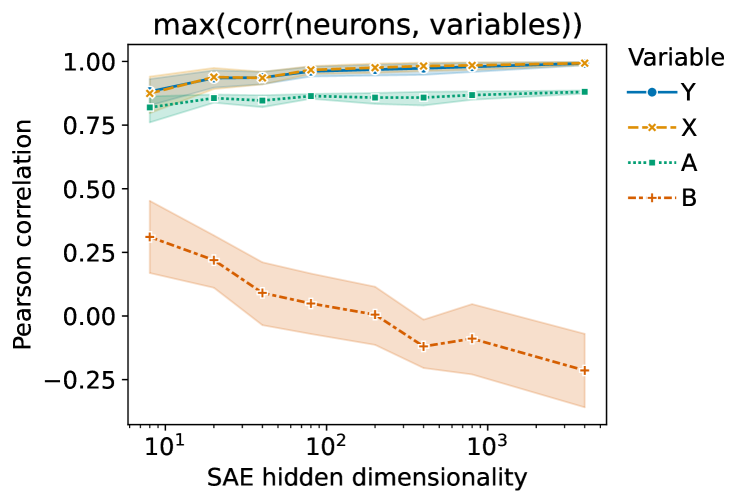
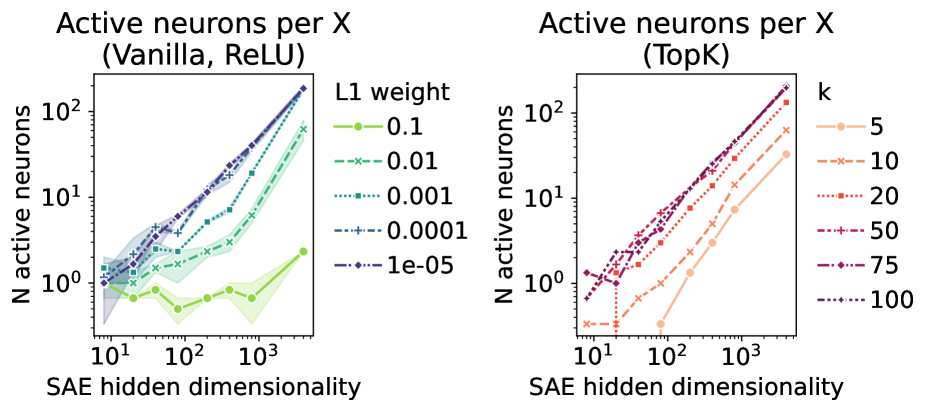
We measured the recovery of a given variable as the correlation between that variable and SAE neuron activations. Figure 4 shows the correlations of the best matching neurons over simulation variables. Overall, we found that observed variables and hidden variables could be nearly perfectly recovered, especially for larger hidden dimensionalities. The generative random variables and , however, are not directly represented by individual SAE features. This shows a potential limitation of SAEs in identifying variables that lack strong regulatory structure in the data and are thus difficult to decompose. While tendencies with respect to variable recovery were similar among the different SAE types, this was not the case for the number of features per variable. The number of features per variable scaled roughly exponentially for the k-sparse autoencoder (TopK) over the hidden dimension irrespective of (Figure 5). For Vanilla and ReLU SAEs, there is no such uniform scaling and the weight strongly determines the rate at which the number of neurons per variable grow. Very small weights approach exponential behavior, while strong sparsity constraints keep the number of corresponding features very low.
6.2 Example: Finding features in a single-cell model
In order to test and demonstrate potential benefits of SAEs for improving the interpretability of biological representations, we applied the Vanilla SAE onto the latent representations of a model trained on single-cell data from human bone marrow (Luecken et al.,, 2021). This latent variable model presented a well-structured latent space with a clear trajectory of cell types along red blood cell differentiation (Schuster et al.,, 2023). We thus investigated what SAE features could tell us about this process.
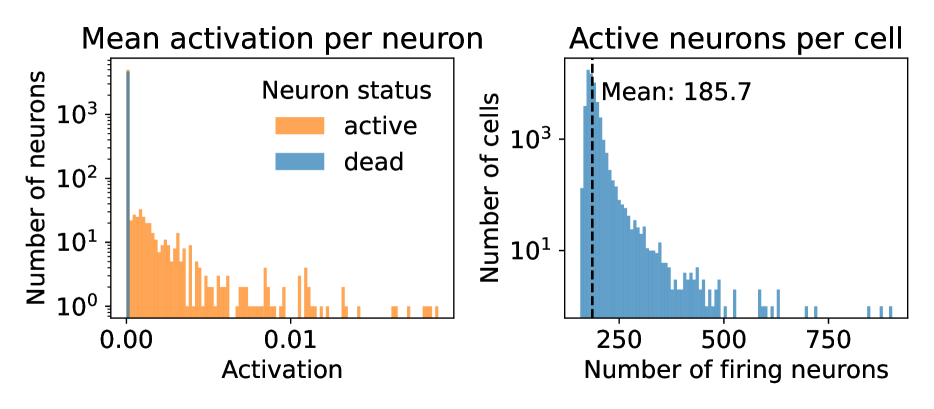
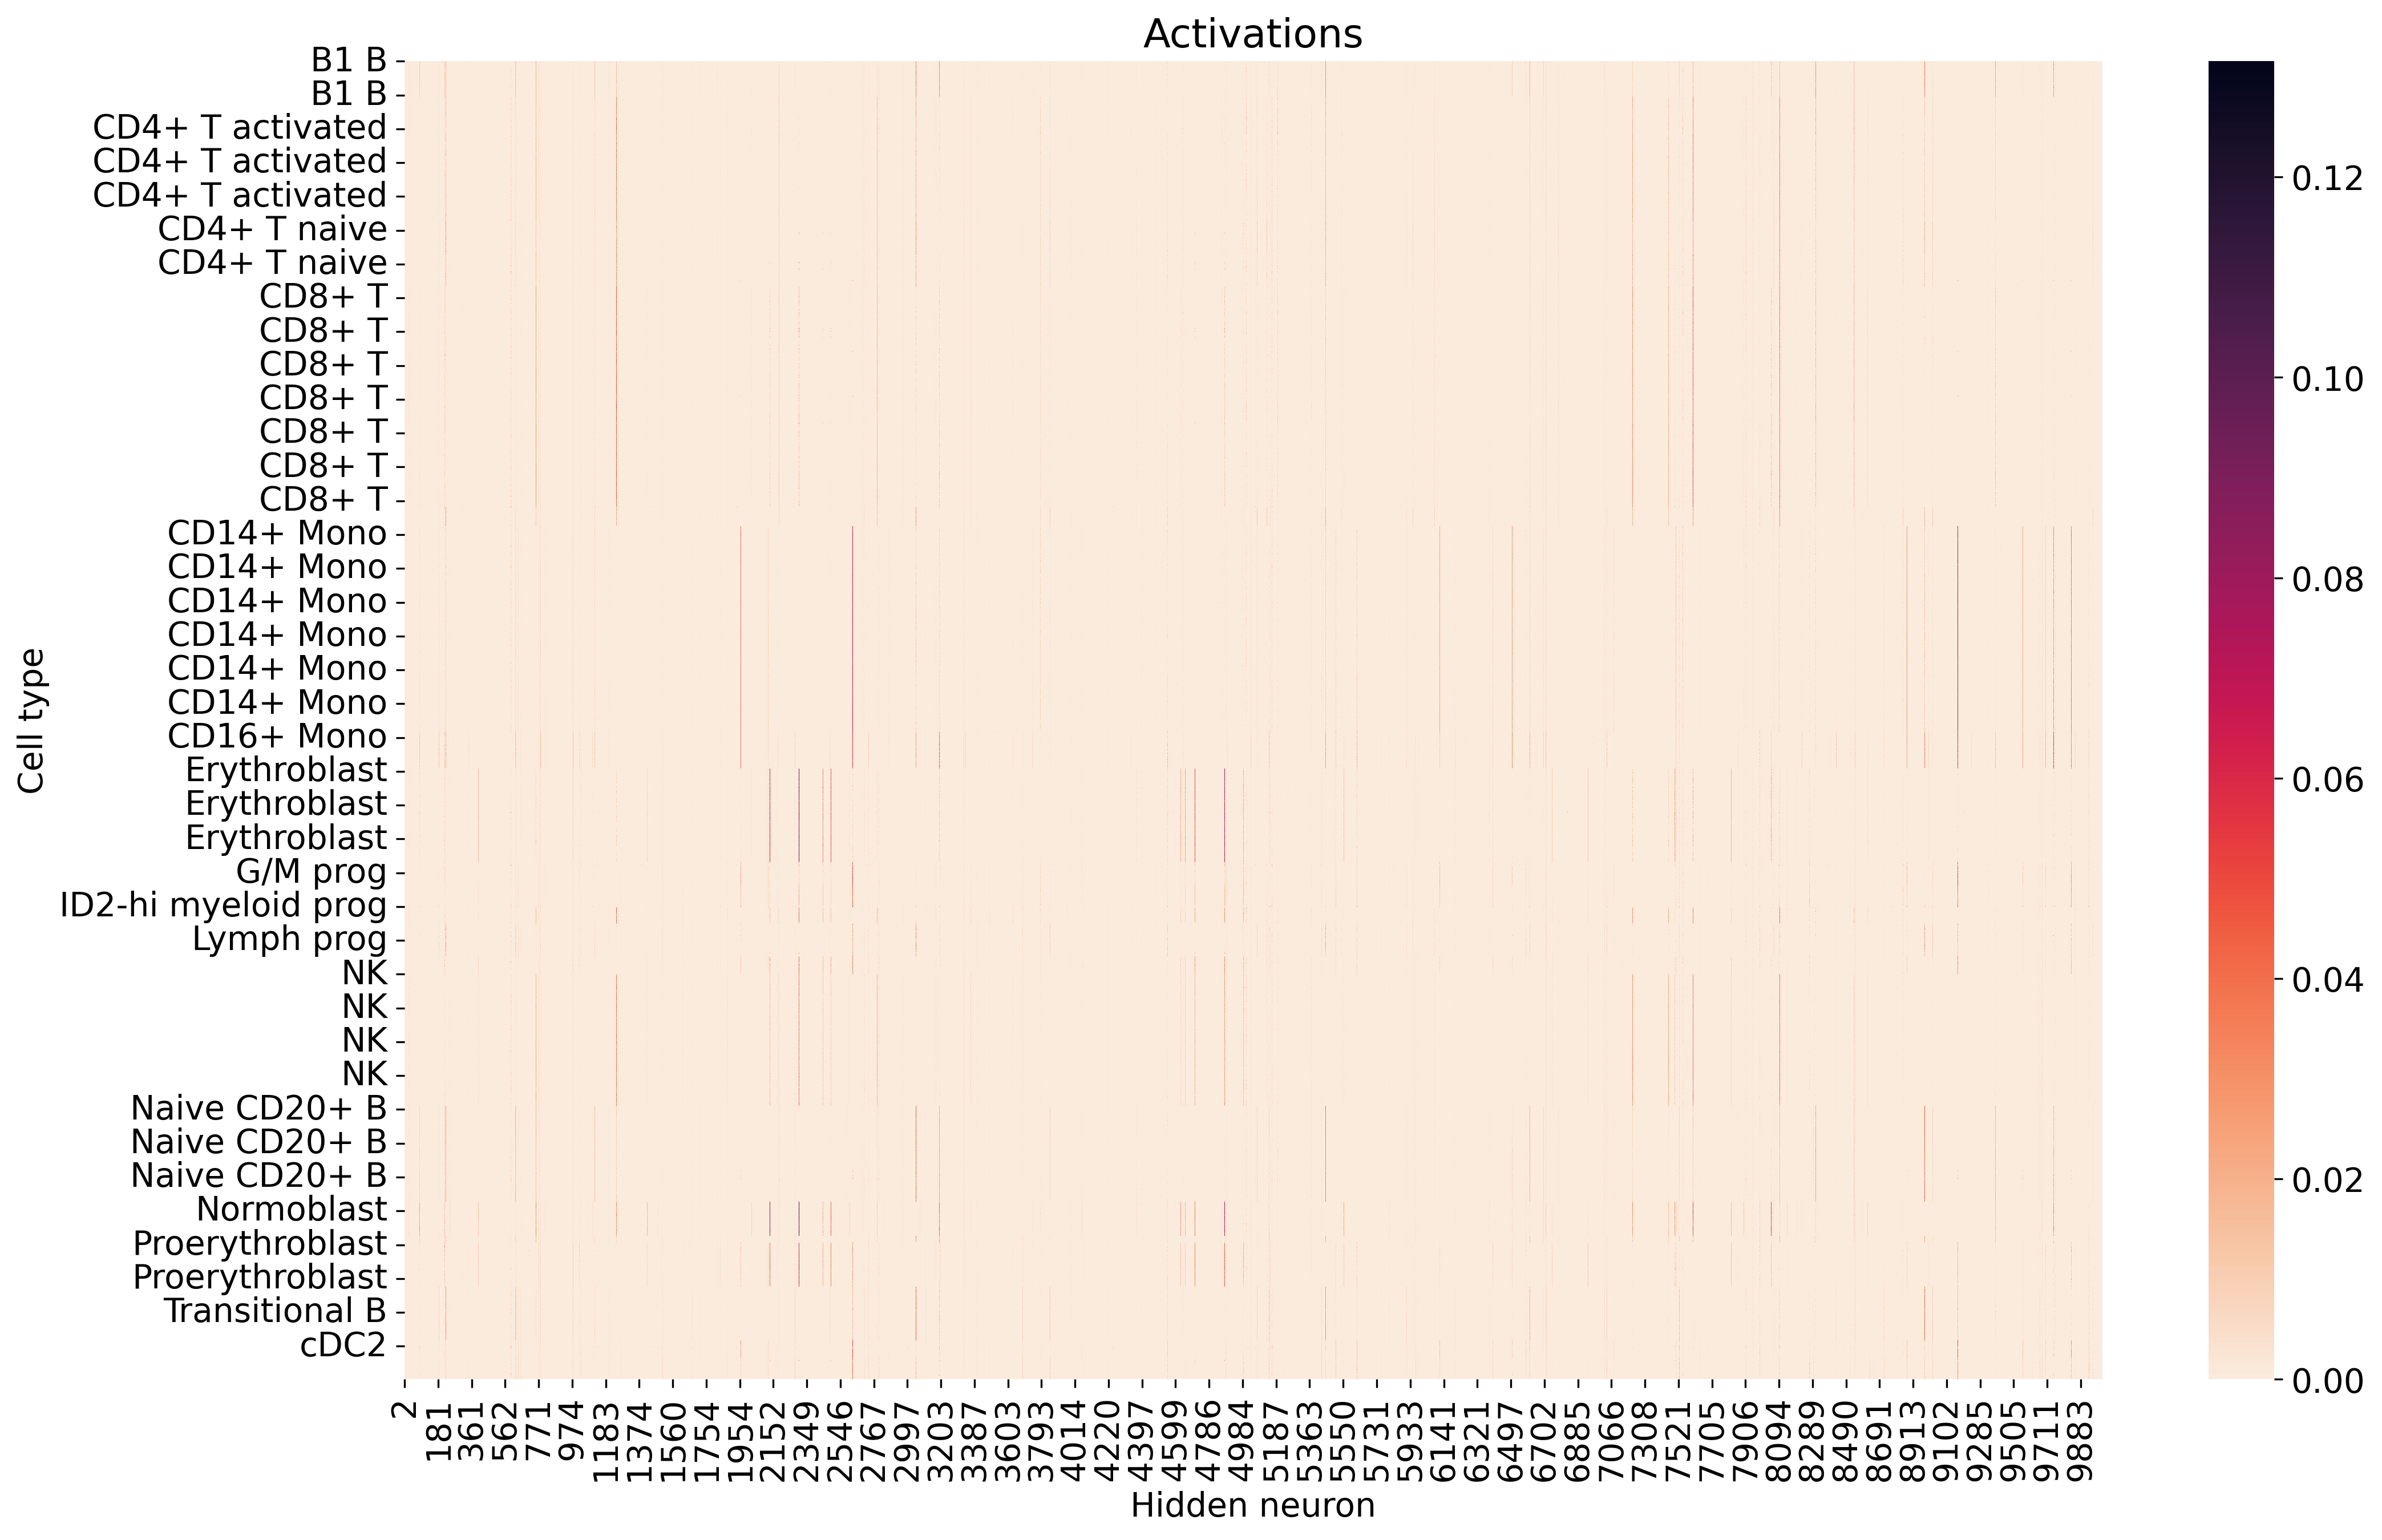
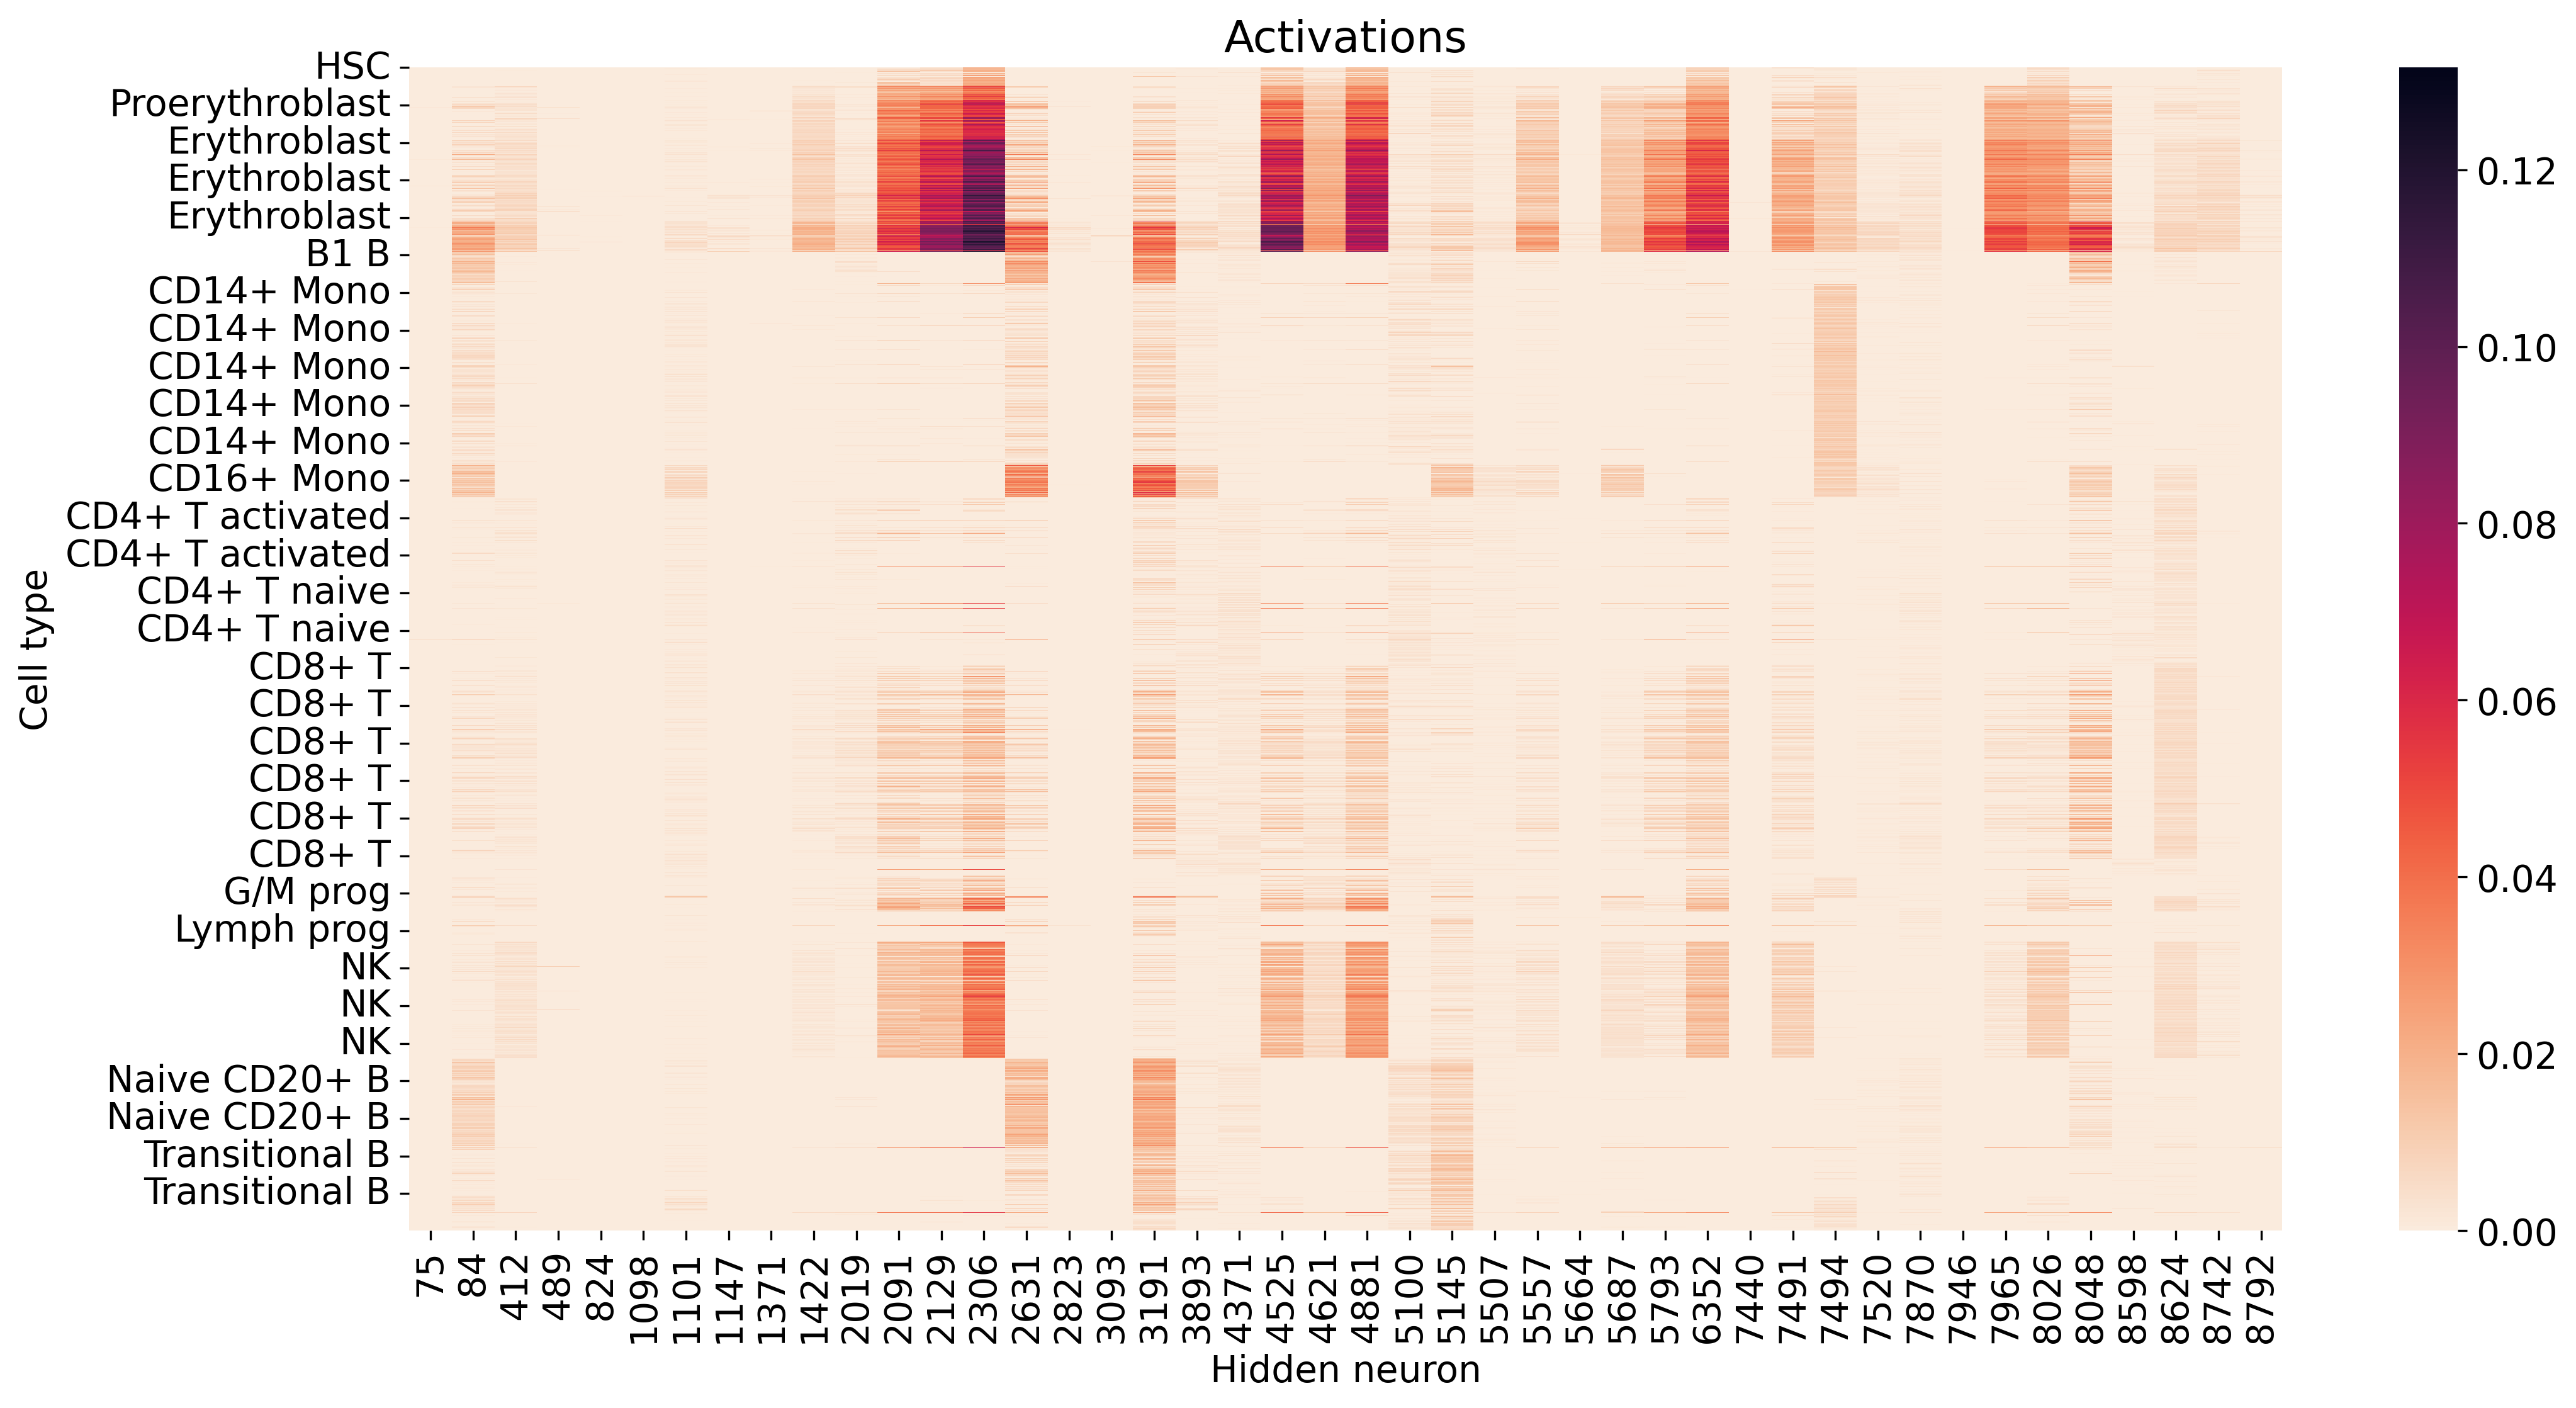
The Vanilla SAE with hidden neurons trained on extracted representations resulted in live neurons. The average activations of neurons are shown in Figure 6, as well as the average number of firing neurons per sample (cell) with a mean of . Since the representations are highly structured with respect to cell type (Figure 7), average activations of cell types naturally create unique patterns (Supplementary Figure 10). Based on the rule set described in 5.2, we identified neuron 2306 as the feature aligning best with red blood cell differentiation. Activations of feature 2306 can be seen in Figure 7.
The biological question of interest is now ”What biological process(es) govern(s) the identified differentiation?”. For this purpose, we selected cell types along the differentiation trajectory (HSC, proerythroblasts) and increased the activation values of feature . These perturbed hidden activations were then used to predict perturbed representations (Figure 8) and gene expression profiles. We performed differential gene expression (DEG) analysis between original and perturbed samples and used the resulting significantly changed genes for GO term analysis to get relevant biological processes in which these genes are involved. Although feature was most prevalent along the axis of red blood cell differentiation, moderate activations were also found in specific immune cells (NK and some CD8+ T cells, Figure 7). We repeated our analysis for NK cells and performed DEG and GO term analysis on ”high-vs-low” subsets of the CD8+ T cells, as only some of them showed activity of feature . While each analysis resulted in different gene sets and GO terms, the identified processes are highly specific and show a strong thematic overlap (Supplementary Table 1). Our experiments highlight ion homeostasis and gas transport, which are crucial processes in erythropoiesis (red blood cell differentiation) and cytotoxicity (the destructive capability of NK and CD8+ T cells crucial to immune response).
7 Conclusion
In this work, we have explored the potential of sparse autoencoders (SAEs) to enhance the interpretability of latent representations in biological data, where underlying variables are often unknown. Through data simulation with ground-truth generative variables, we provided valuable insights into the behavior and capabilities of different SAE architectures. We found that SAEs can effectively recover certain hidden variables in simulated data, with performance improving as the hidden dimensionality increases. However, we also observed limitations in the type of variable that can be recovered. Variables with an indirect effect on the observed data and little structure in the generative process seem to be harder to recover than immediately connected variables. These results highlight the challenges in decomposing complex biological processes. Nevertheless, our application of an SAE to single-cell multi-omics data from human bone marrow demonstrated the practical value of this approach in a real-world biological context. By identifying and perturbing a key feature (neuron 2306) associated with red blood cell differentiation, we were able to uncover specific biological processes validating the biological relevance of the SAE-derived feature.
The ability of SAEs to extract interpretable features from complex biological data can have significant implications for the usability of AI in biology and medicine. By providing a means to partially decompose latent representations into meaningful biological components, SAEs have the potential to enhance the trustworthiness and interpretability of machine learning models in these domains. Our work presents an important step towards this goal, but much more research is needed in this field. Future work could explore the application of SAEs to other types of biological data, investigate methods to overcome the limitations in recovering variables that are difficult to decompose, and develop techniques to automate the identification and interpretation of biologically relevant features.
Acknowledgements
We acknowledge great discussions with our coworkers and the reviewers’ time and effort to help us improve the quality and communication of our research.
References
- Aldridge and Teichmann, (2020) Aldridge, S. and Teichmann, S. A. (2020). Single cell transcriptomics comes of age. Nat Commun, 11(1):4307. Number: 1 Publisher: Nature Publishing Group.
- Anders and Huber, (2010) Anders, S. and Huber, W. (2010). Differential expression analysis for sequence count data. Genome Biology, 11(10):R106.
- Argelaguet et al., (2021) Argelaguet, R., Cuomo, A. S. E., Stegle, O., and Marioni, J. C. (2021). Computational principles and challenges in single-cell data integration. Nat Biotechnol, 39(10):1202–1215. Number: 10 Publisher: Nature Publishing Group.
- Ashburner et al., (2000) Ashburner, M., Ball, C. A., Blake, J. A., Botstein, D., Butler, H., Cherry, J. M., Davis, A. P., Dolinski, K., Dwight, S. S., Eppig, J. T., Harris, M. A., Hill, D. P., Issel-Tarver, L., Kasarskis, A., Lewis, S., Matese, J. C., Richardson, J. E., Ringwald, M., Rubin, G. M., and Sherlock, G. (2000). Gene Ontology: tool for the unification of biology. Nat Genet, 25(1):25–29. Publisher: Nature Publishing Group.
- Ashuach et al., (2023) Ashuach, T., Gabitto, M. I., Koodli, R. V., Saldi, G.-A., Jordan, M. I., and Yosef, N. (2023). MultiVI: deep generative model for the integration of multimodal data. Nat Methods, pages 1–10. Publisher: Nature Publishing Group.
- Azodi et al., (2020) Azodi, C. B., Tang, J., and Shiu, S.-H. (2020). Opening the Black Box: Interpretable Machine Learning for Geneticists. Trends in Genetics, 36(6):442–455. Publisher: Elsevier.
- Bau et al., (2017) Bau, D., Zhou, B., Khosla, A., Oliva, A., and Torralba, A. (2017). Network Dissection: Quantifying Interpretability of Deep Visual Representations. pages 6541–6549.
- Bengio et al., (2013) Bengio, Y., Courville, A., and Vincent, P. (2013). Representation Learning: A Review and New Perspectives. IEEE Transactions on Pattern Analysis and Machine Intelligence, 35(8):1798–1828. Conference Name: IEEE Transactions on Pattern Analysis and Machine Intelligence.
- Benjamini and Hochberg, (1995) Benjamini, Y. and Hochberg, Y. (1995). Controlling the false discovery rate: a practical and powerful approach to multiple testing. J. Roy. Statist. Soc. Ser. B, 57(1):289–300.
- Bricken et al., (2023) Bricken, T., Templeton, A., Batson, J., Chen, B., Jermyn, A., Conerly, T., Turner, N., Anil, C., Denison, C., Askell, A., Lasenby, R., Wu, Y., Kravec, S., Schiefer, N., Maxwell, T., Joseph, N., Hatfield-Dodds, Z., Tamkin, A., Nguyen, K., McLean, B., Burke, J. E., Hume, T., Carter, S., Henighan, T., and Olah, C. (2023). Towards Monosemanticity: Decomposing Language Models With Dictionary Learning. Transformer Circuits Thread.
- Buenrostro et al., (2013) Buenrostro, J. D., Giresi, P. G., Zaba, L. C., Chang, H. Y., and Greenleaf, W. J. (2013). Transposition of native chromatin for fast and sensitive epigenomic profiling of open chromatin, DNA-binding proteins and nucleosome position. Nat Methods, 10(12):1213–1218. Number: 12 Publisher: Nature Publishing Group.
- Conard et al., (2023) Conard, A. M., DenAdel, A., and Crawford, L. (2023). A spectrum of explainable and interpretable machine learning approaches for genomic studies. WIREs Computational Statistics, 15(5):e1617. _eprint: https://onlinelibrary.wiley.com/doi/pdf/10.1002/wics.1617.
- Corti et al., (2023) Corti, C., Cobanaj, M., Dee, E. C., Criscitiello, C., Tolaney, S. M., Celi, L. A., and Curigliano, G. (2023). Artificial intelligence in cancer research and precision medicine: Applications, limitations and priorities to drive transformation in the delivery of equitable and unbiased care. Cancer Treatment Reviews, 112:102498.
- Crabbe et al., (2021) Crabbe, J., Qian, Z., Imrie, F., and van der Schaar, M. (2021). Explaining Latent Representations with a Corpus of Examples. In Advances in Neural Information Processing Systems, volume 34, pages 12154–12166. Curran Associates, Inc.
- Elhage et al., (2022) Elhage, N., Hume, T., Olsson, C., Schiefer, N., Henighan, T., Kravec, S., Hatfield-Dodds, Z., Lasenby, R., Drain, D., Chen, C., Grosse, R., McCandlish, S., Kaplan, J., Amodei, D., Wattenberg, M., and Olah, C. (2022). Toy Models of Superposition. arXiv:2209.10652 [cs].
- Esser et al., (2020) Esser, P., Rombach, R., and Ommer, B. (2020). A Disentangling Invertible Interpretation Network for Explaining Latent Representations. pages 9223–9232.
- Farrell et al., (2022) Farrell, S., Mitnitski, A., Rockwood, K., and Rutenberg, A. D. (2022). Interpretable machine learning for high-dimensional trajectories of aging health. PLOS Computational Biology, 18(1):e1009746. Publisher: Public Library of Science.
- Gao et al., (2024) Gao, L., la Tour, T. D., Tillman, H., Goh, G., Troll, R., Radford, A., Sutskever, I., Leike, J., and Wu, J. (2024). Scaling and evaluating sparse autoencoders.
- Guo et al., (2022) Guo, T., Chen, Y., Shi, M., Li, X., and Zhang, M. Q. (2022). Integration of single cell data by disentangled representation learning. Nucleic Acids Research, 50(2):e8.
- Habineza et al., (2023) Habineza, T., Ribeiro, A. H., Gedon, D., Behar, J. A., Ribeiro, A. L. P., and Schön, T. B. (2023). End-to-end risk prediction of atrial fibrillation from the 12-Lead ECG by deep neural networks. Journal of Electrocardiology, 81:193–200.
- Hao et al., (2024) Hao, Y., Stuart, T., Kowalski, M. H., Choudhary, S., Hoffman, P., Hartman, A., Srivastava, A., Molla, G., Madad, S., Fernandez-Granda, C., and Satija, R. (2024). Dictionary learning for integrative, multimodal and scalable single-cell analysis. Nat Biotechnol, 42(2):293–304. Publisher: Nature Publishing Group.
- Heumos et al., (2023) Heumos, L., Schaar, A. C., Lance, C., Litinetskaya, A., Drost, F., Zappia, L., Lücken, M. D., Strobl, D. C., Henao, J., Curion, F., Schiller, H. B., and Theis, F. J. (2023). Best practices for single-cell analysis across modalities. Nat Rev Genet, 24(8):550–572. Number: 8 Publisher: Nature Publishing Group.
- Huben et al., (2023) Huben, R., Cunningham, H., Smith, L. R., Ewart, A., and Sharkey, L. (2023). Sparse Autoencoders Find Highly Interpretable Features in Language Models.
- Karagiannaki et al., (2023) Karagiannaki, I., Gourlia, K., Lagani, V., Pantazis, Y., and Tsamardinos, I. (2023). Learning biologically-interpretable latent representations for gene expression data. Mach Learn, 112(11):4257–4287.
- Kharchenko, (2021) Kharchenko, P. V. (2021). The triumphs and limitations of computational methods for scRNA-seq. Nat Methods, 18(7):723–732. Number: 7 Publisher: Nature Publishing Group.
- Kingma and Ba, (2014) Kingma, D. P. and Ba, J. (2014). Adam: A method for stochastic optimization. cite arxiv:1412.6980. Published as a conference paper at the 3rd International Conference for Learning Representations, San Diego, 2015.
- Kopf and Claassen, (2021) Kopf, A. and Claassen, M. (2021). Latent representation learning in biology and translational medicine. PATTER, 2(3). Publisher: Elsevier.
- Lima et al., (2021) Lima, E. M., Ribeiro, A. H., Paixão, G. M. M., Ribeiro, M. H., Pinto-Filho, M. M., Gomes, P. R., Oliveira, D. M., Sabino, E. C., Duncan, B. B., Giatti, L., Barreto, S. M., Meira Jr, W., Schön, T. B., and Ribeiro, A. L. P. (2021). Deep neural network-estimated electrocardiographic age as a mortality predictor. Nat Commun, 12(1):5117. Number: 1 Publisher: Nature Publishing Group.
- Lin et al., (2022) Lin, Y., Wu, T.-Y., Wan, S., Yang, J. Y. H., Wong, W. H., and Wang, Y. X. R. (2022). scJoint integrates atlas-scale single-cell RNA-seq and ATAC-seq data with transfer learning. Nat Biotechnol, 40(5):703–710. Number: 5 Publisher: Nature Publishing Group.
- Lopez et al., (2018) Lopez, R., Regier, J., Cole, M. B., Jordan, M. I., and Yosef, N. (2018). Deep generative modeling for single-cell transcriptomics. Nat Methods, 15(12):1053–1058. Number: 12 Publisher: Nature Publishing Group.
- Lopez et al., (2023) Lopez, R., Tagasovska, N., Ra, S., Cho, K., Pritchard, J., and Regev, A. (2023). Learning Causal Representations of Single Cells via Sparse Mechanism Shift Modeling. In Proceedings of the Second Conference on Causal Learning and Reasoning, pages 662–691. PMLR. ISSN: 2640-3498.
- Love et al., (2014) Love, M. I., Huber, W., and Anders, S. (2014). Moderated estimation of fold change and dispersion for RNA-seq data with DESeq2. Genome Biol, 15(12):550.
- Luecken et al., (2021) Luecken, M., Burkhardt, D., Cannoodt, R., Lance, C., Agrawal, A., Aliee, H., Chen, A., Deconinck, L., Detweiler, A., Granados, A., Huynh, S., Isacco, L., Kim, Y., Klein, D., DE KUMAR, B., Kuppasani, S., Lickert, H., McGeever, A., Melgarejo, J., Mekonen, H., Morri, M., Müller, M., Neff, N., Paul, S., Rieck, B., Schneider, K., Steelman, S., Sterr, M., Treacy, D., Tong, A., Villani, A.-C., Wang, G., Yan, J., Zhang, C., Pisco, A., Krishnaswamy, S., Theis, F., and Bloom, J. M. (2021). A sandbox for prediction and integration of dna, rna, and proteins in single cells. In Vanschoren, J. and Yeung, S., editors, Proceedings of the Neural Information Processing Systems Track on Datasets and Benchmarks, volume 1.
- Lähnemann et al., (2020) Lähnemann, D., Köster, J., Szczurek, E., McCarthy, D. J., Hicks, S. C., Robinson, M. D., Vallejos, C. A., Campbell, K. R., Beerenwinkel, N., Mahfouz, A., Pinello, L., Skums, P., Stamatakis, A., Attolini, C. S.-O., Aparicio, S., Baaijens, J., Balvert, M., Barbanson, B. d., Cappuccio, A., Corleone, G., Dutilh, B. E., Florescu, M., Guryev, V., Holmer, R., Jahn, K., Lobo, T. J., Keizer, E. M., Khatri, I., Kielbasa, S. M., Korbel, J. O., Kozlov, A. M., Kuo, T.-H., Lelieveldt, B. P., Mandoiu, I. I., Marioni, J. C., Marschall, T., Mölder, F., Niknejad, A., Raczkowski, L., Reinders, M., Ridder, J. d., Saliba, A.-E., Somarakis, A., Stegle, O., Theis, F. J., Yang, H., Zelikovsky, A., McHardy, A. C., Raphael, B. J., Shah, S. P., and Schönhuth, A. (2020). Eleven grand challenges in single-cell data science. Genome Biology, 21(1):31.
- Makhzani and Frey, (2014) Makhzani, A. and Frey, B. (2014). k-Sparse Autoencoders. arXiv:1312.5663 [cs].
- Marcinkevičs and Vogt, (2023) Marcinkevičs, R. and Vogt, J. E. (2023). Interpretability and Explainability: A Machine Learning Zoo Mini-tour. arXiv:2012.01805 [cs].
- Minoura et al., (2021) Minoura, K., Abe, K., Nam, H., Nishikawa, H., and Shimamura, T. (2021). A mixture-of-experts deep generative model for integrated analysis of single-cell multiomics data. Cell Reports Methods, 1(5):100071.
- Ogbeide et al., (2022) Ogbeide, S., Giannese, F., Mincarelli, L., and Macaulay, I. C. (2022). Into the multiverse: advances in single-cell multiomic profiling. Trends in Genetics, 38(8):831–843. Publisher: Elsevier.
- Olshausen and Field, (1997) Olshausen, B. A. and Field, D. J. (1997). Sparse coding with an overcomplete basis set: A strategy employed by V1? Vision Research, 37(23):3311–3325.
- Piran et al., (2024) Piran, Z., Cohen, N., Hoshen, Y., and Nitzan, M. (2024). Disentanglement of single-cell data with biolord. Nat Biotechnol, pages 1–6. Publisher: Nature Publishing Group.
- Pun et al., (2023) Pun, F. W., Ozerov, I. V., and Zhavoronkov, A. (2023). AI-powered therapeutic target discovery. Trends in Pharmacological Sciences, 44(9):561–572. Publisher: Elsevier.
- Rams and Conrad, (2022) Rams, M. and Conrad, T. O. (2022). Dictionary learning allows model-free pseudotime estimation of transcriptomic data. BMC Genomics, 23(1):56.
- Rudin, (2019) Rudin, C. (2019). Stop explaining black box machine learning models for high stakes decisions and use interpretable models instead. Nat Mach Intell, 1(5):206–215. Number: 5 Publisher: Nature Publishing Group.
- Rudin et al., (2022) Rudin, C., Chen, C., Chen, Z., Huang, H., Semenova, L., and Zhong, C. (2022). Interpretable machine learning: Fundamental principles and 10 grand challenges. Statistics Surveys, 16(none):1–85. Publisher: Amer. Statist. Assoc., the Bernoulli Soc., the Inst. Math. Statist., and the Statist. Soc. Canada.
- Räuker et al., (2023) Räuker, T., Ho, A., Casper, S., and Hadfield-Menell, D. (2023). Toward Transparent AI: A Survey on Interpreting the Inner Structures of Deep Neural Networks. arXiv:2207.13243 [cs].
- Schuster et al., (2023) Schuster, V., Dann, E., Krogh, A., and Teichmann, S. A. (2023). multiDGD: A versatile deep generative model for multi-omics data. Pages: 2023.08.23.554420 Section: New Results.
- Senders et al., (2018) Senders, J. T., Staples, P. C., Karhade, A. V., Zaki, M. M., Gormley, W. B., Broekman, M. L. D., Smith, T. R., and Arnaout, O. (2018). Machine Learning and Neurosurgical Outcome Prediction: A Systematic Review. World Neurosurgery, 109:476–486.e1.
- Sharkey et al., (2022) Sharkey, L., Braun, D., and beren (2022). [Interim research report] Taking features out of superposition with sparse autoencoders.
- Stark et al., (2020) Stark, S. G., Ficek, J., Locatello, F., Bonilla, X., Chevrier, S., Singer, F., Tumor Profiler Consortium, Rätsch, G., and Lehmann, K.-V. (2020). SCIM: universal single-cell matching with unpaired feature sets. Bioinformatics, 36(Supplement_2):i919–i927.
- The Gene Ontology Consortium et al., (2023) The Gene Ontology Consortium, Aleksander, S. A., Balhoff, J., Carbon, S., Cherry, J. M., Drabkin, H. J., Ebert, D., Feuermann, M., Gaudet, P., Harris, N. L., Hill, D. P., Lee, R., Mi, H., Moxon, S., Mungall, C. J., Muruganugan, A., Mushayahama, T., Sternberg, P. W., Thomas, P. D., Van Auken, K., Ramsey, J., Siegele, D. A., Chisholm, R. L., Fey, P., Aspromonte, M. C., Nugnes, M. V., Quaglia, F., Tosatto, S., Giglio, M., Nadendla, S., Antonazzo, G., Attrill, H., dos Santos, G., Marygold, S., Strelets, V., Tabone, C. J., Thurmond, J., Zhou, P., Ahmed, S. H., Asanitthong, P., Luna Buitrago, D., Erdol, M. N., Gage, M. C., Ali Kadhum, M., Li, K. Y. C., Long, M., Michalak, A., Pesala, A., Pritazahra, A., Saverimuttu, S. C. C., Su, R., Thurlow, K. E., Lovering, R. C., Logie, C., Oliferenko, S., Blake, J., Christie, K., Corbani, L., Dolan, M. E., Drabkin, H. J., Hill, D. P., Ni, L., Sitnikov, D., Smith, C., Cuzick, A., Seager, J., Cooper, L., Elser, J., Jaiswal, P., Gupta, P., Jaiswal, P., Naithani, S., Lera-Ramirez, M., Rutherford, K., Wood, V., De Pons, J. L., Dwinell, M. R., Hayman, G. T., Kaldunski, M. L., Kwitek, A. E., Laulederkind, S. J. F., Tutaj, M. A., Vedi, M., Wang, S.-J., D’Eustachio, P., Aimo, L., Axelsen, K., Bridge, A., Hyka-Nouspikel, N., Morgat, A., Aleksander, S. A., Cherry, J. M., Engel, S. R., Karra, K., Miyasato, S. R., Nash, R. S., Skrzypek, M. S., Weng, S., Wong, E. D., Bakker, E., Berardini, T. Z., Reiser, L., Auchincloss, A., Axelsen, K., Argoud-Puy, G., Blatter, M.-C., Boutet, E., Breuza, L., Bridge, A., Casals-Casas, C., Coudert, E., Estreicher, A., Livia Famiglietti, M., Feuermann, M., Gos, A., Gruaz-Gumowski, N., Hulo, C., Hyka-Nouspikel, N., Jungo, F., Le Mercier, P., Lieberherr, D., Masson, P., Morgat, A., Pedruzzi, I., Pourcel, L., Poux, S., Rivoire, C., Sundaram, S., Bateman, A., Bowler-Barnett, E., Bye-A-Jee, H., Denny, P., Ignatchenko, A., Ishtiaq, R., Lock, A., Lussi, Y., Magrane, M., Martin, M. J., Orchard, S., Raposo, P., Speretta, E., Tyagi, N., Warner, K., Zaru, R., Diehl, A. D., Lee, R., Chan, J., Diamantakis, S., Raciti, D., Zarowiecki, M., Fisher, M., James-Zorn, C., Ponferrada, V., Zorn, A., Ramachandran, S., Ruzicka, L., and Westerfield, M. (2023). The Gene Ontology knowledgebase in 2023. Genetics, 224(1):iyad031.
- Xu et al., (2021) Xu, C., Lopez, R., Mehlman, E., Regier, J., Jordan, M. I., and Yosef, N. (2021). Probabilistic harmonization and annotation of single-cell transcriptomics data with deep generative models. Molecular Systems Biology, 17(1):e9620. Publisher: John Wiley & Sons, Ltd.
- Yang et al., (2021) Yang, K. D., Belyaeva, A., Venkatachalapathy, S., Damodaran, K., Katcoff, A., Radhakrishnan, A., Shivashankar, G. V., and Uhler, C. (2021). Multi-domain translation between single-cell imaging and sequencing data using autoencoders. Nat Commun, 12(1):31. Number: 1 Publisher: Nature Publishing Group.
- Yun et al., (2021) Yun, Z., Chen, Y., Olshausen, B. A., and LeCun, Y. (2021). Transformer visualization via dictionary learning: contextualized embedding as a linear superposition of transformer factors.
- Zhang et al., (2022) Zhang, X., Wang, X., Shivashankar, G. V., and Uhler, C. (2022). Graph-based autoencoder integrates spatial transcriptomics with chromatin images and identifies joint biomarkers for Alzheimer’s disease. Nat Commun, 13(1):7480. Number: 1 Publisher: Nature Publishing Group.
- Zuo and Chen, (2021) Zuo, C. and Chen, L. (2021). Deep-joint-learning analysis model of single cell transcriptome and open chromatin accessibility data. Briefings in Bioinformatics, 22(4):bbaa287.
- Zuo et al., (2021) Zuo, C., Dai, H., and Chen, L. (2021). Deep cross-omics cycle attention model for joint analysis of single-cell multi-omics data. Bioinformatics, 37(22):4091–4099.
Supplementary Materials
Tables
| GO term | Present in CT perturbation | |||
|---|---|---|---|---|
| HSC | PE | NK | CD8T | |
| Intracellular calcium ion homeostasis | ||||
| Carbon dioxide transport | ||||
| Oxygen transport | ||||
| Hydrogen peroxide catabolic process | ||||
| Positive regulation of myoblast differentiation | ||||
| Erythrocyte development | ||||
| Vascular process in circulatory system | ||||
| Nitric oxide transport | ||||
| Stimulatory C-type lecitin receptor signaling pathway | ||||
| Positive regulation of natural killer cell mediated cytotoxicity | ||||
| Myeloid leukocyte activation | ||||
| Chemokine-mediated signaling pathway | ||||
| Calcium-mediated signaling | ||||
Figures