Interstitial anionic electrons involved superconductivity and -linear resistivity behavior in electride La3In
Abstract
Electrides are unique materials because of the existence of interstitial anionic electrons (IAEs). Due to these loosely bound IAEs and their strong interaction with the framework of cations, electrides can host superconductivity with rather high , especially under high pressure, as predicted in theory. However, the experimental observations of superconductivity in electrides are very rare, let alone the detailed studies on intrinsic properties of single crystals. Here, we report the superconducting and normal-state properties of electride La3In single crystals. La3In shows a type-II superconductivity with 9.4 K and a -linear resistivity in a wide temperature range. Experimental measurements and theoretical calculations suggest that the relatively high could be ascribed to the high density of states around the Fermi level caused by short flat bands along R-M direction and the strong electron-phonon coupling, partially derived from the IAEs. Meanwhile, the -linear resistivity may reflect the significant electronic correlation effect in this material. These findings will shed light on understanding the role of IAEs in superconductivity and open a promising way to explore high-temperature superconductors in electrides.
Electrides are a class of exotic compounds in which some electrons are localized at interstitial sites and behave as anions without nuclei.Dye1 ; Dye2 Because interstitial anionic electrons (IAEs) are not bounded to specific atomic cores and they have significantly smaller mass when compared to normal anions, these loosely bound IAEs exhibit some unique properties, such as low work function, high hyperpolarizabilities, and very high conductivity.Toda ; XuHL ; Lee These features enable electrides to be great useful in many applications. For example, the electrides can be a promising cathode material for organic light-emitting diodes and batteries as well as an efficient catalyst for ammonia synthesis.Kim1 ; HuJ ; Kitano In addition, metallic electrides can also host superconductivity especially under high pressure.ZhaoZ ; LiuZ1 ; LiuZ2 ; ZhaoY ; GuoZ ; WanZ ; HuangHM ; ZhangX ; WangQ Previous theoretical calculations have predicted that some of high-pressure electrides can possess the values of superconducting transition temperatures ’s beyond the McMillan limit or even close to the temperature of liquid nitrogen, such as 49 K for 6/ Li5N at 150 GPa,WanZ 54 K for Li8Cs at 380 GPa,HuangHM 73 K for -3 Li8Au at 250 GPa,ZhangX and 46 K for -3 Na2H at 30 GPa.WangQ These results arouse extensive research interest to explore possible high-temperature superconductors based on electrides. Although high-pressure electride superconductors have been predicted intensively, the experimental studies are scarce because of the harsh synthesis conditions under high pressure. As a prototype, the cI16-Li phase formed above 41 GPa (space group ) with 20 K is regraded as an electride superconductor.Shimizu ; Struzhkin ; Hosono1 In comparison with the high-pressure superconducting electrides, some electrides can exhibit superconductivity at ambient pressure. Actually, the first room-temperature and air-stable inorganic electride [Ca24Al28O64]4+4e- with zero-dimensional IAEs becomes a superconductor at 0.4 K.Matsuishi ; Miyakawa Additionally, Mn5Si3-type electride Nb5Ir3 with one-dimensional IAEs has been found to exhibit superconductivity with 9.4 K,ZhangY but whether the IAEs play a dominant role in the superconductivity of this material is still unknown.
In addition to the superconducting properties, the electric resistivities of metallic materials at normal states also demonstrate diverse behaviours. For conventional metals, when the electron-phonon scattering process is dominant, the temperature dependence of electrical resistivity usually shows a -linear dependence at high-temperature region ( relation) and crossovers to a behaviour with 5 at low-temperature region.Ziman On the other hand, if the electron-electron scattering is dominant, will decrease quadratically with temperature ( relation) at low-temperature region.Ziman However, strange metals can exhibit a -linear-dependent extended down to very low temperature even zero,Phillips which is notoriously observed in high-temperature cuprate superconductors,Gurvitch and also occur in heavy fermion materials, iron-based superconductors and magic-angle twisted bilayer graphene etc.Lohneysen ; Doiron-Leyraud ; Jaoui Thus, the -linear becomes a widespread phenomenon in strongly correlated metals. Some studies have attributed this behaviour to charge carriers Planckian-limit scattering at a rate given by , where is a constant of order unity, is the Planck constant and is the Boltzmann constant.Hartnoll Meanwhile, other viewpoints, such as antiferromagnetic spin fluctuationsMonthoux and quantum criticality,Dagan have also been proposed. However, the underlying origin of the -linear resistivity is still under debate and has emerged as one of the major puzzles in the physics of metals.
In this work, we carried out a detailed study on La3In single crystal and found that it is a type-II superconductor with 9.4 K, while theoretical calculations suggest that there are IAEs located at the center of empty La6 octahedra, i.e., La3In can be regarded as an electride superconductor. Further analysis implies that the large density of states (DOS) at the Fermi level , partially originating from the IAEs, as well as the strong electron-phonon coupling lead to the enhanced when compared to the face centered cubic (FCC) La element ( 5 - 6 K),Ziegler which has high structural similarity to La3In. In addition, La3In exists a -linear in a wide temperature range and linear energy dependence of scattering rates at normal state, suggesting certain electronic correlations in this system.
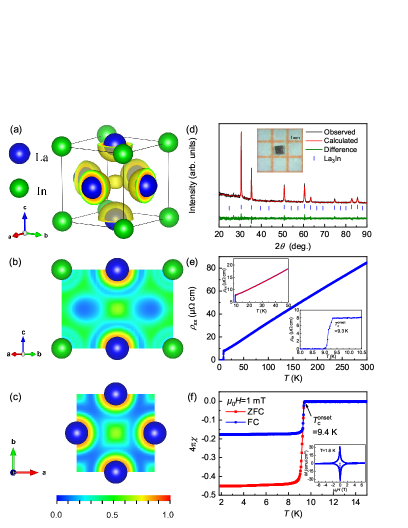
La3In single crystals were grown by the La-flux method. The detailed methods of experimental characterizations and theoretical calculations are shown in Supplemental Material (SM).SM Figure 1(a) shows the crystal structure of La3In, which is isostructural to Cu3Au.ZhaoJT From the perspective of unit cell, La atoms occupy the face-centered positions of the cubic structure, while In atoms occupy the vertex positions. This structure is closely related to the FCC-La in which all of In atoms are replace by La atoms. Interestingly, six La atoms in La3In form an empty octahedron at the body center of the cubic structure, which can host either interstitial atomsGschneidner or anionic electrons as shown below. According to the stoichiometric ratio of atomic species in La3In, we deduce the existence of excess electrons in this material. Figures 1(a)-1(c) show the respective three-dimensional (3D) map and two-dimensional (2D) maps projected onto the (110) and (001) planes for the electron localization functions (ELF). As can be seen clearly, there are indeed partial electrons separated from the nuclei and confined at the interstitial site of La octahedron, forming the IAEs.Dye2 ; Park ; Matsuishi ; Hosono2 Hence, La3In belongs to the well-known electride compounds. Figure 1(d) shows the PXRD pattern of La3In polycrystals. It can be well fitted using the -3 space group (No. 221) and the lattice parameter 5.0785 (3) Å, consistent with previous results.Garde Figure 1(e) shows the temperature dependence of electrical resistivity for La3In from 300 K to 1.6 K at zero field. The decreases with decreasing temperature, indicating the metallic behaviour of La3In, and the residual resistivity ratio RRR (= (300 K)/(10 K)) is about 10.5. Importantly, the curve exhibits a striking linear behaviour in a wide temperature range between 10 K and 300 K (upper inset of Fig. 1(e)). It can be fitted very well by using the formula with 0.95(1), which is distinctively different from many of normal metals that usually show a or behaviour due to conventional electron-electron or electron-phonon scattering. Such linear temperature dependence of implies that there may be significant electron correlation effects in La3In, leading to the obvious deviation from Fermi liquid behaviour. On the other hand, with lowering temperature further, La3In exhibits a superconducting transition and the onset superconducting transition temperature is about 9.3 K (lower inset of Fig. 1(e)), close to the reported values previously ( 9.7 K).Garde Correspondingly, there is a diamagnetic signal in magnetic susceptibility curves at 1 mT (Fig. 1(f)) and the is about 9.4 K, consistent with the value obtained from curve. At 1.8 K, the superconducting volume fraction estimated from the zero-field-cooling (ZFC) curve is about 40 - 50 %, confirming the bulk nature of superconductivity in La3In. Compared with the ZFC curve, a relatively weak diamagnetic signal of FC curve due to flux pinning effect suggests that La3In should be a type-II superconductor. The curve at 1.8 K shows obvious hysteresis (inset of Fig. 1(f)), further confirming the feature of type-II superconductor for La3In.
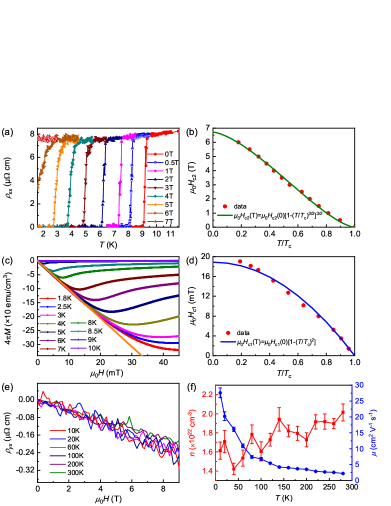
Figure 2(a) shows the curves at various magnetic fields up to 7 T. With increasing field, the shifts to lower temperature gradually but the width of superconducting transition only increases slightly, implying the relatively weak flux pinning effect in La3In. The upper critical field is determined using the criterion of 50 % normal state resistivity just above and summarized in Fig. 2(b). It can be seen that the increases with decreasing temperature with a slope = -1.05 T K-1, where is the superconducting transition temperature at zero field. The can be fitted using the empirical formula and the fitted value of zero-field upper critical field is 6.72(4) T. This is much smaller than the weak-coupling Pauli paramagnetically limited field = 1.84 = 17.11 T, implying that Pauli paramagnetic effect is negligible and the orbital depairing effect should be dominant in La3In. Using the fitted , the calculated Ginzburg-Landau coherence length from the equation ( is quantum flux) is 70.0(3) Å.
In order to obtain the lower critical field , the as a function of field at various temperatures below were measured (Fig. 2(c)). The curves exhibit linear behaviour at low-field region and the slopes are very close to -1, corresponding to the Meissner line (orange line) when the effective field is calculated using the formula , where is the external field and is the demagnetization factor. The values of are determined from the fields where the curves deviate from the linearly field-dependent behaviour, i.e., the magnetic flux starts to penetrate into the sample. As shown in Fig. 2(d), the increases with decreasing temperature and it can be fitted well using the equation , where is the lower critical field at 0 K. The fitted is 18.9(3) mT. The zero-temperature penetration depth can be evaluated using the formula , and it is 1660(26) Å. Correspondingly, the calculated Ginzburg-Landau parameter ) is 23.7(3), further confirming that La3In is a type-II superconductor. The zero-temperature thermodynamic critical field can be calculated using the formula and it yields 201(2) mT for La3In. The electron-phonon coupling constant can be obtained from the McMillan equation . When assuming the Coulomb pseudopotential is about 0.15, using above values of and the reported 170 K,Ravindran the value of is determined to be 1.13(1), implying the strongly coupled BCS superconductivity in La3In. Figure 2(e) shows the magnetic field dependence of Hall resistivity at different temperatures. All of curves exhibit linear behaviours with negative slopes, suggesting that electrons dominate the transport in La3In. Combined with data, the carrier concentration (red square) and mobility (blue circle) as functions of temperature can be obtained using one band model (Fig. 2(f)). The is about 1.4 - 2.0 1022 cm-3 with a weak temperature dependence when the decreases gradually with increasing temperature from 27.6(15) cm2 V-1 s-1 at 10 K to 2.2(1) cm2 V-1 s-1 at 280 K.
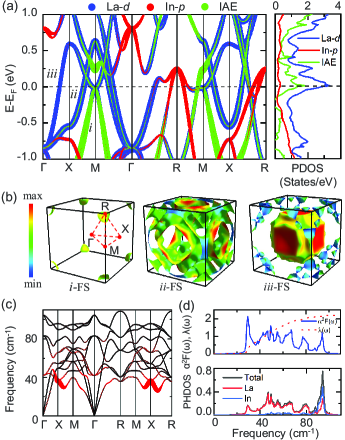
Figure 3(a) shows the electronic band structure and the partial density of states (PDOS) of La3In calculated without the spin-orbital coupling (SOC). There are three bands, labeled i, ii, and iii, crossing the Fermi level , among which there are short flat bands along the R-M path of Brillouin zone (BZ). Based on the orbital weight analysis, these short flat bands are dominated by the La 5 electrons and the IAEs. The Fermi surface (FS) sheets of bands i, ii, and iii are correspondingly shown in Fig. 4(b), on which the Fermi velocities are displayed with the color scales, where the red and blue colors represent the highest and zero Fermi velocities, respectively. It can be seen that the electron-type FS of band iii centered at point of BZ is much larger than other FSs and it also has a relatively high Fermi velocity, thus this electron band will contribute to the transport properties, which is in agreement with the results of Hall measurement (Fig. 2(e)). It is clear that the FS of band ii has a much lower Fermi velocity around the point, which is favorable for strong electron-phonon coupling (EPC).lower-velocity1 ; lower-velocity2 According to the PDOS shown in Fig. 3(a), it is found that the electronic states near are mainly contributed by the La 5 orbitals and the IAEs, which are consistent with the results of band structure. More importantly, there is a van Hove singularity around , which is associated with the partial flat bands around M point and results in a large DOS of 2.15 states/eV per atom at . Compared with the value of 1.63 states/eV per atom in FCC-La with 5 - 6 K,Ziegler ; Bagci it suggests that the large DOS at () for La3In could lead to an enhancement of superconductivity.
To better understand the superconducting properties of La3In, we subsequently performed the EPC calculations. The calculated total EPC constant is 2.23, indicating a strong EPC in La3In compared with that of FCC-La ( 1.06).Bagci This larger theoretical value of than that derived from experimental results (1.13) could be ascribed to the difference between ( 67 K) and Debye temperature ( 170 K).Ravindran When is larger than 1.3, one needs consider the correction factors and , which are calculated to be 1.15 and 1.04, to obtain the superconducting temperature.Allen1 ; Allen2 These lead to a superconducting of 10.66 K based on the McMillan-Allen-Dynes formula,Allen1 which agrees well with the measured result (Fig. 1(d)). From the momentum- and mode-resolved EPC parameter (Fig. 3(c)), it can be seen that the largest contribution comes from the acoustic branches around X point, which results in a high peak (around 30 cm-1) in the Eliashberg spectral function (the top part of Fig. 3(d)). Such phonon mode is closely related to -axial vibration of La atoms in the La-In layer. Combined the phonon density of states (PHDOS) and the frequency-dependent EPC parameters (Fig. 3(d)), we conclude that the La vibrations play a dominant role in the superconductivity. In short, we propose that the enhanced superconductivity in La3In, compared with that of FCC-La,Bagci is mainly due to the high electronic states at the Fermi level and the strong EPC strength induced by the low-frequency phonon modes.
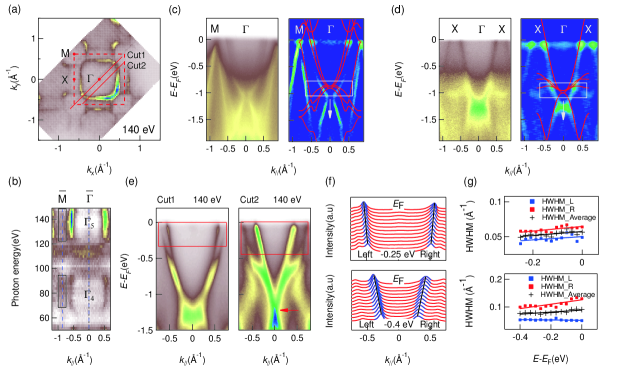
Next, we performed angle-resolved photoemission spectroscopy (ARPES) measurements to identify band structures near and confirmed the anomalous scattering rate correlated with the non-Fermi liquid behaviour. In Fig. 4(a), the FSs taken by a photon energy of 140 eV show big electron-like FSs at the BZ center as predicted by the calculation. However, due to the matrix elements effects, the calculated bands at the points were not observed by the 140-eV photons. We therefore have carried out measurements using various photon energies ranging from 50 to 148 eV to investigate dispersion along the - lines in detail. Fig. 4(b) reveals the intensity as a function of phonon energy along - taken at . According to the periodicity of intensity and free-electron final state model,kz we found that 80 and 140 eV are close to the points. When using around 140-eV photons, the intensity of a electron-like pocket surrounding is enhanced and the intensity at the points is suppressed. In contrast, using around 80-eV photons, the intensity at and M is almost the same. The band structures along the - and - directions are shown in Figs. 4(c) and 4(d). The calculated bands on the corresponding second derivative plots well match the mainly ARPES dispersive features without any renormalizations, except for the bands near -1 eV below needing to be shifted down as marked in the figures which could be explained in terms of interband coupling and correlation effects.kz
Interestingly, the electron-type FS surrounding the BZ center exhibits linear dispersions, which can be more clearly seen by using 140-eV photons as shown in Fig. 4(e) and the corresponding momentum distribution curves (MDCs) (Fig. 4(f)). The scattering rates obtained from the fitted MDCs vary linearly with the binding energies up to 0.25 and 0.4 eV along the Cut1 and Cut2 lines, respectively. Despite the equal theoretical values of the half-width at half maximum (HWHM) on the right and left branches of the linear bands, some points deviate from the lines with opposite tendencies due to the effect of the intensity of near bands. The average values are even better for the linear relationship, especially for the MDCs of Cut2. A cone-like feature is formed at about -1.2 eV below as marked at Cut2 in the Fig. 4(e). Anomalous scattering rates are inconsistent with the 3D Fermi-liquid theory () or the 2D Fermi-liquid theory [].Non_FL Similar linear scattering rates are observed in iron pnictides,SM_JP ; FB_JP consistent with non-Fermi liquid behaviours observed in the resistivity. The non-Fermi liquid behaviours in these materials are possibly associated with correlation effects induced by high density states saddle points or partial flat bands at , as also demonstrated in the calculated PDOS and band structure (Fig. 3(a)).
When compared to FCC-La, the higher DOS around in La3In mainly originates from the La 5 and IAE band near the point of BZ. Moreover, the proportion of IAE near in the latter increases significantly. Therefore, we speculate that IAE is also involved in the phenomenon of enhanced superconductivity. Such high DOS could also lead to certain electronic correlations and corresponding linear resistivity behaviour in this material. In addition, there may be a strong EPC between IAEs at the center of La6 octahedra and the -axial vibration of apical La atoms of that La6 octahedra. Unlike traditional anions characterized by strong electron localization, the IAEs usually exhibit weaker localization and higher activity.Lee This feature can facilitate their hybridization with atomic valence orbitals and strengthening their coupling with the vibrations of surrounding La atoms.GuoZ ; Miao ; Racioppi Similar enhancement of EPC have also been proposed in the Li8Au where the IAEs are located at the cubic Li8 cage centers and the IAEs induce strong coupling to the vibration of Li8 cages enhancing the phonon mediated superconductivity.ZhangX
For the -linear behaviour of resistivity, usually, this phenomenon appears when when the electron-phonon scattering dominates. As mentioned above, the of La3In is about 170 K, meaning that the -linear behaviour should appear above 34 K. It is much higher than 10 K observed in La3In. Moreover, it is noted that for materials with small Fermi momentum , i.e., low carrier density since with the system dimensionality of , should be replaced by , where is the phonon velocity.Hwang Due to , could be much less than in low-density metals in principle, leading to the -linear behaviour persisting to low temperature. But for La3In, the is about 1022 cm-3 with a rather big FS around point of BZ, it seems unlikely to satisfy the condition of . Thus, electron-phonon scattering might not be enough to explain -linear resistivity in the low-temperature region. Moreover, combined with the linear energy dependence of scattering rates observed from ARPES measurements, it suggests that such phenomenon at low temperature may have certain similarity to strongly correlated electronic systems like high temperature cuprate or iron-based superconductors. Nevertheless, unlike unconventional superconductors, the spin fluctuations are absent in La3In, which provides a constrain on the unified theoretical model in describing the -linear resistivity.
In summary, our present studies propose that La3In should be an superconducting electride with rather high , which are closely related to the high DOS, strong EPC, and partial flat band near that involve both La 5 electrons and IAEs. In addition, the -linear resistivity persists down to 10 K implies that besides electron-phonon interaction, the electronic correlation effects may also play an important role in the physical properties of La3In. In light of this work, we expect superconducting electride materials with IAEs can offer a new platform to explore exotic and/or high temperature superconductivity as well as to study the unique EPC and other electronic correlation phenomena.
This work was supported by the National Key R&D Program of China (Grants No. 2023YFA1406500, 2022YFA1403800, 2022YFA1403103 and 2022YFB3608000), the National Natural Science Foundation of China (Grants No. 12274459, 12222413, and 12174443), the Beijing Natural Science Foundation (Grant No. Z200005), the Natural Science Foundation of Shanghai (Grants No. 23ZR1482200 and No. 22ZR1473300), and the funding of Ningbo Yongjiang Talent Program and Ningbo University. Computational resources were provided by the Physical Laboratory of High-Performance Computing at Renmin University of China.
† Z.J.T, P.H.S, and P.C.M contributed equally to this work.
Corresponding authors: liuzhonghao@nbu.edu.cn (Z. H. Liu); kliu@ruc.edu.cn (K. Liu); hlei@ruc.edu.cn (H. C. Lei).
References
- (1) J. L. Dye, Acc. Chem. Res. 42, 1564-1572 (2009).
- (2) J. L. Dye, Science 301, 607-608 (2003).
- (3) Y. Toda, H. Yanagi, E. Ikenaga, J. J. Kim, M. Kobata, S. Ueda, T. Kamiya, M. Hirano, K. Kobayashi, and H. Hosono, Adv. Mater. 19, 3564-3569 (2007).
- (4) H. L. Xu, Z. R. Li, D. Wu, B. Q. Wang, Y. Li, F. L. Gu, and Y. Aoki, J. Am. Chem. Soc. 129, 2967-2970 (2007).
- (5) K. Lee, S. W. Kim, Y. Toda, S. Matsuishi, and H. Hosono, Nature 494, 336-340 (2013).
- (6) K. B. Kim, M. Kikuchi, M. Miyakawa, H. Yanagi, T. Kamiya, M. Hirano, and H. Hosono, J. Phys. Chem. C 111, 8403-8406 (2007).
- (7) M. Kitano, Y. Inoue, Y. Yamazaki, F. Hayashi, S. Kanbara, S. Matsuishi, T. Yokoyama, S. W. Kim, M. Hara, and H. Hosono, Nat. Chem. 4, 934-940 (2012).
- (8) J. Hu, B. Xu, S. A. Yang, S. Guan, C. Ouyang, and Y. Yao, ACS Appl. Mater. Interfaces 7, 24016-24022 (2015).
- (9) Z. Zhao, S. Zhang, T. Yu, H. Xu, A. Bergara, and G. Yang, Phys. Rev. Lett. 122, 097002 (2019).
- (10) Z. Liu, Q. Zhuang, F. Tian, D. Duan, H. Song, Z. Zhang, F. Li, H. Li, D. Li, and T. Cui, Phys. Rev. Lett. 127, 157002 (2021).
- (11) Z. Liu, D. Duan, Q. Zhuang, and T. Cui, Phys. Rev. B 108, L100507 (2023).
- (12) Y. Zhao, A. Bergara, X. Zhang, F. Li, Y. Liu, and G. Yang, Phys. Rev. B 108, 104505 (2023).
- (13) Z. Guo, A. Bergara, X. Zhang, X. Li, S. Ding, and G. Yang, Phys. Rev. B 109, 134505 (2024).
- (14) Z. Wan, C. Zhang, T. Yang, W. Xu, and R. Zhang, New J. Phys. 24, 113012 (2022).
- (15) H. M. Huang, Q. Zhu, V. A. Blatov, A. R. Oganov, X. Wei, P. Jiang, and Y. L. Li, Nano Lett. 23, 5012-5018 (2023).
- (16) X. Zhang, Y. Yao, S. Ding, A. Bergara, F. Li, Y. Liu, X. F. Zhou, and G. Yang, Phys. Rev. B 107, L100501 (2023).
- (17) Q. Wang, S. Zhang, H. Li, H. Wang, G. Liu, J. Ma, H. Xu, H. Liu, and Y. Ma, J. Mater. Chem. A, 11, 21345-21353 (2023)
- (18) K. Shimizu, H. Ishikawa, D. Takao, T. Yagi, and K. Amaya, Nature 419, 597-599 (2002).
- (19) V. V. Struzhkin, M. I. Eremets, W. Gan, H. Mao, and R. J. Hemley, Science 298, 1213-1215 (2002).
- (20) H. Hosono, S. W. Kim, S. Matsuishi, S. Tanaka, A. Miyake, T. Kagayama, and K. Shimizu, Philos. T. R. Soc. A 373, 20140450 (2015).
- (21) S. Matsuishi, Y. Toda, M. Miyakawa, K. Hayashi, T. Kamiya, M. Hirano, I. Tanaka, and H. Hosono, Science 301, 626-629 (2003).
- (22) M. Miyakawa, S. W. Kim, M. Hirano, Y. Kohama, H. Kawaji, T. Atake, H. Ikegami, K. Kono, and H. Hosono, J. Am. Chem. Soc. 129, 7270-7271 (2007).
- (23) Y. Zhang, B. Wang, Z. Xiao, Y. Lu, T. Kamiya, Y. Uwatoko, H. Kageyama, and H. Hosono, npj Quantum Mater. 2, 45 (2017).
- (24) J. M. Ziman, Electrons and Phonons: The Theory of Transport Phenomena in Solids (Oxford University Press, 2001).
- (25) P. W. Phillips, N. E. Hussey, and P. Abbamonte, Science 377, eabh4273 (2022).
- (26) M. Gurvitch and A. T. Fiory, Phys. Rev. Lett. 59, 1337-1340 (1987).
- (27) H. V. Löhneysen, T. Pietrus, G. Portisch, H. G. Schlager, A. Schröder, M. Sieck, and T. Trappmann, Phys. Rev. Lett. 72, 3262-3265 (1994).
- (28) N. Doiron-Leyraud, P. Auban-Senzier, S. René de Cotret, C. Bourbonnais, D. Jérome, K. Bechgaard, and L. Taillefer, Phys. Rev. B 80, 214531 (2009).
- (29) A. Jaoui, I. Das, G. D. Battista, J. Díez-Mérida, X. Lu, K. Watanabe, T. Taniguchi, H.iroaki Ishizuka, L. Levitov, and D. K. Efetov, Nat. Phys. 18, 633-638 (2022).
- (30) S. A. Hartnoll and A. P. Mackenzie, Rev. Mod. Phys. 94, 041002 (2022).
- (31) P. Monthoux and D. Pines, Phys. Rev. B 49, 4261 (1994).
- (32) Y. Dagan, M. M. Qazilbash, C. P. Hill, V. N. Kulkarni, and R. L. Greene, Phys. Rev. Lett. 92, 167001 (2004).
- (33) W. T. Ziegler, R. A. Young, and A. L. Floyd Jr, J. Am. Chem. Soc. 75, 1215-1221 (1953).
- (34) See Supplemental Material for the detailed methods of crystal growth, experimental characterizations and theoretical calculations, which includes Refs. [35-52].
- (35) P. E. Blöchl, Phys. Rev. B 50, 17953-17979 (1994).
- (36) G. Kresse, and D. Joubert, Phys. Rev. B 59, 1758 (1999).
- (37) G. Kresse, and J. Hafner, Phys. Rev. B 47, 558 (1993).
- (38) G. Kresse, and J. Furthmüller, Comput. Mater. Sci. 6, 15-50 (1996).
- (39) G. Kresse, and J. Furthmüller, Phys. Rev. B 54, 11169 (1996).
- (40) J. P. Perdew, K. Burke, and M. Ernzerhof, Phys. Rev. Lett. 77, 3865 (1996).
- (41) N. Marzari, A. A. Mostofi, J. R. Yates, I. Souza, and D. Vanderbilt, Rev. Mod. Phys. 84, 1419-1475 (2012).
- (42) A. A. Mostofi, J. R. Yates, G. Pizzi, Y. S. Lee, I. Souza, D. Vanderbilt, and N. Marzari, Comput. Phys. Commun. 185, 2309-2310 (2014).
- (43) M. Kawamura, Comp. Phys. Commun. 239, 197-203 (2019).
- (44) S. Baroni, S. De Gironcoli, A. Dal Corso, and P. Giannozzi, Rev. Mod. Phys. 73, 515 (2001).
- (45) F. Giustino, Rev. Mod. Phys. 89, 015003 (2017).
- (46) P. Giannozzi, S. Baroni, N. Bonini, M. Calandra, R. Car, C. Cavazzoni, D. Ceresoli, G. L. Chiarotti, M. Cococcioni, I. Dabo, and R. M. Wentzcovitch, J. Phys. Condens. Matter 21, 395502 (2009).
- (47) A. M. Rappe, K. M. Rabe, E. Kaxiras, and J. D. Joannopoulos, Phys. Rev. B 41, 1227 (1990).
- (48) A. Dal Corso, Comput. Mater. Sci. 95, 337-350 (2014).
- (49) https://www.quantum-espresso.org/pseudopotentials.
- (50) G. M. Eliashberg, Sov. Phys. JETP 11, 696-702 (1960).
- (51) P. B. Allen, Phys. Rev. B 6, 2577 (1972).
- (52) P. B. Allen, and R. C. Dynes, Phys. Rev. B 12, 905 (1975).
- (53) J. T. Zhao, Z. C. Dong, J. T. Vaughey, J. E. Ostenson, and J. D. Corbett, J. Alloys Compd. 230, 1-12 (1995)
- (54) K. A. Gschneidner Jr, O. D. McMasters, and J. E. Ostenson, J. Less-Common Met. 62, 167-177 (1978)
- (55) C. Park, S. W. Kim, and M. Yoon, Phys. Rev. Lett. 120, 026401 (2018).
- (56) H. Hosono, and M. Kitano, Chem. Rev. 121, 3121-3185 (2021).
- (57) C. S. Garde, J. Ray, and G. Chandra, J. Alloys Compd. 198, 165-172 (1993)
- (58) P. Ravindran, and R. Asokamani, J. Phys. Condens. Mat 7, 5567 (1995).
- (59) X. Zhang, M. Zhao, and F. Liu, Phys. Rev. B 100, 104527 (2019).
- (60) J. M. An, and W. E. Pickett, Phys. Rev. Lett. 86, 4366 (2001).
- (61) S. Baǧci, H. M. Tütüncü, S. Duman, and G. P. Srivastava, Phys. Rev. B 81, 144507 (2010).
- (62) Z. H. Liu, P. Richard, N. Xu, G. Xu, Y. Li, X. C. Fang, L. L. Jia, G. F. Chen, D. M. Wang, J. B. He, T. Qian, J. P. Hu, H. Ding, and S. C. Wang, Phys. Rev. Lett. 109, 037003 (2012).
- (63) L. L. Jia, Z. H. Liu, Y. P. Cai, T. Qian, X. P. Wang, H. Miao, P. Richard, Y. G. Zhao, Y. Li, D. M. Wang, J. B. He, M. Shi, G. F. Chen, H. Ding, and S. C. Wang, Phys. Rev. B 90, 035133 (2014).
- (64) Y. Nakajima, T. Metz, C. Eckberg, K. Kirshenbaum, A. Hughes, R. Wang, L. Wang, S. R. Saha, I. L. Liu, N. P. Butch, D. Campbell, Y. S. Eo, D. Graf, Z. Liu, S. V. Borisenko, P. Y. Zavalij, and J. Paglione, Commun. Phys. 3, 181 (2020).
- (65) Z. Liu, H. Mao, Y. Nakajima, J. Paglione, Z. Yin, and S. Borisenko, Phys. Rev. B 109, 075103 (2024).
- (66) M. S. Miao, R. Hoffmann, J. Botana, I. I. Naumov, and R. J. Hemley, Angew. Chem. Int. Ed. 129, 992-995 (2017).
- (67) S. Racioppi, C. V. Storm, M. I. McMahon, and E. Zurek, Angew. Chem. Int. Ed. 135, e202310802 (2023).
- (68) E. H. Hwang and S. Das Sarma, Phys. Rev. B 99, 085105 (2019).