[figure]style=plain,subcapbesideposition=top
Theory for sequence selection via phase separation and oligomerization
Abstract
Non-equilibrium selection pressures were proposed for the formation of oligonucleotides with rich functionalities encoded in their sequences, such as catalysis. Since phase separation was shown to direct various chemical processes, we ask whether condensed phases can provide mechanisms for sequence selection. To answer this question, we use non-equilibrium thermodynamics and describe the reversible oligomerization of different monomers to sequences at non-dilute conditions prone to phase separation. We find that when sequences oligomerize, their interactions give rise to phase separation, boosting specific sequences’ enrichment and depletion. Our key result is that phase separation gives rise to a selection pressure for the oligomerization of specific sequence patterns when fragmentation maintains the system away from equilibrium. Specifically, slow fragmentation favors alternating sequences that interact well with their environment (more cooperative), while fast fragmentation selects sequences with extended motifs capable of specific sequence interactions (less cooperative). Our results highlight that out-of-equilibrium condensed phases could provide versatile hubs for Darwinian-like evolution toward functional sequences, both relevant for the molecular origin of life and de novo life.
I Introduction
Their ability to store genetic information and catalyze chemical reactions makes oligonucleotides, such as DNA and RNA, key building blocks for the molecular origin of life [1, 2, 3, 4]. Without any specialized biological molecules, such as protein-based enzymes on early Earth, the mechanisms that can give rise to the emergence of long oligomers with prebiotic functions remain elusive [5, 6, 7, 8, 9]. A particularly aspired function is folding into a secondary configuration capable of replicating unfolded oligonucleotide sequences. However, a fundamental problem is the exponentially large number of different sequences, particularly for the minimal sequence length required for complex functionalities such as replication [10]. This problem renders the need for selection mechanisms at the molecular origin of life in the early stages when sequences grow in length and start exploring their exponential sequence space. Various selection mechanisms were proposed based on the non-equilibrium conditions presumably acting on early Earth [11], such as biased replication [12, 13], salt and temperature gradients [14, 15], wet-dry [16, 17, 18] or freeze-thaw cycles [19], shear-driven replication [20, 21], accumulation at liquid-vapor interfaces [22] or mineral surfaces [23], template aided-ligation [24, 25, 26], and finally via phase separated condensates [27].
The significance of phase-separated condensates in providing a selection mechanism at the molecular origin of life has been suggested roughly a century ago [28, 29, 30, 31]. These ideas have been recently revisited due to advances in sequencing technologies capable of resolving large sequence distributions [32], complemented by observations of phase separation of oligonucleotide sequences under prebiotic conditions. In particular, it was shown that the attractive interactions among different oligomeric sequences can result in the formation of additional phases such as hydrogels [33, 34], liquid crystalline phases [35, 36], and coacervates [37, 38, 27, 39]. Interestingly, the saturation concentrations above which oligonucleotides such as DNA and RNA phase separate can be rather low, in the order of , due to the strong interaction strength () of complementary basis pairs [37, 40]. Such low saturation concentrations make oligonucleotide phase separation a likely and robust scenario, even under varying physicochemical conditions at early Earth. Furthermore, non-equilibrium thermodynamics implies that the chemical processes such as polymerization, ligation, and fragmentation of oligonucleotides are generically coupled with phase separation of oligonucleotides [41, 42, 39]. This coupling gives rise to feedback between the evolving sequence distribution and their propensity to form condensed phases. In other words, when considering the condensed phases as phenotypes and their local sequence distributions as genotypes, thermodynamics provides a coupling between phenotype and genotype – a prerequisite for Darwinian evolution.
The coupling between chemical processes and phase separation is expected to mediate a selection mechanism that depends on the inter-sequence interactions. Indeed, phase separation was shown to gradually enrich specific sequences from a pool composed of a few designed sequences [27]. However, it remains an open question whether the interaction among sequences and particularly phase separation, can direct the oligomerization of sequences. If phase separation can efficiently direct oligomerization, it could represent a physicochemical mechanism that reduces the occupations of the exponentially growing sequence space. The coupling between sequence distributions and phase separation becomes especially interesting in the presence of competing effects to aggregation, namely hydrolysis [43, 26]. Phase separation crates a phase both oligomer-rich and solvent-poor [39], possibly serving as a protective environment against hydrolysis steering the fragmentation of specific sequences.
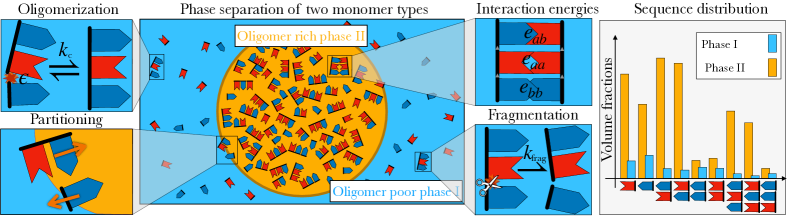
In this work, we developed a theoretical framework using non-equilibrium thermodynamics to describe the oligomerization of sequences at non-dilute conditions. Such conditions require accounting for the interactions among all sequences, including the possibility of phase coexistence, as illustrated in Fig. 1. Using our theoretical framework, we find that the interactions among sequences direct oligomerization toward sequences that phase separate from the solvent and form a condensed phase. We show that phase separation favors forming more cooperatively interacting sequences over specialized sequences that interact only weakly with most other sequences. To unravel the role of phase separation in sequence selection, we maintain the system out-of-equilibrium by fragmentation, inspired by the hydrolysis of oligonucleotides. We find that slow fragmentation rates select for sequences of large information content, while low-information sequences with highly correlated sequence motifs emerge for large enough fragmentation rates. Thus, phase separation mediates a selection pressure for sequences through selective oligomerization. Our results indicate that condensed phases can act as spatially localized phenotypes for Darwinian-like evolution toward functional sequences.
II Theory for oligomerization at phase equilibrium
To describe the dynamics of sequences in phase-separated systems, we use the volume fraction, , where denotes the phase. Here, the component label includes monomers and oligomers summarised in the set . For two monomeric building blocks, denoted and , the union of the set of monomers and sequences gives all non-solvent components . The volume fraction of a component, , quantifies the volume occupied by molecules of type with molecular volume , relative to the phase volume . For simplicity, we consider an incompressible system where molecular volumes of each component are constants.
In this work, we build on a theoretical framework developed for non-dilute chemical kinetics where, if phase separation occurs, the different phases are at phase equilibrium [41]. In this framework, the time evolution of the components volume fractions in each phase is governed by oligomerization rates , the diffusive exchange fluxes between phases , and changes in the phase volumes (see Fig. 1 for an illustration of the different physical processes):
| (1a) | |||
| with the component label denoting monomers and oligomer sequences. In an incompressible system, oligomerization conserves volume (), such that the phase volume changes in time only due to partitioning fluxes of solvent , and partitioning fluxes of monomers and sequences () through the phase boundary: | |||
| (1b) | |||
The oligomerization rate of component results from the gain and loss contributions related to the possible oligomerization pathways. For simplicity, we discuss monomer pick-up and release (Fig. 2) leading to
| (1c) |
This oligomerization rate conserves the total volume (and mass) of monomers and monomers incorporated into sequences. In a non-dilute system, the gain and loss contribution can be written as follows [44]:
| (1d) |
where the terms in the rectangular parenthesis denote the forward and backward reaction rates respectively, and denote the chemical potential of component in phase . In Eq. (1d), forward and backward rates obey detailed balance of the rates [45, 46]:
| (1e) |
There is a single kinetic rate coefficient for each chemical reaction governing the relaxation toward chemical equilibrium, . For simplicity, we consider the kinetic rate coefficients constant, phase independent, and agnostic to the reactants, such that .
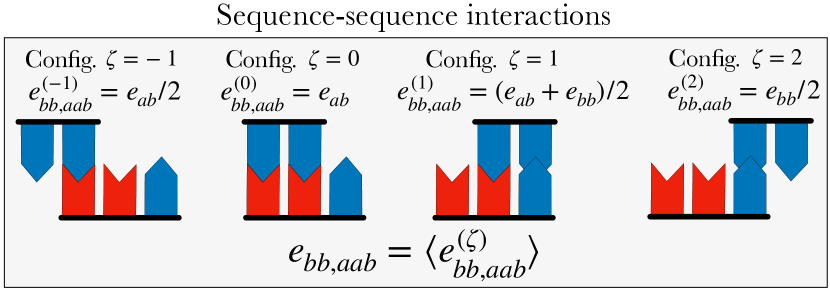
The non-dilute conditions require accounting for interactions among all components, the solvent, monomers, and oligomers. On a coarse-grained level, these interactions can be described by contributions to the free energy density , which makes the chemical potential that characterizes the free energy cost to add component to a mixture, , dependent on all components . The free energy density contains mixing entropy contributions and enthalpic terms up to second order in each sequence volume fractions (mean-field); see, e.g., Ref. [39]. First-order enthalpic terms in correspond to internal free energies that govern oligomerization equilibria in the dilute limit. In our model, the internal free energies of sequences depend on sequence length, and internal free energy scales are set by backbone bond energy (Fig. 1). We consider as sequence-independent and study values in the order of a few , consistent with biofilaments such as DNA and RNA [47]. We note that for peptides, nearest neighbor interactions along the sequences are crucial, leading to a sequence-dependent internal free energy [48, 49]. The interactions between sequences and are captured by second-order terms in the free energy and are of the form , where is the average interaction parameter. The quantity is calculated by performing a Boltzmann average over all possible monomer-monomer interactions (corresponding to base-pairs for DNA and RNA) between sequence and , as illustrated in Fig. 2. For details on these calculations, see Appendix B.
\sidesubfloat[]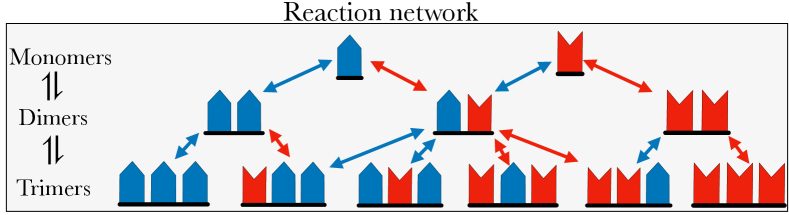
\sidesubfloat[]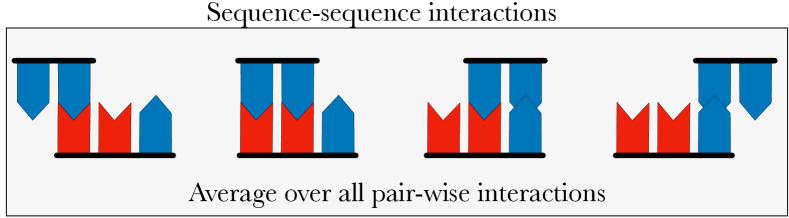
\sidesubfloat[]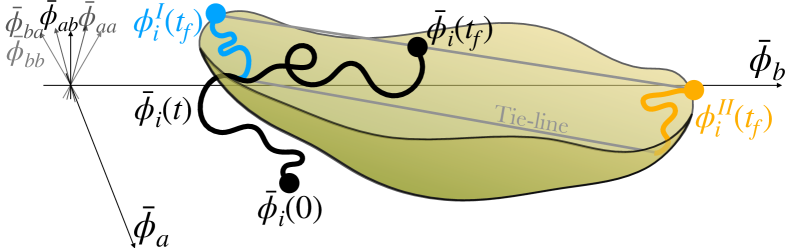
Interactions between sequences can lead to phase separation once enough sequences have formed via oligomerization. If diffusion rates of sequences between phases are fast compared to oligomerization rates, phases are at phase equilibrium at each time of the oligomerization kinetics (see Ref. [41] for a detailed discussion). For two coexisting phases , chemical potentials and osmotic pressures are balanced: and . If not stated otherwise, we discuss scenarios where two phases coexist. During this kinetics, the oligomer-rich (II) and oligomer-poor (I) phases are constrained to the surface of a high-dimensional binodal manifold, where tie-lines connect the two coexisting phases; see Fig. 2. The constraint of phase equilibrium during oligomerization is satisfied by solving and , and self-consistently calculating the diffusive fluxes between the phases, ; for more details see Appendix E. Note that the condition of phase coexistence implies the -superscript of the chemical potentials in Eqs. (1c, 1d, 1e) can be omitted. Furthermore, as the reaction rate coefficient is phase independent, it implies an equal oligomerization rate in the oligomer-poor and -rich phase throughout the chemical kinetics.
Since chemical potentials govern both the oligomerization rates (Eq. (1d)) as well as the diffusive fluxes between the coexisting phases (last paragraph), there is a mutual coupling between oligomerization and phase separation. This coupling is a fundamental thermodynamic property of chemically reacting, non-dilute mixtures (also away from equilibrium); see Refs. [41, 42, 39]. In our work, it will give rise to the selective oligomerization of sequences due to their favorable interactions with their local, oligomer-rich or oligomer-poor environment.
\sidesubfloat[]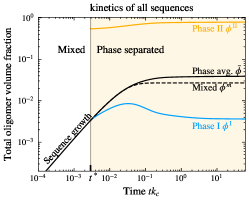 \sidesubfloat[]
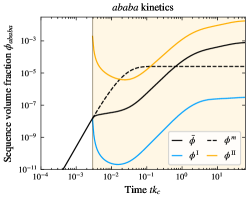 \sidesubfloat[]
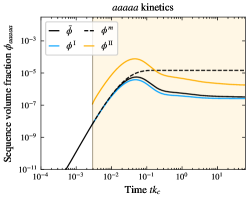 \sidesubfloat[]
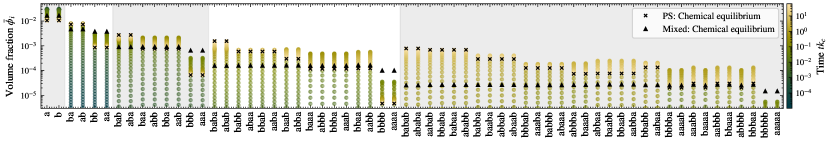
To understand the role of phase separation in the oligomerization kinetics, we consider a mixed system as a reference. The mixed system is homogeneous, and the reaction kinetics follows
| (2) |
with the oligomerization rate given in Eqs. (1c) and (1d). In simple terms, it is the same system as the phase-separated system, i.e., with the same physical parameters, but where phase coexistence is suppressed.
In the following, we numerically integrate Eqs. (1) to evolve the volume fractions of monomers and sequences, with and . The average volume fractions are found from a weighted sum over both phases,
| (3) |
where is the total system volume . For all studies in this work, we initialize the system at with an equal amount of and monomers and no other non-solvent components. Specifically, , and , this further sets the total sequences volume fraction , which is conserved during the kinetics.
III Sequence evolution toward thermodynamic equilibrium
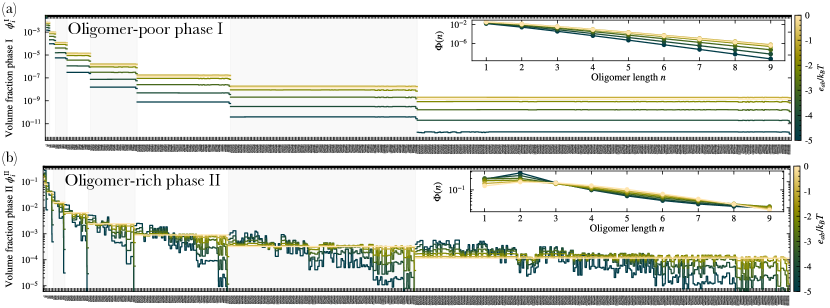
Dimers, trimers, and longer oligomers emerge from a pool of monomers through oligomerization. As more and longer oligomers form, the decrease in mixing entropy and the stronger attractive interactions enhance the propensity to phase separate. When phase separation occurs at (Fig. 3a), an oligomer-rich phase (phase II) forms that coexists with an oligomer-poor phase (phase I). The two phases can differ by several orders in magnitude in their total oligomer volume fraction. The corresponding phase average typically exceeds the one of the mixed system governed by Eq. (2), where phase separation is suppressed.
The interactions among sequences in the presence of phase separation biases the oligomerization kinetics, leading to the enrichment of specific sequences. As examples, we show the evolution of two different 5-mers, an alternating sequence (Fig. 3b) and a homo-5-mer (Fig. 3c). Upon phase separation, the volume fractions in the two phases differ significantly between the two sequences. However, this difference is much more pronounced for the alternating sequence than for the homopolymeric sequence. The reason is that alternating sequences interact well with most other sequences in the system (later, we refer to such sequences as cooperative), while the homo-sequence only interacts strongly with their homopolymeric complement. Note that it is the mutual feedback between oligomerization and phase equilibrium that biases oligomerization for more phase separation-prone sequences. This bias is reflected by the larger values of the average volume fractions with for late times . It also explains why many more similarly alternating sequences form in the entire system at thermodynamic equilibrium (black crosses in Fig. 3d).
To unravel the role of the mutual feedback between phase separation and oligomerization leading to the strong enrichment of specific sequences, we considered a mixed reference system (see dashed curves in Fig. 3a-c). Physically, a mixed system is homogeneous, and phase separation is suppressed. Mathematically, this case corresponds to only considering the oligomerization kinetics in the non-dilute mixture by solving Eq. (2), such that the constraint of phase equilibrium is not fulfilled. In Fig. 3a, we see that the mixed system leads to a bit less total oligomer volume fraction (17) than the phase-separated system. In other words, phase separation only slightly enhances the net trend of monomers forming oligomers. For specific sequences, however, the time evolution towards chemical equilibrium is completely altered by phase separation. This can be seen by comparing the dashed (mixed) with blue (phase I) and orange (phase II) lines in Fig. 3b-c for the two 5-mers, and when considering the full sequences distribution shown in Fig. 3d. The two sequences depicted in Fig. 3 and 3 differ by less than a factor of two when mixed, while for the phase average, the same ratio is more than . Phase separation enhances multiple orders of magnitude and suppresses to the extent that it is more abundant for the mixed system. In Fig. 3, the final chemical equilibrium volume fractions for each sequence are indicated by crosses, while the stationary values for the mixed state are displayed by triangles. We observe that the mixed case has only little diversity between different sequences of the same length since it yields an almost flat sequence distribution. Note that the mixed system behaves completely different to the phase-separated case, which gives rise to specific sequences being strongly enriched while others are strongly depleted.
A striking property of our theoretical framework is that it allows us to follow the kinetics of the full sequence distribution in time (Fig. 3d). Longer oligomers form at the expense of depleting the amount of initialized monomers. At early times, the kinetics is dominated by the entropic gain to distribute the monomer mass to larger oligomers. This fast entropy-driven growth of oligomer can lead to overshoots in the volume fractions at intermediate times when sequences are abundant enough such that interactions begin to affect the oligomerization kinetics (see e.g., Fig. 3c). At later times, the enthalpic gains through interactions balance with the entropic costs of unequally distributed mass between sequences of the same length. In the mixed case, the system is not dense enough for the interactions to alter the chemical kinetics significantly, resulting in a simple monotonic increase in the volume fractions (dashed lines in Fig. 3b and c). Eventually, thermodynamic equilibrium is reached where phase coexistence and chemical equilibrium are concomitantly satisfied, and the sequence distribution in each phase becomes stationary (black crosses in Fig. 3d). At thermodynamic equilibrium, the most and least abundant sequences among 5-mers differ in volume fraction by more than three orders of magnitude, as shown in Fig. 3b and c. Phase separation thus strongly alters kinetics and the sequence distribution at thermodynamic equilibrium.
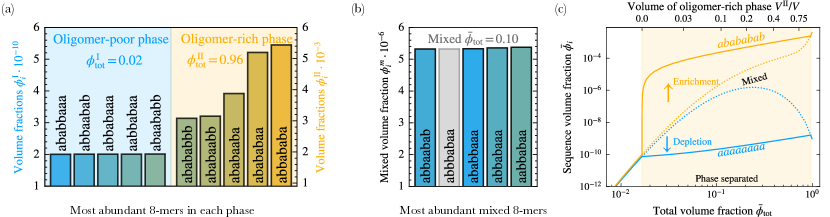
The key property of phase separation is that the coexisting phases act as local hubs with very different total oligomer mass and, thereby, very different inter-sequence interactions (Fig. 3a). These interactions affect oligomerization locally, enriching or depleting specific sequences. This hub-like effect is evident by comparing the five most abundant sequences in each phase (Fig. 4a). While the oligomer-poor (I) phase has no clear preference for any sequence (see also Fig. 13a), the oligomer-rich (II) phase shows a clear preference towards alternating sequences, each of varying abundance. For the corresponding mixed system with a total volume fraction (Fig. 4b), the distribution is almost flat, similar to the oligomer-poor phase. Most importantly, phase separation has a dual effect: It changes which sequences are enriched and depleted and also magnifies their depletion and enrichment. This can be seen by sequences in the oligomer-rich (II) phase (indicated by orangish color code) that do not appear in either the oligomer-poor (I) or the mixed case. Consistently, the oligomer-poor (I) phase and the mixed system at low total oligomer volume fraction enrich similar sequences such as .
The enrichment mediated by phase separation is most pronounced for small volumes of the oligomer-rich phase II. This property is apparent by comparing the equilibrium volume fraction averaged over both phases (Eq. (3)) with the mixed case where phase separation is suppressed, for varying the total volume fraction of monomers and oligomers ; see Fig. 4c. Here, phase separation abruptly enriches the volume fraction of the alternating 8-mers, while depleting the homo-8-mers. The relative enrichment is the largest for small volumes of the oligomer-rich phase. This behavior is due to the volume fractions of long sequences increasing exponentially with the total mass (Eq. (LABEL:eq:equil_phi)), while the phase average increases linearly with the composition of the oligomer-rich phase (Eq. (3)). As a result, there is a relative enrichment of specific sequences up to a thousand-fold. For the mixed system, the two sequences depicted remain at approximately equal abundance until around , while phase separation is able to differentiate them at more dilute conditions. Phase separation thus allows for the enrichment of specific sequences at conditions slightly above the saturation volume fraction, which would not be possible without phase separation.
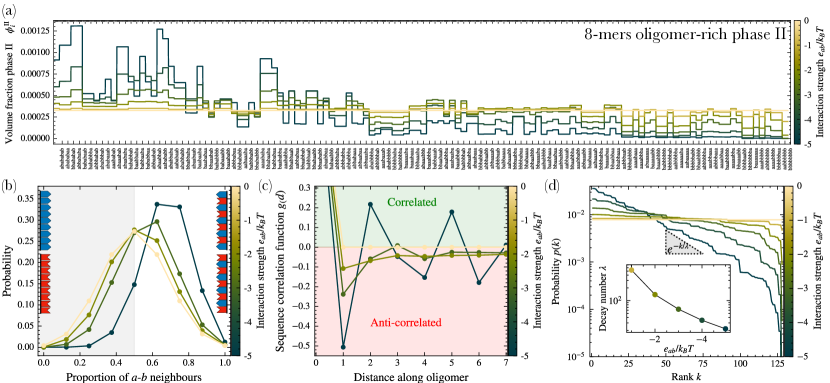
Sequence interactions collectively enrich similar sequence patterns in the respective phases. In the oligomer-poor phase, the oligomers are too dilute to affect each other’s propensity through interactions, as seen in Fig. 13a and Eq. (21). In the oligomer-rich phase, the oligomer-oligomer interactions determine the sequence distribution, as seen in Fig. 13b. Without interactions () or a too-weak interaction strength , the distribution remains approximately flat for each length, independent of the total volume fraction of monomers and sequences . With stronger interactions , the volume fractions of the enriched/depleted sequences may enhance/deplete further (see Fig. 5a for 8-mers). However, due to the dual role of phase separation creating a sequence bias and acting as an amplifier, a non-monotonous behavior can be observed for some sequences when increasing the interaction strength . For example, is enriched at , but depleted at . Another example is being the most abundant sequence at , but that is far from the case at . These non-monotonous trends result from enrichment being a collective effect, where the enhanced depletion of and neighbors by interactions has an effect on the abundance of all sequences.
Sequence interactions and phase separation mediate a strong bias toward sequences with almost alternating sequence patterns at thermodynamic equilibrium (Fig. 4a Fig. 5a). This behavior is evident in the probability distribution for the proportion of - neighbors for 8-mers, where corresponds to a homo-oligomer and corresponds to an alternating oligomer (Fig. 5b). Without interactions, the distribution is a binomial distribution symmetric around an - neighbor proportion of a half. With stronger interactions , the mean of the distribution shifts to a higher number of - neighbors, and the variance of the distribution decreases. The results support that oligomers close to homo-oligomers are statistically disfavoured as they have fewer complementary strand motifs where sequences can attach. Due to the volume fractions decaying with length, the interactions with shorter sequences are the most relevant for enhancing motifs in longer sequences. Though alternating patterns are preferred, a perfect alternating pattern does not produce any complementary sub-strand for other non-perfectly alternating sequences and is, hence, not as enriched. The largest enrichment occurs for approximately alternating sequences that interact favorably with or segments of other sequences.
Phase separation and interactions among oligomers create long-range correlations along the oligomer sequence. The corresponding auto-correlation function
| (4) |
characterizes the occurrence of the same monomers along an oligomer of fixed length . In the equation above, gives the monomer-type at position of oligomer . The auto-correlation function shows pronounced oscillations for large enough interaction strength (Fig. 5c). Stronger interactions (more negative values of ) give rise to stronger correlations, while no interactions () leave all sequences uncorrelated. The wave number of the correlation function is approximately two, corresponding to the alternating pattern , which is statistically most common.
The stronger sequences interact (more negative ), the more of the total monomer mass gets turned into enriched sequences. This trend can be quantified by the rank distribution that orders the sequences by their abundance (rank ). We find that the rank distribution decays exponentially, with the characteristic rank scale decreases with the strength of interaction . Without interactions (), the sequence distribution for a given length is flat, and so is the rank distribution (yellow line shown in Fig. 5d). With increasing interaction strength, some sequences get enriched while most are depleted. The characteristic rank scale thus decreases with interaction strength (inset of Fig. 5d). As most sequences become depleted at large interaction strengths , interactions reduce the size of the effectively occupied high-dimension sequence space.
The preference towards alternating sequences originates from the necessity of all sequences to interact with both ’s and ’s. The preference for alternating sequences results from the interaction strength and the volume fractions of all sequences being large enough, which both affect the distribution in an exponential fashion (Eq. (20)). While large sequences are dilute compared to short oligomers (dimers, trimers, …), the dominant contributions in the exponential leading to the enrichment of alternating patterns in long oligomers (7-, 8-, 9-mers), stem from short oligomers (see inset Fig. 13b). The origin of short alternating sequences arises from them interacting more favorably with their environment, meaning their respective phases, i.e., they are more cooperative. For example, the dimer is much more abundant than (and ) as it interacts more favorably with both monomers and , see Fig. 3 and 13b. But why are the most enriched sequences approximately one Hamming distance away from the perfectly alternating 8-mer , and not the perfectly alternating 8-mer itself? The reason is that a single non-alternating segment, or , enhances the average interactions with the diverse sequence environment, further boosting a sequence’s cooperativity.
IV Sequence selection by non-equilibrium fragmentation
To decipher the effects of phase separation in sequence selection away from equilibrium, we break detailed balance of the rates between the fragmentation and fusion pathways . In general, both pathways rely on the break-up (formation) of bonds along the sequence backbone, where sequence fragments into (forms from) the sub-oligomer/monomer and . An example is . Detailed balance of the rates is broken by omitting the fusion pathway, considering it to be slow compared to fragmentation. Thus, the system is maintained away from equilibrium. The rate of the fragmentation pathway for sequence in phase is written as
| (5) |
where denotes the fragmentation rate coefficient that we choose, for simplicity, to be phase-independent. The fragmentation rate is proportional to the local volume fraction () of the fragmenting sequence. Each bond along the sequence backbone breaks equally likely, making the rate independent of , ensured by the factor , where is the number of monomers of sequence . Inspired by the hydrolysis of biofilaments such as DNA and RNA, the fragmentation rate scales with the solvent volume fraction .
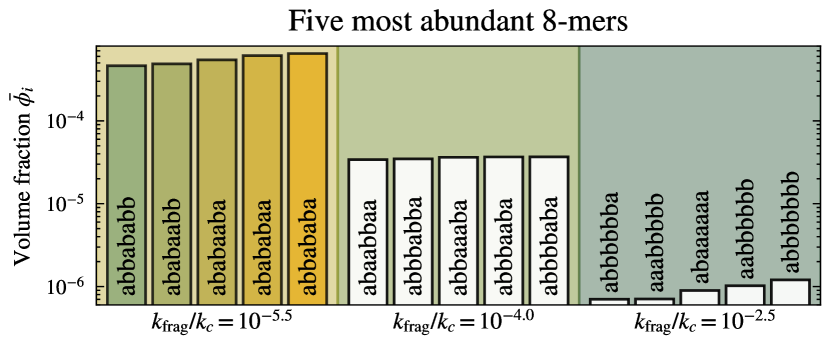
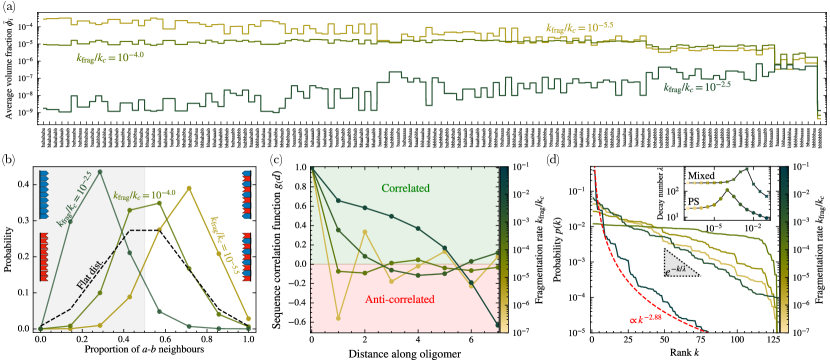
Breaking detailed balance of the rates in the oligomerization kinetics gives rise to a selection pressure that strongly changes the sequence distribution compared to thermodynamic equilibrium. For the parameters studied, we always observe a non-equilibrium steady state with a stationary sequence distribution. For low fragmentation rate coefficients , alternating sequences are favored, and the sequence distribution remains almost unchanged compared to thermodynamic equilibrium, as shown in Fig. 6 and the yellow distribution in Fig. 7a. For intermediate values values of (light green), the thermodynamic sequence bias is no longer evident, and the non-equilibrium sequence distribution at steady state is almost flat with approximately equal volume fractions for each sequence. For very large fragmentation rate coefficients , we find that the thermodynamic bias of sequences observed for vanishing inverts, i.e., sequences that are most depleted at thermodynamic equilibrium become most abundant in the non-equilibrium steady state, and vice versa.
The inverted thermodynamic bias for large fragmentation rate coefficients originates from thermodynamically unfavorable oligomers having the largest oligomerization rates. The inverted trend is related to the backward oligomerization pathway of monomer release being negligible compared to the fragmentation pathway for large . The result is, following the derivation in Appendix F, a non-equilibrium steady state (NESS) sequence distribution in the oligomer-rich phase (II):
| (6) |
where is the monomer chemical potential (Eq. (18)). We note that the effects of other sequences on the steady state abundance of sequence is described by the term . Thus, a sequence is more abundant if the set of sequences that oligomerize into () have unfavorable interactions with their environment, reflected in a larger value of their chemical potential . In other words, non-equilibrium fragmentation selects for sequences of lower cooperativity, that are homo-oligomer-like sequences. This selection mechanism is the opposite of the thermodynamic enrichment mechanism that favors sequences of higher cooperativity.
For increasing fragmentation rate coefficient , the most abundant sequences change from alternating oligomers to oligomers containing low complexity domains composed of the same monomeric unit. This trend is illustrated by the five most abundant sequences (Fig. 6) and by the probability distribution of --neighbors (Fig. 7b). We see that the five most abundant sequences for weak non-equilibrium driving () are alternating sequences with maximally two monomers of the same type neighboring each other. In this case, the --neighbor distribution is skewed toward an --proportion of 1, indicating that most -monomers are neighbored by monomers. Increasing to intermediate values enhances the length of domains composed of the same monomer type. For example, the five most abundant sequences contain sequences similar to , containing both alternating and homo-oligomeric parts. This results in an -distribution peaked around a half, but less spread than the flat distribution. When increasing the fragmentation rate coefficient further, domains composed of the same monomer type approach the max length, leading to almost homopolymeric sequences such as or . Consistently, the --distribution is more skewed toward a small fraction of --neighbors for increasing . To quantify the shift from alternating to sequences with more extended domains of the same monomer type, we use the correlation function defined in Eq. (4). Fig. 7c confirms that faster fragmentation leads to an increase in the wave number of the correlation function, corresponding to longer correlated domains of the same monomer type.
For weak non-equilibrium driving the exponential decay of the rank distribution of 8-mers, persists, as displayed in Fig. 7d. However, for intermediate fragmentation rates , the characteristic decay length increases to a maximum before decreasing. At the maximum, the sequence distribution is almost flat. A steeper rank distribution (smaller ) indicates a stronger selection pressure, where only a small subset of the sequences are selected. For very large fragmentation rate coefficients , the rank distribution approximately follows a power-law with . Power-laws in rank distributions were reported for many complex systems such as city sizes, gene circuits, and self-replicating systems [50]. Though the exponent is different from Zipf’s law [51], our finding suggests that our phase-separated-system with non-equilibrium oligomerization is complex enough for enabling open-ended evolution [50]. We note that without phase separation (mixed case), there is also a power-law behavior of the rank distribution for very large with an exponent close to Zipf’s law (see Appendix, Fig. 11).
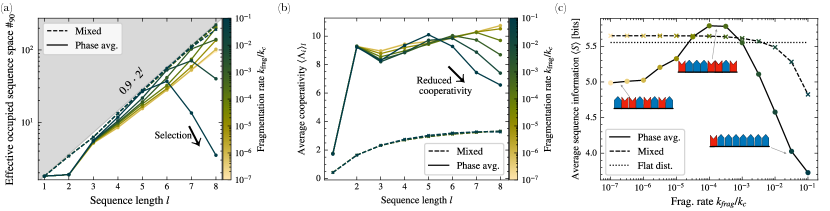
Maintaining oligomerization away from equilibrium gives rise to a strong selection mechanism, where only a small subset of all possible sequences accumulate most of the total oligomer volume fraction for that length. This effect is most pronounced for longer sequences. We characterize these observations by the quantity that is the smallest number of sequences corresponding to volume fraction for a given length (Fig. 8a):
| (7) |
This quantity characterizes the effectively occupied sequence space. At thermodynamic equilibrium, and independent of the interaction strength , scales exponentially in sequence length because longer length leads to exponentially more sequences (see Fig. 8a for low ). Strikingly, the selection pressure, once driven away from equilibrium, gets so strong for fast enough fragmentation (large ) that scales even sub-exponentially (Fig. 8a). Though the sequence distribution is less diverse when maintaining oligomerization away from equilibrium, the selection pressure facilitates specific sequence motifs to win over the others. The findings of sub-exponential scaling exemplify the potential of phase separation with oligomerization maintained away from equilibrium in providing a selection mechanism for short oligomers as they explore the exponentially large space of possible sequences.
Selection mediated by phase separation can be further corroborated by introducing a cooperativity measure. The cooperativity per sequence length () measures how well sequence interacts with its environment:
| (8) |
Here, the chemical potentials have been decomposed in terms of the composition-independent reference chemical potential , and the composition-dependent activity coefficient , such that , with the expressions given in Eq. (23). Chemical equilibrium enriches oligomers that interact well with sequences in their respective phase, corresponding to a larger average cooperativity (Fig. 8b). The longer an oligomer, the more cooperative segments exist at which other sequences can attach. We note that without phase separation (mixed case), sequences are relatively uncooperative and not well-adapted to their mixed environment. The increasing cooperativity trend with sequence length in the phase-separated case at thermodynamic equilibrium changes when maintaining oligomerization away from equilibrium. The cooperativity decreases as the selection pressure inverts the thermodynamic enrichment, leading to less alternating and more homopolymeric sequences. In other words, the faster the fragmentation, the more uncooperative sequences are selected. A selection for less cooperative sequences is a prerequisite for a prebiotic system to develop specific functionalities that are otherwise suppressed at thermodynamic equilibrium.
Finally, we ask whether the selected sequences store more or less information. We quantify the information content of each sequence by the number of --neighbors using Shannon’s measure of information [53, 54]:
| (9) |
where is the probability of sequence given the number of --neighbors of sequence , without prior knowledge about the sequence distribution. No prior knowledge corresponds to a flat sequence distribution. This means that each sequence of the given length with a specific value is equally likely. In this case, Eq. (9) gives the maximal value of
| (10) |
Thus, quantifies the information gained in bits by knowing the exact sequence, with the only prior information being the number of - neighbors corresponding to sequence . For example, there are only two sequences of length that are homo-oligomers . Thus, the probability of picking the correct homo-oligomer is one-half, yielding an information gain of 1 bit by finding out the actual sequence. Similarly, the sequence has a probability of among all sequences of four --neighbors, yielding an information gain of bits. Thus, assigns the same value of information to the sequences with the same value of . The average information of a sequence distribution is calculated as .
Phase-separated systems away from equilibrium change the information content of the selected sequences. Fig. 8c shows the average sequence information of 8-mers, , at the non-equilibrium steady state for increasing non-equilibrium fragmentation rate coefficient . For phase-separated systems, has a non-monotonous dependency on . Close to thermodynamic equilibrium (low ), phase separation favors low-information sequences, i.e., alternating sequences. Increasing the fragmentation rate coefficient leads to an increase in the average sequence information, exceeding the corresponding average for a flat distribution of 8-mers. The reason is that there is an enrichment of sequences with and --neighbors at the expense of homo-oligomers and alternating oligomers (Fig. 7b), which contain less information. Note that no such local maxima is observed without phase separation, where a monotonic decrease in average information content with fragmentation rate is observed. Increasing further, in the case with phase separation, selects for longer blocks of the same monomer type, strongly decreasing the average information content. Such low-information sequences are particularly interesting because they have the potential to show rich functionalities, such as catalytic activity or folding, and the extended blocks can mediate specific, lock-like interactions.
V Conclusion
In our work, we propose a theoretical framework for the oligomerization kinetics of sequences at non-dilute conditions. This framework builds on non-equilibrium thermodynamics and can be used to explore high-dimensional sequence spaces. Using our framework, we show that the oligomerization kinetics triggers the phase separation of sequences, which in turn creates a very strong bias for the enrichment and depletion of specific sequences. A key finding is that, in sequence distributions at thermodynamic equilibrium, more cooperative sequences that interact well with their environment are favored, while non-equilibrium fragmentation selects for low-information and less cooperative sequences.
Our findings can be tested experimentally considering nucleotide mixtures capable of DNA or RNA polymerization [14, 55, 19]. For large enough concentrations of nucleotides, long enough sequences can form such that the mixing entropy is low enough to facilitate phase separation into oligomer-rich and oligomer-poor phases. Large enough salt concentrations screen the negative charges of the DNA or RNA backbone, enabling sequence-specific, base-pair-mediated interactions at non-dilute conditions. Such interactions were shown to form liquid phases [37, 40] and gels [33, 34]. Non-equilibrium fragmentation need not be engineered; for RNA, it is an omnipresent property on reasonable experimental time-scales of hours to days [43, 26]. Deep sequencing techniques combined with HPLC and mass spectroscopy can screen for more cooperative or less cooperative sequences using, for example, the cooperativity measure proposed in this work.
Our theoretical work is relevant for the molecular Origin of Life [56, 57], and for designing de novo life systems capable of undergoing Darwinian evolution [58, 59]. In particular, our finding of a sub-exponential effective occupation of the possible sequence space indicates a very strong selection pressure by simply considering non-equilibrium fragmentation. Our work shows that maintaining the system away from equilibrium sets the prerequisite for a rich exploration of the sequence space and, thus, Darwinian evolution on a molecular scale. In particular, sequences of low cooperativity and low information are more likely to have exotic sequence patterns or motifs that may provide target-specific molecular functionalities, such as the catalysis of specific molecular components.
VI Acknowledgements
We are grateful for the insightful discussions with H. Vuijk, S. Gomez, M. Koul, and G. Granatelli. We are also grateful for the discussions with A. Schmid, F. Dänekamp, S. Wunnava, A. Serrao, and P. Schwintek on how to experimentally scrutinize our theoretical predictions. D. Braun and C. Weber thank the TRR 392: Molecular evolution in prebiotic environments (Project number 521256690) for support. C. Weber acknowledges the European Research Council (ERC) for financial support under the European Union’s Horizon 2020 research and innovation programme (“Fuelled Life” with Grant agreement No. 949021).
Appendix
Appendix A Most enriched mixed sequence with varying total volume fraction and fragmentation rate
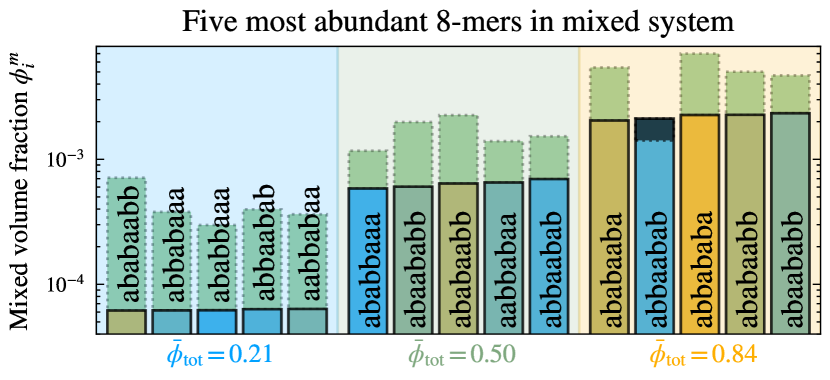
Here, we discuss the difference between the phase-separated system and the mixed system for the five most abundant sequences when varying the total sequence volume fraction at chemical equilibrium. For the most abundant 8-mers in a mixed system, homo-sub-strands of and appear more often than in the oligomer-rich phase, as displayed in Fig. 4a. As increases, the most enriched sequences change from more similar to the dilute phase (bluish) to more similar to the oligomer-rich phase (orangish). When approaches the oligomer-poor or -rich phase, the sequence distribution becomes the same. The mixed volume fractions of the most abundant sequences are generally much smaller than their corresponding quantity for the phase average (indicated by the dashed green bars). The relative increase through phase separation is the largest for smaller , as already observed in Fig. 4c. With an increasing value of , the distributions become less flat, and a depletion through phase separation is possible (indicated by the dashed black bar). The fact that the most enriched sequences in the oligomer-rich phase differ from those enriched when mixed means that phase separation is not simply a magnifier of volume fraction but comes with a bias.
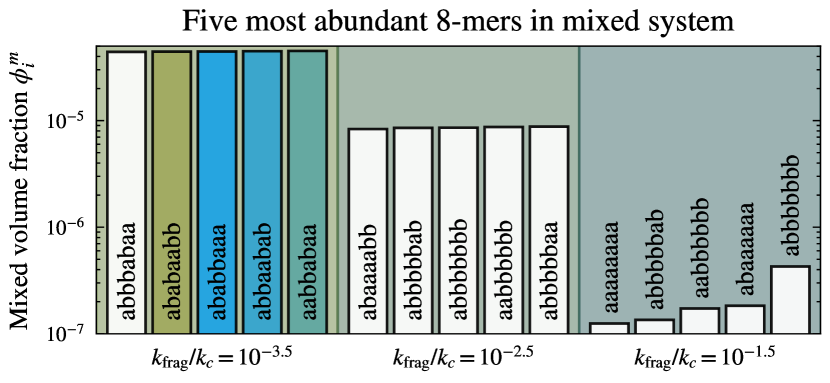
For a mixed system, a similar sequence selection as for phase-separated systems (displayed in Fig. 7) occurs with increasing fragmentation rate, as seen in Fig. 10. For slow fragmentation rates, the most enriched sequences are similar to mixed systems at chemical equilibrium (displayed in Fig. 4b). With increasing the most enriched 8-mers have longer blocks of the same monomer type; this happens concomitantly with the sequences distribution becoming flatter (Fig. 7d). For large fragmentation rates, the homopolymeric blocks almost span the size of the oligomer, as was observed with phase separation. For a mixed system, a larger value of is necessary for the same type of sequence selection as for a phase-separated system.
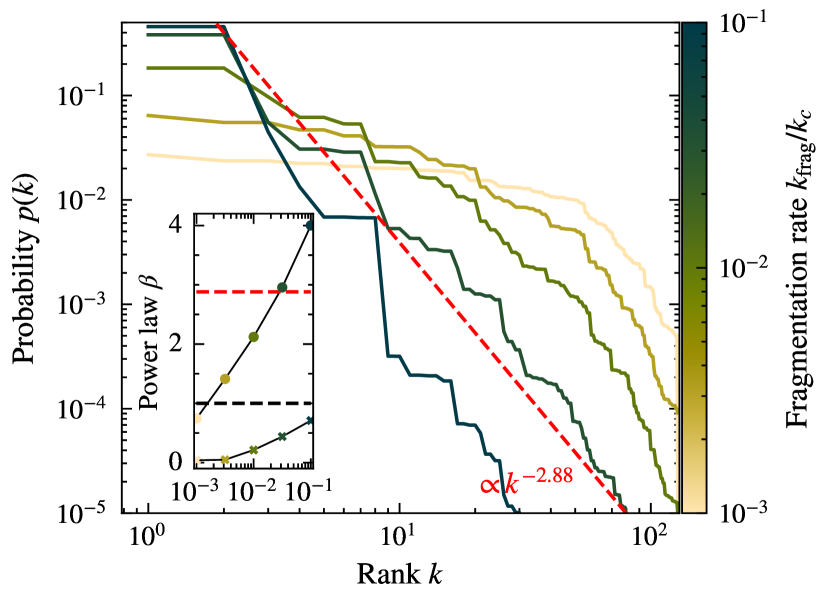
To verify the transition from an exponential decay in the rank distribution, as displayed in Fig. 7d, to a power-law decay, the same data is plotted in a log-log plot in Fig. 11. Once sufficiently far from equilibrium, the rank distribution approaches a straight line on a log-log representation, indicating a power-law decay. The best-fit exponent for the power law is displayed for different fragmentation rates in the inset, where the upper curve is phase-separated, and the lower is mixed. Note that the inset includes the best-fit power-law exponent for distributions with only a weak tendency of power-law. A power law exponent equal to one, as suggested by Zipf’s law [50], is indicated as a horizontal line in the inset.
Appendix B Thermodynamics of sequences: Free energy, interactions, and internal energy
The chemical potentials determine the oligomerization rates (Eq. (1d)) and are calculated from the free energy density . We consider a free energy with a mixing entropy and interaction up to second order in the volume fraction , often referred to as the Flory-Huggins free energy [39, 41, 60]:
| (11) | ||||
For two monomer types and , the number of oligomers grows exponentially with the maximal length ; . We assume the volumes of the two monomeric units to be equal, , and the volume of oligomers to increase linearly with the number of constituting monomers , as . Consequently, the relative oligomer molecular volumes also scale linearly with the number of monomers . The first four terms in equation (11) represent the mixing entropy and internal energy per length of the oligomers and the solvent. Whereas the last two terms describe the mean field Flory-Huggins interactions between two oligomers and as , and between each oligomer and the solvent as , relative to the thermal energy . As the sum over all volume fractions must add to one, the solvent volume fraction is set by the total volume fractions .
The Flory-Huggins interactions parameter between oligomers and is defined as [46], where gives the effective interaction energy between the two oligomers. The value for is determined by performing a Boltzmann average over all possible interaction energies when sliding on oligomer along the other. The interaction strength for a specific configuration can be written as (Fig. 12):
| (12) |
where picks the monomer-type at position of sequence . If there is an overhang, and therefore no unit to pair up with, takes a value of . To get the average interaction per length, the sum is normalized by the upper limit of the number of base-pair interactions, which is the length of the shortest of the two sequences, denoted . The sum thus adds up the total interaction energy for a given configuration, assuming pairwise interactions; these interactions are similar to a Watson-Crick for the case of DNA and RNA. The pairwise interaction strengths , , and , are input parameters populating the full interaction matrix. This matrix can be calculated prior to the numerical studies for a given maximal length , setting the number of possible sequences . An illustration of the interaction energy of a specific configuration is displayed in Fig. 1. Averaging over all possible pair-wise configurations, the effective interaction energy is found from the Boltzmann average:
| (13) |
where the sum over takes both orientations into account, and the second sum is over the possible sliding configurations per orientation, where gives the largest length of the two sequences .
The solvent interaction is assumed to be equal to the solvent interaction of its constituting monomeric units, , entering the Flory-Huggins interactions parameter as , where and are the number of monomers of type and in sequence .
A key contribution to the free energy (11) are the internal energies per length . We assign to each monomer type an intrinsic internal energy and , and let each monomer in the oligomer interact with its neighbors through the back-bone bond energies , , , such that
| (14) | ||||
where is the number of neighbors along oligomer . The self-interaction term is included to retrieve an unbiased sequence distribution, i.e., flat, in the dilute limit, where . In this work, we treat all backbones equally (sequence-independent), such that . This way, the backbone has no preference towards specific sequence patterns, making all bias shown in this work exclusively arise from interactions among sequences. Decreasing the value of will result in a larger average length. More parameters for next neighbor correlation could be introduced to better model sequence distributions in peptides [48, 49].
Appendix C Oligomerization at chemical equilibrium
At chemical equilibrium, the chemical potentials of all sequences are given by the chemical potential of the monomers
| (15) |
where is the number of monomers of type in oligomer , and correspondingly for type , such that . This condition represents that at chemical equilibrium, the chemical potential of oligomer must be equal to the chemical potential of its constituting monomers. When this condition is fulfilled, all oligomerization fluxes vanish (). If this condition is concomitantly satisfied with the conditions of phase coexistence, the system is at thermodynamic equilibrium. Mixed systems can satisfy chemical equilibrium but will not be at thermodynamic equilibrium.
From the chemical equilibrium condition, we see that it is the chemical potential of the monomeric units that determine the chemical potential of all other sequences (15), and hence their volume fraction. This leaves two independent degrees of freedom, namely the total volume fraction for each nucleotide basis,
| (16) |
These two quantities uniquely determine the chemical equilibrium sequence distribution in a given phase. As oligomerization conserves nucleotides, the total oligomer volume fraction of each nucleotide type, namely and , are conserved during the kinetics and must be specified when initializing the system. To find the length distribution, the total volume fraction can be decomposed into a total oligomer volume fraction for each length
| (17) |
To determine the sequence distribution, we must calculate the chemical potentials. From the free energy (11), the chemical potential of an oligomer (15) reads
| (18) | ||||
Using the chemical equilibrium condition (15), the sequence distribution is found to be
| (19) | ||||
The first line represents the mixing entropy, resulting in an exponential decay with length. The remaining terms characterize the energy change from distributing and monomers into an oligomer , changing the internal energy , and interaction energies with the solvent , and among sequences . The more negative the energy change, the larger will be.
With our choice of interactions and internal energies, one can write the equilibrium distribution as
| (20) | ||||
Notably, the solvent interactions do not affect the chemical equilibrium sequence distribution, though they affect the chemical reaction kinetics and phase compositions , . For two oligomers of equal length in a phase where , or alternatively and , we find that the non-solvent interaction terms solely set the relative volume fraction
| (21) | |||
We see that in a dilute system where , all sequences of each length will be equally abundant. As the total sequence volume fraction increases, the oligomer-oligomer interactions can co-enrich sequences that adapt to the sequence patterns in the respective phase, leading to more cooperative sequences. Each sequence is affected through interactions with all other sequences and likewise affects them in return.
The full sequence distribution in the oligomer poor and oligomer rich phases at thermodynamic equilibrium is depicted in Fig. 13. As Eq. (21) predicts, the oligomer poor phase (13a) does not contain sufficient oligomer material in order for enrichment or depletion of specific sequences. Thus, entropy dominates, leading to sequences of the same length being equally distributed, independent of the interaction strength . This is not the case in the oligomer-rich phase (Fig. 13b), where a strong enrichment and depletion is observed. For each length, the -axis is ordered after the number of --neighbours. The sequence distribution shows the general trend of an enrichment of sequence with many --neighbours, and depletion of those with few.
Equation (21) can further be used as a design principle for to realize a specific sequence distribution of -mers given some sequence distribution for . Since monomers and shorter sequences have the largest volume fractions, they will dominate the contribution for determining . Furthermore, since longer sequences are generally dilute, their effect on the volume fraction of shorter sequences can be disregarded. Thus, one might tune between the shorter sequences and the -mers for which a specific sequence distribution is desired by only summing for sequences where in Eq. (21).
The chemical potentials of each sequence can be expressed in terms of the reference chemical potential , which is composition independent, and the activity coefficient , containing the contributions from the interactions among sequences:
| (22) |
Through these quantities, one can define a cooperativity , measuring how well adapted a specific sequence is to its environment, as defined in Eq. (8). Using the expression for the chemical potential (18), one finds that
| (23) | ||||
The ratio of the activity coefficients of each phase sets the partitioning coefficient, [41]. At thermodynamic equilibrium, it is the component with the largest cooperativity that becomes the most abundant.
Appendix D Parameters and validity of theory
We consider the case where phase equilibrium holds at each time during the chemical kinetics. As a result, each thermodynamic quantity is homogeneous in each phase. This simplified case is satisfied if diffusion rates of reacting components are fast compared to the time scales of the chemical rates and fragmentation rate coefficients:
| (24) |
where is the characteristic system size and is the smallest diffusion coefficient of all the components.
The validity of this approximation must be understood through kinetic measurements of diffusion coefficients and chemical reaction rates. For a diffusion coefficient of and a reaction time scale of minutes, this is satisfied for system sizes of mm. The parameters used are listed in table 1.
| Figure | ||||||||||||
|---|---|---|---|---|---|---|---|---|---|---|---|---|
| 3 | 0 | 0 | -5 | -0.92 | -0.92 | -3.35 | -1.0 | 2 | 2 | 0.03 | 0.03 | 5 |
| 4 | 0 | 0 | -5 | -0.92 | -0.92 | -3.35 | -1.0 | 1 | 1 | – | – | 8 |
| 5 | 0 | 0 | -3.35 | -0.6 | 0.6 | 0.6 | – | – | 9 | |||
| 6 | 0 | 0 | -5 | -0.92 | -0.92 | -3.35 | -1.0 | 1.0 | 1.0 | 0.11 | 0.11 | 8 |
| 7 | 0 | 0 | -5 | -0.92 | -0.92 | -3.35 | -1.0 | 1.0 | 1.0 | 0.11 | 0.11 | 8 |
| 8 | 0 | 0 | -5 | -0.92 | -0.92 | -3.35 | -1.0 | 1.0 | 1.0 | 0.11 | 0.11 | 8 |
| 9 | 0 | 0 | -5 | -0.92 | -0.92 | -3.35 | -1.0 | 1.0 | 1.0 | 0.11 | 0.11 | 8 |
| 10 | 0 | 0 | -5 | -0.92 | -0.92 | -3.35 | -1.0 | 1.0 | 1.0 | – | – | 8 |
| 11 | 0 | 0 | -5 | -0.92 | -0.92 | -3.35 | -1.0 | 1.0 | 1.0 | 0.11 | 0.11 | 8 |
| 13 | 0 | 0 | -3.35 | -0.6 | 0.6 | 0.6 | – | – | 9 |
Appendix E Oligomerization kinetics at phase equilibrium
Using the method derived by Bauermann et al. [41], one can find the diffusive flux between the phases such that the system remains at phase coexistence. Here, we summarize their key equations and apply them to our reaction network. For a full description, see their complete work [41].
In this section, we derive the expression for the diffusive flux between the phases. To find this flux, we consider systems where the time scale of each sequence to diffuse the system size with a diffusion coefficient , , is short compared to the oligomerization time scale, , meaning . For phase-separated systems, this implies that the volume fraction profiles of each sequence in both phases are flat. Since the system must satisfy the conditions at all times, the oligomerization kinetics is confined to the binodal manifold (Fig. 2(c)).
For two-phase coexistence, this means that the chemical potentials in the two phases must follow
| (25) |
where contains monomers and sequences but not the solvent. Each side of the equation above can be rewritten using that the chemical potential of component depends on the composition of all other components, :
| (26) |
The time derivative of the volume fraction for incompressible systems, where the molecular volumes are constant in time , follow Eq. (1a). Using the expression for the volume change of the phase (Eq. (1b)), one obtains
| (27) |
Using this expression, we write the time-derivative of the chemical potentials as
| (28) |
that can be expressed in terms of the fluxes:
| (29) | ||||
Using the kinetic constraint of the chemical potentials (Eq. (25)), we find:
| (30) | |||
To obtain the equation above, we have used conservation of particle number of the diffusive flux, implying
| (31) |
Eq. (30) is satisfied for all , leaving one unknown, namely the diffusive flux of the solvent. It is determined by the balance of the osmotic pressure,
| (32) |
with a time evolution in each phase given as:
| (33) |
Using the time-derivative of the volume fractions (Eq. (27)), we find
| (34) | ||||
Equating the time derivative of the osmotic pressure in each phase , leaves us with
| (35) | |||
The set of equations in (35) and (30) can be written as a matrix-vector equation
| (36) |
which can be solved for . The reaction rates in each phase act as source terms in , while specifies how the composition changes in each phase will affect the chemical potentials and the osmotic pressure, constraining the diffusive fluxes between the phases to equalize the change in all quantities in each phase.
Appendix F Net oligomerization rate with non-equilibrium fragmentation
The net rate contains the monomer-pickup/release rate (Eq. (1c)) that fulfills detailed balance of the rates (Eq. (1e)), and the non-equilibrium fragmentation rate (Eq. (5)):
| (37) | ||||
where is the sub-oligomers of sequence resulting from a single fragmentation event. In the last term of the equation above, , takes a value of if is a member of , and zero otherwise, and is the Kronecker-delta.
One can find and approximate expression (6) for the sequence distribution of long sequences at the non-equilibrium steady state (NESS) by using that all time derivatives of Eq. (1a) is zero. This results in the condition that
| (38) |
concomitantly in both phases. Multiplying this condition by the respect phase volume yields, by utilizing Eq. (31), the simpler condition of
| (39) |
For olgiomers of the maximal length , the gain term from fragmentation in Eq. (37) is zero, such that Eq. (39) becomes
| (40) |
where the phase condition of the oligomerization rate has been omitted due to phase coexistence. From the diluteness of long sequences in the oligomer-poor phase (II), approximately no fragmentation of these sequences is occurring, such that
| (41) |
Using the expression for in Eq. (5), and the definition of the reaction rate (1d), where the reverse pathway has been omitted,
| (42) |
Here, is the set of sequences that can oligomerize into sequence . Solving for yields the final expression of Eq. (6).
References
- Robertson and Joyce [2012] Michael P. Robertson and Gerald F. Joyce. The Origins of the RNA World. Cold Spring Harbor Perspectives in Biology, 4(5):a003608, May 2012. ISSN , 1943-0264. doi: 10.1101/cshperspect.a003608. URL http://cshperspectives.cshlp.org/content/4/5/a003608. Company: Cold Spring Harbor Laboratory Press Distributor: Cold Spring Harbor Laboratory Press Institution: Cold Spring Harbor Laboratory Press Label: Cold Spring Harbor Laboratory Press Publisher: Cold Spring Harbor Lab.
- Kruger et al. [1982] K. Kruger, P. J. Grabowski, A. J. Zaug, J. Sands, D. E. Gottschling, and T. R. Cech. Self-splicing RNA: autoexcision and autocyclization of the ribosomal RNA intervening sequence of Tetrahymena. Cell, 31(1):147–157, November 1982. ISSN 0092-8674. doi: 10.1016/0092-8674(82)90414-7.
- Fedor and Williamson [2005] Martha J. Fedor and James R. Williamson. The catalytic diversity of RNAs. Nature Reviews. Molecular Cell Biology, 6(5):399–412, May 2005. ISSN 1471-0072. doi: 10.1038/nrm1647.
- Gilbert [1986] Walter Gilbert. Origin of life: The RNA world. Nature, 319:618, February 1986. ISSN 0028-0836. doi: 10.1038/319618a0. URL https://ui.adsabs.harvard.edu/abs/1986Natur.319..618G. ADS Bibcode: 1986Natur.319..618G.
- Birikh et al. [1997] K. R. Birikh, P. A. Heaton, and F. Eckstein. The structure, function and application of the hammerhead ribozyme. European Journal of Biochemistry, 245(1):1–16, April 1997. ISSN 0014-2956. doi: 10.1111/j.1432-1033.1997.t01-3-00001.x.
- Deck et al. [2011] Christopher Deck, Mario Jauker, and Clemens Richert. Efficient enzyme-free copying of all four nucleobases templated by immobilized RNA. Nature Chemistry, 3(8):603–608, July 2011. ISSN 1755-4349. doi: 10.1038/nchem.1086.
- Mariani et al. [2018] Angelica Mariani, David A. Russell, Thomas Javelle, and John D. Sutherland. A Light-Releasable Potentially Prebiotic Nucleotide Activating Agent. Journal of the American Chemical Society, 140(28):8657–8661, July 2018. ISSN 0002-7863. doi: 10.1021/jacs.8b05189. URL https://doi.org/10.1021/jacs.8b05189. Publisher: American Chemical Society.
- Walton et al. [2019] Travis Walton, Wen Zhang, Li Li, Chun Pong Tam, and Jack W. Szostak. The Mechanism of Nonenzymatic Template Copying with Imidazole-Activated Nucleotides. Angewandte Chemie (International Ed. in English), 58(32):10812–10819, August 2019. ISSN 1521-3773. doi: 10.1002/anie.201902050.
- Wunnava et al. [2021] Sreekar Wunnava, Christina F. Dirscherl, Jakub Výravský, Aleš Kovařík, Roman Matyášek, Jiří Šponer, Dieter Braun, and Judit E. Šponer. Acid-Catalyzed RNA-Oligomerization from 3’,5’-cGMP. Chemistry (Weinheim an Der Bergstrasse, Germany), 27(70):17581–17585, December 2021. ISSN 1521-3765. doi: 10.1002/chem.202103672.
- McCall et al. [1992] Maxine J McCall, Philip Hendry, and Philip A Jennings. Minimal sequence requirements for ribozyme activity. Proceedings of the National Academy of Sciences, 89(13):5710–5714, 1992.
- Ianeselli et al. [2023a] Alan Ianeselli, Annalena Salditt, Christof Mast, Barbara Ercolano, Corinna L Kufner, Bettina Scheu, and Dieter Braun. Physical non-equilibria for prebiotic nucleic acid chemistry. Nature Reviews Physics, 5(3):185–195, 2023a.
- Tkachenko and Maslov [2015] Alexei V. Tkachenko and Sergei Maslov. Spontaneous emergence of autocatalytic information-coding polymers. The Journal of Chemical Physics, 143(4):045102, July 2015. ISSN 0021-9606. doi: 10.1063/1.4922545. URL https://doi.org/10.1063/1.4922545.
- Tkachenko and Maslov [2018] Alexei V. Tkachenko and Sergei Maslov. Onset of natural selection in populations of autocatalytic heteropolymers. The Journal of Chemical Physics, 149(13):134901, October 2018. ISSN 0021-9606. doi: 10.1063/1.5048488. URL https://doi.org/10.1063/1.5048488.
- Mast et al. [2013] Christof B. Mast, Severin Schink, Ulrich Gerland, and Dieter Braun. Escalation of polymerization in a thermal gradient. Proceedings of the National Academy of Sciences, 110(20):8030–8035, May 2013. doi: 10.1073/pnas.1303222110. URL https://www.pnas.org/doi/full/10.1073/pnas.1303222110. Publisher: Proceedings of the National Academy of Sciences.
- Matreux et al. [2024] Thomas Matreux, Paula Aikkila, Bettina Scheu, Dieter Braun, and Christof B. Mast. Heat flows enrich prebiotic building blocks and enhance their reactivity. Nature, 628(8006):110–116, April 2024. ISSN 1476-4687. doi: 10.1038/s41586-024-07193-7. URL https://www.nature.com/articles/s41586-024-07193-7. Publisher: Nature Publishing Group.
- Fares et al. [2020] Hadi M Fares, Alexander E Marras, Jeffrey M Ting, Matthew V Tirrell, and Christine D Keating. Impact of wet-dry cycling on the phase behavior and compartmentalization properties of complex coacervates. Nature communications, 11(1):5423, 2020.
- Maguire et al. [2021] Oliver R. Maguire, Iris B. A. Smokers, and Wilhelm T. S. Huck. A physicochemical orthophosphate cycle via a kinetically stable thermodynamically activated intermediate enables mild prebiotic phosphorylations. Nature Communications, 12(1):5517, September 2021. ISSN 2041-1723. doi: 10.1038/s41467-021-25555-x. URL https://www.nature.com/articles/s41467-021-25555-x. Publisher: Nature Publishing Group.
- Haugerud et al. [2024] Ivar Svalheim Haugerud, Pranay Jaiswal, and Christoph A. Weber. Nonequilibrium Wet–Dry Cycling Acts as a Catalyst for Chemical Reactions. The Journal of Physical Chemistry B, 128(7):1724–1736, February 2024. ISSN 1520-6106. doi: 10.1021/acs.jpcb.3c05824. URL https://doi.org/10.1021/acs.jpcb.3c05824. Publisher: American Chemical Society.
- Mutschler et al. [2015] Hannes Mutschler, Aniela Wochner, and Philipp Holliger. Freeze–thaw cycles as drivers of complex ribozyme assembly. Nature Chemistry, 7(6):502–508, June 2015. ISSN 1755-4349. doi: 10.1038/nchem.2251. URL https://www.nature.com/articles/nchem.2251. Publisher: Nature Publishing Group.
- Eleveld et al. [2024] Marcel J. Eleveld, Yannick Geiger, Juntian Wu, Armin Kiani, Gaël Schaeffer, and Sijbren Otto. Competitive Exclusion among Self-Replicating Molecules Curtails the Tendency of Chemistry to Diversify, May 2024. URL https://chemrxiv.org/engage/chemrxiv/article-details/664dae5791aefa6ce1a7ce2b.
- Liu et al. [2024] Kai Liu, Alex Blokhuis, Chris van Ewijk, Armin Kiani, Juntian Wu, Wouter H. Roos, and Sijbren Otto. Light-driven eco-evolutionary dynamics in a synthetic replicator system. Nature Chemistry, 16(1):79–88, January 2024. ISSN 1755-4349. doi: 10.1038/s41557-023-01301-2. URL https://www.nature.com/articles/s41557-023-01301-2. Publisher: Nature Publishing Group.
- Morasch et al. [2019] Matthias Morasch, Jonathan Liu, Christina F. Dirscherl, Alan Ianeselli, Alexandra Kühnlein, Kristian Le Vay, Philipp Schwintek, Saidul Islam, Mérina K. Corpinot, Bettina Scheu, Donald B. Dingwell, Petra Schwille, Hannes Mutschler, Matthew W. Powner, Christof B. Mast, and Dieter Braun. Heated gas bubbles enrich, crystallize, dry, phosphorylate and encapsulate prebiotic molecules. Nature Chemistry, 11(9):779–788, September 2019. ISSN 1755-4349. doi: 10.1038/s41557-019-0299-5.
- Mizuuchi et al. [2019] Ryo Mizuuchi, Alex Blokhuis, Lena Vincent, Philippe Nghe, Niles Lehman, and David Baum. Mineral surfaces select for longer RNA molecules. Chemical Communications, 55(14):2090–2093, February 2019. ISSN 1364-548X. doi: 10.1039/C8CC10319D. URL https://pubs.rsc.org/en/content/articlelanding/2019/cc/c8cc10319d. Publisher: The Royal Society of Chemistry.
- Kudella et al. [2021] Patrick W. Kudella, Alexei V. Tkachenko, Annalena Salditt, Sergei Maslov, and Dieter Braun. Structured sequences emerge from random pool when replicated by templated ligation. Proceedings of the National Academy of Sciences, 118(8):e2018830118, February 2021. doi: 10.1073/pnas.2018830118. URL https://www.pnas.org/doi/full/10.1073/pnas.2018830118. Publisher: Proceedings of the National Academy of Sciences.
- Calaça Serrão et al. [2024] Adriana Calaça Serrão, Felix T Dänekamp, Zsófia Meggyesi, and Dieter Braun. Replication elongates short DNA, reduces sequence bias and develops trimer structure. Nucleic Acids Research, 52(3):1290–1297, February 2024. ISSN 0305-1048. doi: 10.1093/nar/gkad1190. URL https://doi.org/10.1093/nar/gkad1190.
- Calaça Serrão et al. [2024] Adriana Calaça Serrão, Sreekar Wunnava, Avinash V. Dass, Lennard Ufer, Philipp Schwintek, Christof B. Mast, and Dieter Braun. High-Fidelity RNA Copying via 2’,3’-Cyclic Phosphate Ligation. Journal of the American Chemical Society, 146(13):8887–8894, April 2024. ISSN 0002-7863. doi: 10.1021/jacs.3c10813. URL https://doi.org/10.1021/jacs.3c10813. Publisher: American Chemical Society.
- Bartolucci et al. [2023] Giacomo Bartolucci, Adriana Calaça Serrão, Philipp Schwintek, Alexandra Kühnlein, Yash Rana, Philipp Janto, Dorothea Hofer, Christof B. Mast, Dieter Braun, and Christoph A. Weber. Sequence self-selection by cyclic phase separation. Proceedings of the National Academy of Sciences, 120(43):e2218876120, October 2023. doi: 10.1073/pnas.2218876120. URL https://www.pnas.org/doi/10.1073/pnas.2218876120. Publisher: Proceedings of the National Academy of Sciences.
- Haldane [1929] John Burdon Sanderson Haldane. The origin of life. Rationalist Annual, 148:3–10, 1929.
- Oparin [1938] Aleksandr Ivanovich Oparin. The Origin of Life. Dover Publications Inc., New York, NY, 2 edition, June 1938. ISBN 978-0-486-60213-4.
- Fox [1976] Sidney W Fox. The evolutionary significance of phase-separated microsystems. Origins of Life, 7(1):49–68, 1976.
- Tirard [2017] Stéphane Tirard. Jbs haldane and the origin of life. Journal of genetics, 96(5):735–739, 2017.
- Hu et al. [2021] Taishan Hu, Nilesh Chitnis, Dimitri Monos, and Anh Dinh. Next-generation sequencing technologies: An overview. Human Immunology, 82(11):801–811, 2021.
- Sato et al. [2020] Yusuke Sato, Tetsuro Sakamoto, and Masahiro Takinoue. Sequence-based engineering of dynamic functions of micrometer-sized DNA droplets. Science Advances, 6(23):eaba3471, June 2020. doi: 10.1126/sciadv.aba3471. URL https://www.science.org/doi/10.1126/sciadv.aba3471. Publisher: American Association for the Advancement of Science.
- Xing et al. [2018] Zhongyang Xing, Alessio Caciagli, Tianyang Cao, Iliya Stoev, Mykolas Zupkauskas, Thomas O’Neill, Tobias Wenzel, Robin Lamboll, Dongsheng Liu, and Erika Eiser. Microrheology of DNA hydrogels. Proceedings of the National Academy of Sciences, 115(32):8137–8142, August 2018. doi: 10.1073/pnas.1722206115. URL https://www.pnas.org/doi/full/10.1073/pnas.1722206115. Publisher: Proceedings of the National Academy of Sciences.
- Nakata et al. [2007] Michi Nakata, Giuliano Zanchetta, Brandon D. Chapman, Christopher D. Jones, Julie O. Cross, Ronald Pindak, Tommaso Bellini, and Noel A. Clark. End-to-End Stacking and Liquid Crystal Condensation of 6– to 20–Base Pair DNA Duplexes. Science, 318(5854):1276–1279, November 2007. doi: 10.1126/science.1143826. URL https://www.science.org/doi/10.1126/science.1143826. Publisher: American Association for the Advancement of Science.
- Zanchetta et al. [2008] G. Zanchetta, M. Nakata, M. Buscaglia, N. A. Clark, and T. Bellini. Liquid crystal ordering of DNA and RNA oligomers with partially overlapping sequences. Journal of Physics: Condensed Matter, 20(49):494214, November 2008. ISSN 0953-8984. doi: 10.1088/0953-8984/20/49/494214. URL https://dx.doi.org/10.1088/0953-8984/20/49/494214.
- Aumiller et al. [2016] William M. Aumiller, Fatma Pir Cakmak, Bradley W. Davis, and Christine D. Keating. RNA-Based Coacervates as a Model for Membraneless Organelles: Formation, Properties, and Interfacial Liposome Assembly. Langmuir: the ACS journal of surfaces and colloids, 32(39):10042–10053, October 2016. ISSN 1520-5827. doi: 10.1021/acs.langmuir.6b02499.
- Jeon et al. [2018] Byoung-jin Jeon, Dan T. Nguyen, Gabrielle R. Abraham, Nathaniel Conrad, Deborah K. Fygenson, and Omar A. Saleh. Salt-dependent properties of a coacervate-like, self-assembled DNA liquid. Soft Matter, 14(34):7009–7015, August 2018. ISSN 1744-6848. doi: 10.1039/C8SM01085D. URL https://pubs.rsc.org/en/content/articlelanding/2018/sm/c8sm01085d. Publisher: The Royal Society of Chemistry.
- Bartolucci et al. [2024] Giacomo Bartolucci, Ivar S. Haugerud, Thomas C. T. Michaels, and Christoph A. Weber. The interplay between biomolecular assembly and phase separation. eLife, 13, May 2024. doi: 10.7554/eLife.93003.1. URL https://elifesciences.org/reviewed-preprints/93003. Publisher: eLife Sciences Publications Limited.
- Mitrea and Kriwacki [2016] Diana M. Mitrea and Richard W. Kriwacki. Phase separation in biology; functional organization of a higher order. Cell Communication and Signaling, 14(1):1, January 2016. ISSN 1478-811X. doi: 10.1186/s12964-015-0125-7. URL https://doi.org/10.1186/s12964-015-0125-7.
- Bauermann et al. [2022] Jonathan Bauermann, Sudarshana Laha, Patrick M. McCall, Frank Jülicher, and Christoph A. Weber. Chemical Kinetics and Mass Action in Coexisting Phases. Journal of the American Chemical Society, 144(42):19294–19304, October 2022. ISSN 0002-7863. doi: 10.1021/jacs.2c06265. URL https://doi.org/10.1021/jacs.2c06265. Publisher: American Chemical Society.
- Zwicker [2022] David Zwicker. The intertwined physics of active chemical reactions and phase separation. Current Opinion in Colloid & Interface Science, 61:101606, 2022.
- Göppel et al. [2022] Tobias Göppel, Joachim H. Rosenberger, Bernhard Altaner, and Ulrich Gerland. Thermodynamic and Kinetic Sequence Selection in Enzyme-Free Polymer Self-Assembly inside a Non-equilibrium RNA Reactor. Life, 12(4):567, April 2022. ISSN 2075-1729. doi: 10.3390/life12040567. URL https://www.mdpi.com/2075-1729/12/4/567. Number: 4 Publisher: Multidisciplinary Digital Publishing Institute.
- Van Kampen [1973] NG Van Kampen. Nonlinear irreversible processes. Physica, 67(1):1–22, 1973.
- Jülicher et al. [1997] Frank Jülicher, Armand Ajdari, and Jacques Prost. Modeling molecular motors. Reviews of Modern Physics, 69(4):1269–1282, 1997. doi: 10.1103/RevModPhys.69.1269. URL https://link.aps.org/doi/10.1103/RevModPhys.69.1269. Publisher: American Physical Society.
- Weber et al. [2019] Christoph A. Weber, David Zwicker, Frank Jülicher, and Chiu Fan Lee. Physics of active emulsions. Reports on Progress in Physics, 82(6):064601, April 2019. ISSN 0034-4885. doi: 10.1088/1361-6633/ab052b. URL https://dx.doi.org/10.1088/1361-6633/ab052b. Publisher: IOP Publishing.
- Kilchherr et al. [2016] Fabian Kilchherr, Christian Wachauf, Benjamin Pelz, Matthias Rief, Martin Zacharias, and Hendrik Dietz. Single-molecule dissection of stacking forces in dna. Science, 353(6304):aaf5508, 2016. doi: 10.1126/science.aaf5508. URL https://www.science.org/doi/abs/10.1126/science.aaf5508.
- Toal et al. [2015] Siobhan E. Toal, Nina Kubatova, Christian Richter, Verena Linhard, Harald Schwalbe, and Reinhard Schweitzer-Stenner. Randomizing the Unfolded State of Peptides (and Proteins) by Nearest Neighbor Interactions between Unlike Residues. Chemistry – A European Journal, 21(13):5173–5192, 2015. ISSN 1521-3765. doi: 10.1002/chem.201406539. URL https://onlinelibrary.wiley.com/doi/abs/10.1002/chem.201406539. _eprint: https://onlinelibrary.wiley.com/doi/pdf/10.1002/chem.201406539.
- Mu and Gao [2007] Yan Mu and Yi Qin Gao. Effects of hydrophobic and dipole-dipole interactions on the conformational transitions of a model polypeptide. The Journal of Chemical Physics, 127(10):105102, September 2007. ISSN 0021-9606. doi: 10.1063/1.2768062. URL https://doi.org/10.1063/1.2768062.
- CANCHO and SOLÉ [2002] RAMON FERRER i CANCHO and RICARD V. SOLÉ. Zipf’s law and random texts. Advances in Complex Systems, 05(01):1–6, 2002. doi: 10.1142/S0219525902000468. URL https://doi.org/10.1142/S0219525902000468.
- Zipf [1932] George Kingsley Zipf. Selected Studies of the Principle of Relative Frequency in Language. Harvard University Press, Cambridge, MA and London, England, 1932. ISBN 9780674434929. doi: doi:10.4159/harvard.9780674434929. URL https://doi.org/10.4159/harvard.9780674434929.
- Lempel and Ziv [1976] A. Lempel and J. Ziv. On the complexity of finite sequences. IEEE Transactions on Information Theory, 22(1):75–81, 1976. doi: 10.1109/TIT.1976.1055501.
- Shannon [1948] C. E. Shannon. A mathematical theory of communication. The Bell System Technical Journal, 27(3):379–423, 1948. doi: 10.1002/j.1538-7305.1948.tb01338.x.
- Ben-Naim and Casadei [2017] Arieh Ben-Naim and Diego Casadei. Modern thermodynamics. World Scientific Hackensack, NJ, USA, 2017.
- Rosenberger et al. [2021] Joachim H. Rosenberger, Tobias Göppel, Patrick W. Kudella, Dieter Braun, Ulrich Gerland, and Bernhard Altaner. Self-Assembly of Informational Polymers by Templated Ligation. Physical Review X, 11(3):031055, September 2021. ISSN 2160-3308. doi: 10.1103/PhysRevX.11.031055. URL https://link.aps.org/doi/10.1103/PhysRevX.11.031055.
- Ianeselli et al. [2023b] Alan Ianeselli, Annalena Salditt, Christof Mast, Barbara Ercolano, Corinna L. Kufner, Bettina Scheu, and Dieter Braun. Physical non-equilibria for prebiotic nucleic acid chemistry. Nature Reviews Physics, 5(3):185–195, March 2023b. ISSN 2522-5820. doi: 10.1038/s42254-022-00550-3. URL https://www.nature.com/articles/s42254-022-00550-3. Publisher: Nature Publishing Group.
- Budin and Szostak [2010] Itay Budin and Jack W. Szostak. Expanding roles for diverse physical phenomena during the origin of life. Annual Review of Biophysics, 39:245–263, 2010. ISSN 1936-1238. doi: 10.1146/annurev.biophys.050708.133753.
- Otto [2022] Sijbren Otto. An Approach to the De Novo Synthesis of Life. Accounts of Chemical Research, 55(2):145–155, January 2022. ISSN 0001-4842. doi: 10.1021/acs.accounts.1c00534. URL https://doi.org/10.1021/acs.accounts.1c00534. Publisher: American Chemical Society.
- Kriebisch et al. [2024] Christine Kriebisch, Olga Bantysh, Lorena Baranda, Andrea Belluati, Eva Bertosin, Kun Dai, Maria de Roy, Hailin Fu, Nicola Galvanetto, and Julianne Gibbs. A roadmap towards the synthesis of Life. ChemRxiv., 2024. doi: 10.26434/chemrxiv-2024-tnx83. URL https://chemrxiv.org/engage/chemrxiv/article-details/668b9aaf01103d79c55e9fab.
- Laha et al. [2024] Sudarshana Laha, Jonathan Bauermann, Frank Jülicher, Thomas C. T. Michaels, and Christoph A. Weber. Chemical Reactions regulated by Phase-Separated Condensates, March 2024. URL http://arxiv.org/abs/2403.05228. arXiv:2403.05228 [cond-mat].