Compressing regularised dynamics
improves link prediction in sparse networks
Abstract
Predicting future interactions or novel links in networks is an indispensable tool across diverse domains, including genetic research, online social networks, and recommendation systems.
Among the numerous techniques developed for link prediction, those leveraging the networks’ community structure have proven highly effective.
For example, the recently proposed MapSim predicts links based on a similarity measure derived from the code structure of the map equation, a community-detection objective function that operates on network flows.
However, the standard map equation assumes complete observations and typically identifies many small modules in networks where the nodes connect through only a few links.
This aspect can degrade MapSim’s performance on sparse networks.
To overcome this limitation, we incorporate a global regularisation method based on a Bayesian estimate of the transition rates along with three local regularisation methods.
The regularised versions of the map equation compensate for incomplete observations and decrease the number of identified communities in sparse networks.
The regularised methods outperform standard MapSim and several state-of-the-art embedding methods in highly sparse networks.
This performance holds across multiple real-world networks with randomly removed links, simulating incomplete observations.
Among the proposed regularisation methods, the global regularisation method provides the most reliable community detection and the highest link prediction performance across different network densities.
Keywords: link prediction, machine learning, network analysis, community-detection, graph learning, map equation, MapSim, Infomap.
1 Introduction
Predicting gene-gene interactions in biological systems paves the way for breakthroughs in genetic research [1], identifying friends in online social networks enhances user engagement [2], and suggesting items in retail recommendation systems boosts revenue and customer satisfaction [3]. In these link prediction applications, both performance and interpretability are crucial.
Popular network embedding methods, such as DeepWalk [4], node2vec [5], NERD [6], and LINE [7], predict links using a two-step approach. First, they embed nodes in a latent space to capture the network’s structure, potentially including modular patterns. Next, they predict links based on the proximity of nodes within this latent space. These methods are highly scalable, capable of capturing local and global network structures, and are also useful for node classification tasks. While they often perform well in link prediction tests, the differences in methods and metrics for the embedding and prediction steps complicate interpretability.
The recently introduced link prediction method MapSim [8] — map equation similarity — offers enhanced transparency by capitalising on the modular code structure that reflects the communities identified by Infomap [9]. Infomap optimises the flow-based and information-theoretic objective function known as the map equation to find the network partition that minimises the modular description of a random walk on the network. The map equation favours densely connected communities where the random walk persists relatively long before leaving. The corresponding modular code structure enables the highest compression for conveying the random walk’s trajectory. The optimal code structure best captures modular regularities in the dynamics on the network, with short codes for frequent transitions within modules and longer codes for infrequent transitions between modules. MapSim exploits these codes by interpreting the codelength to describe a step from a given node to any other node in the network as the distance between them. These asymmetric node similarities enable accurate and interpretable predictions of future interactions, including novel links, in sufficiently dense networks.
Predicting links in sparse networks is more challenging because they contain less structural information. For example, many retail recommendation systems must operate in sparse regions of networks, such as those formed by new customers or products with only a few interactions. Since the standard map equation employed by MapSim assumes that future interactions and other unobserved links are genuinely absent, it favours many small modules to best describe the constrained dynamics in highly sparse networks, which can degrade MapSim’s performance. To overcome this challenge, we base MapSim on the map equation with regularised dynamics, enabling more robust community detection when the structural information is limited. We employ a global regularisation technique based on a Bayesian estimate of the transition rates developed to identify reliable communities in networks with incomplete observations [10] and introduce three local regularisation techniques: one using common-neighbour-biased transition rates and two using modified Markov times [11].
We found that regularising the dynamics reduces the number of modules and helps MapSim provide more accurate link predictions based on reliable communities in highly sparse networks. The local regularisation techniques perform well on specific networks, but the global regularisation performs best overall. Basing MapSim on a Bayesian estimate of the transition rates provides a transparent, reliable, and efficient method for link prediction in sparse networks.
2 Background: The map equation framework
The map equation [12] is a flow-based objective function for community detection that combines principles from information theory and coding theory with the concept of random walks. The map equation measures the quality of a network partition as the expected per-step description length — the codelength — for a random walk on the network. Detecting the optimal communities is a search problem that involves minimising the map equation by identifying sets of nodes where the random walker stays for a relatively long time.
For illustration, consider a communication game where the sender observes a random walker on a network and updates the receiver about the random walker’s position after each step. The network consists of nodes and possibly weighted and directed links , with denoting the weight on the link from node to node (Fig. 1a). Given an assignment of nodes to modules, how succinctly can the sender update the receiver about the position of the random walker? Which assignment gives the shortest description?
In the simplest case, all nodes belong to the same community and receive unique codewords, for example using Huffman coding [13], where more frequently visited nodes receive shorter codewords (Fig. 1b). According to Shannon’s source coding theorem [14], the shortest possible codelength is the entropy of the nodes’ visit rates
| (1) |
where is the Shannon entropy, is the set of the nodes’ visit rates, and is the visit rate of node .
In networks with community structure, the description of the random walker’s path can be compressed by partitioning the nodes into modules . Within each module , nodes receive unique codewords, but the same codewords can be reused in different modules, leading to shorter codewords on average (Fig. 1c). To communicate when the random walker switches modules, each module also receives a dedicated exit codeword, and entering modules is described using a designated index-level codebook. The two-level map equation calculates the codelength for a partition of the nodes into modules as an average of index-level and module-level entropies, weighted by the rates at which the respective codebooks are used
| (2) |
where is the index codebook’s use rate and is the entry rate for module with for the transition probability from to . The set of normalised module entry rates is , and the use rate for module ’s codebook, , is the sum of the exit rate for and the visit rates of all nodes in , , where . Finally, is the set of module-normalised node visit rates in , including ’s exit rate. Through recursion, the map equation has been generalised for hierarchical partitions with nested submodules [15].
2.1 Global Regularisation
The standard map equation assumes complete observations and considers unobserved links as genuinely absent, which can cause issues in networks with missing observations. For reliable community detection in such cases, the map equation can be regularised using a Bayesian estimate of the transition rates between nodes [10]. This approach considers networks with multi-edges where the observed integer-valued link counts can be smaller or equal to the true counts (Fig. 2).
The transition rate between nodes and , denoted , is estimated by introducing a prior over the probabilities that a random walker steps from node to other nodes, , where is the number of nodes in the network. The posterior transition rates are estimated as
| (3) |
where and is the number of observed links between nodes and . The posterior is determined using a Dirichlet prior, and the likelihood
| (4) |
where is the out-strength of node . The estimated transition rates in Eq. 3 can be computed as
| (5) |
where can be interpreted as a node-dependent teleportation parameter for the random walker. A random walker at node follows an observed link with probability , corresponding to the first term in Eq. 5, and a link in the prior network with probability , corresponding to the second term. The parameters are link weights in the prior network defined as
| (6) |
The connectivity parameter captures the prior assumption of the connection between and , and is the expected link weight between nodes and according to the so-called continuous configuration model [16].
Infomap can generate the weighted network with global regularisation, , at no extra computational cost thanks to an efficient representation of the prior network. Since the default prior strength assumes large , we scale it down in small networks to prevent collapsing into a single community. Adjusting the prior strength is available as an option in Infomap.
2.2 MapSim
MapSim is a node-similarity measure based on the map equation introduced for similarity-based link prediction [8]. MapSim uses the map equation’s code structure to compute pairwise similarity scores between nodes. Nodes in the same module, or submodule in hierarchical partitions, are generally considered more similar since a transition between them can be described more efficiently with shorter codewords, corresponding to more probable links. To compute the similarity between nodes and , MapSim identifies the smallest submodule that contains both nodes. With rate at which a random walker at travels to ’s root, and rate at which a random walker at the root of travels to , the cost in bits for stepping from to is
| (7) |
With this approach, MapSim can describe any link, whether that link exists in the network or not. This capability is crucial in settings such as recommendation systems, where many links have yet to form. By relating the probability that non-links form to their description cost, MapSim predicts future links (Fig. 3).
3 Regularisation for link prediction
Link observations are incomplete in many real-world scenarios for various reasons: some links are harder to observe, others have not yet formed, or the network is too costly to observe in its entirety. Applying the standard map equation to networks with incomplete observations can lead to inaccurate communities if the observed link weights reflect the true weights poorly, affecting downstream tasks such as link prediction with MapSim. To account for incomplete observations, we combine MapSim with the global regularisation of the random walker’s transition rates.
The schematic example in Fig. 4 illustrates how incomplete observations distort link predictions and how global regularisation mitigates this effect. With complete data, the standard map equation detects two communities (Fig. 4a). After removing some of the multi-edges to simulate incomplete data, it identifies three communities, altering the link prediction results (Fig. 4b). In the complete network, MapSim considers a link from node 4 to 6 more likely than one from node 4 to 2 due to the lower description cost. Conversely, with incomplete data, the link between nodes 4 and 2 becomes more likely. Applying global regularisation recovers the two communities, restoring MapSim’s prediction that the link from node 4 to 6 is more likely (Fig. 4c).
In some cases, global regularisation can obscure local regularities in networks. In response, we evaluated three local regularisation techniques: two based on established methods and one using a new approach that reconnects nodes based on their proximity to restore local regularities in incomplete networks. Common Neighbours focuses on connecting nodes that share neighbours. Mixed Markov Time (MMT) works similarly but extends naturally to weighted links. The proposed new method, Variable Markov Time (VMT), adjusts the random walker’s speed according to node degrees, allowing it to move farther in sparser regions [11]. By adding links preferentially in these regions, it compactifies chains of low-degree nodes that can cause spurious modules while leaving denser areas intact. The local regularisation methods generate new weighted links. We combined the new weights from the local regularisation, , with those from the global regularisation, , by summing their weights
| (8) |
3.1 Local Regularisation — Common Neighbours
Common Neighbours connects closely related nodes in triangles [17]. If two nodes, and , have a common neighbour, they are connected by a link with weight
| (9) |
where and are the sets of adjacent nodes to and , respectively. Common neighbours then constructs a matrix where the entries are defined in Eq. 9. Applied to the example network with missing observations in Fig. 2 with unweighted links for simplicity, Common Neighbours reconstructs some of the missing links (Fig. 5).
3.2 Local Regularisation — Mixed Markov Time
Missing links can create chains of low-degree nodes that prevent random walkers from reaching otherwise nearby nodes. We address this effect by taking longer steps in the network using the squared transition matrix, , which connects second-degree neighbours. To form the reconstructed network, we combine the existing transitions, represented by the transition matrix T, and the two-step transitions, represented by the squared transition matrix , weighted by the parameter
| (10) |
where we set the matrix diagonals to zero to avoid self-links, as they would counteract the effect of enabling longer steps. Figure 6 illustrates the Mixed Markov Time regularisation with the incomplete example network from Fig. 2 with unweighted links for simplicity. Like Common Neighbours, this regularisation method also reconstructs some of the missing links.
3.3 Local Regularisation — Variable Markov Time
The map equation formulates community detection as a compression problem by modelling network flow as a random walk. Minimising the random walk’s description corresponds to identifying communities that characterise the network’s organisation. In regions made sparse by missing link observations, such as chains of nodes, this approach may lead to over-partitioning. To reduce this effect, we propose a local regularisation approach based on Variable Markov Time scaling [11]. By adding links between nearby low-degree nodes, a random walker will move faster in sparse regions and slower in dense ones, reducing over-partitioning.
To implement Variable Markov Time scaling, we preprocess the network and modify the random walker’s dynamics. We begin by assigning the random walker a budget , where is the maximum node degree in the network. This budget represents the walker’s capacity to explore the network. To reconstruct the network locally, we consider each node individually. The recursive nature of this method allows the random walker to explore multiple paths starting from node . For example, consider the unweighted example network from Fig. 2 with node 1 as the starting point for the random walker (Fig. 7). The highest node degree is 3, giving the walker a budget of bits. First, the walker evaluates the cost of taking a step, which for unweighted links is based on the number of outgoing links from node , requiring bits. When dealing with weighted links, the cost is calculated using Shannon entropy as . In this example, the walker starts at node 1 and takes a step to node 3. The cost of this step is thus bit, reducing the remaining budget accordingly. A new link between node 1 and node 3 is added. At each step, the random walker decides with an absorption probability whether to stop or continue. If the walker decides to continue, it checks if the remaining budget is sufficient to take another step. If so, it moves to a neighbouring node, ; in our example, node 4. The cost of taking this step is 0 bits because the walker does not have the option to return to previously visited nodes along its current path. A link between node 1 and node 4 is added, and the process repeats until either the walker exhausts its budget or stops due to the absorption probability. Once the walker has completed one path, it resets and explores another. For example, in the next iteration, the walker takes a step from node 1 to node 2, which costs 1 bit. This process continues for all possible paths from node , generating flows. We multiply these new flows with ’s flow, , and the network’s total weight . In this way, the resulting weights of this local regularisation method, , have the same total weight as in the observed network.
4 Results
To explore the performance of link prediction methods on sparse networks, we simulated incomplete data by randomly removing different fractions of the links , creating subsets of the original networks, which we refer to as training networks. The removed links formed the validation set, representing true links the model aimed to recover. Additionally, we also sampled non-links as negative examples uniformly and at random to provide a balanced comparison between existing and non-existing links during the prediction process. For undirected networks, we considered all links also in the opposite direction and, therefore, sampled non-links. We created ten training networks for each fraction of removed links. All nodes were ensured to be retained, even those with zero degrees after removing links.
We explored different ways of regularisation, global regularisation and three local regularisation techniques: Common Neighbours, Mixed Markov Time, and Variable Markov Time. To balance the regularisation across different network sizes, we set the global regularisation strength to , where represents the number of nodes in the network. We use a value of 100 for smaller networks with fewer than 100 nodes since overly strong regularisation could cause the network to collapse into a single module.
We evaluated the link prediction performances on 35 real-world networks from various fields [18], including directed, weighted, undirected, and unweighted examples (Table AI). We evaluated the performances by the mean Area Under the Receiver Operating Characteristic Curve (AUC) for each fraction of removed links. The datasets are balanced with the same number of positive and negative links, making AUC more suitable than the Area Under the Precision-Recall Curve (AUPRC) [19]. We compared the AUC scores for the different versions of MapSim against the following state-of-the-art methods: node2vec [5], NERD [6], LINE1, LINE2, and LINE1+2 [7].
Due to the variability in how various link prediction methods perform across different networks, we used recommended hyperparameter values instead of fine-tuning them. For node2vec, we conducted random walks of length per node and employed a window size of . We used the default node2vec parameters established by the authors, with , , and . We set the in-out parameter to and the return parameter to . For LINE, we executed first-order (LINE1), second-order (LINE2), and combined first-and-second-order proximity (LINE1+2), utilising 1,000 samples per node and negative samples. For NERD, we created 800 samples and negative samples per node, with the number of neighbourhood nodes set to , as recommended by the authors for link prediction. All embeddings were configured with dimensions.
For MapSim, we used the map equation optimisation algorithm Infomap [9] to detect the optimal communities where no hyperparameters needed to be tuned. However, we ran it 100 times to avoid local minima and picked the partition with the shortest codelength. For the embedding-based approaches, we computed similarity scores by taking the sigmoid of the dot product of the nodes’ embedding vectors, as proposed by Khosla et al. [6]. For MMT, we set to based on link prediction tests for different values of . This value corresponds to the random walker taking steps on average, balancing between existing links and allowing random walks to escape isolated areas. Varying around this value had little effect on average AUC scores (Table AII). For VMT, larger values favour stronger short-range links, while smaller values strengthen long-range links. We set to balance short- and long-range links with minimal assumptions.
4.1 Three example networks
To illustrate the performance of the link prediction methods, we examine three example networks more closely: the undirected and weighted social network moviegalaxies/34 (Fig. 8(a)), the undirected and unweighted informational network wiki_science (Fig. 8(b)), and the directed and unweighted biological network ecoli_transcription/v1.0 (Fig. 8(c)). Standard and globally regularised MapSim perform similarly on the social network, with a slight advantage for standard MapSim. As a substantial portion of links is removed, the performance of standard MapSim declines — a trend common across most investigated networks. For the informational network, the two methods perform comparably up to approximately of removed links. Beyond this point, the performance of MapSim with global regularisation drops significantly because the regularised map equation determines that the available data are insufficient to infer reliable community structure, assigning all nodes to a single community. In this case, standard MapSim’s link prediction based on unreliable modules has a limited effect on its performance. In other cases, such as the biological network in Fig. 8(c), the unreliable modules impair standard MapSim’s performance, and MapSim with global regularisation produces better results. This variability shows that no single method consistently performs best across all networks [20].
To address the decline of MapSim with global regularisation as networks become too sparse, we combined global and local regularisation (Eq. 8). These methods integrate global regularisation for robust community detection with local adjustments to possibly improve prediction performance. We compared the performance on all example networks of all versions of MapSim together with the five state-of-the-art embedding methods (Fig. 9). In the social network, all MapSim versions performed similarly, with standard MapSim outperforming the others until a large fraction of links has been removed (Fig. 9(a)). MapSim consistently outperforms all embedding methods. In the informational network, the local regularisation methods demonstrate improved prediction performance even for large fractions of removed links, where MapSim with global regularisation struggles to find community structures (Fig. 9(b)). The local regularisation methods also drop in performance but at higher fractions of removed links. LINE1+2 and LINE2 exhibit strong performance initially but falter as the fraction of removed links increases. In the biological network, MMT performs comparably to MapSim with global regularisation, while VMT and Common Neighbours show lower performance but still outperform standard MapSim. The embedding methods perform on par with standard MapSim (Fig. 9(c)). Again, no single method performs best across all networks.
4.2 Average performance
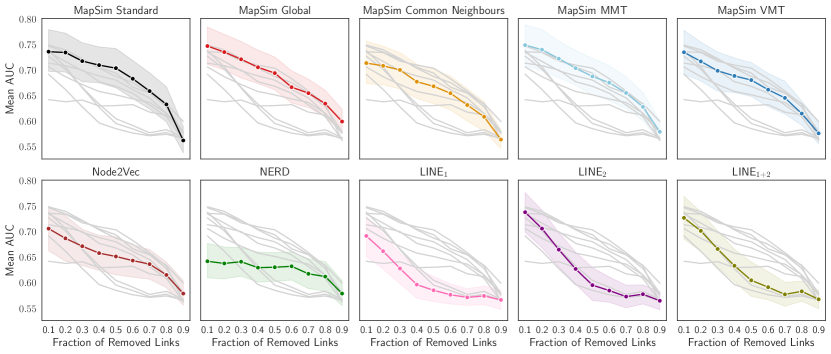
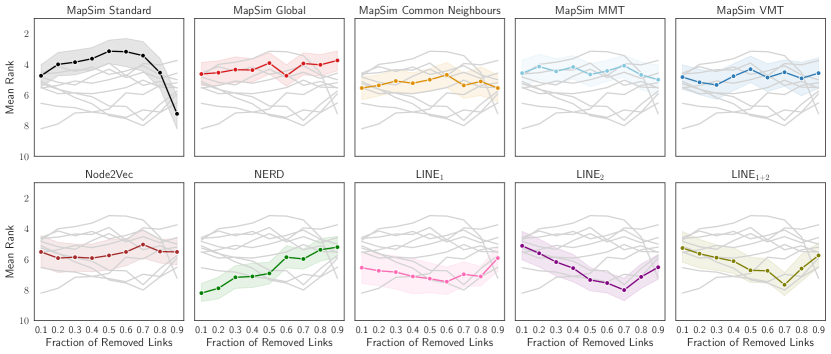
To extend the analysis beyond the three example networks, we evaluated the methods on 35 sparse networks. We computed the rank of each method for every network, with rank 1 denoting the top-performing method based on the AUC score. We then calculated the mean rank and computed a confidence interval using percentile bootstrapping [21] with replacement. We randomly sampled 1,000 bootstrap samples with replacement from the original data and calculated the upper and lower percentiles from the bootstrap distribution of ranks (Fig. 10; corresponding AUC scores in Fig. A1, and tabulated AUC scores and ranks in Table AIII and LABEL:tab:mean_rank, respectively).
We found that standard MapSim has good link prediction performance in dense networks but has a drop in performance when the fraction of removed links becomes high. In contrast, MapSim with global regularisation maintains stable performance even for very sparse networks. The methods incorporating local regularisation also show a stable performance and perform almost on par with globally regularised MapSim. MapSim consistently outperforms the embedding methods.
4.3 Community detection
MapSim achieves reliable link prediction when it accurately detects the communities within the network. In sparse networks, the standard map equation can suffer from over-partitioning, resulting in an increasing number of communities as the network becomes sparser. Conversely, when the globally regularised map equation lacks sufficient information to determine the community structure, it tends to collapse into a single module. To evaluate this effect on the investigated networks, we computed the fraction of non-trivial solutions for each fraction of removed links, where a trivial solution is defined as having only one community. From these non-trivial solutions, we calculated the mean relative change for each fraction of removed links (Fig. 11). While the standard map equation almost exclusively prefers non-trivial solutions, the regularised versions often collapse the network into one community. The regularised methods handle sparse networks better, resulting in improved link prediction performance.
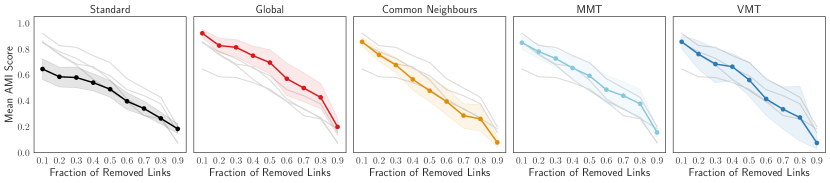
Since no ground truth communities exist, we estimated them by applying the map equation to each network before removing any links. We then compared these calculated “true” communities with the non-trivial communities detected for each fraction of removed links and calculated the mean Adjusted Mutual Information (AMI) scores [22]. These results are illustrated in Fig. 12, where the highlighted method is depicted with a bootstrapped confidence interval. These findings indicate that community detection using the map equation with global regularisation consistently outperforms the local regularisations as well as the standard map equation, regardless of the fraction of removed links. The standard map equation has the lowest performance, while the local regularisation methods perform better but still fall short of the globally regularised map equation.
5 Conclusion
We regularise the map equation in various ways to enhance link prediction with MapSim. Our findings demonstrate that global regularisation consistently outperforms standard MapSim and other state-of-the-art embedding methods in highly sparse networks. Although standard MapSim excels in denser networks, global regularisation maintains stable performance also in sparse networks, making it a good choice when the network density is unknown. Global regularisation remains reliable by preventing over-partitioning in sparse networks.
While global regularisation offers the most consistent overall performance, local regularisation methods, such as Common Neighbours, Mixed Markov Time, and Variable Markov Time, perform best in certain networks.
In summary, while standard MapSim is effective in dense networks, the variability in real-world networks calls for MapSim with global regularisation. This approach ensures reliable community detection, high interpretability, and robust link prediction across diverse networks, making it a valuable tool for improving link prediction accuracy in a wide array of applications.
6 Declarations
6.1 Availability of data and materials
The networks were retrieved from https://networks.skewed.de. The source code for MapSim is freely available online at https://github.com/mapequation/map-equation-similarity. The source code for NERD can be found at https://git.l3s.uni-hannover.de/khosla/nerd. The source code for LINE is available at https://github.com/tangjianpku/LINE.
6.2 Competing interests
M.L. is employed by Siftlab AB, which owns Infomap’s commercial rights, and M.R. is a co-founder and a board member of Siftlab AB. The other authors declare no competing interests.
6.3 Funding
M.L. was supported by the Wallenberg AI, Autonomous Systems and Software Program (WASP, http://wasp-sweden.org), funded by the Knut and Alice Wallenberg Foundation. M.R. was supported by the Swedish Research Council under grant 2023-03705. C.B. acknowledges funding from the Swiss National Science Foundation, grant no. 176938.
6.4 Authors’ contributions
M.L. and C.B. performed the experiments. All authors wrote, edited, and accepted the manuscript in its final form.
6.5 Acknowledgements
We thank Daniel Edler for helpful discussions and help with the implementation of Variable Markov Time. The computations were enabled by resources provided by the Swedish National Infrastructure for Computing at the High Performance Computer Center North (HPC2N) in Umeå, Sweden, partially funded by the Swedish Research Council through grant agreement no. 2018-05973, and by the National Academic Infrastructure for Supercomputing in Sweden (NAISS), partially funded by the Swedish Research Council through grant agreement no. 2022-06725.
References
- [1] Albert-László Barabási, Natali Gulbahce, and Joseph Loscalzo. Network medicine: a network-based approach to human disease. Nature reviews genetics, 12(1):56–68, 2011.
- [2] Han Hee Song, Tae Won Cho, Vacha Dave, Yin Zhang, and Lili Qiu. Scalable proximity estimation and link prediction in online social networks. In Proceedings of the 9th ACM SIGCOMM conference on Internet measurement, pages 322–335, 2009.
- [3] Yehuda Koren, Robert Bell, and Chris Volinsky. Matrix factorization techniques for recommender systems. Computer, 42(8):30–37, 2009.
- [4] Bryan Perozzi, Rami Al-Rfou, and Steven Skiena. Deepwalk: Online learning of social representations. In Proceedings of the 20th ACM SIGKDD international conference on Knowledge discovery and data mining, pages 701–710, 2014.
- [5] Aditya Grover and Jure Leskovec. node2vec: Scalable feature learning for networks. In Proceedings of the 22nd ACM SIGKDD international conference on Knowledge discovery and data mining, pages 855–864, 2016.
- [6] Megha Khosla, Jurek Leonhardt, Wolfgang Nejdl, and Avishek Anand. Node representation learning for directed graphs. In Machine Learning and Knowledge Discovery in Databases - European Conference, ECML PKDD 2019, Proceedings, volume 11906, pages 395–411, 2020.
- [7] Jian Tang, Meng Qu, Mingzhe Wang, Ming Zhang, Jun Yan, and Qiaozhu Mei. Line: Large-scale information network embedding. In Proceedings of the 24th international conference on world wide web, pages 1067–1077, 2015.
- [8] Christopher Blöcker, Jelena Smiljanić, Ingo Scholtes, and Martin Rosvall. Similarity-based link prediction from modular compression of network flows. PMLR 198:52:1–52:18, 2022.
- [9] Daniel Edler, Anton Holmgren, and Martin Rosvall. The MapEquation software package. https://mapequation.org, 2024.
- [10] Jelena Smiljanić, Christopher Blöcker, Daniel Edler, and Martin Rosvall. Mapping flows on weighted and directed networks with incomplete observations. J. Complex Netw., 9(6), 12 2021.
- [11] Daniel Edler, Jelena Smiljanić, Anton Holmgren, Alexandre Antonelli, and Martin Rosvall. Variable markov dynamics as a multi-focal lens to map multi-scale complex networks. arXiv preprint arXiv:2211.04287, 2022.
- [12] Martin Rosvall and Carl T Bergstrom. Maps of random walks on complex networks reveal community structure. PNAS, 105(4):1118–1123, 2008.
- [13] David A Huffman. A method for the construction of minimum-redundancy codes. Proceedings of the IRE, 40(9):1098–1101, 1952.
- [14] Claude Elwood Shannon. A mathematical theory of communication. The Bell system technical journal, 27(3):379–423, 1948.
- [15] Martin Rosvall and Carl T. Bergstrom. Multilevel compression of random walks on networks reveals hierarchical organization in large integrated systems. PLOS ONE, 6(4):1–10, 04 2011.
- [16] John Palowitch, Shankar Bhamidi, and Andrew B Nobel. Significance-based community detection in weighted networks. Journal of Machine Learning Research, 18(188):1–48, 2018.
- [17] Linyuan Lü and Tao Zhou. Link prediction in complex networks: A survey. Phys. A: Stat, 390(6):1150–1170, 2011.
- [18] Tiago P. Peixoto. The Netzschleuder network catalogue and repository. https://networks.skewed.de/, 2020.
- [19] Takaya Saito and Marc Rehmsmeier. The precision-recall plot is more informative than the roc plot when evaluating binary classifiers on imbalanced datasets. PloS one, 10(3):e0118432, 2015.
- [20] Leto Peel, Daniel B Larremore, and Aaron Clauset. The ground truth about metadata and community detection in networks. Science advances, 3(5):e1602548, 2017.
- [21] Bradley Efron and Robert J Tibshirani. An introduction to the bootstrap. Chapman and Hall/CRC, 1994.
- [22] Nguyen Xuan Vinh, Julien Epps, and James Bailey. Information theoretic measures for clusterings comparison: is a correction for chance necessary? In Proceedings of the 26th annual international conference on machine learning, pages 1073–1080, 2009.
- [23] M. E. J. Newman. Finding community structure in networks using the eigenvectors of matrices. Phys. Rev. E, 74:036104, Sep 2006.
- [24] Dale F. Lott. Dominance relations and breeding rate in mature male american bison. Zeitschrift für Tierpsychologie, 49(4):418–432, 1979.
- [25] Rion Brattig Correia, Luciana P de Araújo Kohler, Mauro M Mattos, and Luis M Rocha. City-wide electronic health records reveal gender and age biases in administration of known drug–drug interactions. NPJ digital medicine, 2(1):74, 2019.
- [26] Martin W. Schein and Milton H. Fohrman. Social dominance relationships in a herd of dairy cattle. The British Journal of Animal Behaviour, 3(2):45–55, 1955.
- [27] Jordi Duch and Alex Arenas. Community detection in complex networks using extremal optimization. Phys. Rev. E, 72:027104, Aug 2005.
- [28] Sean R Collins, Patrick Kemmeren, Xue-Chu Zhao, Jack F Greenblatt, Forrest Spencer, Frank CP Holstege, Jonathan S Weissman, and Nevan J Krogan. Toward a comprehensive atlas of the physical interactome of saccharomyces cerevisiae. Molecular & Cellular Proteomics, 6(3):439–450, 2007.
- [29] David Lusseau, Karsten Schneider, Oliver J Boisseau, Patti Haase, Elisabeth Slooten, and Steve M Dawson. The bottlenose dolphin community of doubtful sound features a large proportion of long-lasting associations: can geographic isolation explain this unique trait? Behavioral Ecology and Sociobiology, 54:396–405, 2003.
- [30] Hong-Wen Tang, Kerstin Spirohn, Yanhui Hu, Tong Hao, István A Kovács, Yue Gao, Richard Binari, Donghui Yang-Zhou, Kenneth H Wan, Joel S Bader, et al. Next-generation large-scale binary protein interaction network for drosophila melanogaster. Nature communications, 14(1):1–16, 2023.
- [31] Tom A.B. Snijders, Gerhard G. van de Bunt, and Christian E.G. Steglich. Introduction to stochastic actor-based models for network dynamics. Social Networks, 32(1):44–60, 2010. Dynamics of Social Networks.
- [32] Shai S Shen-Orr, Ron Milo, Shmoolik Mangan, and Uri Alon. Network motifs in the transcriptional regulation network of escherichia coli. Nature genetics, 31(1):64–68, 2002.
- [33] Lovro Šubelj and Marko Bajec. Robust network community detection using balanced propagation. The European Physical Journal B, 81:353–362, 2011.
- [34] United States Federal Aviation Administration. Air traffic control system command center. http://www.fly.faa.gov/, 2010.
- [35] Robert Ulanowicz, Cristina Bondavalli, and Mark Egnotovich. Network analysis of trophic dynamics in south florida ecosystem, fy 97: The florida bay ecosystem. annual report to the u. s. geo. service biological resources division. https://www.cbl.umces.edu/~atlss/FBay701.html, 1998.
- [36] Michelle Girvan and Mark EJ Newman. Community structure in social and biological networks. Proceedings of the national academy of sciences, 99(12):7821–7826, 2002.
- [37] Samin Aref and Mark C Wilson. Balance and frustration in signed networks. Journal of Complex Networks, 7(2):163–189, 2019.
- [38] Andrew Beveridge and Jie Shan. Network of thrones. Math Horizons, 23(4):18–22, 2016.
- [39] James Samuel Coleman et al. Introduction to mathematical sociology. Introduction to mathematical sociology., 1964.
- [40] William Gray Roncal, Zachary H Koterba, Disa Mhembere, Dean M Kleissas, Joshua T Vogelstein, Randal Burns, Anita R Bowles, Dimitrios K Donavos, Sephira Ryman, Rex E Jung, et al. Migraine: Mri graph reliability analysis and inference for connectomics. In 2013 IEEE Global Conference on Signal and Information Processing, pages 313–316. IEEE, 2013.
- [41] Rob M Ewing, Peter Chu, Fred Elisma, Hongyan Li, Paul Taylor, Shane Climie, Linda McBroom-Cerajewski, Mark D Robinson, Liam O’Connor, Michael Li, et al. Large-scale mapping of human protein–protein interactions by mass spectrometry. Molecular systems biology, 3(1):89, 2007.
- [42] Thijs Beuming, Lucy Skrabanek, Masha Y Niv, Piali Mukherjee, and Harel Weinstein. Pdzbase: a protein–protein interaction database for pdz-domains. Bioinformatics, 21(6):827–828, 2005.
- [43] Jean-François Rual, Kavitha Venkatesan, Tong Hao, Tomoko Hirozane-Kishikawa, Amélie Dricot, Ning Li, Gabriel F Berriz, Francis D Gibbons, Matija Dreze, Nono Ayivi-Guedehoussou, et al. Towards a proteome-scale map of the human protein–protein interaction network. Nature, 437(7062):1173–1178, 2005.
- [44] Stéphane Coulomb, Michel Bauer, Denis Bernard, and Marie-Claude Marsolier-Kergoat. Gene essentiality and the topology of protein interaction networks. Proceedings of the Royal Society B: Biological Sciences, 272(1573):1721–1725, 2005.
- [45] Luke M Gerdes, Kristine Ringler, and Barbara Autin. Assessing the abu sayyaf group’s strategic and learning capacities. Studies in Conflict & Terrorism, 37(3):267–293, 2014.
- [46] Malcolm P Young. The organization of neural systems in the primate cerebral cortex. Proceedings of the Royal Society of London. Series B: Biological Sciences, 252(1333):13–18, 1993.
- [47] Daniel B Larremore, Aaron Clauset, and Caroline O Buckee. A network approach to analyzing highly recombinant malaria parasite genes. PLoS computational biology, 9(10):e1003268, 2013.
- [48] Ulf Aslak. Ulf aslak (@ulfaslak) tweet. https://twitter.com/ulfaslak/status/1048126665338101760, 2018.
- [49] Jermain Kaminski, Michael Schober, Raymond Albaladejo, Oleksandre Zastupailo, and Cesar Hidalgo. Moviegalaxies-social networks in movies. Consulté sur http://moviegalaxies. com, 2012.
- [50] Samin Aref, David Friggens, and Shaun Hendy. Analysing scientific collaborations of new zealand institutions using scopus bibliometric data. In Proceedings of the Australasian Computer Science Week Multiconference, pages 1–10, 2018.
- [51] Brian Hayes. Connecting the dots. American Scientist, 94(5):400–404, 2006.
- [52] Goylette F Chami, Sebastian E Ahnert, Narcis B Kabatereine, and Edridah M Tukahebwa. Social network fragmentation and community health. Proceedings of the National Academy of Sciences, 114(36):E7425–E7431, 2017.
- [53] Roger Guimera, Leon Danon, Albert Diaz-Guilera, Francesc Giralt, and Alex Arenas. Self-similar community structure in a network of human interactions. Physical review E, 68(6):065103, 2003.
- [54] Paolo Crucitti, Vito Latora, and Sergio Porta. Centrality measures in spatial networks of urban streets. Physical Review E, 73(3):036125, 2006.
- [55] Alberto Calderone. A wikipedia based map of science. https://doi.org/10.6084/m9.figshare.11638932.v5, 2020.
- [56] Linton C Freeman, Sue C Freeman, and Alaina G Michaelson. On human social intelligence. Journal of Social and Biological Structures, 11(4):415–425, 1988.
- [57] Siva R Sundaresan, Ilya R Fischhoff, Jonathan Dushoff, and Daniel I Rubenstein. Network metrics reveal differences in social organization between two fission–fusion species, grevy’s zebra and onager. Oecologia, 151:140–149, 2007.
Appendix
| Network | Ref | Nodes | Edges | Weighted | Directed |
|---|---|---|---|---|---|
| adjnoun | [23] | 112 | 425 | No | No |
| bison | [24] | 26 | 314 | Yes | Yes |
| blumenau_drug | [25] | 75 | 181 | Yes | No |
| cattle | [26] | 28 | 217 | Yes | Yes |
| celegans_metabolic | [27] | 453 | 4,596 | No | No |
| collins_yeast | [28] | 1,622 | 9,070 | No | No |
| dolphins | [29] | 62 | 159 | No | No |
| drosophila_flybi | [30] | 2,939 | 8,723 | No | No |
| dutch_school_klas12b-net-1 | [31] | 26 | 91 | No | Yes |
| ecoli_transcription_v1.0 | [32] | 424 | 577 | No | Yes |
| euroroad | [33] | 1,174 | 1,417 | No | No |
| faa_routes | [34] | 1,226 | 2,615 | No | Yes |
| foodweb_baywet | [35] | 128 | 2,106 | Yes | Yes |
| football | [36] | 115 | 613 | No | No |
| fullerene_structures_C1500 | [37] | 1,500 | 2,250 | No | No |
| game_thrones | [38] | 107 | 352 | Yes | No |
| highschool | [39] | 70 | 366 | Yes | Yes |
| human_brains_BNU1_0025864_1_DTI_AAL | [40] | 116 | 1,563 | No | No |
| interactome_figeys | [41] | 2,239 | 6,462 | No | Yes |
| interactome_pdz | [42] | 212 | 244 | No | No |
| interactome_vidal | [43] | 3,133 | 6,726 | No | No |
| interactome_yeast | [44] | 1,870 | 2,277 | No | No |
| kidnappings | [45] | 351 | 402 | No | Yes |
| macaque_neural | [46] | 47 | 505 | No | No |
| malaria_genes_HVR_1 | [47] | 307 | 2,812 | No | No |
| marvel_partnerships | [48] | 350 | 346 | No | No |
| moviegalaxies_34 | [49] | 95 | 378 | Yes | No |
| new_zealand_collab | [50] | 1,511 | 4,273 | Yes | No |
| train_terrorists | [51] | 64 | 243 | Yes | No |
| ugandan_village_friendship-16 | [52] | 372 | 1,475 | No | No |
| uni_email | [53] | 1,133 | 10,903 | No | Yes |
| urban_streets_venice | [54] | 1,840 | 2,407 | No | No |
| wiki_science | [55] | 687 | 6,523 | No | No |
| windsurfers | [56] | 43 | 336 | Yes | No |
| zebras | [57] | 27 | 111 | No | No |
0.1 0.74 0.74 0.74 0.74 0.74 0.75 0.75 0.75 0.74 (0.70, 0.78) (0.70, 0.78) (0.70, 0.78) (0.70, 0.78) (0.70, 0.78) (0.71, 0.78) (0.71, 0.79) (0.71, 0.78) (0.70, 0.78) 0.2 0.74 0.74 0.74 0.74 0.74 0.74 0.74 0.74 0.74 (0.70, 0.78) (0.70, 0.78) (0.69, 0.78) (0.70, 0.78) (0.69, 0.78) (0.70, 0.78) (0.70, 0.78) (0.70, 0.78) (0.70, 0.78) 0.3 0.72 0.72 0.72 0.72 0.72 0.72 0.72 0.72 0.72 (0.68, 0.76) (0.68, 0.76) (0.68, 0.76) (0.68, 0.76) (0.68, 0.76) (0.68, 0.76) (0.68, 0.76) (0.68, 0.76) (0.68, 0.76) 0.4 0.72 0.72 0.71 0.71 0.71 0.71 0.71 0.71 0.71 (0.68, 0.76) (0.68, 0.76) (0.68, 0.76) (0.68, 0.75) (0.67, 0.76) (0.67, 0.75) (0.68, 0.76) (0.68, 0.76) (0.68, 0.76) 0.5 0.70 0.70 0.70 0.70 0.70 0.70 0.70 0.70 0.70 (0.67, 0.74) (0.67, 0.74) (0.67, 0.74) (0.67, 0.74) (0.66, 0.74) (0.66, 0.74) (0.66, 0.74) (0.66, 0.74) (0.66, 0.74) 0.6 0.68 0.68 0.68 0.68 0.68 0.68 0.68 0.68 0.68 (0.65, 0.72) (0.65, 0.72) (0.64, 0.72) (0.65, 0.72) (0.65, 0.72) (0.64, 0.72) (0.64, 0.72) (0.64, 0.72) (0.64, 0.72) 0.7 0.66 0.66 0.66 0.66 0.67 0.67 0.67 0.67 0.67 (0.63, 0.70) (0.63, 0.70) (0.63, 0.70) (0.63, 0.70) (0.63, 0.70) (0.64, 0.70) (0.63, 0.70) (0.64, 0.70) (0.64, 0.70) 0.8 0.63 0.63 0.63 0.63 0.63 0.63 0.63 0.63 0.63 (0.60, 0.66) (0.60, 0.66) (0.60, 0.66) (0.60, 0.66) (0.60, 0.66) (0.60, 0.66) (0.60, 0.66) (0.60, 0.66) (0.60, 0.66) 0.9 0.59 0.59 0.58 0.58 0.58 0.58 0.58 0.58 0.58 (0.56, 0.61) (0.56, 0.61) (0.55, 0.60) (0.56, 0.60) (0.56, 0.60) (0.56, 0.60) (0.56, 0.60) (0.56, 0.60) (0.56, 0.60)
MapSim MapSim Common MapSim MapSim node2Vec NERD LINE1 LINE2 LINE1+2 Standard Global Neighbours MMT VMT 0.1 0.74 0.75 0.71 0.75 0.73 0.71 0.64 0.69 0.74 0.73 (0.70, 0.78) (0.71, 0.78) (0.67, 0.75) (0.71, 0.78) (0.69, 0.77) (0.66, 0.75) (0.61, 0.68) (0.66, 0.73) (0.70, 0.78) (0.68, 0.77) 0.2 0.73 0.74 0.71 0.74 0.72 0.69 0.64 0.66 0.71 0.70 (0.70, 0.77) (0.70, 0.77) (0.67, 0.75) (0.70, 0.78) (0.68, 0.76) (0.64, 0.73) (0.61, 0.67) (0.63, 0.70) (0.67, 0.74) (0.67, 0.74) 0.3 0.72 0.72 0.70 0.72 0.70 0.67 0.64 0.63 0.66 0.67 (0.68, 0.76) (0.69, 0.76) (0.67, 0.74) (0.69, 0.76) (0.66, 0.74) (0.63, 0.71) (0.61, 0.67) (0.60, 0.66) (0.63, 0.70) (0.63, 0.70) 0.4 0.71 0.71 0.68 0.70 0.69 0.66 0.63 0.60 0.63 0.63 (0.67, 0.75) (0.67, 0.74) (0.64, 0.71) (0.66, 0.74) (0.65, 0.73) (0.62, 0.70) (0.60, 0.66) (0.57, 0.62) (0.60, 0.66) (0.60, 0.67) 0.5 0.70 0.69 0.67 0.69 0.68 0.65 0.63 0.59 0.60 0.60 (0.66, 0.74) (0.66, 0.73) (0.63, 0.70) (0.65, 0.73) (0.65, 0.71) (0.61, 0.69) (0.60, 0.66) (0.56, 0.61) (0.57, 0.63) (0.57, 0.64) 0.6 0.68 0.67 0.65 0.68 0.66 0.64 0.63 0.58 0.58 0.59 (0.65, 0.72) (0.63, 0.70) (0.62, 0.69) (0.64, 0.71) (0.63, 0.70) (0.61, 0.68) (0.61, 0.66) (0.56, 0.60) (0.56, 0.61) (0.56, 0.62) 0.7 0.66 0.65 0.63 0.66 0.65 0.64 0.62 0.57 0.57 0.58 (0.62, 0.70) (0.63, 0.68) (0.60, 0.67) (0.62, 0.69) (0.61, 0.68) (0.61, 0.67) (0.59, 0.65) (0.56, 0.59) (0.55, 0.60) (0.55, 0.60) 0.8 0.63 0.63 0.61 0.63 0.61 0.62 0.61 0.57 0.58 0.58 (0.60, 0.67) (0.61, 0.66) (0.58, 0.64) (0.60, 0.65) (0.59, 0.64) (0.59, 0.64) (0.58, 0.64) (0.56, 0.59) (0.56, 0.60) (0.56, 0.60) 0.9 0.56 0.60 0.56 0.58 0.58 0.58 0.58 0.57 0.56 0.57 (0.54, 0.59) (0.58, 0.62) (0.55, 0.58) (0.56, 0.60) (0.56, 0.60) (0.56, 0.60) (0.56, 0.60) (0.55, 0.58) (0.55, 0.58) (0.55, 0.58)
MapSim MapSim Common MapSim MapSim node2Vec NERD LINE1 LINE2 LINE1+2 Standard Global Neighbours MMT VMT 0.1 4.7 4.6 5.5 4.6 4.8 5.5 8.2 6.5 5.1 5.3 (4.0, 5.4) (4.0, 5.4) (4.8, 6.3) (3.7, 5.4) (4, 5.6) (4.5, 6.6) (7.6, 8.8) (5.4, 7.6) (4.2, 6.1) (4.3, 6.3) 0.2 4.0 4.5 5.4 4.1 5.2 6.0 7.9 6.7 5.6 5.6 (3.3, 4.8) (3.7, 5.3) (4.7, 6.1) (3.7, 5.0) (4.3, 6.1) (5.0, 6.9) (7.2, 8.5) (5.7, 7.8) (4.5, 6.5) (4.6, 6.6) 0.3 3.9 4.3 5.1 4.5 5.3 5.9 7.2 6.8 6.2 5.9 (3.1, 4.7) (3.5, 5.2) (4.4, 5.8) (3.6, 5.3) (4.4, 6.3) (5.0, 6.7) (6.4, 7.9) (5.8, 7.9) (5.3, 7.1) (5.1, 6.7) 0.4 3.6 4.4 5.2 4.2 4.8 5.9 7.1 7.1 6.6 6.1 (2.9, 4.4) (3.7, 5.2) (4.5, 5.9) (3.5, 5.0) (3.9, 5.7) (5.0, 6.8) (6.3, 7.9) (5.9, 8.2) (5.7, 7.4) (5.2, 6.9) 0.5 3.1 3.9 5.0 4.7 4.3 5.7 6.9 7.3 7.3 6.7 (2.4, 4.0) (3.2, 4.7) (4.3, 5.7) (3.9, 5.4) (3.5, 5.2) (4.8, 6.6) (6.2, 7.6) (6.3, 8.2) (6.5, 8.1) (5.9, 7.5) 0.6 3.2 4.7 4.7 4.4 4.9 5.5 5.9 7.5 7.5 6.7 (2.3, 4.1) (3.9, 5.5) (3.9, 5.5) (3.7, 5.2) (3.9, 5.8) (4.6, 6.4) (5.0, 6.6) (6.6, 8.3) (6.9, 8.2) (6.0, 7.6) 0.7 3.4 3.9 5.4 4.1 4.5 5.0 6.0 7.0 8.0 7.7 (2.7, 4.4) (3.3, 4.7) (4.6, 6.2) (3.3, 4.8) (3.7, 5.4) (4.2, 5.8) (5.3, 6.7) (6.1, 7.8) (7.3, 8.7) (6.9, 8.4) 0.8 4.5 4.0 5.1 4.7 4.9 5.5 5.4 7.1 7.1 6.6 (3.6, 5.7) (3.3, 4.8) (4.1, 6.1) (3.8, 5.7) (3.9, 6.0) (4.7, 6.2) (4.7, 6.1) (6.4, 7.8) (6.4, 7.9) (5.7, 7.4) 0.9 7.2 3.7 5.5 5.0 4.6 5.5 5.2 5.9 6.5 5.7 (6.2, 8.3) (3.1, 4.4) (4.6, 6.5) (4.1, 5.8) (3.6, 5.7) (4.7, 6.4) (4.5, 5.9) (5.2, 6.7) (5.7, 7.3) (4.9, 6.5)