Oxygen vacancies in BaTiO3 based ferroelectrics: electron doping, history dependence of and domain wall pinning
Abstract
We measured the complex Young’s modulus of BaTiO3-δ, (BT) BaxSr1-xTiO3-δ (BST) and (Ba0.85Ca0.15)(Zr0.1Ti0.9)O3-δ (BCTZ) during heating and cooling runs at various O deficiencies and aging times. The elastic energy loss has peaks due to the jumps of isolated O vacancies (V) and reorientations of pairs of V in the paraelectric phase, from which the respective rates and activation energies are measured. These rates control the mechanisms of domain clamping, pinning, fatigue, and anything related to the V mobility. In the ferroelectric (FE) phase, the drop of the losses due to the domain wall motion upon introduction of V monitors the degree of pinning. In addition, large shifts of are observed at the same value of upon varying the permanence time in the FE state, up to 21 K in BST, while no aging effect is found in BCTZ.
The phenomenology is explained by considering that is depressed mainly by the mobile electrons doped by V. Each isolated V dopes two electrons as itinerant Ti3+ ions, but, when it forms a stable linear V–Ti2+–V pair, the two electrons of the Ti2+ are subtracted from the mobile ones, halving doping. The rise of during the initial aging is then explained in terms of the progressive aggregation of the V. Prolonging aging for years leads to a decrease of , explained assuming that the most stable position of a V is at domain walls, whose geometry is incompatible with the pairs. Then, after enough time the initially aggregated V within the domains dissociate to decorate the walls, increasing doping and lowering
The absence of such effects in BCTZ is due to larger activation energy for pair reorientation and pair binding energy. Then, at room temperature practically all V are paired and static over a time scale of hundreds of years, explaining the superior resistance of BCTZ to fatigue.
pacs:
77.80.bg, 62.40.+i, 77.84.Cg, 61/72.JI Introduction
The contribution of O vacancies (V) to fatigue and in general to the degradation of the properties of perovskite ferroelectrics has been studying since many decades Genenko et al. (2015) and is far from being fully understood. Recently it has even been proposed that many observations generally ascribed to mobile V on the basis of a rather loose estimation of V hopping barrier of eV, are rather due to electronic mechanisms, Tyunina (2020) especially after observing that the activation energy for the mean time to failure of multilayer ceramic capacitors is eV, close to a half the energy band gap of BaTiO3 Chun et al. (2024). Yet, it is undeniable that V are present, especially in devices, such as multi layer ceramic capacitors (MLCCs), having electrodes made of oxidizable non noble metals. Such electrodes require that the ceramics are sintered in reducing atmosphere, with a subsequent mild oxygenation, which does not fully eliminate the V Opitz et al. (2003); Zhang et al. (2024).
On the other hand, V are not only detrimental to the materials properties, since the traditional method for hardening the piezoelectrics, namely reducing their losses, through domain wall (DW) pinning is to introduce V by acceptor doping Genenko et al. (2015). Another possible effect of introducing acceptor-V pairs is enhancing the electrostrain in piezoceramics, though the exact mechanisms involved are not yet clear Huangfu et al. (2024), but all these effect are greatly affected by rises in temperature, due the increased mobility of V Zheng et al. (2022).
It is therefore important to improve our knowledge of the behavior of V in ferroelectric materials at the atomic scale: their mobility, how they aggregate, and are trapped by dopants and DWs. This is usually done with methods that probe the long range diffusion, such as measuring the change of mass or resistivity of samples during annealing in controlled atmospheres, or the isotope tracer diffusion technique Opitz et al. (2003); Souza (2015); Chan et al. (1981). These methods, however, reveal the overall diffusion and not the different steps involved, especially because carried out at high temperatures, where the aggregation of V into pairs and chains Cordero (2007); Eom et al. (2017) becomes irrelevant.
Indeed, selectively probing the different types of jumps of V and measuring their concentration is not easy. An isolated V has an anisotropic elastic dipole but no electric dipole; therefore its hopping cannot be probed by dielectric but only by anelastic spectroscopy, unless it is associated with another charged point defect, e.g. cation vacancy, to form an electric dipole. Also NMR relaxation can selectively probe the different types of jumps of V, but it has been used only few times Hackmann and Kanert (1991); Buzlukov et al. (2011), while EPR has been used only for studying the kinetics of V trapped by acceptors Eichel (2007). As a consequence, the link between the V mobility and fatigue or degradation phenomena in ferroelectric perovskites is generally vague, without determining a detailed microscopic mechanism. Certainly the ionic contribution of V to conductivity is negligible compared to the polaronic and electronic ones Tyunina and Savinov (2020), but their hopping as reorienting elastic dipoles, as electric dipoles when paired with a charged defect, and their migration to domain walls differently affect the ferroelectric properties at room temperature over time scales from minutes to months or years, even in the absence of electric excitation.
Here we present a study of the mobility and clustering of V introduced by reducing treatments in BaTiO3 (BT), BaxSr1-xTiO3 (BST) and (Ba0.85Ca0.15)(Zr0.1Ti0.9)O3 (BCTZ), which are found to have very different hopping rates, depending on their aggregation state and material composition, and introduce history dependent effects on the Curie temperature . Novel microscopic insight is provided on how V contribute to electron doping and pinning of domain walls, finally leading to aging and fatigue. In particular, it is shown how the electron doping is strongly affected by the degree of clustering of the V.
II Experimental
Two BaTiO3 samples BT1 and BT2 were cut from a bar prepared by conventional mixed-oxide powder technique at the Department of Chemistry of the Martin Luther University Halle (Saale), Germany, as described in Cordero et al. (2019). The present sample BT1, with dimensions mm3, corresponds to bar No. 2 in that paper, while the present sample BT2 is a bar mm3. Sample BT3 was another bar mm3 of BaTiO3 prepared in the same laboratory. Sample BT4, mm3, was prepared, again by conventional mixed-oxide powder technique, at the Physics Department of UFSCar, São Carlos (Brazil), as described in Cordero et al. (2019), and corresponds to sample No. 1.1 of that paper and sample BT #1 in Cordero et al. (2021).
The BST samples were prepared in UFSCar, as described in Cordero et al. (2023). The bar with 0.03 had dimensions mm3.
The (Ba0.85Ca0.15)(Zr0.1Ti0.9)O3 was synthesized via the solid-state reaction method using BaCO3 (Aldrich, purity), CaCO3 (MERCK, purity), TiO2 (Degussa P25, purity), and ZrO2 (MEL, SC 101, purity) as starting materials. The oxide powders were mixed and ball–milled for 20 hours, then pressed and calcined at 1300 ∘C for 5 hours. The calcined powders were further ball–milled for 96 hours and sieved to 200 m. Green bars were formed by uniaxial pressing at 100 MPa, followed by cold isostatic pressing at 300 MPa. Sintering was performed in a covered ZrO2 box with samples embedded in BCTZ-50 powders, at 1500 ∘C for 4 hours, with natural cooling in the furnace. Two bars were cut to mm3 (BCTZ1) and mm3 (BCTZ2).
Oxygen vacancies were introduced by exposing the bars to a flow of 0.1CO + 0.9Ar at 1 bar and high temperature ( ∘C) for up to 2 h, followed by 1 h homogenization at 800 ∘C in the same reducing flow and cooling to room temperature (RT) in few minutes. The sample was first wrapped in a Pt foil with open ends, using slabs of Al2O3 or Y-stabilized ZrO2 to avoid the contact with Pt. The Pt envelope was placed in a quartz tube with water cooled jacket and heated by induction. Its temperature was measured with a pyrometer Land M1 600/100C-S and a hot-wire pyrometer Pirottico SAE, insensitive to changes in emissivity. The concentration of V was estimated from the mass reduction after the treatment, and might be overestimated by unwanted loss of BaO, especially at the highest temperatures. In fact, while the total mass loss of BT1 after all the treatments corresponded to 0.0118, the mass gain after reoxygenation corresponded to 0.00763, but the sample was again pale yellow with no trace of V in the anelastic spectrum. Sample BT2 was subjected to the reductions together with BT1 for control, without measuring its anelastic spectrum. Its state with corresponds to the final 0.0118 of BT1, and the fact that estimated from the total mass losses is smaller in the thicker sample is in agreement with the hypothesis of an overestimation of from unwanted losses of BaO.
The complex Young’s modulus was measured by suspending the sample with two thin thermocouple wires in vacuum and electrostatically exciting its free-free flexural resonances, as described in Cordero et al. (2009). In order to short the thermocouple wires, one of which grounded, and make the sample conductive in correspondence with the exciting/measuring electrode, silver paint was applied to the sample. The Young’s modulus is measured from the resonance frequency Nowick and Berry (1972)
| (1) |
where , , and are the sample’s length, thickness, and density, assumed as constants, since they vary much less than with temperature. The elastic energy loss, , was measured from the decay of the free oscillations, after switching off the excitation, or from the width of the resonance curves. The frequency dependence of the anelastic spectra was measured by exciting up to three flexural modes, with frequencies in the ratios , during the same run. The anelastic relaxation from the hopping of a V, and consequent reorientation of its elastic dipole, causes a Debye peak in the energy loss measured at frequency , with maximum at the temperature such that , where is close to the mean hopping time Nowick and Berry (1972).
III Results
III.1 BaTiO3-δ
Figure 1 presents the anelastic spectra of sample BT1 of BaTiO3-δ at increasing O deficiencies . The curves are perfectly similar to those measured in BT4 and already published Cordero et al. (2021). The introduction of V has three major effects: i) shift to lower temperature, ii) introduce thermally activated anelastic relaxation peaks in the paraelectric phase, iii) substantially reduce the elastic energy loss from the relaxational motion of DWs in the tetragonal ferroelectric phase. Peak PF, only visible when is lowered enough, is due to the hopping of isolated (free) V, while peak PP to the reorientation of V pairs Cordero et al. (2021). At higher temperature, two minor peaks are found, which grow with much less than PF and PP, and are attributed to V trapped by native defects, such as Ba vacancies Cordero et al. (2021).
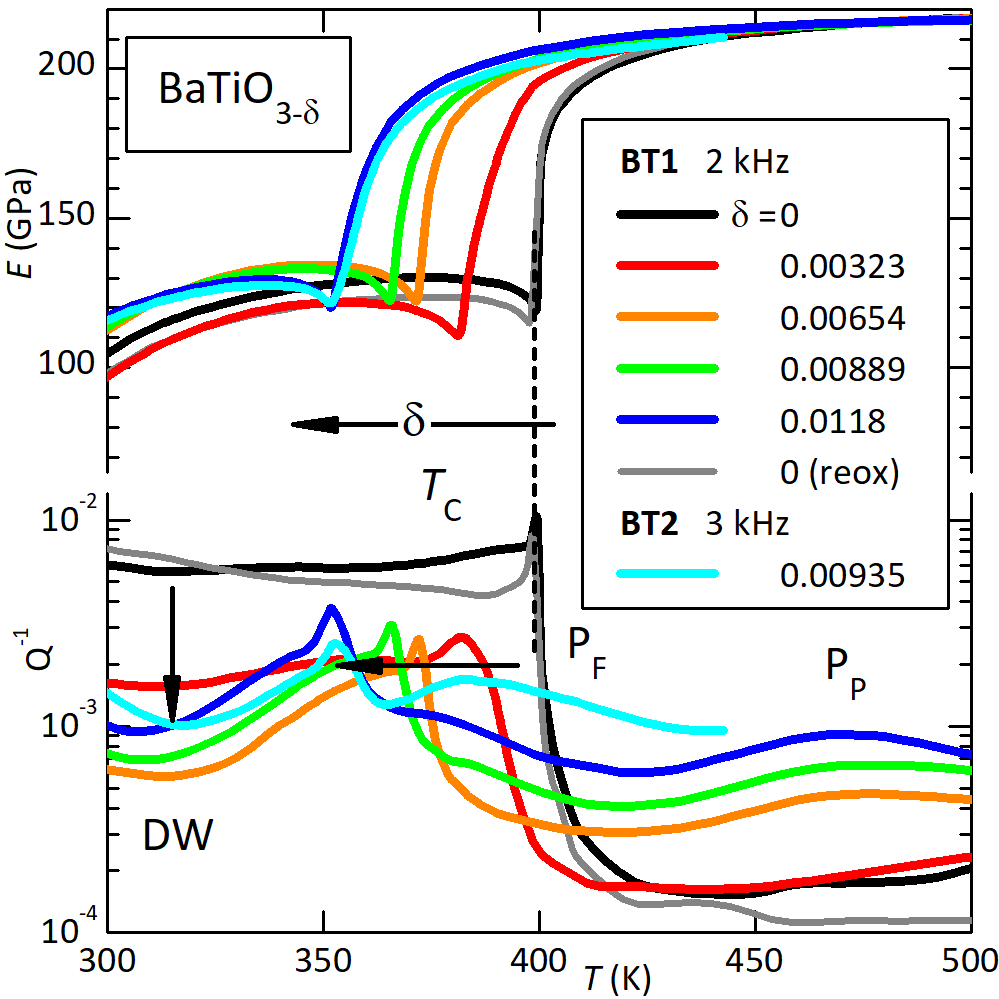
All these curves are measured during cooling within few days after the reduction treatment or after a temperature run extending at least to 500 K, therefore after few days in the FE state. The last curve of BT1 (thin gray) was obtained after reoxygenating the sample in air at 1100 ∘C for 90 min. It is very similar to the initial black curve, and has a high–temperature background even lower, indicating that no major degradation occurred during the previous reductions.
The anelastic measurements on BT2, which had been always reduced together with BT1, started 6 years after the last reduction and the curve in Fig. 1 was measured during the fourth cooling cycle. It is very close to the blue curve of BT1, supposedly in a similar state, except for a higher intensity of peak PF.
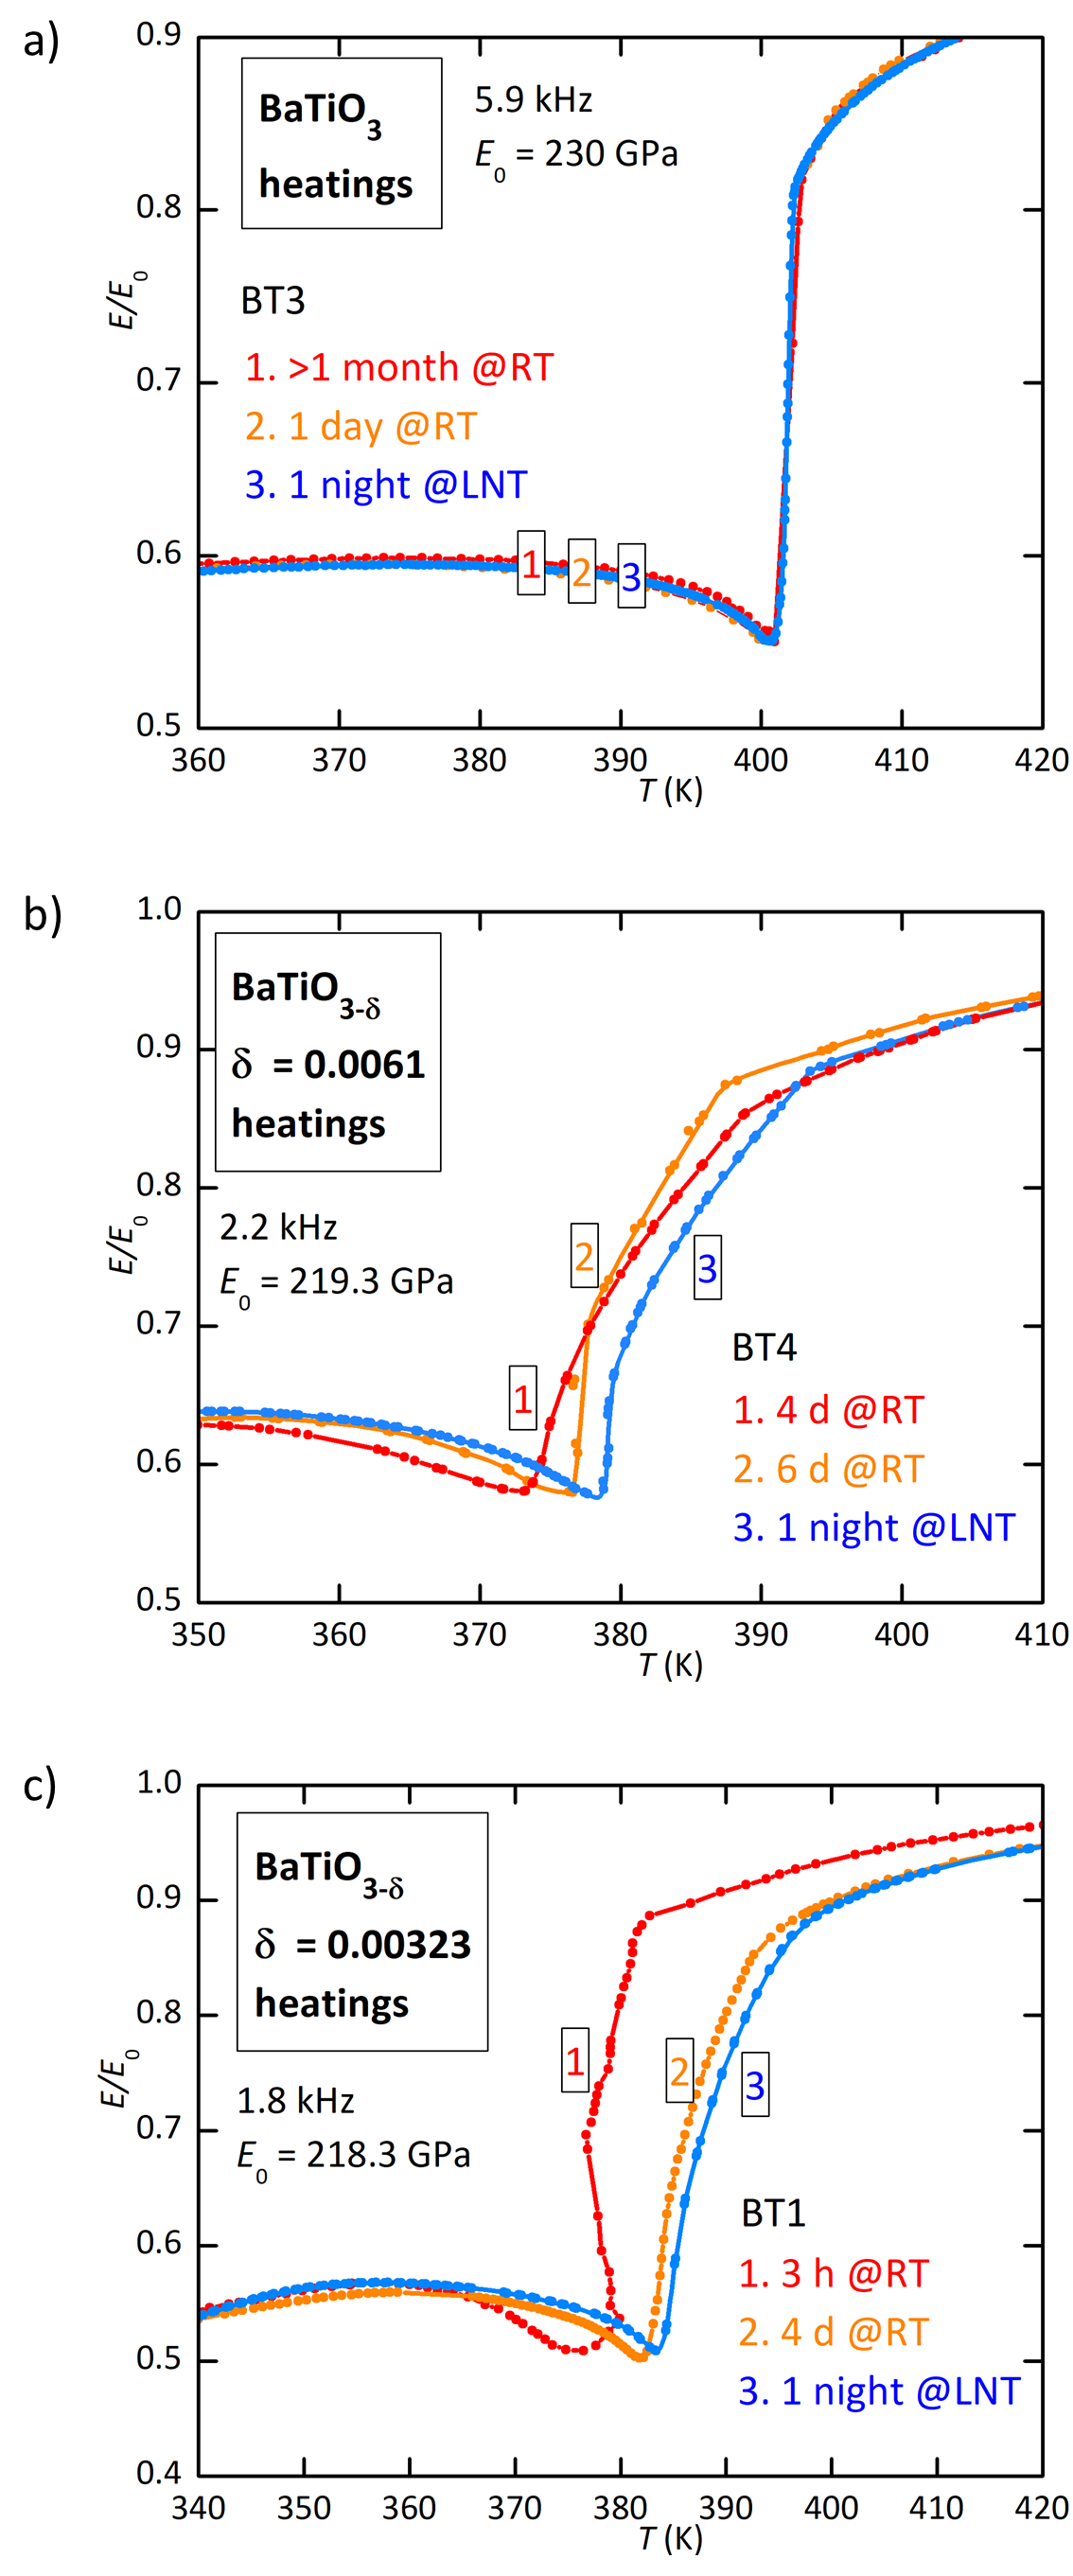
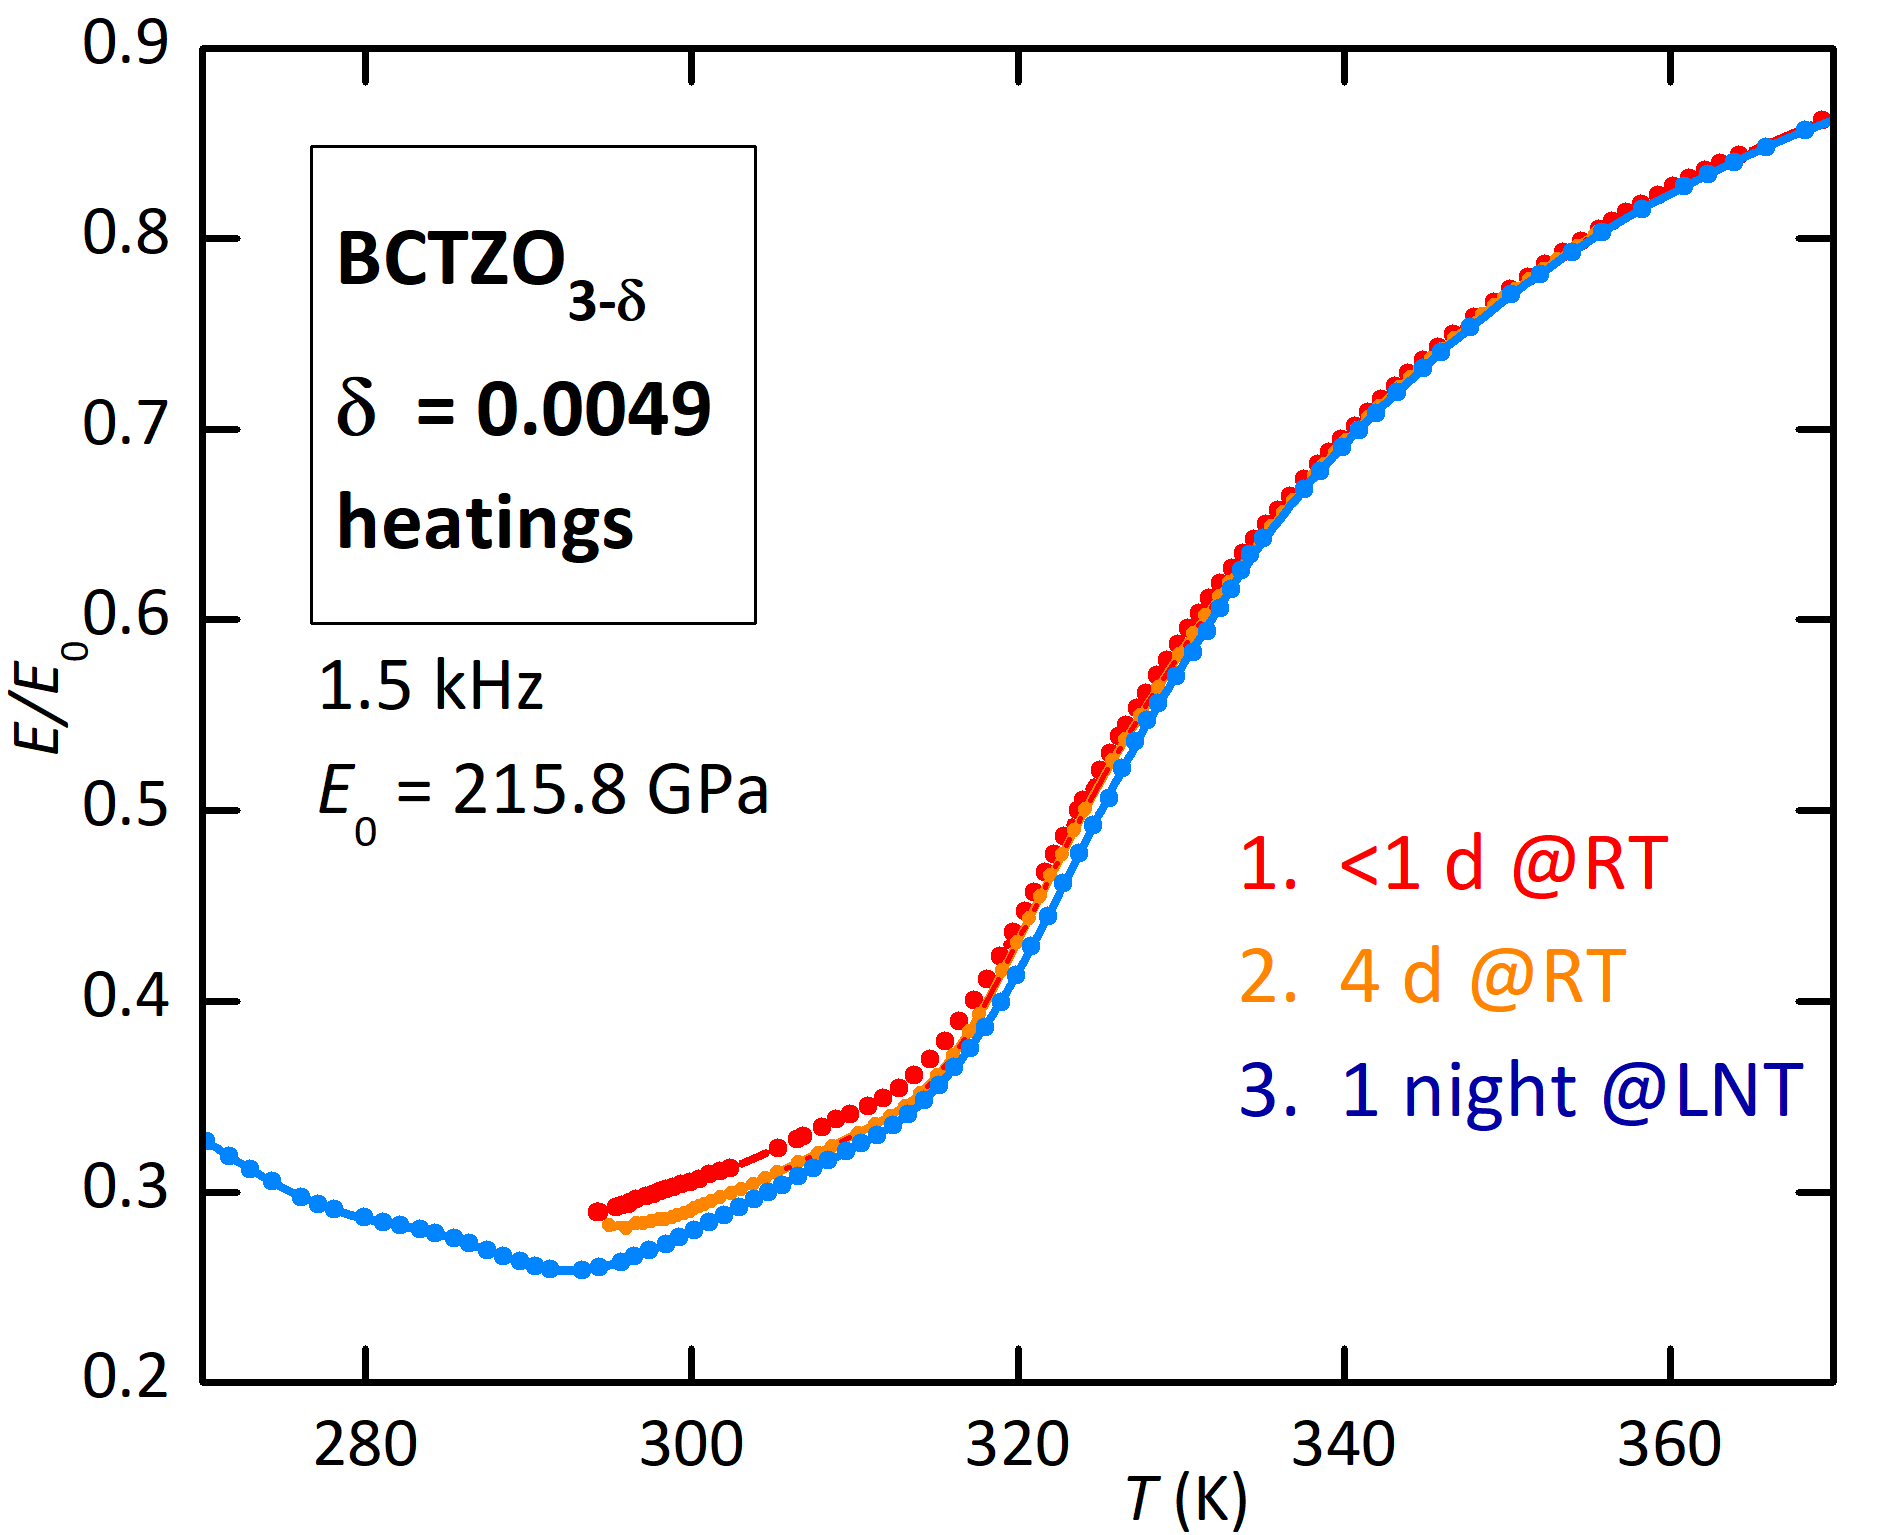
Figure 2 presents various curves of BaTiO3-δ around measured under different conditions. Apart from differences in the precursor softening above , which may also be affected by an additional transition above (see beginning of Discussion), the interest is in the fact that , at the lower edge of the curves, may vary considerably in the same sample at constant O deficiency. As expected, is stable in the absence of V (Fig. 2a), but it depends on how long the sample aged in the ferroelectric phase when measured during heating in O deficient samples, already with as low as 0.003. In Figs. 2b,c there is an increase of with increasing the aging time at RT in the range of hours and days, with the highest achieved after a night at liquid N2 temperature (LNT).
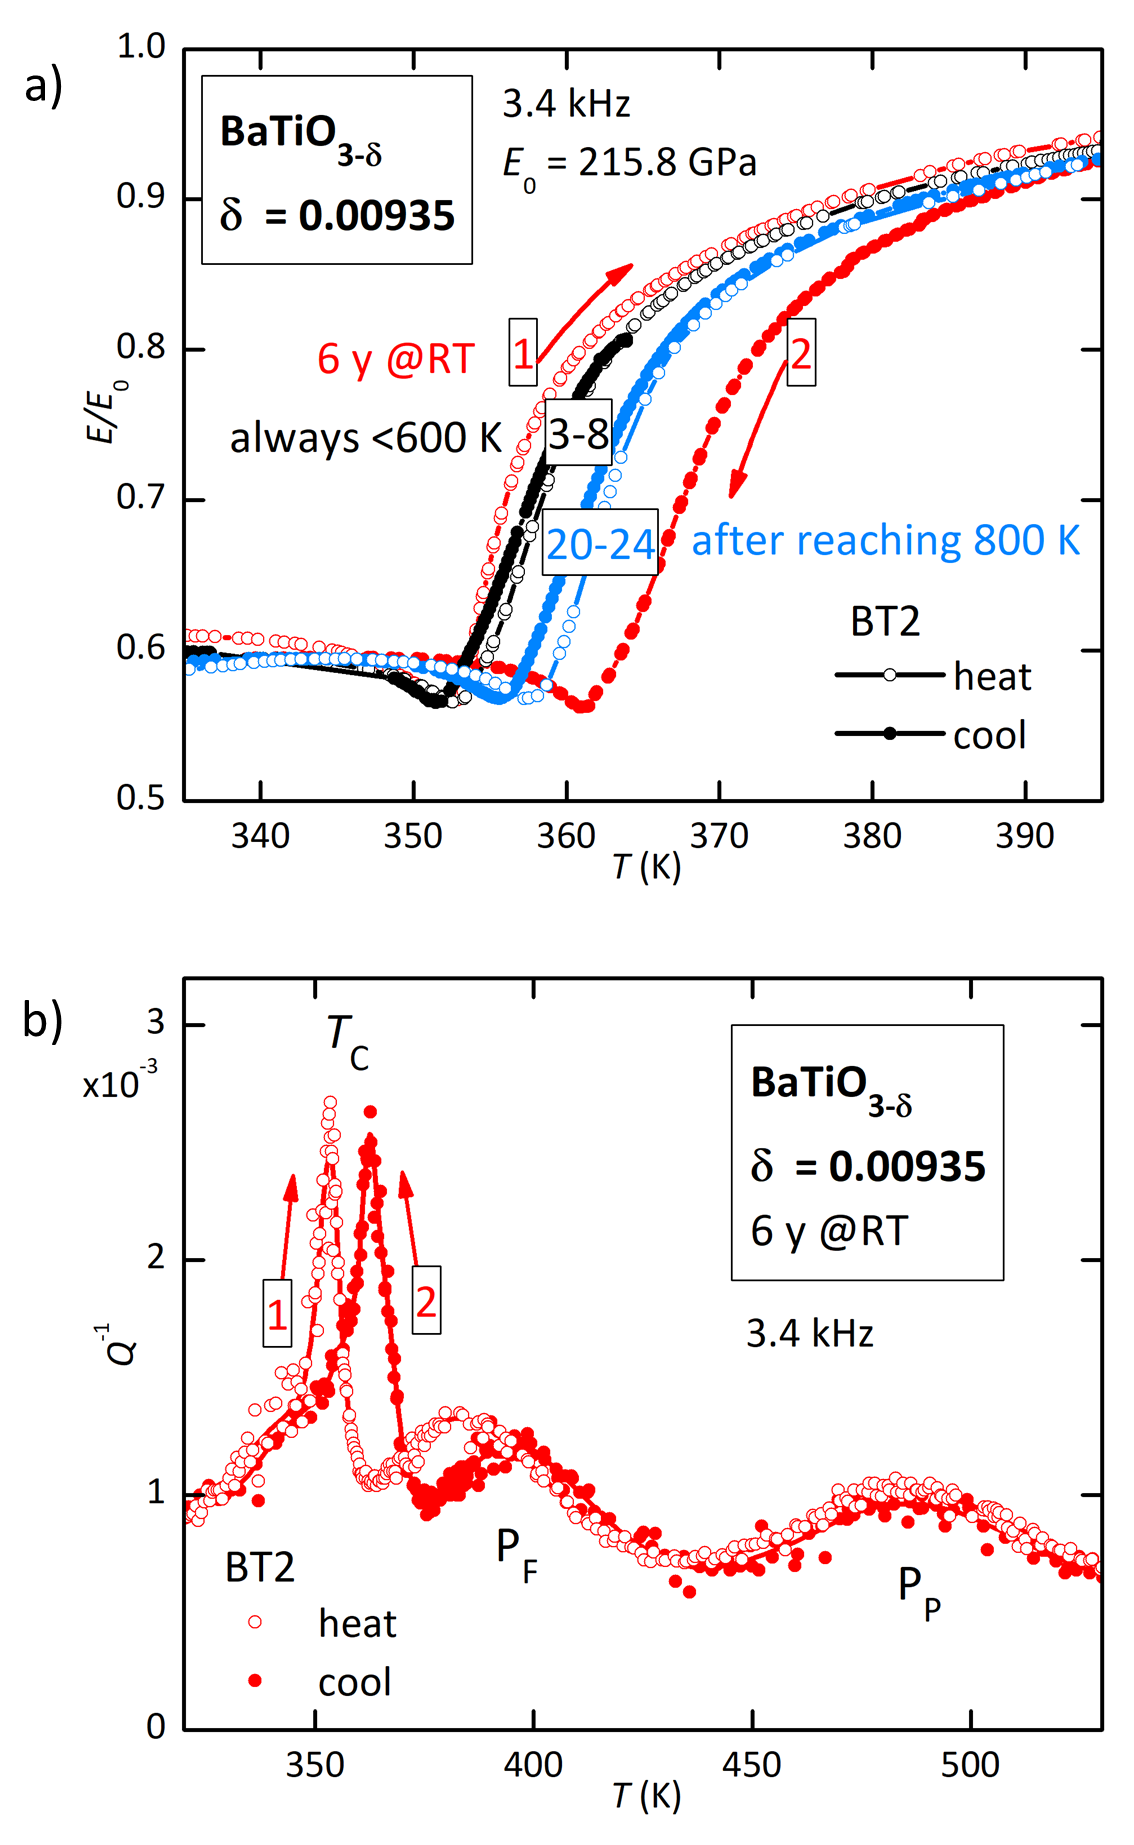
Figure 3a, however, shows that does not increase indefinitely and saturate with aging, since the lowest value of during heating is measured after aging 6 years, with a huge inverse thermal hysteresis of 10 K (curves 1 and 2). Then remains stable with normal hysteresis, if cycling does not exceed 600 K (curves 3-8, only two of which are shown for clarity), but, after reaching 800 K, it increases of 5 K and remains stable there (curves 20-24). Figure 3b shows the curves corresponding to 1 and 2 in Fig. 3a, after 6 years aging. Peak P during cooling is shifted to higher temperature, together with , and has smaller intensity.
III.2 BaxSr1-xTiO3
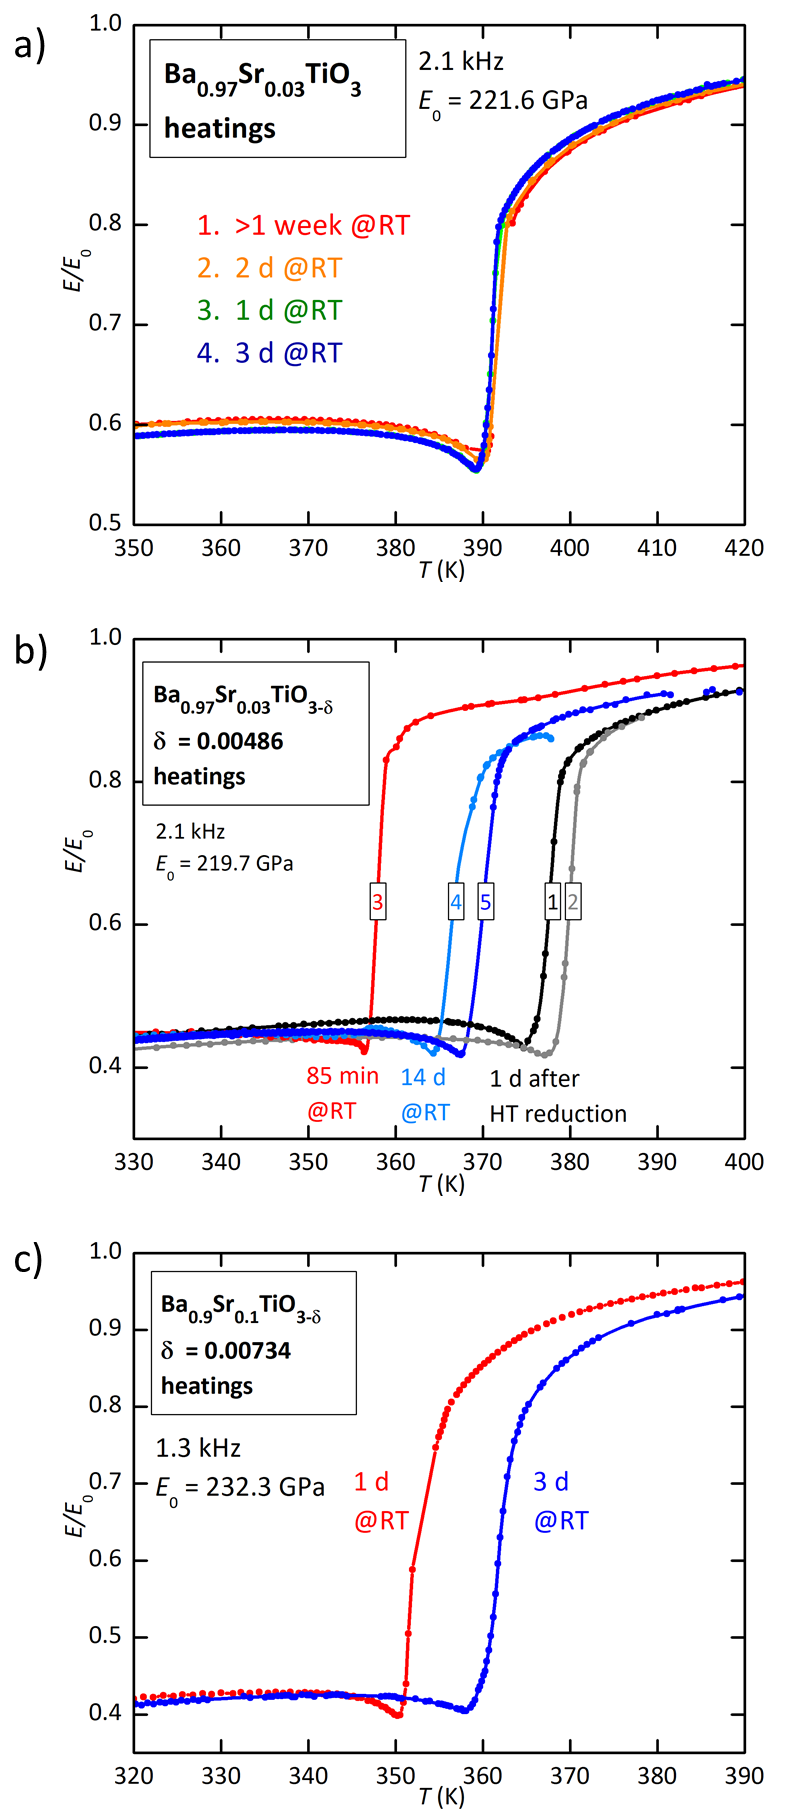
Substitution of 3% Ba with Sr decreases of BaTiO3 from 400 K to 390 K, independent of history (Fig. 4a); yet, upon introduction of V the temperature span of the changes of is increased with respect to BaTiO3-δ. Such a span, only for heating, is K in BaTiO3-δ with and 0.009, but is 21 K in Ba0.97Sr0.03TiO3-δ with 0.005 (Fig. 4b).
III.3 (Ba0.85Ca0.15)(Zr0.1Ti0.9)O3
Figure 5 presents the anelastic spectra of BCTZ at various O deficiencies, measured during both heating and cooling. The three phase transitions of BaTiO3 from the cubic paraelectric phase to the tetragonal, orthorhombic and rhombohedral ferroelectric phases are clearly recognizable in the as prepared oxygenated state. The introduction of V shifts to lower temperature and , which are still separated at but beyond that value the elastic anomalies merge into a broad one.
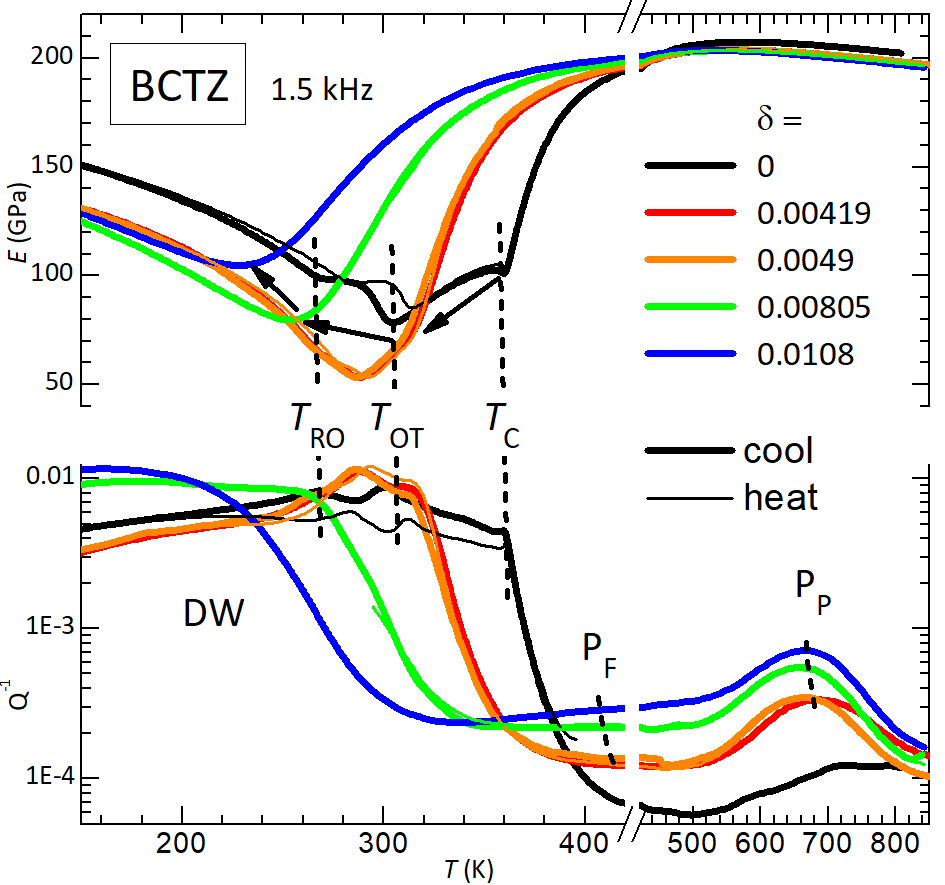
Also the anelastic relaxation peaks in the paraelectric phase, due to isolated (P) and paired (P) V are recognizable, but there are two major differences with respect to BaTiO3-δ (Fig. 1): the two peaks are shifted to higher temperature and are much broader.
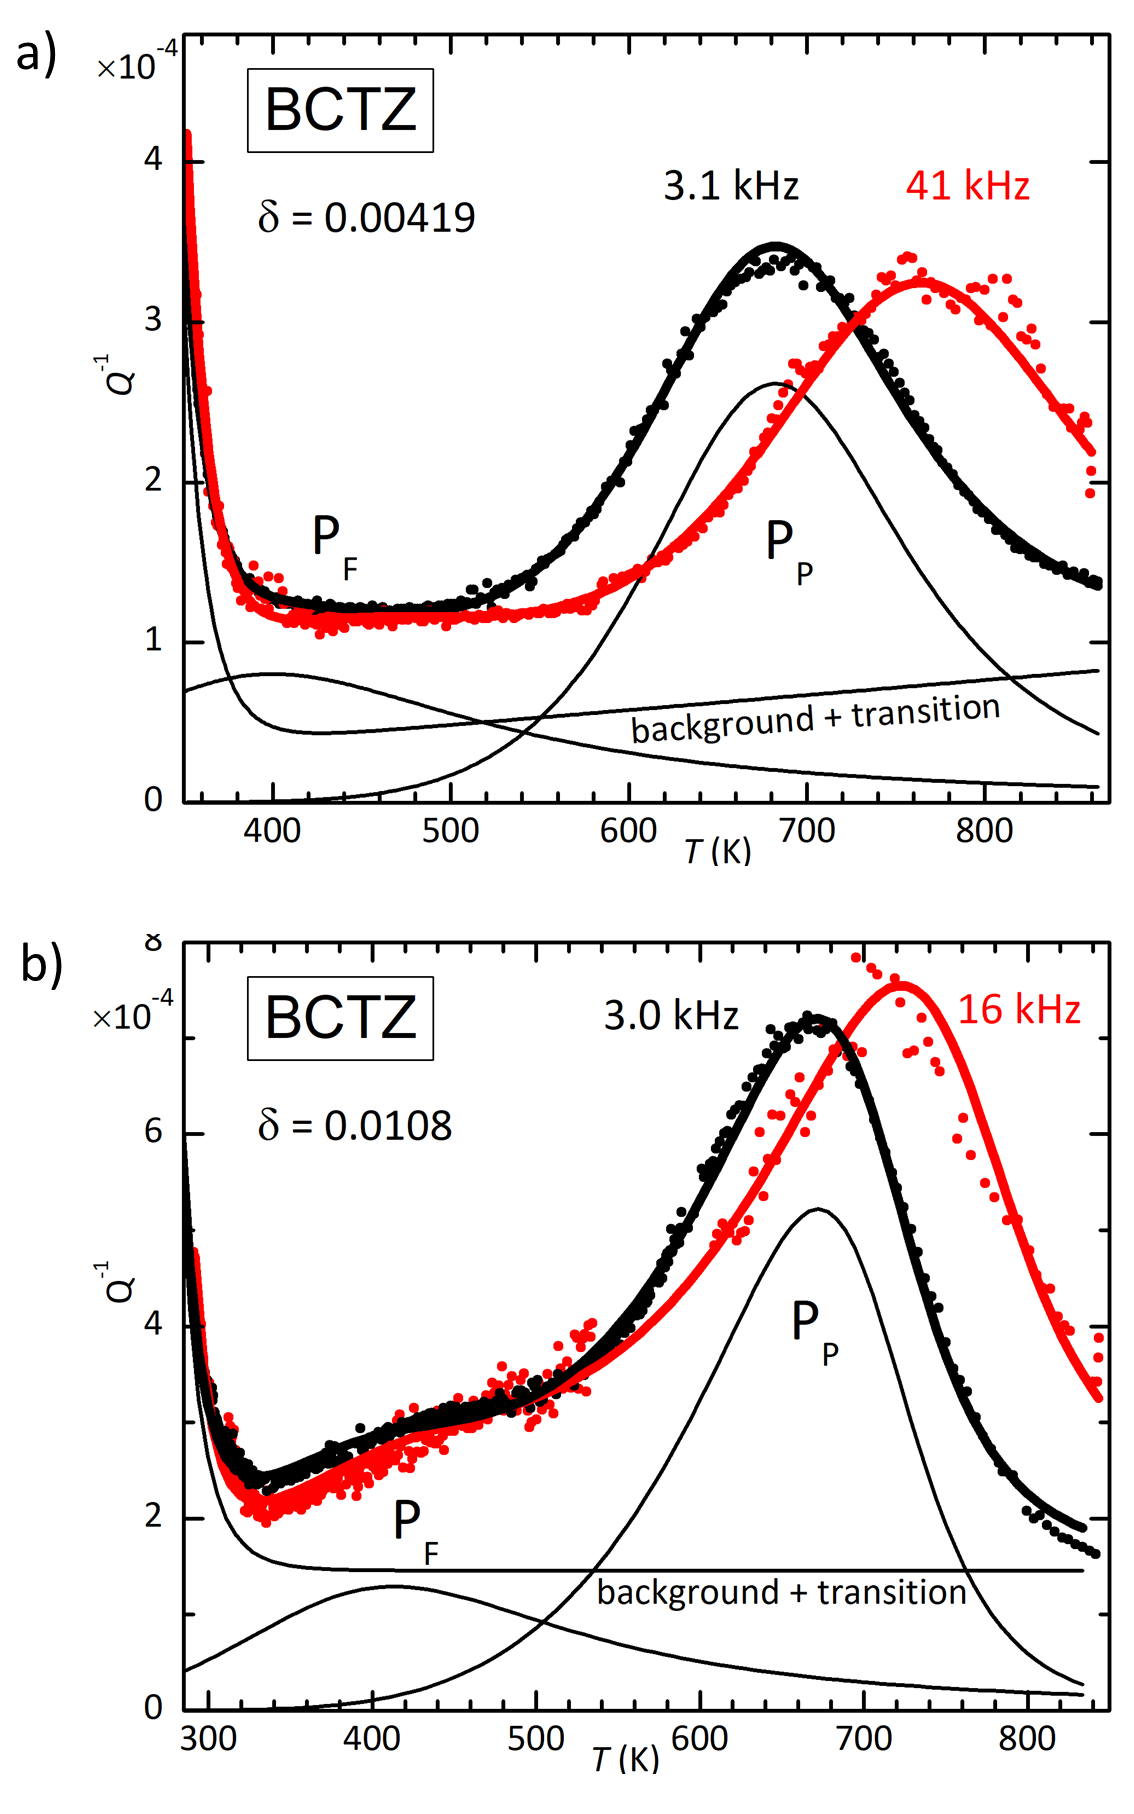
In order to be more quantitative, we fitted the anelastic spectrum of BCTZ above , following the example of BaTiO3 Cordero et al. (2021), with the phenomenological expressions Nowick and Berry (1972); Cordero (1993)
| (2) | |||||
| (3) |
where the usual Debye peak, when , and Arrhenius law for the relaxation time over a barrier are modified in order to describe relaxation between initial and final states differing in energy by , due to non–equivalence of initial and final state or disorder; this accounts for intensities of the peaks that do not decrease as with increasing . In view of the asymmetric shape of peak P, two broadening parameters have been introduced for the low–temperature () and high–temperature () sides of the peaks. The high quality anelastic spectra of SrTiO3-δ had been fitted with three distinct peaks, including the intermediate relaxation P from the asymmetric jumps of formation/dissociation of the pairs Cordero (2007), and those of BaTiO3-δ with up to five peaks, when distinct peaks appeared at higher temperatures, attributed to V trapped by unwanted defects Cordero et al. (2021). In (Ba0.85Ca0.15)(Zr0.1Ti0.9)O3 the lattice disorder broadens the relaxation spectrum so much that it is impossible to distinguish more than two peaks, and therefore the fits were carried out with two peaks, Eq. (2), plus a linear background and an exponential, , to take into account the rise of dissipation on approaching .
| BT | BT | BCTZ | BCTZ | |
| 0.0027 | 0.0153 | 0.00419 | 0.0108 | |
| P: (eV) | 0.72 | |||
| (s) | ||||
| 0.84 | ||||
| 70 ms | 0.4 s | 2 s | ||
| P: (eV) | 0.86 | 0.85 | ||
| (s) | ||||
| 0.91 | 0.80 | |||
| 0.91 | 0.80 | |||
| 60 s | 20 s | 130 y | 200 y |
IV Discussion
The above results show that the V not only decrease , but also make it strongly dependent on history in BT and BST up to 10% Sr but not in BCTZ. It should be mentioned that the V also introduce a new phase transition in BaTiO3-δ slightly above , which is hardly visible in the anelastic spectra measured at lower frequency shown here, but is apparent in the modulus measured at higher frequency. It might be a local effect of stabilization of the ferroelectric phase around particular clusters of V, and it will be the object of a separate study. The additional transition does not invalidate the fact that there is a major FE transition at a that depends on both and history. We will try to explain these observations in terms of the most obvious mechanisms that are possible when V are the only or major defect species: pairing and clustering of V and their association with domain walls.
IV.1 General interpretation of the anelastic spectra
IV.1.1 Hopping of isolated and paired O vacancies
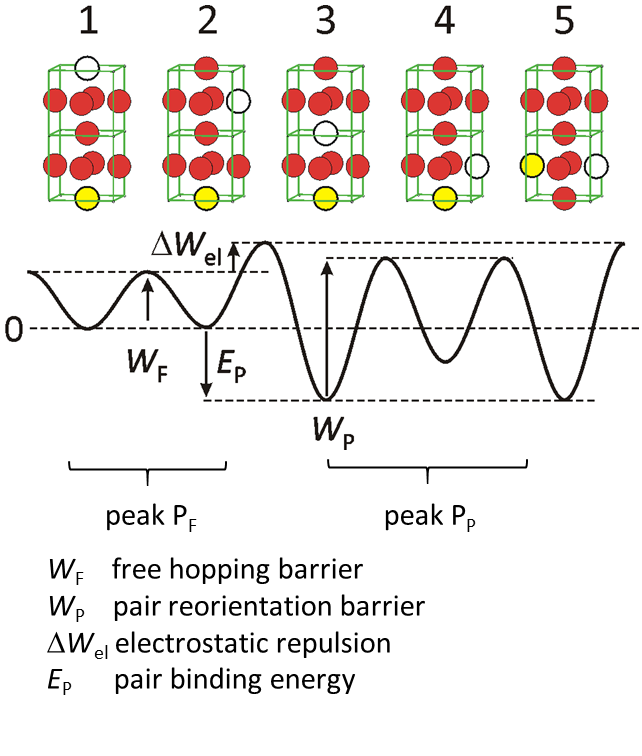
We refer to previous articles for the detailed analysis and discussion of the anelastic spectra of SrTiO3-δ Cordero (2007) and BaTiO3-δ Cordero et al. (2021), just reminding that the hopping of an V reorients the associated elastic dipole with major axis parallel to the nearest neighbor Ti atoms, causing peaks of the form Eq. (2). The hopping of isolated V causes peak PF, from which the hopping barrier in SrTiO3 is evaluated as 0.60 eV, independent of , and in BaTiO3-δ is eV and decreases with doping. Peak PP arises from the reorientation of V pairs and has a higher activation energy, eV in SrTiO3-δ, 0.86 eV in BaTiO3-δ, the latter again decreasing with doping. The lowering of the hopping barriers with doping is evident from the general shift to lower temperature of the whole anelastic spectrum of BaTiO3-δ with increasing . The activation energy for pair reorientation includes a partial dissociation of the pair and an increase of the saddle point energy corresponding to the electrostatic repulsion between the two approaching charged V. This effect has been estimated in SrTiO3 as a rise of the saddle point energy for forming a pair by 0.19 eV with respect to free hopping Cordero (2007) (see Fig. 8). It causes a slowing of the kinetics for reaching thermal equilibrium between free and aggregated V, with respect to what expected from the high mobility of the isolated V. A similar effect had been recognized to play a role with the highly mobile O atoms of the CuOx planes in YBa2Cu3O6+x Cannelli et al. (1994).
The actual shape of the potential of the intermediate step 4 for the pair reorientation is not easy to probe with anelasticity, since the corresponding peak P is depressed by the asymmetry factor in Eq. (2), and could be hardly distinguished only in SrTiO3-δ Cordero (2007), with a spectrum of nearly pure Debye peaks. Yet, both the site and saddle point energies should be intermediate between those of configurations 2 and 3. This means that the complete reorientation process between 3 and 5, probed by peak P, has the highest barrier smaller than that for dissociation from 3 to 2, and the dissociation rate is slower than indicated by peak P.
The lowering of the hopping barriers at higher O deficiency, observed in BaTiO3 but not in SrTiO3, can be explained in terms of a stronger interaction between the V and the nearest neighbor Ti atoms, when they are off–center Cordero et al. (2021). Indeed, the elastic dipole of an isolated V is three times larger in BaTiO3 than in SrTiO3 and the hopping barrier is 0.73 eV against 0.60 eV. The mobile electrons doped by the V would smear out the eight minima potential of the Ti atoms, reducing the effect, and making the V environment more similar to that of SrTiO3, with a shallower potential Cordero et al. (2021). The doping dependence of the hopping barriers, together with the facts that the anelastic relaxation peaks of BaTiO3-δ are broad and the main peak P is visible only at the highest doping, make challenging an analysis like that carried out for SrTiO3-δ, where also the temperature dependence of the populations of free and aggregated V were included and the binding energies were estimated as 0.18 eV for pairs and 0.26 eV within longer chains Cordero (2007). Therefore, the fits of the BaTiO3-δ were carried out with expressions like Eq. (2), with temperature independent , and it was assumed that the V pair binding energy in BaTiO3 has a value of eV, similar to SrTiO3.
The curves of BCTZ (Fig. 5) at increasing O deficiency are qualitatively similar to those of BaTiO3-δ (Fig. 1), with the two major peaks P and P in the paraelectric phase and their shift to lower temperature with increasing , but these peaks are much broader and have larger activation energies. The broadening, quantified by the definitely smaller values of and in Table I, is justified by the disorder in the cation sizes, and renders difficult the analysis of the anelastic spectra. Therefore, the parameters of for BCTZ in Table I are only indicative, and the fact that the activation energies are not slightly smaller at larger , as in BaTiO3-δ, should not be considered as significant.
Table I contains also the mean characteristic time for the hopping of an isolated V and reorientation of a V pair calculated at room temperature, useful for understanding the mechanisms of aging, fatigue and deterioration of properties. These times are only indicative, because neglect the splitting of the energies of the V with dipole parallel and perpendicular to the tetragonal axis in the FE phase, as explained later (Fig. 11). Some points can however be established: at room temperature the isolated V remain quite mobile, with hopping rates of about s-1 in all compositions. The reorientations of the pairs, and even more their dissociations, are slower, but still occur over time scales of minutes, except for BCTZ, which stands out with characteristic times of hundreds of years.
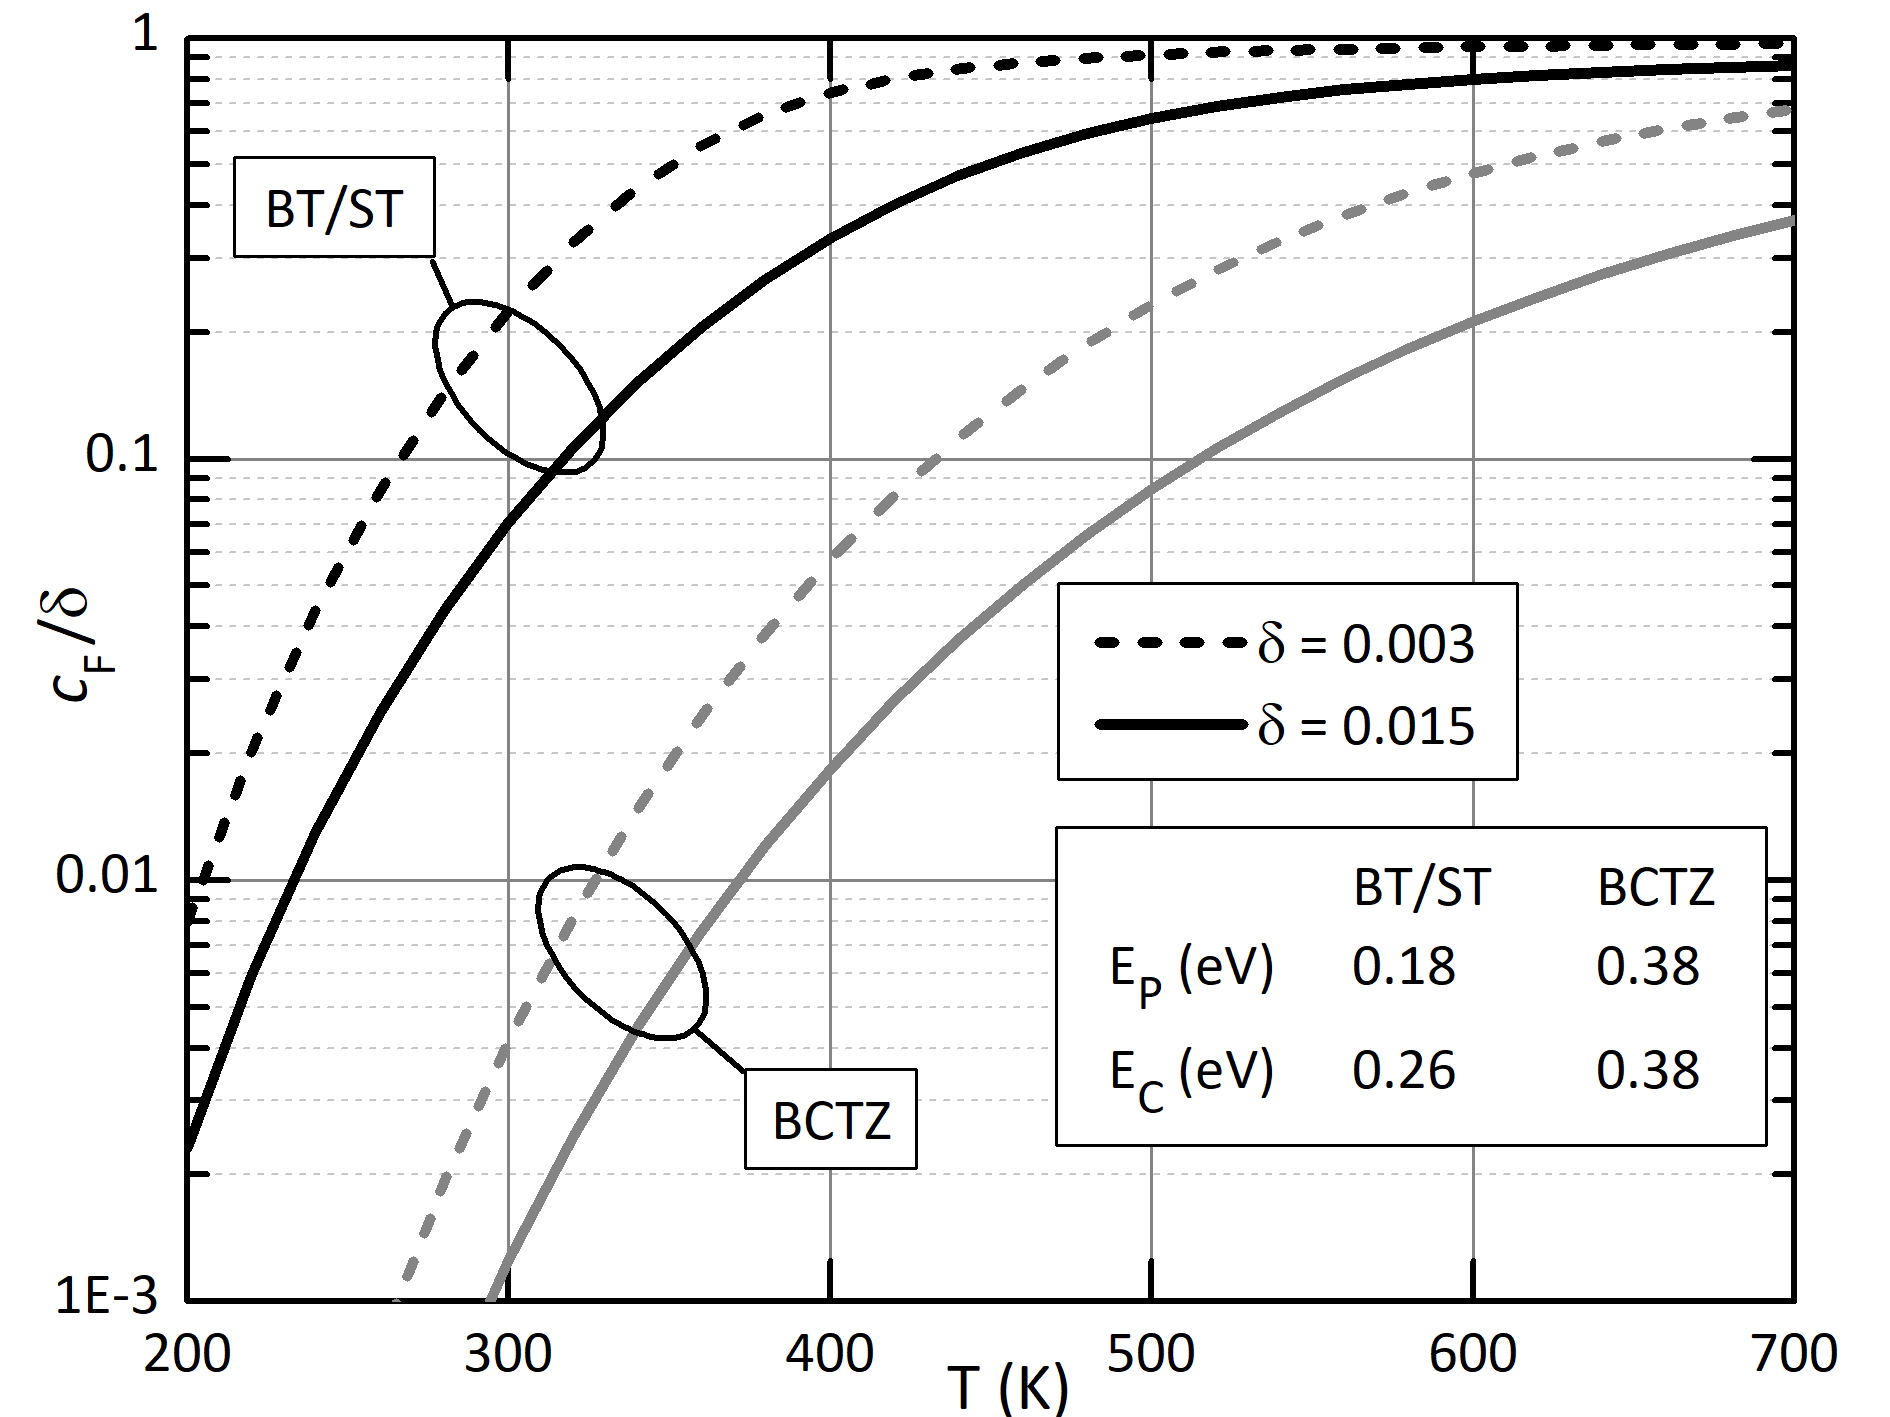
Considering the differences in the mobilities of free and aggregated V, it is important to know their relative fractions as a function of temperature. As already mentioned, the anelastic spectra of BaTiO3 and BCTZ do not allow the binding energies of V in pairs and chains to be estimated, as it was done in SrTiO3 Cordero (2007). Yet, in order to have an idea, in Fig. 9, the relative fractions of isolated V at two representative total concentrations, 0.003 and 0.015, are plotted against using the same method for analyzing the anelastic spectra of SrTiO3-δ. In one case, the same parameters of SrTiO3 have been used, which should be representative of BaTiO3, while the other case should represent BCTZ. Lacking estimates of the pair and chain binding energies for BCTZ, it has been taken into account that the activation energy for the pair reorientation in BCTZ, eV, is 0.4 eV higher than in SrTiO3 and 0.55 eV higher than in BaTiO3, while is higher by eV. This suggests that the pair binding energy of BCTZ is eV larger than in SrTiO3 and BaTiO3, namely eV. The curves in Fig. 9 are plotted using 0.38 eV, and indicate that, while in BaTiO3-δ there is a sizeable fraction of free V around and at RT, in BCTZ practically all V are aggregated and therefore static. This explains why BCTZ does not display any time dependence of (Fig. 7).
IV.1.2 Pinning of domain walls by O vacancies
Pinning of DW, at least of the type, is demonstrated by the decrease of the dissipation below by times upon introduction of as little as 0.003 V (Fig. 1). This dissipation is due to the relaxational motion of DWs, which enlarge the fraction of the domains with axis parallel to the extensional component of the sample vibration strain at the expenses of those perpendicular to it. There must be a broad distribution of characteristic times for the DW motion, resulting from the distribution of domain sizes and configurations, so that, rather than a peak centred at the temperature where , the curve is flat below . It can be concluded that a considerable fraction of DWs are pinned already by few tenths of percent of V. Nothing can be said about pinning of the DWs, since their motion does not affect strain and does not contribute to the elastic energy dissipation. Notice, however, that the motion of any type of DW is also hindered by sparse quasistatic V by the fact that, while the DW sweeps through them, they temporarily transform from apical with lower energy to equatorial with higher energy (see Sect. IV.5), effectively acting as a restoring force Chandrasekaran et al. (2016).
IV.2 Dependence of on history
The observation of a time dependence of in ferroelectrics containing defects is not new. Enhancements of up to 2.5 K have been observed in single crystals of BaTiO3 after aging at RT for days Sun et al. (2005), and attributed to the reorientation of FeV electric dipoles parallel to the local spontaneous polarization. The corresponding lowering of the electric energy would stabilize the ferroelectric domains and enhance Sun et al. (2005). A related effect is the shift and constriction of the hysteresis loops, due to the internal field created by the defect dipoles, preferentially aligned parallel to the local polar direction during aging Carl and Hardtl (1977); Ren (2004).
Accordingly, the initial slow rise of with aging over hours and days in the FE state of O deficient BT and BST (Figs. 2b,c and 4b) might be partly explained by a stabilization of the FE domains through the alignment of the orientations of the defect dipoles with respect to the local polarization, and stabilization of the DW configurations. In the present situations, the great majority of the V are introduced by the reduction treatments and are not paired with acceptor defects to form electric dipoles, but still the interaction of their elastic, instead of electric, dipoles with the tetragonal strain can produce the same effect.
IV.3
Apical and equatorial V in polar
domains
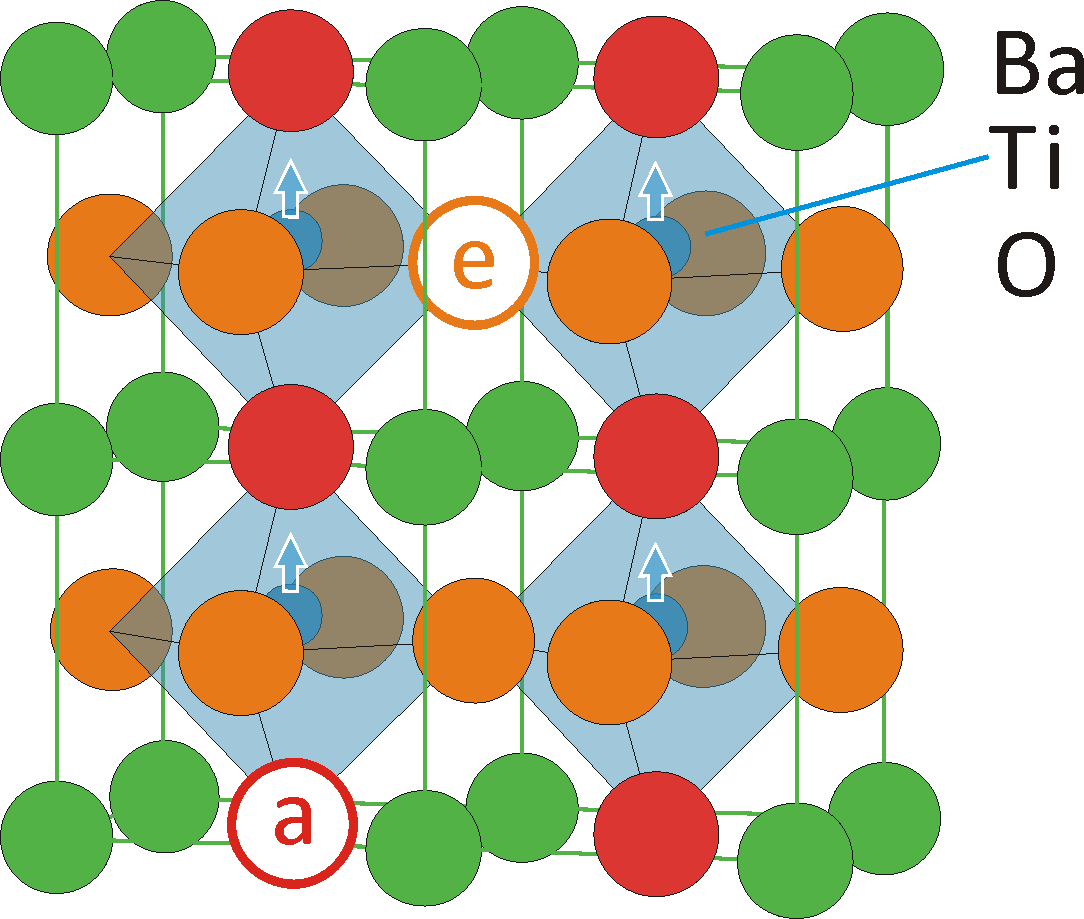
In the FE tetragonal phase of a perovskite the O atoms become of two types: apical or equatorial with respect to the tetragonal axis, as shown in Fig. 10, and differ in energy by , resulting in an interaction with the polar domain.
From a purely elastic point of view it should be , assuming that the major axis of the V strain ellipsoid is parallel to the directions of the nearest neighbor Ti4+ ions, pushed away by the positive V, and in accordance with calculations Granhed et al. (2019). The elastic contribution to can be estimated as the energy difference of an elastic dipole between orientations parallel or perpendicular to the tetragonal strain. The anisotropic component of the elastic dipole of a V in cubic BaTiO3, , has been deduced from the intensity of peak P Cordero et al. (2021) and is very close to the calculated value of 0.067 Granhed et al. (2019). The elastic contribution to the energy splitting between the two orientations in a tetragonal lattice can be written as Nowick and Berry (1972)
where m3 is the cell volume, GPa and GPa the elastic constants and the tetragonal strain of BaTiO3. This value is not far from eV, calculated for a V trapped by a Mn Nossa et al. (2015), and which takes into account also electronic effects and other differences between the actual FE lattice and a tetragonally strained PE lattice. Most of the calculations of the difference between the energies of the apical and equatorial sites for isolated V, including electronic effects, have been done for PbTiO3, obtaining quite a broad range of results: 0.44 eV Chandrasekaran et al. (2016), 0.1 eV Shimada et al. (2013), 0.04 eV Yao and Fu (2011), 0.025 eV Xu et al. (2016), eV Wang et al. (2019), eV Alahmed and Fu (2007). In the last paper is also calculated for BaTiO3 and found to be eV, four times smaller than in PbTiO3 Alahmed and Fu (2007). It is indeed expected that the magnitude of the splitting between the energies of V with elastic dipole parallel and perpendicular to the axis is smaller in BaTiO3 with than in PbTiO3 with .
Summing up, from a purely elastic point of view, the energy of a V in apical position should be eV lower than in equatorial position. Taking into account first–principle calculations, which include the electronic effects, we may assume that 0.1 eV. This has consequences with respect to the state and mobility of the V at RT, in the FE state: according to the Boltzmann factor , only of equatorial sites are occupied by V, implying almost total alignment of the elastic dipoles to the tetragonal axis at equilibrium, and the hopping rates between the two types of positions split by a factor of the same order of magnitude. These quantities cannot be measured by anelastic relaxation, because the relaxation spectrum below is dominated by the DW relaxation.
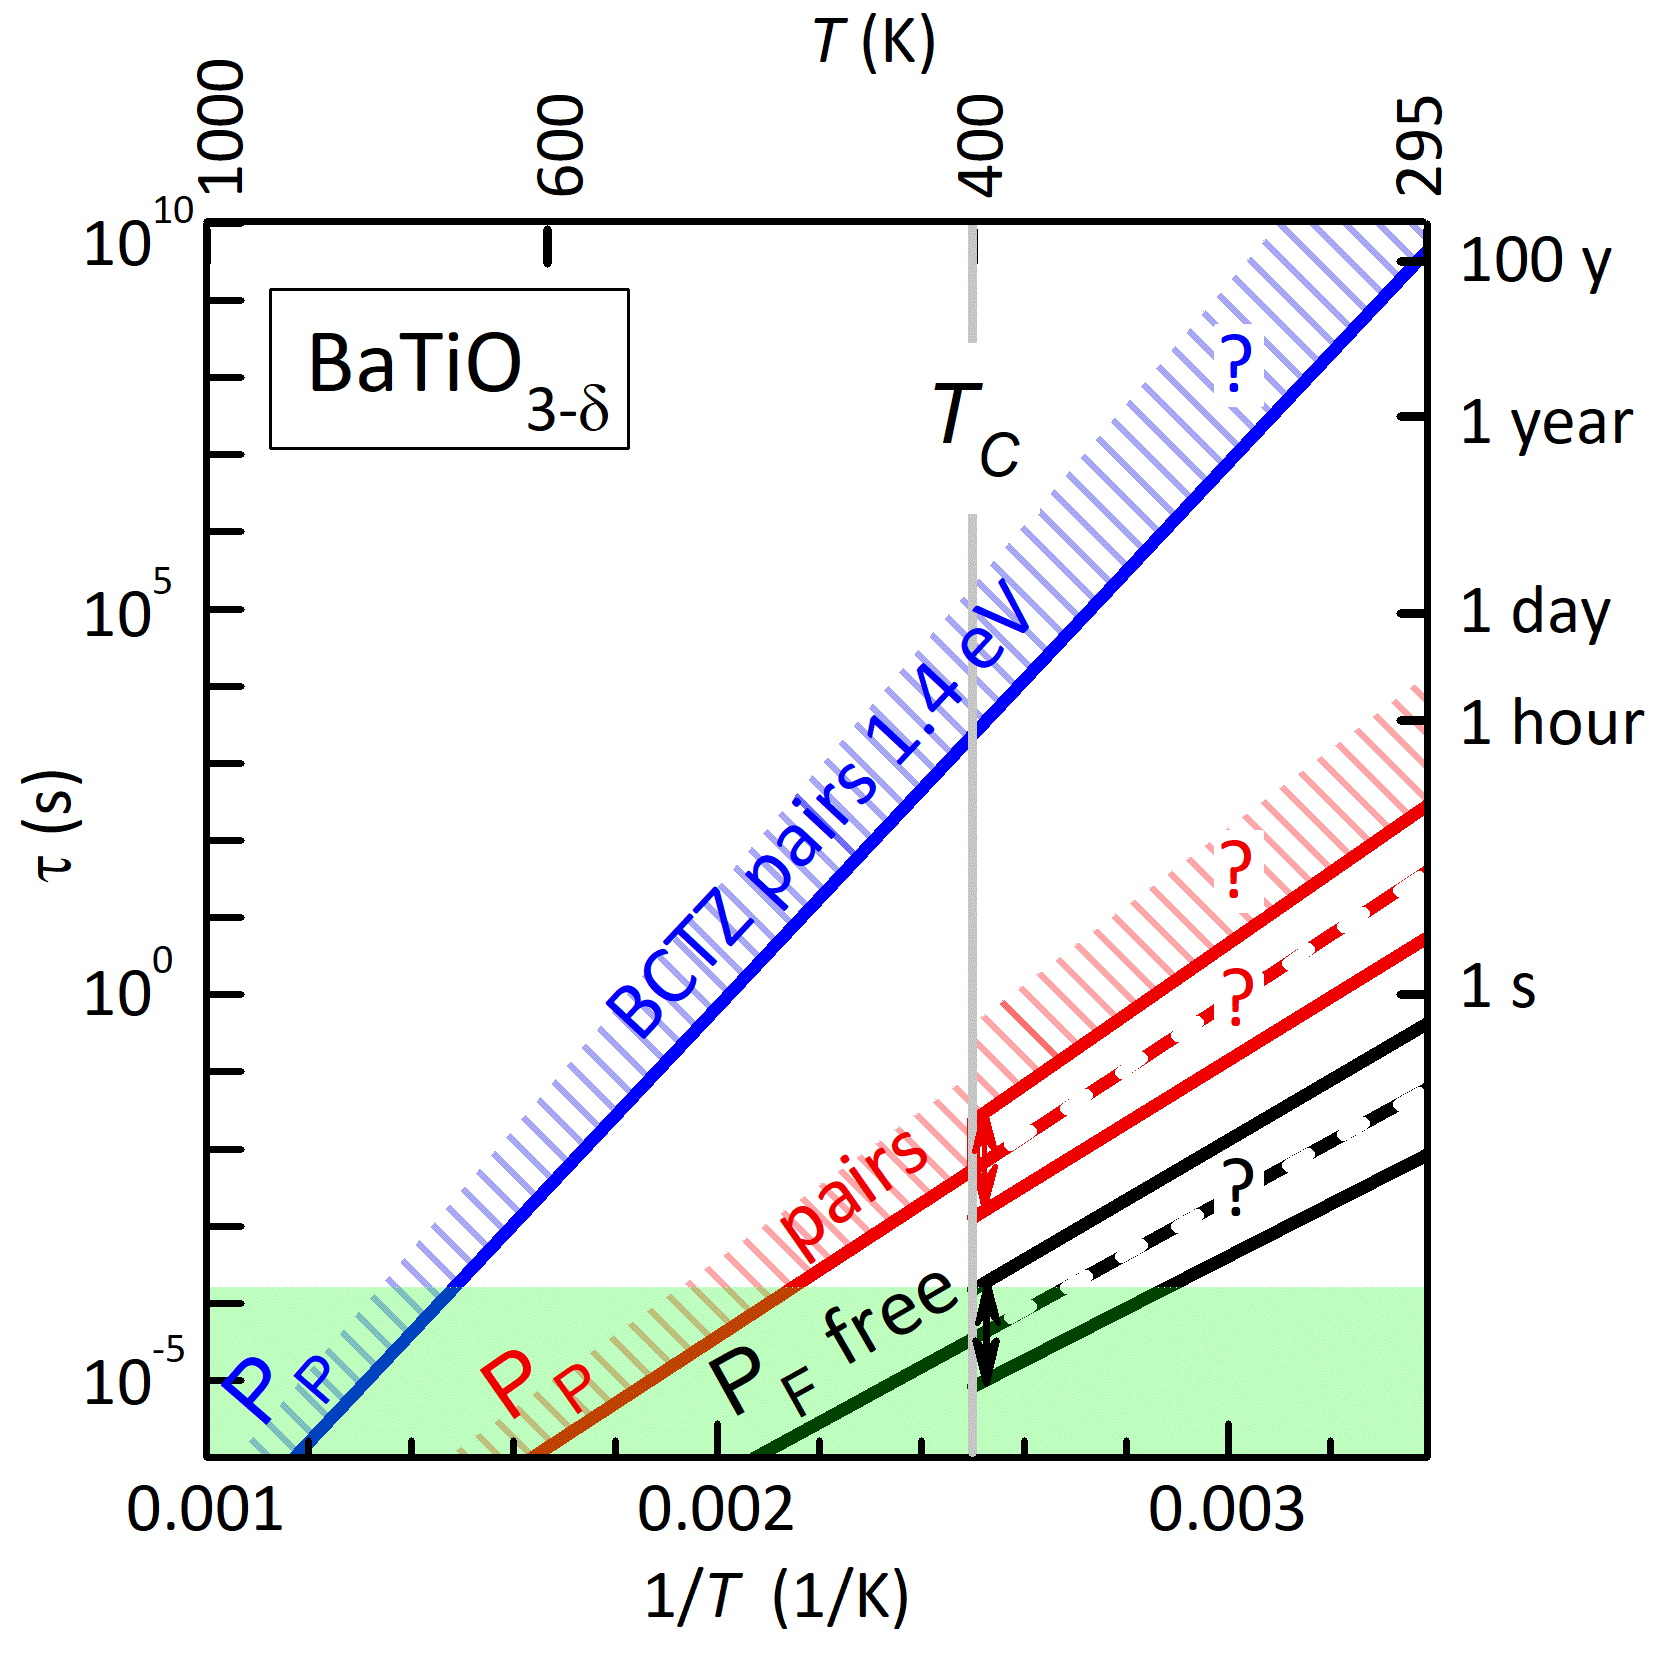
The situation is illustrated in Fig. 11, with an Arrhenius plot of the relaxation times of peaks P and P in BT and BCTZ (green region) extrapolated in the FE state. It is assumed that the splitting of the activation energies in the FE phase is eV. The shaded region is the mean pair dissociation time assuming an activation energy up to 0.1 eV larger than that for reorientation (see the discussion of Fig. 8).
IV.4 Dependence of electron doping and on the aggregation of V
Having established that the V lack electric dipoles, but can influence the FE state through their elastic dipoles, we still observe that the magnitude of the changes of with various temperature protocols in O deficient BT, and especially BST, are much larger than reported up to now in BT containing dopants or defects. For example, in a single crystal of BaTiO3 with unknown amount of Fe3+–V complexes, increased of up to 2.5 K after aging Sun et al. (2005); in BaTiO3 doped with 1% Mn3+ on the Ti4+ site, and presumably compensating V, the shift was 1.5 K Ahmad et al. (2007). Evidently, in the presence of uncompensated V there must be another mechanism affecting , besides the internal fields from the oriented defect dipoles. We are going to argue that the major factor affecting is the electron doping from the ionized V, which depends on their aggregation state.
Let us first observe that the major cause of depression of by doping is not the size effect of the dopants and defects, but the mobile charges that they induce. This is reasonable, if one considers that the mobile charges screen the dipolar interactions that induce ferroelectricity, and is demonstrated by the fact that uncompensated V depress at a rate of about K/ Cordero et al. (2021), but when they are electrically compensated as Schottky defects Lee et al. (2007), the rate reduces to K/ in Ba1-δTiO3-δ and K/ in BaTi1-δO3-2δ, inclusive of the contribution from the dopants. Accordingly, a neutral defect like Sr in Ba1-xSrxTiO3 reduces by only K Lemanov et al. (1996). Therefore, considering that the depression of by charged defects is an order of magnitude larger than that by neutral defects, it is important to understand what effect the pairing and further aggregation of V has on the electron doping and finally on .
We will not review the computational studies on the valence state of V and polarons from ionized V in BaTiO3, because there is experimental evidence confirming the existence of V pairs and chains, independent of anelastic relaxation Cordero (2007); Cordero et al. (2021), and which also sheds light on the how these clusters affect doping. In fact, highly reduced films of SrTiO3-δ have been studied by diffuse X-ray scattering, finding evidence of linear clusters along the direction Eom et al. (2017). Moreover, photoemission spectroscopy revealed the presence of Ti2+, in addition to Ti3+ and Ti4+ Eom et al. (2017). The linear clusters are the V pairs and chains along the O–Ti–O directions, parallel to the polarization in the FE state, which can also be considered as nuclei of a brownmillerite phase Cordero et al. (2016), and the Ti2+ ions are within such pairs and chains Eom et al. (2017). The Ti3+ correspond to the mobile electrons in band or polaron states, responsible for the nearly metallic conductivity of the reduced samples, while the electrons at the Ti2+ sites are evidently localized.
The emerging picture is that isolated V are doubly charged and dope two electrons each, but, if two V form a pair, doping is halved, because two electrons are localized on the intermediate Ti2+. Further aggregation of V to form longer chains creates new Ti2+ ions and halves the doping. Therefore, full pairing/clustering of the V halves the electron doping, with respect to the case of fully dispersed V.
As explained in Sect. IV.1.1, it is difficult to be quantitative on the fraction of aggregated V during temperature runs and aging for predicting the consequences on , but we may use Fig. 9 as a guide. In addition to the uncertainties on the binding energies, one should take into account the slow rate for reaching equilibrium, as mentioned in Sect. IV.1.1. In fact, the high mobility of the free V ( jump/s at RT according to Table I) suggests that the equilibrium fraction of aggregated V is reached almost instantaneously above RT and , but the rate for aggregation is slower than that for free hopping, due to the electrostatic repulsion, which raises the saddle point for joining another V (Fig. 8). The rise estimated for SrTiO3, 0.19 eV, causes a slowing of the aggregation the rate by 250 times at 400 K and 2500 times at RT. In addition, if V chains have lower energy than pairs, as in SrTiO3, the conversion of sparse pairs into chains requires the dissociation of some of them, which is slower than the pair reorientation rate (according to Fig. 11 as slow as jump/hour at RT). The slow kinetics for reaching the thermal equilibrium between isolated and aggregated V may account for the fact that it is not sufficient to enter the PE phase in order to reach a stable state, and both the and curves, including , are not always reproducible also during cooling.
Since the V aggregation decreases doping and enhances , the slow kinetics for aggregation, may be the major cause of the increase of with aging in the FE state, and adds to the known stabilization effects of the FE domains. An indication in this sense comes from the comparison of heating and subsequent cooling after long aging in Fig. 3b. During heating, peak P due to the hopping of free V is more intense, indicating a higher fraction of free V and hence higher doping, and is indeed lower. In addition, P is also shifted to lower temperature, coherent with higher doping. During cooling the opposite is observed in peak P and , coherent with less free V and doping than previously. These phenomena are amplified by mild lattice disorder, as in BST with 3% Sr (Fig. 4), presumably due to the distribution of hopping rates with tails of longer relaxation times.
Explaining the details of the approach to equilibrium during the temperature runs or short aging times seems an exceedingly difficult task, but we would now try to explain the puzzling observation that, after an extremely long aging (6 years in Fig. 3a), does not actually further increase and saturate, but becomes smaller. In order to do that, we should consider the competition between the clustering of V into V–Ti–V pairs and chains along the direction and their association to the DWs.
IV.5 Pinning of 90∘ domain walls by isolated V and increase of electron doping.
As noted in Sect. IV.1.2, the marked depression of below after the introduction of V, proves that the DW are pinned by V. Yet, this does not necessarily imply that the aggregation state of V is affected by DWs. It would be possible that the direct DW–V interaction is weak, the V remain within the domains, and pinning is due to the effective restoring force acting when the DW sweeps through them, and they temporarily transform from apical with lower energy to equatorial with higher energy Chandrasekaran et al. (2016).
In order to establish whether the interaction between V and DW may affect the aggregation state of V, it is necessary to compare the respective binding energies and consider in detail which positions would the V occupy with respect to the DW. To this end, we will review the relevant literature on the nature of the interaction between V and DWs in perovskite ferroelectrics.
In the FE-T phase, the DWs can separate domains whose spontaneous polarizations are rotated by and , which in turn can be neutral head-to-tail DWs or charged head–to–head or tail–to–tail Ondrejkovic et al. (2013). Negatively charged tail–to–tail DWs are the most effective traps for positively charged V, but charged DWs are energetically unfavorable and therefore rare, unless specific poling procedures are used Sluka et al. (2012). This is not the case of our unpoled samples and we will assume that the DWs are neutral and . On the other hand, it has been proposed that V may nucleate tail–to–tail DWs and distribute along them Petralanda et al. (2021), so that we cannot exclude that, especially at the highest O deficiencies, also charged tail–to–tail DW decorated with V exist. Even neutral DW, however, have a local electric field, due to the change of direction of the spontaneous polarization. This field is absent in DW and accumulates positively charged defects and electrons on either sides of the wall Hong et al. (2008), so that, in general, there is stronger attraction between V and DWs.
Coming to BaTiO3, in most of the experimental studies on pinning of DWs, the V electrically compensate acceptors, like Mn3+ or Fe3+ substituting Ti4+, intentionally doped or as unwanted impurities. Since V are strongly bound to the acceptors, which are static, those results are not indicative of DW pinning from mobile V.
First–principle calculations of V at both an DWs have been done mainly for PbTiO3. The DW is found to be extremely sharp, only one unit cell in both directions, and the energy of a double charged V at the DW is 0.13 eV lower than far from it Chandrasekaran et al. (2013), in substantial agreement with a previous study He and Vanderbilt (2003). In the case of DW in PbTiO3, it has been found that both apical and equatorial V lower their energy of eV Chandrasekaran et al. (2016) or 0.23–0.33 eV Xu et al. (2016); Wang et al. (2019) within the DW or in positions nearest neighbor to it. The first–principle calculations indicate that the sites of lowest energy for the V are on the tail side of DW, contrary to what suggested by more macroscopic phase–field calculation schemes Hong et al. (2008).
Similar calculations for BaTiO3 are not available, except for DW, where it is found that, at variance with PbTiO3, V in BaTiO3 have lower energy within the domains than near DW, and concluding that DW pinning by V should be either weak or entirely absent in BaTiO3 Samanta et al. (2021). This is neither in contradiction nor in agreement with our data, since we are not sensitive to the motion of DW. Moreover, considering that DWs have a higher formation energy than DW ( times in PbTiO3 Wang et al. (2019)), and lack their internal electric fields Hong et al. (2008), the weakness or absence of interaction of V with DW seems irrelevant to our discussion.
Considering that the tetragonal strain and internal electric fields in BaTiO3 are smaller than in PbTiO3, we may take the magnitude of the binding energies between a V and a DW in PbTiO3, up to eV, as an upper limit for BaTiO3. Therefore, it appears that the magnitude of the binding energy to the DW is competitive with the V pair binding energy eV in SrTiO3 Cordero (2007), which we assume is similar, if not smaller, in BaTiO3 Cordero et al. (2021).
It is therefore possible that after a long equilibration time the V pairs split and migrate to DWs, where the most favorable configuration is no more that of stable V–Ti–V pairs and chains. This is evident in Fig. 12a, showing a domain ending at the bottom in a DW, with the TiO6 octahedra put in evidence. The O atoms are distinguished into apical and equatorial. We have seen that the Boltzmann factor at RT makes an apical Vtens of time more favorable than an equatorial one, both far and near a DW. Therefore, the V occupy only the apical positions, both when they are isolated and aggregated, and the stable V pairs and chains in the FE state are along these O–Ti–O rows, but it is clear that no such pair can have both V at the DW plane. In fact, if a pair is along the direction, within the horizontal plane of Fig. 12a, then only one of the two V is at the DW, and the DFT calculations show very sharp differences between the optimal position at the DW and away from it Xu et al. (2016); Wang et al. (2019). Neither can any pair of sites in the plane of the DW form a stable pair of V at opposite sides of a same Ti atom, since different apical O sites belong to different octahedra.
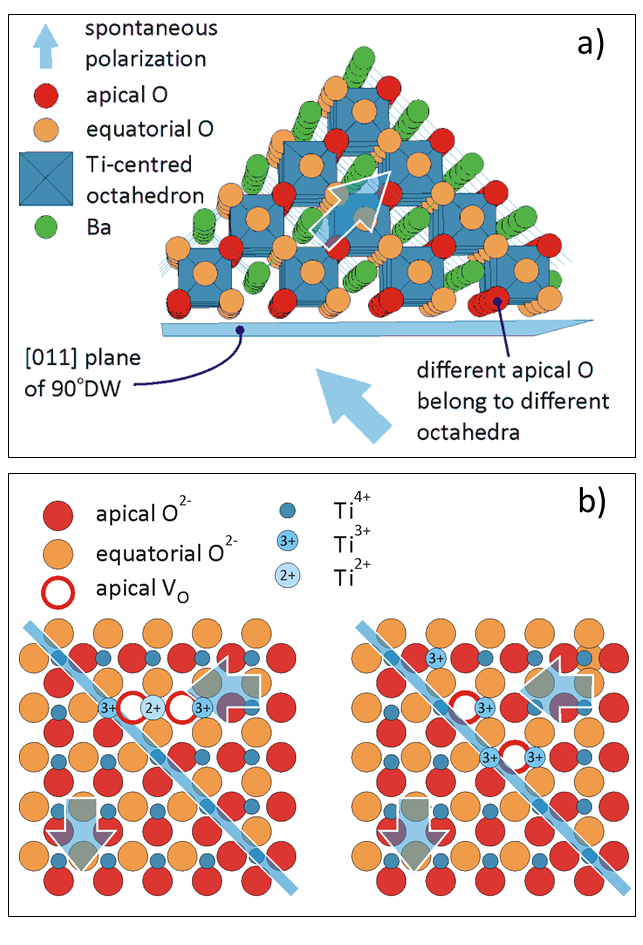
Figure 12b shows what happens when a stable pair of V, sharing a Ti2+ ion, dissociates in order to have both V at the DW: the number of mobile Ti3+ electrons doubles from 2 to 4, as explained in Sect. IV.4.
In the light of the above considerations, we propose the following explanation for the fact that increases with aging on the time scale of days but then decreases after years (Fig. 3a). When cooling from the PE state through , about half of the V are free (Fig. 9) and, in addition to continue aggregating, they can quickly pin the forming DWs, as demonstrated by the fact that the elastic energy loss of the O deficient samples is depressed immediately below , with respect to the case . The first stage of aging at RT would see a clamping of the DWs mainly by free V, which does not change doping, and an increase of the aggregated fraction far from the DWs, according to Fig. 9, which decreases doping and raises . Yet, if the V are slightly more stable at the DWs than in pairs and chains, which seems to be the case, on the long time, part of the already aggregated V will dissociate and migrate to the DWs, accounting for the final decrease of . The relaxation times extrapolated at RT in Fig. 11, together with the equilibrium fractions of isolated and aggregated V in Fig. 9, justify the observation of the reach phenomenology found in the aging dependence of in BT and BST.
IV.6 Absence of aging in BCTZ
Figure 7 demonstrates that, contrary to BT and BST, aging has no effect on in BCTZ. This is again explained by the combination of Figs. 9 and 11: at RT practically all V are aggregated and their mean dissociation rate is of the order of hundreds of years. This may also provide a justification to the better resistance to bipolar fatigue Fan et al. (2018) and absence of pinched P-E loops starting from the unpoled state found in BCTZ Zhang et al. (2015).
V Conclusions
The Young’s modulus and elastic energy loss, , of BaTiO3-δ, BaxSr1-xTiO3-δ and (Ba0.85Ca0.15)(Zr0.1Ti0.9)O3-δ have been repeatedly measured during heating and cooling runs at various O deficiencies and after different aging times. The curves in the paraelectric phase contain peaks due to the isolated and paired V, from which it is possible to measure the respective hopping/reorientation rates and activation energies, while in the ferroelectric phase they monitor the degree of domain wall pinning by V.
The V are introduced by reducing treatments and are free to diffuse and aggregate into pairs, while in most applications they are compensating acceptor dopants, with which form complexes stable at room temperature. A major consequence is that the dependence of and its thermal hysteresis on aging and history are greatly enhanced: in BT (BST) we found that measured during heating may vary of 6 K (21 K) at the same value of , while no anomaly is found in BCTZ. The main conclusions are that is depressed mainly by the mobile electrons doped by V. Each isolated V dopes two mobile electrons as Ti3+ ions, but, when it forms a stable linear V–Ti2+–V pair, the two electrons of the Ti2+ ion are immobile and do not contribute to doping. Therefore, is determined not only by the O deficiency but also by the fraction of V that are aggregated. In this manner it is possible to explain the rise of during initial aging, much larger than in acceptor doped BaTiO3, where the V remain bound to the acceptor and do not vary doping.
While a mild lattice disorder (up to 10% Sr substituting Ba) increases the effects, the strong disorder of BCTZ completely freezes them. In fact, BCTZ has a much larger mean activation energy for the pair reorientation (1.4 eV compared to eV in BT) and hence for the pair dissociation. At room temperature practically all V are paired and static over a time scale of hundreds of years, explaining the superior resistance of BCTZ to fatigue Fan et al. (2018).
In order to explain the fact that during long aging (here 6 years) does not continue increasing and saturate, but actually decreases, the interaction between V and DW has been considered in detail. It is shown that the stable linear V–Ti–V pairs along the polarization direction cannot optimize their position with respect to the DW plane. Therefore, over a long time scale, the V initially in stable pairs, dissociate in order to decorate the DW, increasing doping and lowering .
Acknowledgments
This work has been partially funded by the PRIN SELWA Project, Next Generation EU n. 20229PNWM7 and the São Paulo Research Foundation FAPESP, Brazil (Grant No. 2022/08030-5). FC and FC acknowledge the precious technical assistance of M.P. Latino (CNR-ISM).
References
- Genenko et al. (2015) Y. A. Genenko, J. Glaum, M. J. Hoffmann, and K. Albe, “Mechanisms of aging and fatigue in ferroelectrics,” Mater. Sci. Engin. B 192, 52 (2015).
- Tyunina (2020) M. Tyunina, “Oxygen Vacancies in Perovskite Oxide Piezoelectrics,” Materials 13, 5596 (2020).
- Chun et al. (2024) J. Chun, J. Heo, K. Lee, B. U. Ye, and B. S. K. S.-H. Yoon, “Thermal activation energy on electrical degradation process in BaTiO3 based multilayer ceramic capacitors for lifetime reliability,” Sci. Rep. 14, 616 (2024).
- Opitz et al. (2003) M. R. Opitz, K. Albertsen, J. J. Beeson, D. F. Hennings, J. L. Routbort, and C. A. Randall, “Kinetic Process of Reoxidation of Base Metal Technology BaTiO3-Based Multilayer Capacitors,” J. Am. Ceram. Soc. 86, 1879 (2003).
- Zhang et al. (2024) F. Zhang, J. Tan, P. Wang, R. Huang, H.-T. Lin, X. Huang, J. Yang, Z. Fu, X. Cao, L. Zhang, S. Yu, and R. Sun, “Defect dipole engineering enhanced the dielectric performance and reliability of Mn-doped BaTiO3-based multilayer ceramic capacitor,” Ceram. Int. 50, 38263 (2024).
- Huangfu et al. (2024) G. Huangfu, J. Wang, H. Zhang, J. Chen, Z. Liu, and Y. Guo, “Deciphering the Effect of Defect Dipoles on the Polarization and Electrostrain Behavior in Perovskite Ferroelectrics,” Nano Lett. 24, 12148 (2024).
- Zheng et al. (2022) H. Zheng, E. Sun, X. Qi, B. Yang, R. Zhang, and W. Cao, “Temperature and frequency dependent defect dipole kinematics in "hard" piezoelectric ceramics,” Sens. Actuators A: Phys. 344, 113712 (2022).
- Souza (2015) R. A. D. Souza, “Oxygen Diffusion in SrTiO3 and Related Perovskite Oxides,” Adv. Func. Mater. 25, 6326 (2015).
- Chan et al. (1981) N. H. Chan, R. K. Sharma, and D. M. Smyth, “Nonstoichiometry in undoped BaTiO3,” J. Am. Ceram. Soc. 64, 556 (1981).
- Cordero (2007) F. Cordero, “Hopping and clustering of oxygen vacancies in SrTiO3 by anelastic relaxation,” Phys. Rev. B 76, 172106 (2007).
- Eom et al. (2017) K. Eom, E. Choi, M. Choi, S. Han, H. Zhou, and J. Lee, “Oxygen Vacancy Linear Clustering in a Perovskite Oxide,” J. Phys. Chem. Lett. 8, 3500 (2017).
- Hackmann and Kanert (1991) A. Hackmann and O. Kanert, “NMR investigation of defect properties in single crystal SrTiO3,” Radiation Effects and Defects in Solids 119, 651 (1991).
- Buzlukov et al. (2011) A. Buzlukov, A. Trokiner, V. Kozhevnikov, S. Verkhovskii, A. Yakubovsky, I. Leonidov, A. Gerashenko, A. Stepanov, and I. B. A. Tankeyev, “Vacancy ordering and oxygen dynamics in oxide ion conducting La1-xSrxGa1-xMgxO3-x ceramics: 71Ga, 25Mg and 17O NMR,” J. Solid State Chem. 184, 36 (2011).
- Eichel (2007) R. A. Eichel, “Defect structure of oxide ferroelectrics-valence state, site of incorporation, mechanisms of charge compensation and internal bias fields,” J. Electroceram. 19, 9 (2007).
- Tyunina and Savinov (2020) M. Tyunina and M. Savinov, “Charge transport in epitaxial barium titanate films,” Phys. Rev. B 101, 094106 (2020).
- Cordero et al. (2019) F. Cordero, F. Trequattrini, F. Craciun, H. T. Langhammer, D. A. B. Quiroga, and J. P. S. Silva, “Probing ferroelectricity in highly conducting materials through their elastic response: Persistence of ferroelectricity in metallic BaTiO3-δ,” Phys. Rev. B 99, 064106 (2019).
- Cordero et al. (2021) F. Cordero, F. Trequattrini, D. A. B. Quiroga, and P. S. S. Jr., “Hopping and clustering of oxygen vacancies in BaTiO3-δ and the influence of the off-centred Ti atoms,” J. Alloys Compd. 874, 159753 (2021).
- Cordero et al. (2023) F. Cordero, F. Trequattrini, P. S. da Silva, Jr., M. Venet, O. Aktas, and E. K. H. Salje, “Elastic precursor effects during Ba1-xSrxTiO3 ferroelastic phase transitions,” Phys. Rev. Research 5, 013121 (2023).
- Cordero et al. (2009) F. Cordero, L. Dalla Bella, F. Corvasce, P. M. Latino, and A. Morbidini, “An insert for anelastic spectroscopy measurements from 80 K to 1100 K,” Meas. Sci. Technol. 20, 015702 (2009).
- Nowick and Berry (1972) A. S. Nowick and B. S. Berry, Anelastic Relaxation in Crystalline Solids (Academic Press, New York, 1972).
- Cordero (1993) F. Cordero, “Anelastic (dielectric) relaxation of point defects at any concentration, with blocking effects and formation of complexes,” Phys. Rev. B 47, 7674 (1993).
- Cannelli et al. (1994) G. Cannelli, R. Cantelli, F. Cordero, N. Piraccini, F. Trequattrini, and M. Ferretti, “Mobility and aggregation of oxygen in YBa2Cu3O6+x in the low- concentration limit,” Phys. Rev. B 50, 16679 (1994).
- Chandrasekaran et al. (2016) A. Chandrasekaran, X. K. Wei, L. Feigl, D. Damjanovic, N. Setter, and N. Marzari, “Asymmetric structure of 90∘ domain walls and interactions with defects in PbTiO3,” Phys. Rev. B 93, 144102 (2016).
- Sun et al. (2005) D. Sun, X. Ren, and K. Otsuka, “Stabilization effect in ferroelectric materials during aging in ferroelectric state,” Appl. Phys. Lett. 87, 142903 (2005).
- Carl and Hardtl (1977) K. Carl and K. H. Hardtl, “Electrical after-effects in Pb(Ti, Zr)O3ceramics,” Ferroelectrics 17, 473 (1977).
- Ren (2004) X. Ren, “Large electric-field-induced strain in ferroelectric crystals by point-defect-mediated reversible domain switching,” Nat. Mater. 3, 91 (2004).
- Granhed et al. (2019) E. J. Granhed, A. Lindman, C. Eklöf-Österberg, M. Karlsson, S. F. Parker, and G. Wahnström, “Band vs. polaron: vibrational motion and chemical expansion of hydride ions as signatures for the electronic character in oxyhydride barium titanate,” J. Mater. Chem. A 7, 16211 (2019).
- Nossa et al. (2015) J. F. Nossa, I. I. Naumov, and R. E. Cohen, “Effects of manganese addition on the electronic structure of BaTiO3,” Phys. Rev. B 91, 214105 (2015).
- Shimada et al. (2013) T. Shimada, T. Ueda, J. Wang, and T. Kitamura, “Hybrid Hartree-Fock density functional study of charged point defects in ferroelectric PbTiO3,” Phys. Rev. B 87, 174111 (2013).
- Yao and Fu (2011) Y. Yao and H. Fu, “Charged vacancies in ferroelectric PbTiO3: Formation energies, optimal Fermi region, and influence on local polarization,” Phys. Rev. B 84, 064112 (2011).
- Xu et al. (2016) T. Xu, T. Shimada, Y. Araki, J. Wang, and T. Kitamura, “Multiferroic Domain Walls in Ferroelectric PbTiO3 with Oxygen Deficiency,” Nano Lett. 16, 454 (2016).
- Wang et al. (2019) X. Wang, T. Xu, F. Xuan, C. Chen, T. Shimada, and T. Kitamura, “Effect of the oxygen vacancy on the ferroelectricity of 90∘ domain wall structure in PbTiO3: A density functional theory study,” J. Appl. Phys. 126, 174107 (2019).
- Alahmed and Fu (2007) Z. Alahmed and H. X. Fu, “First-principles determination of chemical potentials and vacancy formation energies in PbTiO3 and BaTiO3,” Phys. Rev. B 76, 224101 (2007).
- Ahmad et al. (2007) M. M. Ahmad, K. Yamada, P. Meuffels, and R. Waser, “Aging-induced dielectric relaxation in barium titanate ceramics,” Appl. Phys. Lett. 90, 112902 (2007).
- Lee et al. (2007) S. Lee, Z.-K. Liu, M.-H. Kim, and C. A. Randall, “Influence of nonstoichiometry on ferroelectric phase transition in BaTiO3,” J. Appl. Phys. 101, 054119 (2007).
- Lemanov et al. (1996) V. V. Lemanov, E. P. Smirnova, P. P. Syrnikov, and E. A. Tarakanov, “Phase transitions and glasslike behavior in Sr1-xBaxTiO3,” Phys. Rev. B 54, 3151 (1996).
- Cordero et al. (2016) F. Cordero, F. Craciun, F. Trequattrini, and C. Galassi, “Piezoelectric softening in ferroelectrics: ferroelectric versus antiferroelectric PbZr1-xTixO3,” Phys. Rev. B 93, 174111 (2016).
- Ondrejkovic et al. (2013) P. Ondrejkovic, P. Marton, M. Guennou, N. Setter, and J. Hlinka, “Piezoelectric properties of twinned ferroelectric perovskites with head-to-head and tail-to-tail domain walls,” Phys. Rev. B 88, 024114 (2013).
- Sluka et al. (2012) T. Sluka, A. K. Tagantsev, D. Damjanovic, M. Gureev, and N. Setter, “Enhanced electromechanical response of ferroelectrics due to charged domain walls,” Nat. Commun. 4, 1751 (2012).
- Petralanda et al. (2021) U. Petralanda, M. Kruse, H. Simons, and T. Olsen, “Oxygen Vacancies Nucleate Charged Domain Walls in Ferroelectrics,” Phys. Rev. Lett. 127, 117601 (2021).
- Hong et al. (2008) L. Hong, A. K. Soh, Q. G. Du, and J. Y. Li, “Interaction of o vacancies and domain structures in single crystal BaTiO3: Two-dimensional ferroelectric model,” Phys. Rev. B 77, 094104 (2008).
- Chandrasekaran et al. (2013) A. Chandrasekaran, D. Damjanovic, N. Setter, and N. Marzari, “Defect ordering and defect-domain-wall interactions in PbTiO3: A first-principles study,” Phys. Rev. B 88, 214116 (2013).
- He and Vanderbilt (2003) L. He and D. Vanderbilt, “First-principles study of oxygen-vacancy pinning of domain walls in PbTiO3,” Phys. Rev. B 68, 134103 (2003).
- Samanta et al. (2021) A. Samanta, S. Yadav, Z. Gu, C. G. Meyers, L. Wu, D. Chen, S. Pandya, R. A. York, L. W. Martin, J. E. Spanier, and I. Grinberg, “A Predictive Theory for Domain Walls in Oxide Ferroelectrics Based on Interatomic Interactions and its Implications for Collective Material Properties,” Adv. Mater. 34, 2106021 (2021).
- Fan et al. (2018) Z. Fan, J. Koruza, J. Rödel, and X. Tan, “An ideal amplitude window against electric fatigue in BaTiO3-based lead-free piezoelectric materials,” Acta Mater. 151, 253 (2018).
- Zhang et al. (2015) Y. Zhang, J. Glaum, M. C. Ehmke, K. J. Bowman, J. E. Blendell, and M. J. Hoffman, “The ageing and de-ageing behaviour of (Ba0.85Ca0.15)(Ti0.9ZrO3 lead-free piezoelectric ceramics,” J. Appl. Phys. 118, 124108 (2015).